542 Technical Gazette 27, 2(2020), 542-549 ISSN 1330-3651 (Print), ISSN 1848-6339 (Online) https://doi.org/10.17559/TV-20180104121813 Original scientific paper Correlation between Mobility and Gross Domestic Product at Regional Level: Case Study of Primorje-Gorski Kotar County, Croatia Ljudevit KRPAN, Svjetlana HESS, Hrvoje BARIČEVIĆ Abstract: The knowledge about the volume and structure of the transport demand and the possibility of good forecasting represents one of the basic assumptions for successful implementation of the transport policy measures. Studying the variation of the basic macroeconomic indicators and the level of mobility is one of the steps in this direction. The paper analyses the interrelations of the movements of the basic economic indicators and the usage of passenger cars in the area of the Primorje-Gorski Kotar County (especially the city of Rijeka). The study results can be used as a signpost to traffic planners in preparing the traffic plans, as well as to the executive authorities while planning the development of their region i.e. introducing of traffic measures in local and regional environments. Keywords: level of mobility; macroeconomic indicator; traffic demand; traffic policy 1 INTRODUCTION Modern world research emphasises the correlation between the movement of economic development level of an area and the level of using motor vehicles. In other words, the economic power affects directly the decision on the movement and the selection of the transport mode for the arrival to the desired destination. The purpose of the paper is to use empirical analysis to prove the correlation between the economic trends and the usage of motor vehicles on the regional and local level. The aim of the paper is to use practical research to confirm the correlation between relative movement of the basic economic indicators of the development of a certain area and the level of using motor vehicles. In order to meet the set aim the tendency is to prove that the trend of the main macroeconomic indicators, such as gross domestic product, gross domestic product per capita, employment rate and unemployment rate, as well as the average income of the employed population, are in direct correlation with the trend of owning and using motor vehicles. The level of economic development of the Primorje-Gorski Kotar County (PGKC) causes linear correlation in the movement of macro-economic indicators and the level of mobility, thus confirming that, although being the most developed county in the Republic of Croatia, at the European level it belongs to the medium-developed regions. Further in the text, secondary publications with data on the previously carried out similar studies are analysed. Then a frame of the carried out research is presented in the sense of describing the variables that are analysed. A detailed basis for the implementation of applicative part of research is given, so that eventually the collected data are processed and analysed through correlation and regression methods. In conclusion, a critical review on the obtained study results is given, indicating the limitations and peculiarities of its implementation. 2 ANALYSIS OF PAST STUDIES ON THE CORRELATION BETWEEN GROSS DOMESTIC PRODUCT AND MOBILITY A valuable basis for determining the correlation between economic development and the degree of mobility (number of motor vehicles per 1000 inhabitants) is given by Dargay from the Institute for Transport Studies at Leeds [1]. The research was carried out on 45 countries. It is limited to data about the demographic factors such as the population density and the proportion of urban population. The impact of the development of a higher quality public passenger transport has not been taken into account, which is conditioned by very high population density in the most urbanized areas. The basis for the calculation was the level of motorization of 850 vehicles per 1000 inhabitants. It has been found that the motorization level does not feature equal trend during economic growth in relation to the economic decline. Thus, regarding economic trends an asymmetric curve of the movement of mobility level was found (especially in the developing countries). It has been proven that the correlation between economic development and the level of motorization is not linear. Namely, the level of motorization increases relatively slowly in poorly developed economies, then twice as fast in case of economic growth in medium developed economies (3000 - 10 000 USDpc ). Finally, it slows down to a relative linear growth with the growth of the economy in highly developed economies before reaching the level of motorization according to the highest levels of income i.e. reaching the maximal level of vehicle saturation. It has been additionally determined that the rate of the motorization level slows down with the increase in the density of population. The correlation has been presented through the use of the function of S form, of Gompertz function. One has to recognize the fact that in the highly developed economies there is a trend of stopping and even reducing the passenger / kilometre in relation to the economic degree of development [2]. Analysing the aggregate indicators of demands for passenger transport it has been determined that there is a number of influencing factors. The most important ones that can be highlighted include: age and gender of the population, household incomes, saturation level of car ownership, employment, education, passenger car availability, place of residence and work, public transport access, level of immigration, etc. Aggregate usage of cars results from locations and selection of trips by various users. This selection depends on the preferences, incomes and prices of different
Transcript
542 Technical Gazette 27, 2(2020), 542-549
ISSN 1330-3651 (Print), ISSN 1848-6339 (Online) https://doi.org/10.17559/TV-20180104121813 Original scientific paper
Correlation between Mobility and Gross Domestic Product at Regional Level: Case Study of Primorje-Gorski Kotar County, Croatia
Ljudevit KRPAN, Svjetlana HESS, Hrvoje BARIČEVIĆ
Abstract: The knowledge about the volume and structure of the transport demand and the possibility of good forecasting represents one of the basic assumptions for successful implementation of the transport policy measures. Studying the variation of the basic macroeconomic indicators and the level of mobility is one of the steps in this direction. The paper analyses the interrelations of the movements of the basic economic indicators and the usage of passenger cars in the area of the Primorje-Gorski Kotar County (especially the city of Rijeka). The study results can be used as a signpost to traffic planners in preparing the traffic plans, as well as to the executive authorities while planning the development of their region i.e. introducing of traffic measures in local and regional environments. Keywords: level of mobility; macroeconomic indicator; traffic demand; traffic policy
1 INTRODUCTION
Modern world research emphasises the correlation between the movement of economic development level of an area and the level of using motor vehicles. In other words, the economic power affects directly the decision on the movement and the selection of the transport mode for the arrival to the desired destination.
The purpose of the paper is to use empirical analysis to prove the correlation between the economic trends and the usage of motor vehicles on the regional and local level.
The aim of the paper is to use practical research to confirm the correlation between relative movement of the basic economic indicators of the development of a certain area and the level of using motor vehicles. In order to meet the set aim the tendency is to prove that the trend of the main macroeconomic indicators, such as gross domestic product, gross domestic product per capita, employment rate and unemployment rate, as well as the average income of the employed population, are in direct correlation with the trend of owning and using motor vehicles. The level of economic development of the Primorje-Gorski Kotar County (PGKC) causes linear correlation in the movement of macro-economic indicators and the level of mobility, thus confirming that, although being the most developed county in the Republic of Croatia, at the European level it belongs to the medium-developed regions.
Further in the text, secondary publications with data on the previously carried out similar studies are analysed. Then a frame of the carried out research is presented in the sense of describing the variables that are analysed. A detailed basis for the implementation of applicative part of research is given, so that eventually the collected data are processed and analysed through correlation and regression methods. In conclusion, a critical review on the obtained study results is given, indicating the limitations and peculiarities of its implementation. 2 ANALYSIS OF PAST STUDIES ON THE CORRELATION
BETWEEN GROSS DOMESTIC PRODUCT AND MOBILITY
A valuable basis for determining the correlation
between economic development and the degree of mobility
(number of motor vehicles per 1000 inhabitants) is given by Dargay from the Institute for Transport Studies at Leeds [1]. The research was carried out on 45 countries. It is limited to data about the demographic factors such as the population density and the proportion of urban population. The impact of the development of a higher quality public passenger transport has not been taken into account, which is conditioned by very high population density in the most urbanized areas. The basis for the calculation was the level of motorization of 850 vehicles per 1000 inhabitants. It has been found that the motorization level does not feature equal trend during economic growth in relation to the economic decline. Thus, regarding economic trends an asymmetric curve of the movement of mobility level was found (especially in the developing countries). It has been proven that the correlation between economic development and the level of motorization is not linear. Namely, the level of motorization increases relatively slowly in poorly developed economies, then twice as fast in case of economic growth in medium developed economies (3000 - 10 000 USDpc). Finally, it slows down to a relative linear growth with the growth of the economy in highly developed economies before reaching the level of motorization according to the highest levels of income i.e. reaching the maximal level of vehicle saturation. It has been additionally determined that the rate of the motorization level slows down with the increase in the density of population. The correlation has been presented through the use of the function of S form, of Gompertz function.
One has to recognize the fact that in the highly developed economies there is a trend of stopping and even reducing the passenger / kilometre in relation to the economic degree of development [2]. Analysing the aggregate indicators of demands for passenger transport it has been determined that there is a number of influencing factors. The most important ones that can be highlighted include: age and gender of the population, household incomes, saturation level of car ownership, employment, education, passenger car availability, place of residence and work, public transport access, level of immigration, etc. Aggregate usage of cars results from locations and selection of trips by various users. This selection depends on the preferences, incomes and prices of different
Ljudevit KRPAN et al.: Correlation of Mobility and Gross Domestic Product at Regional Level: Case Study of Primorje-Gorski Kotar County, Croatia
Tehnički vjesnik 27, 2(2020), 542-549 543
transport modes. The preferences here are subject to change since the citizens of urban areas prefer more public transport than the citizens in rural areas. The increase of incomes at aggregate level cannot be determined easily due to big inequalities. The prices depend partly on the market, and partly on the measures of the traffic policy. The aging and reaching of the high level of saturation of the passenger car usage in the developed countries result in reduced need for their usage. In medium developed countries, where no strict measures of traffic policy have been introduced yet, which destimulates the usage of cars, the growing trend of GDP is directly linked to the growing trend of using passenger cars. According to [2] it was determined that aggregate projections of using passenger cars based on the GDP trend and the price of oil derivatives can lead to wrong conclusions.
In [3] the growth correlation of GDP in urban areas and the level of using cars are analysed. The lagging behind of the personal mobility has been proven in comparison to the economic growth of the developed urban areas, especially measured in passenger / kilometre which has been proven on the national level as well. The dynamics of deceleration of the growth is more significant for urban areas of Europe, Canada and Asia in relation to the US and Australian cities.
The paper Correlation between Transport Intensity and GDP in European Regions: a New Approach [4] analyses the correlation between heavy road transport and GDP. The correlation between transport of goods and economic flows has been proven. However, it has been additionally emphasised that there is more direct connection of industrial production and the growth of the transport of goods. It has been additionally emphasised that transit flows as such have not been generated by economic flows but rather and first of all by the geographic location of the regions. The carried out research has analysed different data such as ton kilometres, number of trips, trip distance. As well as in passenger transport a direct correlation between the transport of goods and the economic development is partly slowed down due to the introduced measures of traffic policy in certain regions. The correlation analysis has been implemented by using the Pearsons product-momentum correlation coefficient (for which a linear correlation of transport and GDP has been assumed).
Analysing the correlation between GDP and travel car km on the example of 42 world metropolis Kenworth [3] decomposes the generated passenger trips per one GDP unit. He creates thus the base for trip forecasts regarding the expected GDP growth in the developed urban environments using cross-sector analysis for two time sections (the years 1995 / 96 and 2005 / 06). Significant differences in the travelling habits have been determined, depending on the observed continent. Travelling according to the unit growth of GDP generated in the USA and Australia show a double trend in relation to the generated trips of the European cities. The recognized phenomenon “Peak car use” represents a derivative of the combination of different factors related to the education degree, age structure, level of economic development, increase of the urban population density, and modernisation of public urban transport of passengers. It has been additionally emphasised that when analysing GDPpc and travelling car km in 58 most developed cities (over 10 000 USDpc) the
correlation does not exist or it is very weak, whereas for 26 less developed cities a significant correlation has been determined with the increase in the usage of cars with the growth of GDPpc. In order to determine the redistribution of travelling the usage of mopeds, public urban transport and cars (total motorized trips) has been analysed and then reduced to a unit GDPpc.
In his work Wu [5] confirms the saturation of the motorization level in the USA of 800 vehicles per 1000 inhabitants, and in Japan of 590 vehicles per 1000 inhabitants. Here it is stated that the European countries regarding their different level of development feature different levels of motorization.
The significance and influence of the potential increase of using motor vehicles in urban environments has been additionally strengthened by the fact that they account for more than 60% [6] of totally travelled passenger kilometres. Special emphasis is on the interrelation of the organization of spatial contents and generation of the needs for movement, which has been pointed out as an important factor of traffic demand generation which has to be taken into consideration. As the main categories of urban travelling, the public, non-motorized and private motorized transport have been recognised. The average share of public transport according to estimates is about 16%.
Based on the carried out research in [7, 8] it has been determined that the correlation between the travelled passenger kilometres and GDPpc is significantly affected by other factors such as the demographic flows, number of employees, price of fuel, productivity, etc. By using the econometric models it has been determined that the generation of trip kilometres is more strongly determined GDPpc over a shorter than in the longer period. The change of 1% of travel kilometres per capita results in 0,9% by changing GDPpc if a two-year period is considered, i.e. 0,46% if a 20-year period is considered.
Previous considerations of the available secondary publications have been taken into consideration when setting the frame and collecting statistical data for this research. 3 FRAME OF THE CARRIED OUT RESEARCH
In order to confirm the correlation between the economic development of a certain area and the usage of motor vehicles, an analysis of the available scientific and professional literature was carried out. By analysing the secondary publications a frame was determined for the research and its potential results.
Regarding the availability of data, as well as the existing literature that deals with the topic of vehicle traffic, for the needs of this paper the variables have been selected whose name and description are given in Tab. 1. The analysis used the annual data collected for the period from 2000 to 2015. The statistical data were analysed and processed using Microsoft Excel, and additionally checked in the software Statistica, SPSS and GeoGebra.
In the carried out study of data of the abovementioned variables the correlation analysis method and regression analysis will be applied. The correlation analysis indicates to which extent the two variables are related, i.e. whether the change in one variable follows the change in another variable. Numerical indicators of intensity and direction
Ljudevit KRPAN et al.: Correlation of Mobility and Gross Domestic Product at Regional Level: Case Study of Primorje-Gorski Kotar County, Croatia
544 Technical Gazette 27, 2(2020), 542-549
between the variables, correlation coefficient (r) determines the intensity and direction of the relationship between the two variables. Regression analysis is used to develop the analytical expression or the algebraic model that best describes the relation between the observed variables.
Table 1 Name and description of variables included in the analysis Symbol
of variable
Dependent variables
Y1 Average number of vehicles entering the city of Rijeka Y2 Number of registered vehicles in Rijeka Y3 Number of registered vehicles in PGKC
Y4 Dynamics of carried passengers on regular lines TD Autotrolej
Independent variables
X1 Average annually employed in PGKC X12 2903 to Gerovo
X2 Average annually unemployed in PGKC X13 3010 Vrbovsko-Gomirje
X8 Registered passenger cars in PGKC X19 Motorisation level in RH
X9 Registered passenger cars in Rijeka X20
GDPpc in PGKC (thou. EUR)
X10 2801 SB Pasjak X21 Number of parking places in Rijeka
X11 2923 Crikvenica X22 Number of charged tickets on Delta
4 APPLICATION OF THE PROMETHEE METHOD IN THE PROCESS OF ROUTE SELECTION: JELŠANE - POSTOJNA HIGHWAY
Special attention in this part of the paper is paid to the
analysis of available macroeconomic indicator. Apart from the gross domestic product and gross domestic product per inhabitant also the share (absolute and relative) of the employed and unemployed is analysed, as well as the movement of the average amount of net personal incomes per citizen at the level of the Primorje-Gorski Kotar County (PGKC) and the Republic of Croatia, as well as the movement of the price of oil derivatives at the level of the Republic of Croatia (Tab. 2).
It should be emphasised that no decomposition of the gross domestic product (GDP) has been done, but rather it has been used in the analysis as a composite indicator. Furthermore, in the carried out research the movements of the inflation rate have not been analysed separately. The period from 2003 to 2015 has been observed as the reference period of the analysis. The macroeconomic data have been taken over from the statistical yearbooks of the National Bureau of Statistics of the Republic of Croatia as well as the data from the Croatian Employment Office. As a challenge in the implementation of research there is the fact that the National Bureau of Statistics of the Republic of Croatia does not process a majority of data at the level of the counties and local self-government units. The need for special processing and collection of data can be one of the important restrictions in objective consideration of this as well as of all the other problems, that, as one of the analysed variables has macroeconomic data of the regional and local levels.
Table 2 Movement trends of macroeconomic indicators at PGKC level
Source: National Bureau of Statistics, Croatian Employment Office, Ministry of the Croatian Economy, processed by the author
By comparing the price of oil derivatives in the same period it was determined that the price of EUROSUPER 98 rose from 7,72 kn/l to 10,64 kn/l in 2014. This means a total price increase of 37,82%. An increase in the number of the employed was determined until 2007 and since then there has been a decline in the number of the employed of about 3% on the average every year. It was also determined that the total GDP of the Primorje-Gorski Kotar County amounted to 3,87 billion EUR i.e. 12,930 EUR per inhabitant in 2012. One of the biggest restrictions for carrying out the research is the processing of data about GDP which are published at the level of the counties with a delay of three years.
5 MOTORIZATION LEVEL AND MOBILITY ON THE ROADS OF THE PRIMORJE-GORSKI KOTAR COUNTY
For the needs of the research the data about the average
annual daily traffic of the vehicles in the area of PGKC have been analysed. The available data have been used from the publications of the Croatian Roads and collected from the system of the Automated Traffic Management in the City of Rijeka that has been in operative function since 2003. The trend of the number of registered motor vehicles in the region of the City of Rijeka and Primorje-Gorski Kotar County has been additionally analysed with special
Ljudevit KRPAN et al.: Correlation of Mobility and Gross Domestic Product at Regional Level: Case Study of Primorje-Gorski Kotar County, Croatia
Tehnički vjesnik 27, 2(2020), 542-549 545
focus on the trend of the number of passenger vehicles (Tab. 3).
In order to draw relevant conclusions the trends about the number of the users of public passenger transport on urban and county lines (especially those that gravitate to the City of Rijeka) have been analysed. The number of the
paid-for tickets in relation to the subsidised tickets has been specially analysed as well as the structure of the trends regarding the traffic zone i.e. directions of passenger movements. Also, the usage of parking places in the parking payment system in the centre of the City of Rijeka has been analysed.
Figure 1 Trends of the number of vehicles on state roads and those entering the centre of the city of Rijeka
Source: Hrvatske ceste, processed by the author
Figure 2 Trends of the number of registered vehicles and users of urban public passenger transport Source: MUP PU Primorsko-goranska, Autotrolej, Rijekapromet d.d., processed by the author
For the needs of the research and with the aim of
determining the objective indicators which can be used to determine certain trends, also the circumstances related to certain annual data have been analysed. The analysis of public transport considers here the introduction of new lines or new, more comfortable transport means i.e. new products for the users thus stimulating the usage of public urban passenger transport. In the analysis of the parking spaces, special attention has been paid to the analysis of the availability of parking capacities on the observed area (new garages and parking spaces) as well as the implementation
of the parking policy measures (price of privileged and daily tickets and parking hour as well as zoning related to price). In conclusion, special attention was paid to the analysis of the newly built and significantly restructured road network, since it directly and fully affects the data on the trends and their volume.
For the analysis itself the data about the completion of the construction of the full profile of the motorway Rijeka–Zagreb (2008) were of special significance. An especially significant phase is the construction and opening of the southern traffic lane of the Rijeka bypass from Diračje to
Ljudevit KRPAN et al.: Correlation of Mobility and Gross Domestic Product at Regional Level: Case Study of Primorje-Gorski Kotar County, Croatia
546 Technical Gazette 27, 2(2020), 542-549
Sveti Kuzam with the associated node Rujevica (2007 - 2009), construction of the approach road from the Vežice node to the centre of the City of Rijeka - D404 (2011). The construction of the southern roadway of the Rijeka bypass is especially significant due to redirection of the transit traffic through the city centre at the time of construction (since it was occasionally closed to traffic). Significant change for the structure and direction of traffic flows can be also the upgrade and additional exit from the node Orehovica in the year 2016. Other changes are significant because of the need of objective and relevant analysis of the PGDP data and determining of the raster of counting points that will be included in the study under the assumption that these changes did not cause any significant influence.
Therefore, only the available data have been analysed on the corridor routes that were estimated to be inter-comparable and valid for the analysis in the observed period of time. As a rule these are the cordon positions of the counters, counting points on roads on the islands, Liburnian area and the area of Crikvenica and Vinodol, branches of state roads towards Ogulin and Čabar as well as the data about the number of vehicles at toll booths of the Ri - Zg motorway, and the entry into the Republic of Croatia at the border crossing Pasjak. Thus, the tendency
was to analyse the valid data for drawing appropriate conclusions, which are not subject to changes in content and structure of the new traffic network organised during the research period.
The collected data have shown that in the period from 2000 - 2008 there was an almost continuous growth of the number of registered motor vehicles at a rate of 3% annually. After that period there is a significant fall in the number of registered motor vehicles. There was almost a linear trend in the flow of average annual number of vehicles travelling in the area of PGKC and especially through the centre of the city of Rijeka. By comparing the obtained data, it was determined that the level of motorization for the year 2001 in the area of PGKC was 417 vehicles per 1,000 inhabitants, that is, 409 vehicles per 1000 inhabitants for the region of the city of Rijeka. The saturation of the motorization level was changed in 2011, and for the area of PGKC it amounted to 532 vehicles per 1000 inhabitants and in the city of Rijeka 536 vehicles per 1000 inhabitants. The time sections have been conditioned by the years in which the census was carried out. In relation to the available European and US literature one may conclude that this level of motorization is the one that characterizes poorly to medium developed countries.
Table 3 Number of registered motor vehicles in PGKC and Rijeka and the number of carried passengers
Source: MUP PU PGKC, Hrvatske ceste, Autotrolej d.o.o., Rijekapromet d.d., processed by the authors 6 DATA PROCESSING AND ANALYSIS OF RESEARCH
RESULTS
Knowing the volume and structure of the traffic demand and the possibility of its higher quality forecasting represents one of the basic assumptions for successful implementation of the traffic policy measures. The study of variations of the basic macro-economic indicators and the level of mobility is one of the steps in that direction. The study was carried out as an analysis of interdependence of macroeconomic indicators with the level of motorization and mobility on the regional level taking as an example the Primorsko-Gorski Kotar County, and particularly the City of Rijeka. The research was done on the correlation of all macroeconomic indicators with all traffic indicators, and of all traffic indicators with each other.
The time series analysis is one of the most frequently applied quantitative methods. In forecasting of a phenomenon using the time series analysis, it is assumed
that this phenomenon will be carried out in the future using equal or approximately equal dynamics as in the previous period. Next is the analysis and assessment of the movement of the number of passenger cars entering Rijeka in the period from 2003 and 2015, presented in Fig. 3.
Based on the graphical presentation it may be concluded that there is a tendency of the vehicles entering Rijeka according to usual forecasting trends. The obtained grades of representativeness of the studied trends are for all four most usual forms of trends similar, and the percentages of the periodic changes in the number of vehicles which is explained by the trend-model amount to about 72%.
During the research the fact has been accepted, which has been determined from the available secondary publications, that the correlation between the motorization level and the economic development is not linear. The level of motorization grows at different trends in the poorly developed, medium developed and highly developed economies. However, it has been accepted that if the
Ljudevit KRPAN et al.: Correlation of Mobility and Gross Domestic Product at Regional Level: Case Study of Primorje-Gorski Kotar County, Croatia
Tehnički vjesnik 27, 2(2020), 542-549 547
correlation of the economic development and the level of motorization within the frame of one development cycle, as is the case in the Primorska-Gorski Kotar County is analysed, a high level of linearity may be developed.
Therefore, an analysis of the correlation among the variables has been carried out, and the Pearson correlation coefficient was used to determine the connection of these variables.
Figure 3 Average number of vehicles entering Rijeka and functions of the trend
Figure 4 Simple regression analysis of GDPpc movement in PGKC and the number of registered motor vehicles in Rijeka for 2001.-2011.
Previously, in order to determine the level of deviation
of some variables from the normal distribution, a Kolmogorov-Smirnov test (K-S test) was carried out. Here, if p<0.05 it is concluded that the result of K-S test is statistically important, i.e. that the observed distribution of the results deviates from the normal distribution of the results. The distributions for which it has been determined that they deviate significantly from the normal one are: − X2 - average annually unemployed in PGKC, − Y3 - number of registered vehicles in PGKC, − Y4 - dynamics of carried passengers on regular lines TD Autotrolej, and − data on the count of vehicles at counting points (X11 - 2923 Crikvenica, X13 - 3010 Vrbovsko-Gomirje, X14 - 2814 Liburnija, and X18 - 2915 node Vrata - node Oštrovica).
The carried out method of regression analysis has shown that there is no statistically significant dependence of GDPpc in PGKC and the number of vehicles entering Rijeka nor between the number of registered vehicles in Rijeka (all with RI plates, or those that have been registered in the City area) with the number of vehicles entering Rijeka. However, there is statistically significant dependence of the GDPpc trend in PGKC and the number of registered motor vehicles in Rijeka for the period from 2001 - 2011 (Fig. 4), whereas the dependence for the same
variables was significantly smaller for the period 2000 - 2015.
The correlation coefficients between the variable whose changes are studied (average number of passenger cars entering Rijeka, the number of registered vehicles in Rijeka, number of registered vehicles in PGKC, and the number of carried passengers on the Autotrolej lines) and the variables which are assumed that they could have influence on them (see Tab. 1), using in the analysis the data from the period 2003 to 2015.
Regarding the correlation coefficients in Tab. 4 there is a strong correlation between: − the number of vehicles entering Rijeka with: price of Eurosuper 98 (negative) and traffic of vehicles at counting points 3010 Vrbovsko-Gomirje and 4001 Cres, − the number of registered vehicles in Rijeka with: average annually employed in PGKC, unemployment rate in RH (negative), registered passenger cars in Rijeka and 3010 Vrbovsko-Gomirje, − the number of registered vehicles in PGKC with: registered passenger cars in PGKC and 2915 (node Vrata - node Oštrovica), − carried passengers of Autotrolej with: price of Eurosuper 98, 3010 Vrbovsko-Gomirje (negative) and 4001 Cres.
Ljudevit KRPAN et al.: Correlation of Mobility and Gross Domestic Product at Regional Level: Case Study of Primorje-Gorski Kotar County, Croatia
548 Technical Gazette 27, 2(2020), 542-549
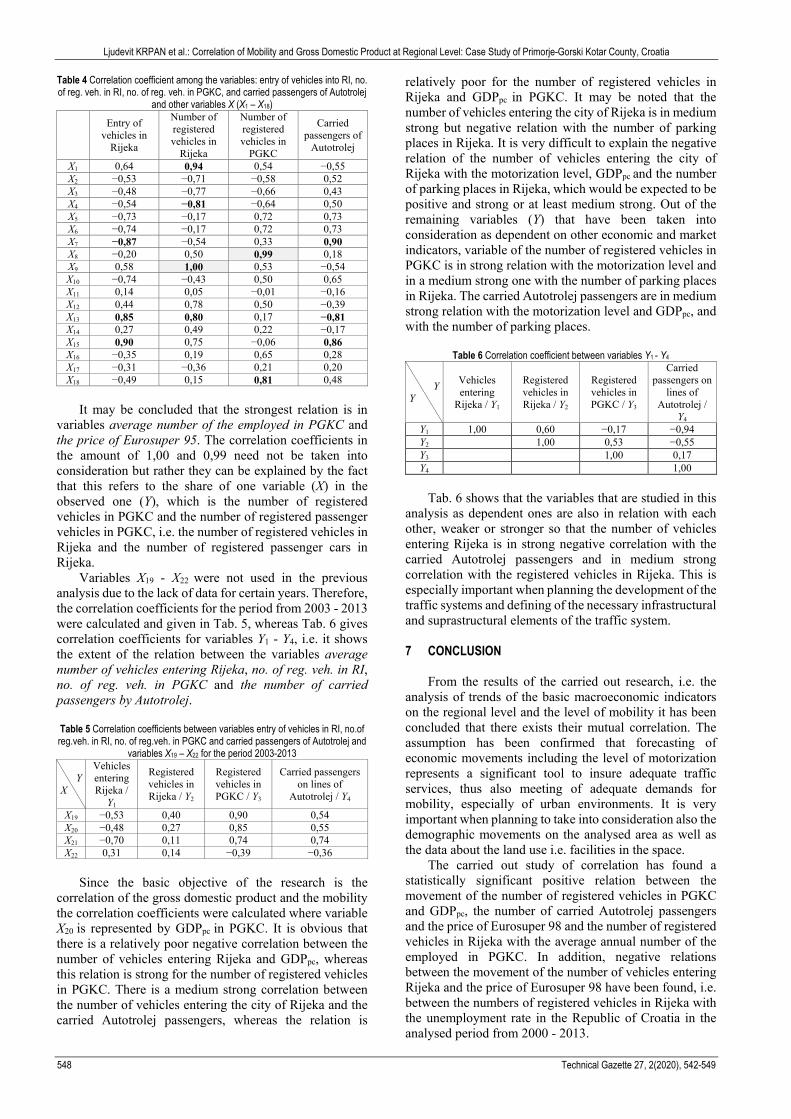
Table 4 Correlation coefficient among the variables: entry of vehicles into RI, no. of reg. veh. in RI, no. of reg. veh. in PGKC, and carried passengers of Autotrolej
It may be concluded that the strongest relation is in
variables average number of the employed in PGKC and the price of Eurosuper 95. The correlation coefficients in the amount of 1,00 and 0,99 need not be taken into consideration but rather they can be explained by the fact that this refers to the share of one variable (X) in the observed one (Y), which is the number of registered vehicles in PGKC and the number of registered passenger vehicles in PGKC, i.e. the number of registered vehicles in Rijeka and the number of registered passenger cars in Rijeka.
Variables X19 - X22 were not used in the previous analysis due to the lack of data for certain years. Therefore, the correlation coefficients for the period from 2003 - 2013 were calculated and given in Tab. 5, whereas Tab. 6 gives correlation coefficients for variables Y1 - Y4, i.e. it shows the extent of the relation between the variables average number of vehicles entering Rijeka, no. of reg. veh. in RI, no. of reg. veh. in PGKC and the number of carried passengers by Autotrolej. Table 5 Correlation coefficients between variables entry of vehicles in RI, no.of reg.veh. in RI, no. of reg.veh. in PGKC and carried passengers of Autotrolej and
correlation of the gross domestic product and the mobility the correlation coefficients were calculated where variable X20 is represented by GDPpc in PGKC. It is obvious that there is a relatively poor negative correlation between the number of vehicles entering Rijeka and GDPpc, whereas this relation is strong for the number of registered vehicles in PGKC. There is a medium strong correlation between the number of vehicles entering the city of Rijeka and the carried Autotrolej passengers, whereas the relation is
relatively poor for the number of registered vehicles in Rijeka and GDPpc in PGKC. It may be noted that the number of vehicles entering the city of Rijeka is in medium strong but negative relation with the number of parking places in Rijeka. It is very difficult to explain the negative relation of the number of vehicles entering the city of Rijeka with the motorization level, GDPpc and the number of parking places in Rijeka, which would be expected to be positive and strong or at least medium strong. Out of the remaining variables (Y) that have been taken into consideration as dependent on other economic and market indicators, variable of the number of registered vehicles in PGKC is in strong relation with the motorization level and in a medium strong one with the number of parking places in Rijeka. The carried Autotrolej passengers are in medium strong relation with the motorization level and GDPpc, and with the number of parking places.
Table 6 Correlation coefficient between variables Y1 - Y4
Tab. 6 shows that the variables that are studied in this
analysis as dependent ones are also in relation with each other, weaker or stronger so that the number of vehicles entering Rijeka is in strong negative correlation with the carried Autotrolej passengers and in medium strong correlation with the registered vehicles in Rijeka. This is especially important when planning the development of the traffic systems and defining of the necessary infrastructural and suprastructural elements of the traffic system. 7 CONCLUSION
From the results of the carried out research, i.e. the analysis of trends of the basic macroeconomic indicators on the regional level and the level of mobility it has been concluded that there exists their mutual correlation. The assumption has been confirmed that forecasting of economic movements including the level of motorization represents a significant tool to insure adequate traffic services, thus also meeting of adequate demands for mobility, especially of urban environments. It is very important when planning to take into consideration also the demographic movements on the analysed area as well as the data about the land use i.e. facilities in the space.
The carried out study of correlation has found a statistically significant positive relation between the movement of the number of registered vehicles in PGKC and GDPpc, the number of carried Autotrolej passengers and the price of Eurosuper 98 and the number of registered vehicles in Rijeka with the average annual number of the employed in PGKC. In addition, negative relations between the movement of the number of vehicles entering Rijeka and the price of Eurosuper 98 have been found, i.e. between the numbers of registered vehicles in Rijeka with the unemployment rate in the Republic of Croatia in the analysed period from 2000 - 2013.
Ljudevit KRPAN et al.: Correlation of Mobility and Gross Domestic Product at Regional Level: Case Study of Primorje-Gorski Kotar County, Croatia
Tehnički vjesnik 27, 2(2020), 542-549 549
Following the analysed world experiences and the carried out empirical research it may be concluded that the trend of the basic macroeconomic indicators, such as gross domestic product, gross domestic product per capita, employment rate and unemployment rate as well as the average income of the employed population are in direct correlation with the trend of ownership and usage of motor vehicles. The research results in this paper have shown that the level of economic development of the Primorje-Gorski Kotar County affects the linear correlation of the macroeconomic indicators and the level of mobility. This confirms that, although the most developed county in the Republic of Croatia, at the European level it belongs to the medium developed regions. 8 REFERENCES [1] Dargay, J., Gately, D., & Sommer, M. (2007). Vehicle
Ownership and Income Growth. Worldwide, 1960-2030. https://doi.org/10.5547/ISSN0195-6574-EJ-Vol28-No4-7
[2] Van Dender, K. & Clever, M. (2013). Recent Trends in Car Usage in Advanced Economies-slower Growth Ahead?, ITF/OECD Roundtable on Long-run Trends in Car Use, International Transport Forum, Paris.
[3] Kenworthy, J. (2013). Decoupling Urban Car Use and Metropolitan GDP Growth. World Transport Policy and Practice. 19, 8-21.
[4] Garcia, C., et al. (2008). Correlation between Transport Intensity and GDP in European Regions: a New Approach. 8th Swiss Transport Research Conference. Ascona.
[5] Wu, T., Zhao, H., & Ou, X. (2014). Vehicle Ownership Analysis Based on GDP per Capita in China: 1963-2050. Sustainability. https://doi.org/10.3390/su6084877
[6] Rode, P., et al. (2014). Accessibility in Cities: Transport and Urban Form. LSE Cities, London School of Economy.
[7] Ecola, L. & Wachs, M. (2012). Exploring the Relationship between Travel Demand and Economic Growth. Federal Highway Administration.
[8] Grgurević, I., Stančić, A., & Slavulj, M. (2015). Identifying Relevant Factors of Applying Technologies in Dynamic Carpooling. Tehnički glasnik, 9, 337-344.
Contact information: Ljudevit Krpan, (Corresponding author) Primorje-Gorski kotar County, Rijeka, Croatia E-mail: [email protected] Svjetlana Hess, The Faculty of Maritime Studies of the University of Rijeka, Rijeka, Croatia Hrvoje Baričević, The Faculty of Maritime Studies of the University of Rijeka, Rijeka, Croatia