36
PSYC 3031 INTERMEDIATE STATISTICS LABORATORY J. Elder LAST UPDATED: October 4, 2012 CORRELATION
PSYC 3031 INTERMEDIATE STATISTICS LABORATORY J. Elder
LAST UPDATED: October 4, 2012
CORRELATION

Correlation
J. Elder PSYC 3031 INTERMEDIATE STATISTICS LABORATORY
2
Acknowledgements
¨ Some of these slides have been sourced or modified from slides created by A. Field for Discovering Statistics using R.
Correlation
J. Elder PSYC 3031 INTERMEDIATE STATISTICS LABORATORY
3
Outline
¨ Measuring relationships ¤ Scatterplots ¤ Covariance ¤ Pearson’s correlation coefficient
¨ Nonparametric measures ¤ Spearman’s rho ¤ Kendall’s tau
¨ Interpreting correlations ¤ Causality
¨ Partial correlations

Correlation
J. Elder PSYC 3031 INTERMEDIATE STATISTICS LABORATORY
4
Textbook Errata
¨ 6.5.1. As of Oct 4, 2012, the ggm package appears to be broken. ¤ As a substitute, we will use the ppcor package.
¨ 6.5.3 ¤ cor(examData, use = “complete.obs”, method = “pearson”)
should be ¤ cor(examData[,c(“Revise”, “Exam”, “Anxiety”)], use =
“complete.obs”, method = “pearson”) ¤ I’m not sure what “2 d.p. only” means in Table 6.2.
¨ 6.5.5 ¤ rcorr(liarMatrix)
should be ¤ rcorr(liarData$Position, liarData$Creativity, type = "spearman”)
Correlation
J. Elder PSYC 3031 INTERMEDIATE STATISTICS LABORATORY
5
Textbook Errata
¨ 6.6.2 ¤ We will use package ppcor instead of ggm. ¤ The implementation of ppcor has the format
n pcor(x, method = c("pearson", "kendall", "spearman"))

Correlation
J. Elder PSYC 3031 INTERMEDIATE STATISTICS LABORATORY
6
What is a Correlation?
¨ It is a way of measuring the extent to which two variables are related.
¨ It measures the pattern of responses across variables.

Correlation
J. Elder PSYC 3031 INTERMEDIATE STATISTICS LABORATORY
7
Weak Relationship
Slide 7 Age
10 20 30 40 50 60 70 80 90
App
reci
atio
n of
Dim
mu
Bor
gir
-20
0
20
40
60
80
100
120
140
160

Correlation
J. Elder PSYC 3031 INTERMEDIATE STATISTICS LABORATORY
8
Strong Positive Relationship
Slide 8
Age
10 20 30 40 50 60 70 80 90
App
reci
atio
n of
Dim
mu
Bor
gir
10
20
30
40
50
60
70
80
90

Correlation
J. Elder PSYC 3031 INTERMEDIATE STATISTICS LABORATORY
9
Strong Negative Relationship
Slide 9
Age
10 20 30 40 50 60 70 80 90
Appr
ecia
tion
of D
imm
u B
orgi
r
-20
0
20
40
60
80
100

Correlation
J. Elder PSYC 3031 INTERMEDIATE STATISTICS LABORATORY
10
Measuring Relationships
¨ We need to see whether as one variable increases, the other increases, decreases or stays the same.
¨ This can be done by calculating the covariance. ¤ We look at how much each score deviates from the
mean. ¤ If both variables deviate from the mean by the same
amount, they are likely to be related.
Correlation
J. Elder PSYC 3031 INTERMEDIATE STATISTICS LABORATORY
11
Revision of Variance
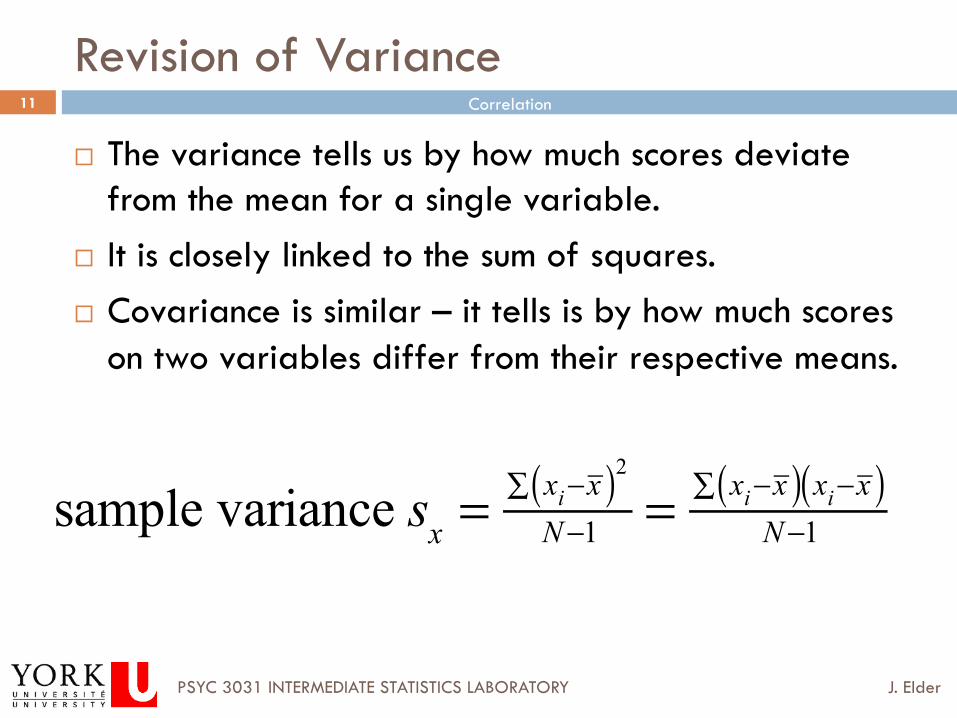
¨ The variance tells us by how much scores deviate from the mean for a single variable.
¨ It is closely linked to the sum of squares. ¨ Covariance is similar – it tells is by how much scores
on two variables differ from their respective means.
sample variance sx =xi−x( )2∑N−1 = xi−x( )∑ xi−x( )
N−1

Correlation
J. Elder PSYC 3031 INTERMEDIATE STATISTICS LABORATORY
12
Covariance
¨ Calculate the deviation of each subject’s score from the mean for the first variable (x).
¨ Calculate the deviation of each subject’s score from the mean for the second variable (y).
¨ Multiply these deviations for each subject. ¨ Now simply take the average of the resulting
values. This is the sample covariance.
( )( )1cov( , ) i ix x y y
Nx y − −∑−=

Correlation
J. Elder PSYC 3031 INTERMEDIATE STATISTICS LABORATORY
13
Problems with Covariance
¨ It depends upon the units of measurement. ¤ e.g. the covariance of two variables measured in miles might be 4.25,
but if the same scores are converted to kilometres, the covariance is 11.
¨ Solution: standardize it! ¤ Divide by the standard deviations of both variables.
¨ The standardized version of covariance is known as the correlation coefficient. ¤ It is unaffected by the units of measurement.
r = covxy
sxsy= xi−x( )∑ yi− y( )
N−1( )sxsy

Correlation
J. Elder PSYC 3031 INTERMEDIATE STATISTICS LABORATORY
14
Correlation: Example
¨ Anxiety and exam performance ¨ Participants:
¤ 103 students
¨ Measures ¤ Time spent revising (hours) ¤ Exam performance (%) ¤ Exam Anxiety (the EAQ, score out of 100) ¤ Gender
Correlation
J. Elder PSYC 3031 INTERMEDIATE STATISTICS LABORATORY
15
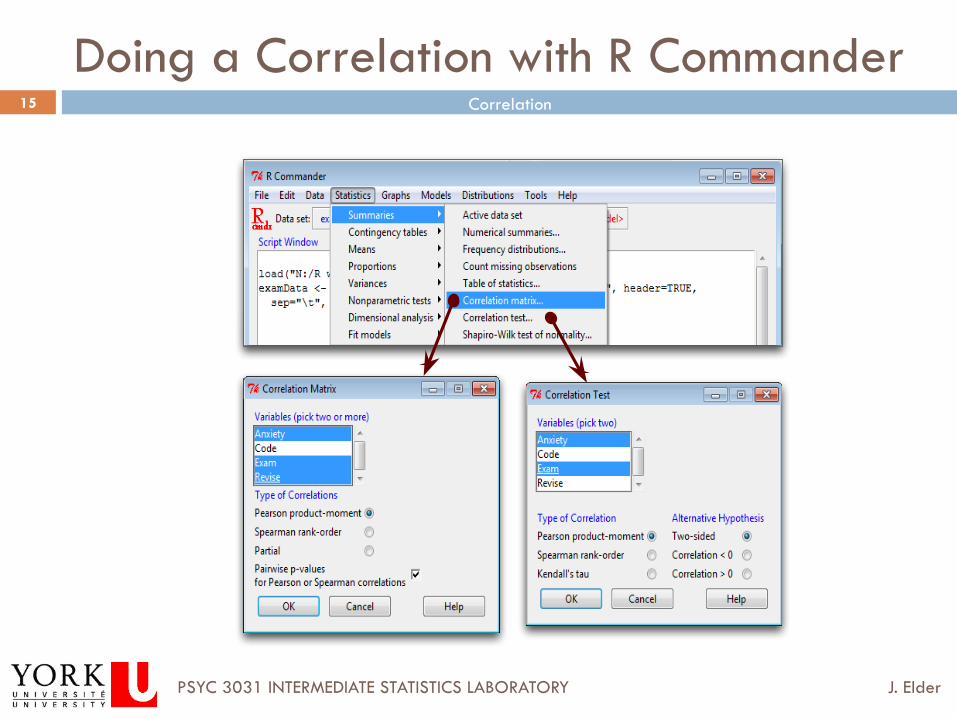
Doing a Correlation with R Commander

Correlation
J. Elder PSYC 3031 INTERMEDIATE STATISTICS LABORATORY
16
General Procedure for Correlations Using R
¨ To compute basic correlation coefficients there are three main functions that can be used: cor(), cor.test() and rcorr().
Correlation
J. Elder PSYC 3031 INTERMEDIATE STATISTICS LABORATORY
17
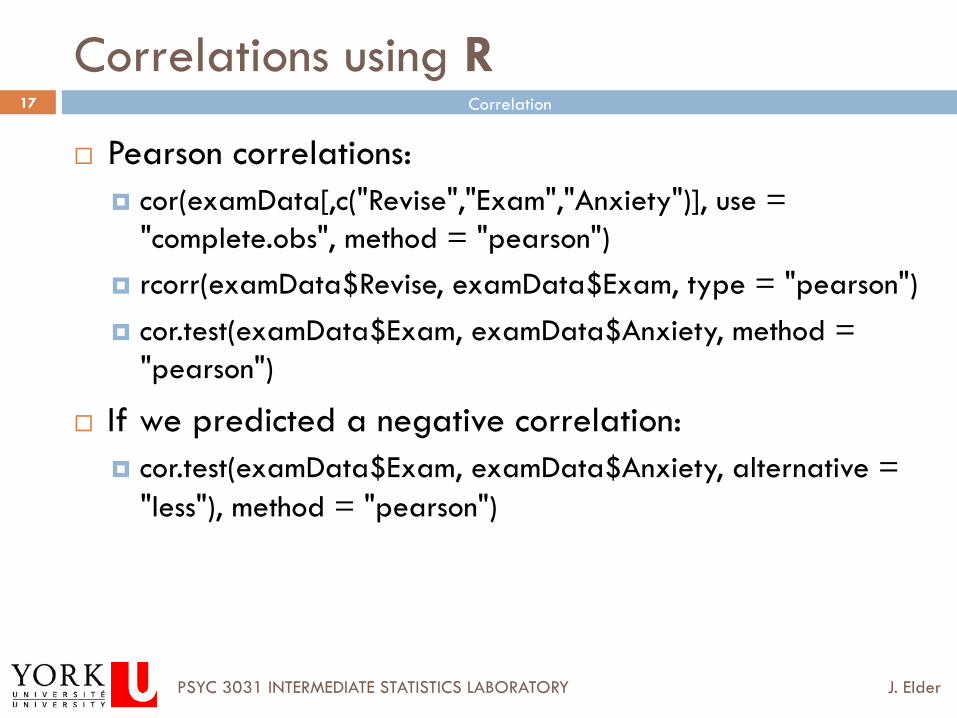
Correlations using R
¨ Pearson correlations: ¤ cor(examData[,c("Revise","Exam","Anxiety")], use =
"complete.obs", method = "pearson") ¤ rcorr(examData$Revise, examData$Exam, type = "pearson") ¤ cor.test(examData$Exam, examData$Anxiety, method =
"pearson")
¨ If we predicted a negative correlation: ¤ cor.test(examData$Exam, examData$Anxiety, alternative =
"less"), method = "pearson")

Correlation
J. Elder PSYC 3031 INTERMEDIATE STATISTICS LABORATORY
18
Pearson Correlation Output
Exam Anxiety Revise Exam 1.0000000 -0.4409934 0.3967207 Anxiety -0.4409934 1.0000000 -0.7092493 Revise 0.3967207 -0.7092493 1.0000000

Correlation
J. Elder PSYC 3031 INTERMEDIATE STATISTICS LABORATORY
19
Reporting the Results
¨ Exam performance was significantly correlated with exam anxiety, r = -.44, and time spent revising, r = .40; the time spent revising was also correlated with exam anxiety, r = -.71 (all ps < .001).

Correlation
J. Elder PSYC 3031 INTERMEDIATE STATISTICS LABORATORY
20
Things to Know about the Correlation
¨ It varies between -1 and +1 ¤ 0 = no relationship
¨ It measures the size of the effect ¨ Coefficient of determination, r2
¤ By squaring the value of r you get the proportion of variance in one variable shared by (e.g., “explained by”) the other.

Correlation
J. Elder PSYC 3031 INTERMEDIATE STATISTICS LABORATORY
21
Correlation and Causality
¨ The third-variable problem: ¤ In any correlation, causality between two variables
cannot be assumed because there may be other measured or unmeasured variables affecting the results.
¨ Direction of causality: ¤ Correlation coefficients say nothing about which
variable causes the other to change.

Correlation
J. Elder PSYC 3031 INTERMEDIATE STATISTICS LABORATORY
22
Non-parametric Correlation
¨ Spearman’s rho ¤ Pearson’s correlation on the ranked data

Correlation
J. Elder PSYC 3031 INTERMEDIATE STATISTICS LABORATORY
23
Example
¨ World’s Biggest Liar competition ¤ 68 contestants ¤ Measures
n Where they were placed in the competition (first, second, third, etc.)
n Creativity questionnaire (maximum score 60)

Correlation
J. Elder PSYC 3031 INTERMEDIATE STATISTICS LABORATORY
24
Spearman’s Rho
¨ You can use cor() to compute Spearman’s Rho: cor(liarData$Position, liarData$Creativity, method = "spearman")
¨ The output of this command will be: [1] -0.3732184
¨ To get the significance value use rcorr(): rcorr(liarData$Position, liarData$Creativity, type = "spearman")
¨ Or cor.test(): cor.test(liarData$Position, liarData$Creativity, alternative = "less", method = "spearman")

Correlation
J. Elder PSYC 3031 INTERMEDIATE STATISTICS LABORATORY
25
cor.test() Output
Spearman's rank correlation rho data: liarData$Position and liarData$Creativity S = 71948.4, p-value = 0.0008602 alternative hypothesis: true rho is less than 0 sample estimates: rho -0.3732184

Correlation
J. Elder PSYC 3031 INTERMEDIATE STATISTICS LABORATORY
26
Kendall’s Tau
¨ Kendall’s tau ¤ Better than Spearman’s for small samples with many tied
scores. cor(liarData$Position, liarData$Creativity, method = "kendall") cor.test(liarData$Position, liarData$Creativity, alternative = "less", method = "kendall")
Correlation
J. Elder PSYC 3031 INTERMEDIATE STATISTICS LABORATORY
27
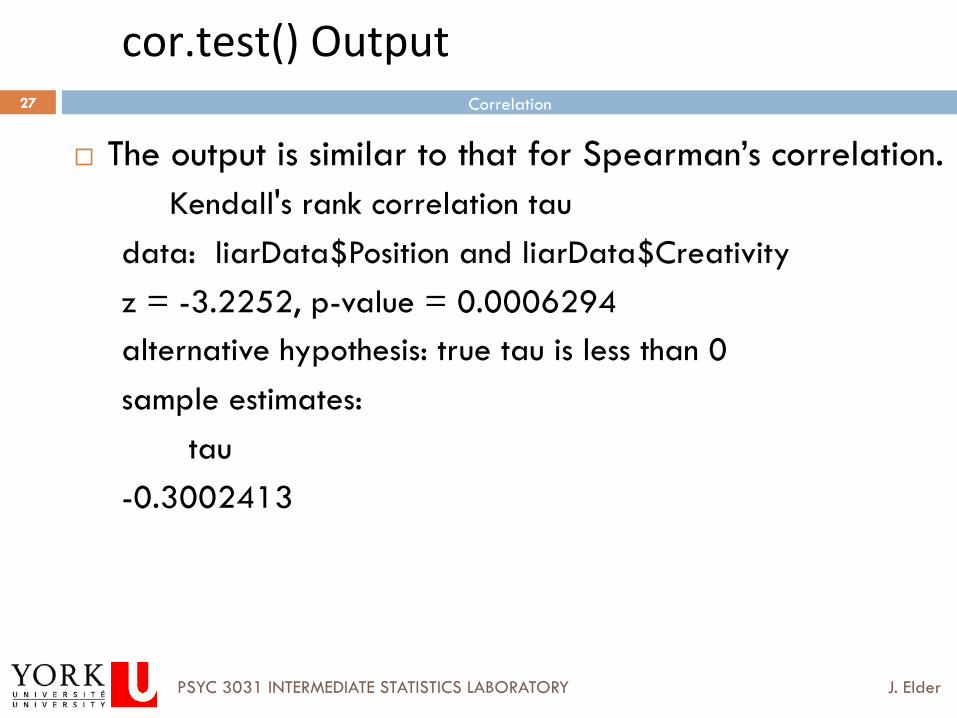
cor.test() Output
¨ The output is similar to that for Spearman’s correlation. Kendall's rank correlation tau
data: liarData$Position and liarData$Creativity z = -3.2252, p-value = 0.0006294 alternative hypothesis: true tau is less than 0 sample estimates: tau -0.3002413

Oct 8, 2012
End of Lecture

Partial Correlation

Correlation
J. Elder PSYC 3031 INTERMEDIATE STATISTICS LABORATORY
30
Pearson Correlation Output
Exam Anxiety Revise Exam 1.0000000 -0.4409934 0.3967207 Anxiety -0.4409934 1.0000000 -0.7092493 Revise 0.3967207 -0.7092493 1.0000000

Exam Performance
Exam AnxietyVariance Accounted for by Exam Anxiety (19.4%)
Exam Performance
Revision Time
Variance Accounted for by Revision Time (15.7%)
Exam Performance
Exam AnxietyUnique variance accounted for by Exam Anxiety
Revision Time
Unique variance accounted for by Revision Time
Variance accounted for by both Exam Anxiety and
Revision Time
1
2
3

Correlation
J. Elder PSYC 3031 INTERMEDIATE STATISTICS LABORATORY
32
Slide 32
Partial and Semi-partial Correlations
¨ Partial correlation: ¤ Measures the relationship between two variables,
controlling for the effect that a third variable has on them both.
¨ Semi-partial correlation: ¤ Measures the relationship between two variables
controlling for the effect that a third variable has on only one of the others.

8-Nov-12
Partial Correlation Semi-Partial Correlation
Revision
Exam Anxiety
Revision
Exam Anxiety

Correlation
J. Elder PSYC 3031 INTERMEDIATE STATISTICS LABORATORY
34
Doing Partial Correlation using R
¨ NB: we are using the package ppcor instead of ggm (ggm is broken).
¨ The general form of pcor() is: pcor(x, method = c("pearson", "kendall", "spearman"))

Correlation
J. Elder PSYC 3031 INTERMEDIATE STATISTICS LABORATORY
35
Example
¨ pcor(examData[,c("Revise","Exam","Anxiety")], method = "pearson”)
$estimate Revise Exam Anxiety Revise 1.0000000 0.1326783 -0.6485301 Exam 0.1326783 1.0000000 -0.2466658 Anxiety -0.6485301 -0.2466658 1.0000000 $p.value Revise Exam Anxiety Revise 0.000000e+00 0.18069538 1.596071e-17 Exam 1.806954e-01 0.00000000 1.091818e-02 Anxiety 1.596071e-17 0.01091818 0.000000e+00 $statistic Revise Exam Anxiety Revise 0.000000 1.338617 -8.519961 Exam 1.338617 0.000000 -2.545307 Anxiety -8.519961 -2.545307 0.000000 …
Correlation
J. Elder PSYC 3031 INTERMEDIATE STATISTICS LABORATORY
36
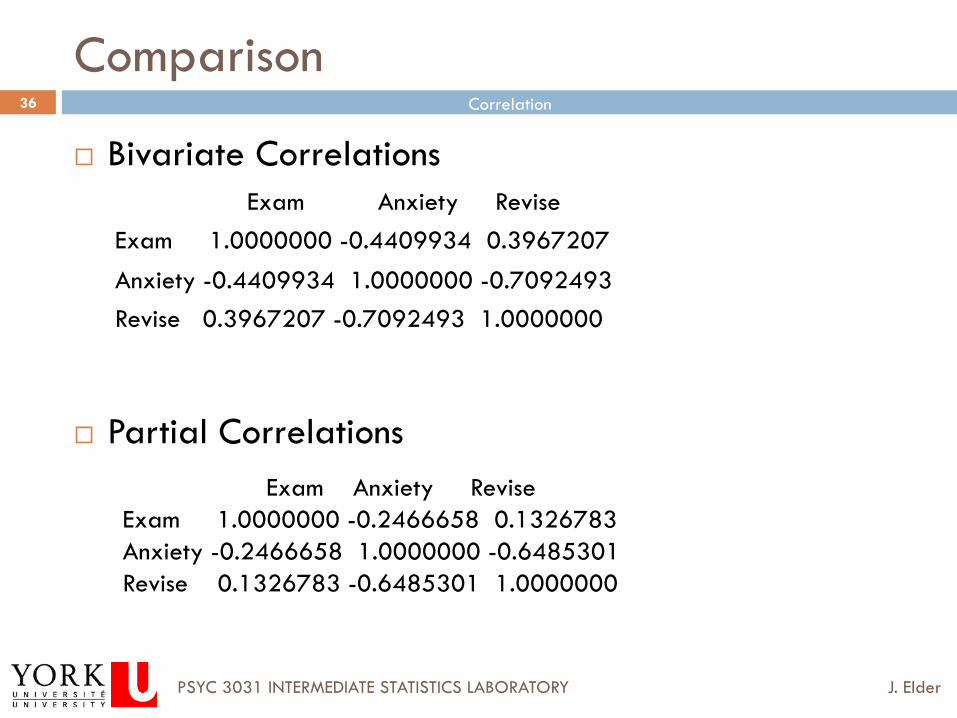
Comparison
¨ Bivariate Correlations
¨ Partial Correlations
Exam Anxiety Revise Exam 1.0000000 -0.4409934 0.3967207
Anxiety -0.4409934 1.0000000 -0.7092493 Revise 0.3967207 -0.7092493 1.0000000
Exam Anxiety Revise Exam 1.0000000 -0.2466658 0.1326783 Anxiety -0.2466658 1.0000000 -0.6485301 Revise 0.1326783 -0.6485301 1.0000000


