Correlation in Credit Risk Xiaoling Pu Xinlei Zhao Office of the Comptroller of the Currency OCC Economics Working Paper 2009-5 Version Date: February 2, 2010 Keywords: Correlations, credit risk, credit spread, macroeconomic conditions, industry effect. JEL Classifications: G28, G33. Xiaoling Pu is an Assistant Professor in the Department of Finance, Kent State University; Xinlei Zhao is a Financial Economist in the Credit Risk Analysis Division at the Office of the Comptroller of the Currency and an Associate Professor in the Department of Finance, Kent State University. Please address correspondence to Xinlei Zhao, Office of the Comptroller of the Currency, 250 E St. SW, Washington, DC 20219 (phone: 202-927-9960; e-mail: [email protected]). The views expressed in this paper are those of the authors alone and do not necessarily reflect those of the Office of the Comptroller of the Currency or the U.S. Department of the Treasury. The authors would like to thank Min Qi, Paul Dawson, and participants of the 2009 Asian Financial Management Association meeting and research seminars at Kent State University and the Office of the Comptroller of the Currency for their insightful comments and editorial assistance. The authors take responsibility for any errors.
Transcript
Correlation in Credit Risk
Xiaoling Pu Xinlei Zhao
Office of the Comptroller of the Currency
OCC Economics Working Paper 2009-5
Version Date: February 2, 2010
Keywords: Correlations, credit risk, credit spread, macroeconomic conditions, industry effect. JEL Classifications: G28, G33. Xiaoling Pu is an Assistant Professor in the Department of Finance, Kent State University; Xinlei Zhao is a Financial Economist in the Credit Risk Analysis Division at the Office of the Comptroller of the Currency and an Associate Professor in the Department of Finance, Kent State University. Please address correspondence to Xinlei Zhao, Office of the Comptroller of the Currency, 250 E St. SW, Washington, DC 20219 (phone: 202-927-9960; e-mail: [email protected]). The views expressed in this paper are those of the authors alone and do not necessarily reflect those of the Office of the Comptroller of the Currency or the U.S. Department of the Treasury. The authors would like to thank Min Qi, Paul Dawson, and participants of the 2009 Asian Financial Management Association meeting and research seminars at Kent State University and the Office of the Comptroller of the Currency for their insightful comments and editorial assistance. The authors take responsibility for any errors.
i
Correlation in Credit Risk
Xiaoling Pu Xinlei Zhao
February 2010
Abstract: We examine the correlation in credit risk using credit default swap (CDS) data. We find that the observable risk factors at the firm, industry, and market levels and the macroeconomic variables cannot fully explain the correlation in CDS spread changes, leaving at least 30 percent of the correlation unaccounted for. This finding suggests that contagion is not only statistically but also economically significant in causing correlation in credit risk. Thus, it is important to incorporate an unobservable risk factor into credit risk models in future research. We also find, consistent with some theoretical predictions, that the correlation is countercyclical and is higher among firms with low credit ratings than among firms with high credit ratings.
I. Introduction
Correlation in credit risk is a well-known phenomenon. Understanding the causes
of correlated credit losses is crucial for many purposes, such as managing a portfolio,
setting capital requirements for banks, and pricing structured credit products that are
heavily exposed to correlations in credit risk; for example, collateralized debt obligations
(CDO). This issue has become particularly important because of the rapid growth of
structured credit products in the financial markets in recent years. But despite much
research on the subject, we do not understand many aspects of correlation in credit risk;
this paper attempts to move the literature forward.
First, we explore the economic importance of contagion in credit risk correlation.
This is an open empirical question. Many credit models are based on the doubly
stochastic assumption that, conditional on observable risk factors, defaults are
independent of each other. This assumption is widely accepted and implemented in
banking to determine capital requirements. However, the assumption has been challenged
by Das and colleagues (2007), and their findings are supported by Duffie and colleagues
(2008). Evidence exists that contagion has a notable impact on the correlation in credit
risk of firms subject to significant credit events (Jorion and Zhang 2007). On the basis of
these findings, some researchers have tried to include contagion in credit models (e.g.,
Duffie et al. 2008, Giesecke 2004, Jarrow and Yu 2001, and Schönbucher and Schubert
2001).
However, the economic importance of contagion in a firm’s credit risk correlation
is not clear from the literature. If the role of contagion is statistically significant but not
economically significant, modeling contagion may not be of first-order importance. But
even though some researchers and practitioners reject the doubly stochastic assumption,
1
they find that the proportion of correlation in credit risk that cannot be explained by
observable risk factors is small (1 to 5 percent), which suggests that unobservable risk
factors may be of minor importance in credit risk models. In this paper, we attempt to
clarify this issue.
We also explore the credit risk correlation pattern over time and across firms with
varying credit quality. The academic literature cannot agree on these patterns either. For
example, Erlenmaier and Gersbach (2001) and Zhou (2001) suggest that the correlation
should increase with default probability, whereas Das and colleagues (2006) and Lopez
(2002) find the opposite. Further, Das and colleagues (2006) find that fluctuations in
credit risk correlation are not countercyclical, a finding that runs counter to the theoretical
predictions of Gersbach and Lipponer (2000) and Erlenmaier and Gersbach (2001).
These questions are important because credit risk has been and still is the biggest
risk facing banks. And with securitization and the new products that have been developed
in the financial market, credit risk has been spread out beyond the banking sector to
various market segments. Ambiguity regarding these issues poses serious challenges for
investors, practitioners, and regulators.
In this paper, we approach credit risk in two ways. First, unlike earlier studies, we
use data from the credit default swap (CDS) market. Most researchers examine the
correlation in a firm’s credit risk using either estimated default intensity based on actual
default observations or implied default probability derived from the Merton (1974) model.
The former approach may not be reliable, because some default events are strategic
decisions and, therefore, may not correspond to economic default.1 Also, some
1 A famous example is Texaco’s decision in the mid-1980s to enter Chapter 11 for nonfinancial reasons.
2
financially distressed companies may be able to negotiate debt restructuring to avoid
default or may be acquired with bankruptcy looming on the horizon, and these informal
resolutions of financial distress are difficult to identify.2, 3 The problem of reliable
numbers is a serious challenge—default is a low-frequency event, and any
misclassification may have a major impact on the precision of parameter estimates. Thus,
the estimated default intensity might be contaminated, and this weakness could be behind
some rather surprising findings in the literature. For example, some studies (e.g., Duffie
et al. 2008; Duffie, Saita, and Wang 2007; and Figlewski, Frydman, and Liang 2006)
show a positive relationship between default intensity and the returns on the S&P 500
stock index.
On the other hand, default probability estimated from the Merton model could be
confounded by the oversimplified assumptions behind the model.
In contrast, the CDS market enables the direct measurement of credit risk by
many market participants. CDS is insurance against a default by a particular company or
sovereign entity (known as the reference entity). The buyer of the CDS contract makes
periodic payments to the seller for the right to sell a bond issued by the reference entity
for its face value if the issuer defaults. So the price of CDS contracts (or the CDS spread)
is a direct measure of the credit risk of the reference entity. Because CDS spreads can be
2 For example, from 1970 through 2008, Moody’s database identifies 577 bankruptcy cases and 209 distressed exchange offers. By comparison, Frank and Torous (1994) find 37 bankruptcy cases and 76 distressed exchange offers during the period 1983–1988. It seems that Moody’s database may have missed some distressed exchange offers, which suggests that this informal type of resolution is very difficult to identify.
3 The strategic decision aspect of default has been documented and modeled in some theoretical models; for example, Anderson, Sundaresan, and Tychon (1996); Bergman and Callen (1991); Frank and Torous (1989, 1994); and Gertner and Scharfstein (1991).
3
based on a wide array of credit risk models, it is also a comprehensive measure of credit
risk.4
The second way we approach credit risk in this paper is by investigating the
observable factors and their contributions to the correlation in risk. Although previous
studies have incorporated some macroeconomic factors into modeling credit risk, the
impact of these variables is not consistent across studies, and some results are
counterintuitive. We study the impact on credit risk of various macroeconomic variables
as well as firm- and market-level variables, and we model the industry effect on the credit
risk of individual firms. Although many researchers have suggested that the industry
effect partially accounts for the correlation in credit risk, the literature has yet to provide
conclusive evidence.
On the basis of monthly changes in CDS spreads from January 2001 through
December 2006, we find that changes in CDS spreads are positively correlated, with an
average correlation of 21 percent. Observable variables at the firm level can reduce the
correlation by 8 percent, resulting in a correlation of 13 percent among the regression
residuals. Market-level and macroeconomic variables are significantly associated with
changes in CDS spreads, with the expected signs of the regression coefficients. These
variables, together with firm-level variables, can reduce the correlation by two-thirds to 7
percent. We also confirm the existence of the industry effect and find that firms in less
cyclical industries have lower correlations in credit risk. Although industry variables are
4 However, using the CDS data also involves some potential disadvantages. One is the liquidity risk; we use the monthly data to mitigate this problem. Another problem is that CDS includes the counterparty risk (i.e., the credit risk of the sellers of the CDS contracts). However, we argue that our results should not be materially affected by the counterparty risk; we use data from before 2006, and the large financial institutions were considered to be rather safe before the financial crisis began.
4
significantly related to CDS spread changes in the right directions, the industry effect can
be responsible for less than 1 percent of the correlation in CDS spread changes after we
control for firm-level, market-level, and macroeconomic variables.
When all observable variables are combined, they can account for about 14
percent of the correlations, leaving 7 percent unaccounted for. The main observable
variables that contribute to the correlations are firm-level variables and credit spreads,
which can be affected by both contagion and systematic risks. Excluding these variables,
the mean correlation among the residuals is 12 percent. These findings suggest that
contagion could contribute from 33 percent to 57 percent of the correlation in credit risks.
This magnitude is much higher than that reported by Das and colleagues (2007) and is
economically significant.
We also investigate the potential nonlinearity in the relationship between credit
risk and observable variables, and find that accounting for nonlinearity does not
qualitatively change our findings. Thus, the evidence suggests that contagion does play
an economically important role in the credit risk correlation.
In addition, we find that the correlation in credit risk is countercyclical; that is, it
is higher during economic downturns and lower during booms. Also, it is higher among
firms with low credit ratings than among those with high credit ratings. These findings
are consistent with some theoretical predictions but not with the findings based on
measures from the Merton model. We believe that the results derived from CDS spreads
are more reliable because of the oversimplified assumptions behind Merton’s model and
the evidence in the literature that the Merton default probability measure does not
5
forecast default probability well (see, e.g., Bharath and Shumway 2007; Jones, Mason,
and Rosenfeld 1984; and Zhou 2001).
Although our study period was short, it included one full business cycle; thus, our
results should have general implications. The study period did not include the recent
market turmoil; however, if contagion is a major phenomenon during severe economic
downturns, failing to include the recent period of turmoil is biased only against the
finding that contagion plays an important role. Our evidence, therefore, suggests that
modeling the unobservable risk factors should be of first-order importance for future
research in credit modeling.
This paper is organized as follows. In section II, we review the current literature.
In section III, we describe our sample. We discuss observable risk factors and their
contributions to the correlation in credit risk in section IV. Section V presents results on
the correlation in credit risk over time and by rating groups. In the last section, we draw a
brief conclusion.
II. Literature Review
Modeling Correlation in Credit Risk
The two branches of credit risk measurement are (1) the structural approach and
(2) the reduced-form approach. Structural models originate from the Merton (1974)
model and assume that a company will default if the value of its assets is below a certain
level; for example, the amount of its outstanding debt. The key to structural modeling is
to capture the stochastic asset diffusion process, and default correlation between two
companies is introduced by assuming that the stochastic processes followed by the assets
6
of the two companies are correlated. Correlation in the stochastic asset diffusion
processes of two firms can be caused by both observable risk factors and unobservable
risk factors, such as contagion. The advantage of structural models is the flexibility in
modeling correlation in credit risk; the disadvantage is the difficulty in implementing
them empirically. The general theoretical predictions from this school are that credit risk
correlation is higher for firms with a low credit rating than for those with a high credit
rating, and that the correlation increases during economic downturns (see, e.g.,
Erlenmaier and Gersbach 2001, Gersbach and Lipponer 2000, and Zhou 2001).
The reduced-form models assume that a firm’s default time is driven by a default
intensity that varies according to changes in macroeconomic conditions (see, e.g., Duffie
and Singleton 1999; Hull and White 2001; Jarrow, Lando, and Turnbull 1995; and Lando
1998). In other words, when the default intensity for company A is high, the default
intensity for company B tends to be high as well, which induces a default correlation
between the two companies. The reduced-form models usually assume that observable
risk factors are the main drivers of firm credit risk and that, after controlling for
observable factors and default intensity, defaults should be independent. This is the
doubly stochastic assumption. Because of its mathematical tractability, most researchers
and practitioners gravitate toward this approach; thus, the doubly stochastic assumption is
behind many commonly used reduced-form models to predict default, such as the
duration models and the survival time copula models.
The doubly stochastic assumption is also the key assumption behind the
proprietary models. For instance, Moody’s KMV Risk Advisor considers systematic
factors using a three-level approach: (1) a composite market risk factor, (2) an industry
7
and country risk factor, and (3) regional factors and sector indicators. The factor loading
for an individual firm for each of the factors is estimated using asset variances obtained
from the option theoretical model, and the factor loadings are then used to calculate
covariances for each pair of firms. In CreditMetrics, the credit transition matrix is
conditioned on a credit cycle index, which shifts down when economic conditions
deteriorate. The credit cycle index is obtained by regressing default rates for speculative
grade bonds on the credit spread, 10-year Treasury yield, inflation rate, and growth in
gross domestic product (GDP). In contrast, Credit Risk Plus incorporates cyclical factors
by allowing the mean default rate to vary over the business cycle. Credit Risk Plus
models find that correlation in credit risk is higher among firms with low credit ratings.
In summary, the doubly stochastic assumption plays a critical role in the vast
majority of credit models used in research and practice. Das and colleagues (2007)
challenge this assumption. They find that variations in the observable factors cannot fully
explain the correlation in credit risk and that the doubly stochastic assumption is violated;
however, the proportion of the correlation that cannot be explained by observable factors
is rather small. Their conclusion may be contaminated in two ways. First, the evidence
could result from the misspecification associated with the model to predict default
intensity. A different model could lead to two possibilities: (1) observable factors may be
sufficient to account for the correlated default risk, as argued by Lando and Nielsen
(2008), or (2) the proportion not explained by observable factors could be much larger
than Das and colleagues documented. Second, because default events are rare, results
based on actual default observations may contain large estimation errors, especially as
8
this model of predicting default intensity is based on the surprising and counterintuitive
finding that default intensity increases along with the equity market index.
It is not clear from the literature how the correlation in credit risk varies over
business cycles and across firms with different credit quality, as studies on these subjects
have yielded conflicting results. This lack of clarity poses a major challenge for investors,
portfolio managers, bankers, and bank regulators.
Macroeconomic Impact in Credit Risk Modeling
Some studies incorporate macroeconomic conditions into credit risk models;
however, researchers have used different macroeconomic variables, and some variables
that are important in one paper are found to be unimportant in another. Also, some
empirical results are quite counterintuitive.
Some researchers find intuitive relations between credit risk and macroeconomic
variables. For example, Collin-Dufresne, Goldstein, and Martin (2001) examine
determinants of changes in credit spreads using changes in 10-year Treasury rates,
changes in the slope of the yield curve, changes in market volatility, and monthly S&P
500 returns. They find that all these variables are significantly related to changes in credit
spreads, with the direction implied by structural models. Carling and colleagues (2007)
investigate how macroeconomic conditions affect business defaults using a corporate
portfolio from a leading Swiss retail bank. They find that the output gap, the yield curve,
and consumers’ expectations of future economic development can help explain a firm’s
default risk.
Other researchers use different variables and come to different conclusions.
Duffie and colleagues (2007) use three-month Treasury bill rates and the trailing one-year
9
return on the S&P 500 index to predict default intensity. They find that default intensity
is significantly negatively related to the short-term interest rate and positively related to
the S&P 500 index. The latter finding is counterintuitive: default intensity should be
lower in a booming market. Duffie and colleagues have also tried 10-year Treasury yields,
U.S. personal income growth, GDP growth rate, AAA-BAA bond yield spread, and
industry-average distance to default; they found that these variables were not significant
in predicting default. Das and colleagues (2007) used the same model and found that
industrial growth played only a limited role, a finding corroborated by Duffie and
colleagues (2008). Similarly, Lando and Nielsen (2008) include S&P 500 returns, three-
month Treasury yields, industrial production, and term spread in their prediction of
default intensity. They find that default intensity is negatively related to industrial
production but find no relationship between default intensity and the three-month
Treasury yield. They find a positive relationship between default intensity and both S&P
500 returns and term spread, which is somewhat counterintuitive.
Couderc and Renault (2005) investigate the impact on default intensity of a
number of market and macro variables. They find that default intensity is positively
related to market volatility, term spread, and yield difference between BBB bonds and
AAA bonds, and negatively related to market return, Treasury yield, real GDP growth
rate, industrial production growth rate, inflation, personal consumption growth, and the
spread of BBB bonds over Treasury bonds. Their findings on market return are intuitive,
although they differ from those of Duffie and colleagues (2007) and Lando and Nielsen
(2008). Their results on the term spread are different from those of Carling and
colleagues (2007) and Collin-Dufresne and colleagues (2001), and the negative
10
relationships between default intensity and both BBB spread and inflation are
counterintuitive.
In summary, the impact of macroeconomic variables is not consistently
documented in the literature, and some results are counterintuitive. These findings add to
the puzzle of whether observable risk factors can explain the correlation in credit risk.
We believe that the inconsistent and sometimes counterintuitive findings may be
contaminated by the noise in the default data, as default events are rare and can contain
misclassifications that lead to estimation errors. CDS data are more suitable for this
purpose.
III. Data Description and Sample Statistics
The Sample
The primary data in this study are the monthly CDS data from January 2001
through December 2006. We use the five-year CDS, as this instrument is the most liquid
in the CDS market (Hull, Predescu, and White 2004). We use monthly data to match the
monthly macroeconomic variables because price movements in monthly data are less
contaminated than daily or weekly data by temporary imbalances between supply and
demand. The CDS spread measures total credit risk, which includes both default
probability (DP) and losses given default (LGD). It is widely documented that DP and
LGD are positively correlated (see, e.g., Gupton, Hamilton, and Berthault 2001); thus, the
CDS spread is a comprehensive measure of total credit risk.
We downloaded the CDS data from Reuters, then merged them with CRSP
(Center for Research in Security Prices) and quarterly Compustat data. Our sample
11
includes 523 firms (25,113 firm-month observations)—376 investment-grade firms and
147 speculative-grade firms, based on the average rating for each firm during the sample
period. We obtained ratings data from Moody’s. Our sample period (2001–2006)
includes one full business cycle consisting of varying economic conditions: an economic
downturn in the early period, a recovery in 2003, and a normal period afterward. 5
Variables at the Firm, Industry, and Market Levels
We use three firm-level variables to explain the changes in CDS spreads:6
According to the structural model, a firm’s default risk is higher when either volatility or
leverage is high. Also, stock returns indicate the market’s assessment of a firm’s future
performance. Lower returns imply a dimmer outlook, which should correlate with a
higher credit risk, so stock returns should be negatively associated with changes in CDS
spreads.
We use the following market-level variables: changes in implied market volatility
(VIX), changes in market leverage, and changes in market returns (measured by NYSE-
5 We included firms that experienced credit events, so our sample does not suffer from the survivorship bias.
6 Throughout the paper, we report results on the basis of percentage changes in CDS spreads
(i.e.,1
11
t
ttt SpreadCDS
SpreadCDSSpreadCDSChangeSpreadCDS . Results using log changes in CDS
spreads are very similar.
7 We have tried excess stock returns rather than actual stock returns, and the results do not change qualitatively.
8 We obtained monthly stock returns from the CRSP database. We estimated monthly stock volatility from daily stock returns of each month. We defined firm leverage as the ratio of book debt value (data51+data45) to the sum of book debt value and market capitalization. We also tried other firm characteristics besides those reported here: cash holdings, quick ratios, asset volatility, and distance-to-default. We found that the main conclusions drawn here do not change.
12
AMEX-NASDAQ value-weighted returns). An increase in either market volatility or
market leverage, or a decrease in market returns, suggests a worsening economic outlook,
which should be associated with an increase in credit risk. We define industry variables
similarly—changes in industry volatility, changes in industry leverage, and changes in
industry aggregate returns—and the same logic should hold at the industry level if there
is an industry effect. We use the Fama-French 12-industry classification.9
Macroeconomic Variables
We use real GDP growth rate and changes in capacity utilization rate to describe
the business cycle. 10 If credit risks are higher during an economic recession, we would
see changes in CDS spreads negatively related to both real GDP growth rate and changes
in capacity utilization rate. We also include inflation among our list of macroeconomic
variables. Since previous studies have shown a negative relationship between real activity
and inflation (see, e.g., Fama 1981, Geske and Roll 1983, Ram and Spencer 1983, and
Stulz 1986), we expected a positive relationship between inflation and credit risk.
We use the following interest rate variables: changes in three-month T-bill rates,
changes in term spreads (difference between the yields of 10-year T-bonds and three-
month T-bills), and changes in credit spreads between BBB and AAA bonds and between
AAA bonds and 10-year T-bonds. The relationship between the three-month T-bill rate
and credit risk should be negative for two reasons. First, the Fed’s monetary policy is
pro-cyclical. Second, a higher interest rate can increase the risk-neutral drift of the
9 Results using 48 industries are quite similar.
10 We also tried some other macro variables, such as the industrial growth rate, changes in unemployment rate, and the Chicago Fed National Activity Index (CFNAI), and many others. We have not included these variables in the paper; they did not affect our results.
13
process of firm value, thus reducing credit risks (Longstaff and Schwartz 1995). Collin-
Dufresne and colleagues (2001) and Duffee (1998) both documented a negative
relationship between interest rate and credit risk. Credit risk should also be negatively
related to the term spread (Estrella and Hardouvelis 1991, Estrella and Mishkin 1996, and
Fama and French 1989) and positively related to both measures of credit spread (Chen
1991, Fama and French 1989, Friedman and Kuttner 1992, and Stock and Watson 1989).
Data Description
Table 1 provides summary statistics of the sample. For all firms, the mean CDS
spread is 126.27 basis points (bps). The median and standard deviation suggest that the
distribution of CDS spreads is quite skewed and volatile. The mean change in CDS
spreads is small (–0.07 percent), but the range is wide (–17.78 to 23.43 percent). Both the
high and low in CDS spread changes are found among the speculative-grade firms; these
firms also have higher mean changes in CDS spreads. As expected, all three measures
(CDS spreads, equity volatility, and firm leverage) are lower among investment-grade
firms and higher among speculative-grade firms. Panel B of table 1 shows that the
average CDS spread was highest in 2002; it declined sharply in 2003 and 2004, then
leveled off.11 The average monthly return on the NYSE-AMEX-NASDAQ index was
0.47 percent during the sample period, and the average annualized volatility was 19.08
percent. Over the entire sample period, the mean market leverage was 0.23. The average
return across the industry portfolios was 0.57 percent, and the mean annualized industry
volatility was 25.27 percent.
11 The credit derivatives market was relatively immature in 2001, just crossing $1 trillion. By 2006, it was $34 trillion. So the prices observed in 2001 may not be the most efficient. To address this concern, we conducted the same analysis excluding observations from 2001 and reached similar conclusions.
14
Table 1. Descriptive Statistics
Table 1 shows the summary statistics of the variables used in the study. Panel A presents the descriptive statistics for the firm-level variables: five-year CDS spreads (in basis points), CDS spread percentage changes, equity returns, equity volatility, and leverage. The monthly equity volatility is computed as the annualized standard deviation based on daily returns. The firm leverage is computed as the ratio of book debt value to the sum of market capitalization and book debt value. The data are from January 2001 through December 2006. “Investment-grade” refers to firms with ratings at BAA or above; “speculative-grade” refers to firms with ratings below BAA. Panel B presents the descriptive statistics of CDS spreads by year. Panel C presents the summary statistics of the market and industry variables. VIX is the implied volatility of the S&P 500 index options obtained from the Chicago Board Options Exchange. The market return is the NYSE-AMEX-NASDAQ value-weighted index returns. Other market (industry) variables are the value-weighted average from all firms in the market (industry). We use the Fama-French 12-industry classification. Panel A. Firm Characteristics
Variables Mean Median Minimum Maximum Standard Deviation
All firms
CDS (bps) 126.27 63.10 8.65 1,632.36 176.50
CDS change (%) –0.07 –0.46 –17.78 23.43 2.52
Equity return (%) 1.23 1.13 –4.26 4.86 0.97
Equity volatility 0.31 0.28 0.13 0.78 0.11
Leverage 0.32 0.29 0.00 0.94 0.20
Investment-grade
CDS (bps) 60.22 47.10 8.65 444.89 49.72
CDS change (%) –0.42 –0.60 –5.06 7.93 1.77
Equity return (%) 1.18 1.13 –0.80 4.39 0.80
Equity volatility 0.27 0.25 0.16 0.64 0.07
Leverage 0.28 0.24 0.00 0.94 0.19
Speculative-grade
CDS (bps) 295.23 223.24 53.81 1,632.36 255.05
CDS change (%) 8.26 5.78 –17.78 23.43 3.68
Equity return (%) 1.34 1.34 –4.26 4.86 1.30
Equity volatility 0.41 0.39 0.13 0.78 0.13
Leverage 0.44 0.43 0.06 0.92 0.19
15
Table 1. Descriptive Statistics (cont’d.)
Panel B. Summary Statistics of CDS Spreads (bps)
Year Mean Median Minimum Maximum Standard Deviation
2001 151.67 83.33 17.83 3,249.57 284.40
2002 212.29 99.70 15.22 3,232.04 329.24
2003 150.72 69.62 9.84 2,508.39 219.41
2004 109.33 49.27 8.72 1,843.10 178.33
2005 107.17 44.90 5.21 2,181.16 200.90
2006 94.39 41.40 3.98 2,396.08 164.70
Panel C. Market- and Industry-Level Variables
Variables Mean Median Minimum Maximum Standard Deviation
Market aggregate return (%)
0.47 1.11 –10.01 8.41 4.15
VIX (%) 19.08 16.69 10.91 39.69 6.98
Market leverage 0.23 0.23 0.19 0.27 0.01
Industry return (%) 0.57 1.57 –12.64 10.23 4.52
Industry volatility (%) 25.27 20.21 11.91 80.57 12.12
Industry leverage 0.23 0.17 0.07 0.48 0.15
Figure 1 plots the time-series variation in the seven macroeconomic variables
used in this study. Real GDP growth was low and even entered negative territory at the
beginning of the study period; it jumped in 2003 as the economy recovered. Similarly,
capacity utilization shows a decline from 2001 to 2002, then a boost in 2003; it leveled
off in 2005. The inflation rate is quite volatile during the study period.
The three-month T-bill rate shows a U-shape, depicting the Fed’s policy to cut the
interest rate during recessions and raise it during booms. The term spread has a humped
shape: lower during the recession in early 2001 and higher as the recovery looms on the
horizon. It declines sharply after mid-2004, as the Fed increased the short-term interest
rate but the long-term interest rate did not change much. The spread between BBB and
16
Figure 1. Time Series of Macroeconomic Variables
17
AAA yields shows a jump at the end of 2001 and then declines and reaches a low
at the end of 2004. The spread between AAA and 10-year Treasury bonds shows a
general decline over the sample period.
IV. Observable Risk Factors and Correlation in Credit Risk
Because most of our analyses involve panel data, our estimates are based on
robust standard errors. We estimated these errors by assuming independence across firms,
but we accounted for possible autocorrelation within the same firm. We use the
contemporaneous variables on the right-hand-side variables.
Market and Macroeconomic Effect
Table 2 shows the effect of firm-level variables on changes in CDS spreads. We
calculate the pairwise correlations (of the raw CDS spread changes or residuals from the
regressions) and report the means in the last row of the table. The first column of table 2
shows that, without controlling for any observable covariates, the average correlation in
changes in CDS spreads in the entire sample is 21 percent. The correlation ranges from a
minimum of –30 percent to a maximum of 72 percent, and the interquartile spans a range
of 30 percent.
18
Table 2. Effect of Firm Characteristics on the Correlation in Changes in CDS Spreads
Table 2 shows regression results of changes in CDS spread on firm-level variables: firm stock returns, changes in firm leverage, and changes in firm equity volatility. For each regression model, we report the average pairwise correlation in the residuals in the last row. The robust standard errors are in brackets. ** and *** represent statistical significance at the 5 percent and 1 percent levels, respectively.
Independent Variables Model 1 Model 2 Model 3 Model 4 Model 5 Equity returns –0.567*** –0.473*** [0.023] [0.025] Change in firm leverage 1.662*** 0.318***
[0.114] [0.084] Chance in equity volatility 0.199*** 0.148***
Table 2 also shows that stock returns are negatively associated with changes in
CDS spreads, while both volatility change and leverage change are positively related to
CDS spread changes, consistent with expectations. The mean correlations reported in
columns 2 through 5 are the residual correlations from each regression. It is clear that co-
movements in all three firm-level variables among different firms can partially explain
the correlation in the changes in CDS spreads. Among the three firm-level variables,
changes in firm leverage can reduce the correlation most: from 21 percent to 14 percent.
When all three variables are included, the correlation is reduced by 8 points to 13 percent.
19
Table 3 adds market-level variables to firm-level variables. Changes in market
volatility are positively related to CDS spread changes. When used alone, change in
market leverage is positively related to changes in CDS spreads. When combined with
the other two market variables, the relationship between market leverage change and
CDS spread change is significantly negative, suggesting the existence of multicollinearity.
The aggregate market returns are negatively associated with changes in CDS spreads,
regardless of whether they are used alone or in combination with other market variables.
This evidence is consistent with our expectations but contrary to the findings of Duffie
and colleagues (2007) and Lando and Nielsen (2008). Further, even with firm-level
variables, market variables are still significantly associated with changes in CDS spreads,
suggesting that the impact of market variables does not entirely channel through firm-
level variables. This finding does not support the argument by Lando and Nielsen (2008).
However, even though market-level variables can explain changes in CDS
spreads beyond what is explained by firm-level variables, they have only limited ability
to reduce the correlation in credit risk across firms. The residual correlation decreases
from 13 percent in column 5 of table 2 to 12 percent in column 4 of table 3.
20
Table 3. Effect of Market Variables on the Correlation in Changes in CDS Spreads
Table 3 shows regression results of changes in CDS spreads on firm-level and market-level variables. Firm-level variables are firm stock returns, changes in firm leverage, and changes in firm equity volatility. The market variables are changes in VIX, returns of the NYSE-AMEX-NASDAQ value-weighted index of the month, and changes in market leverage. For each regression model, we report the average pairwise correlation in the residuals in the last row. The robust standard errors are in brackets. ** and *** represent statistical significance at the 5 percent and 1 percent levels, respectively.
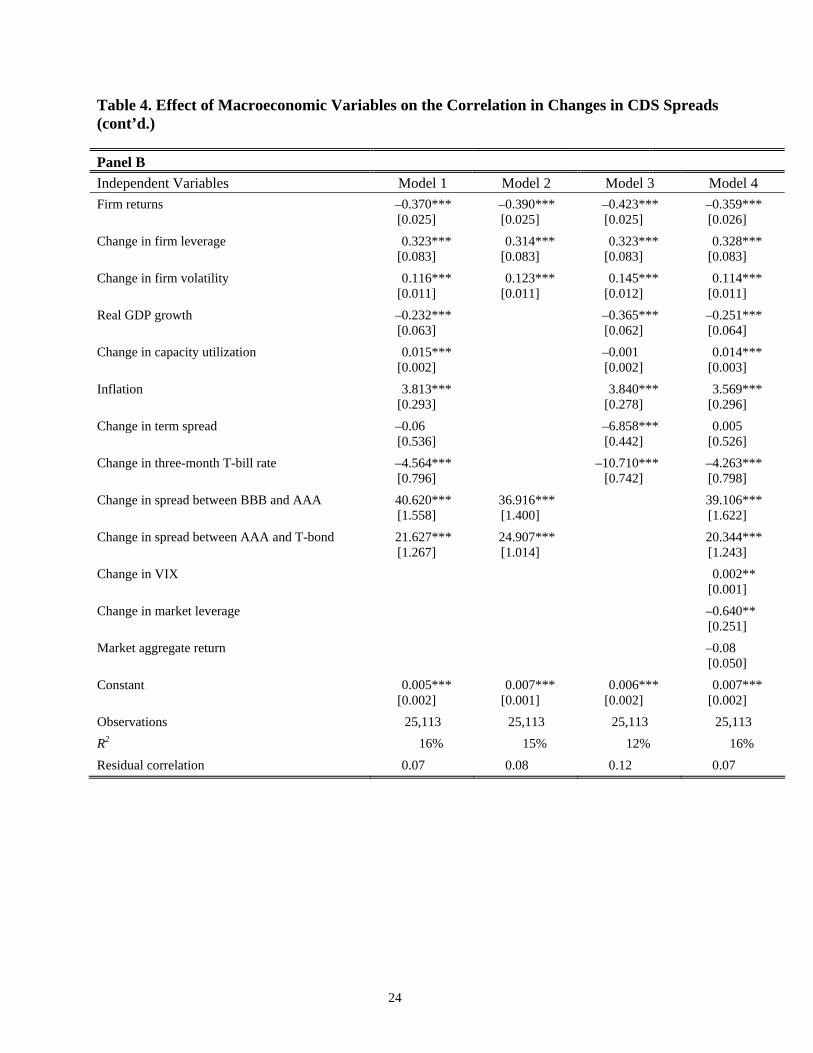
In table 4, we add macroeconomic variables (instead of market-level variables) to
firm-level variables to explain the changes in CDS spreads. Panel A shows that when
they are used alone, both measures of business cycles are negatively associated with
changes in CDS spreads, consistent with the expectation that credit risks are higher
during a recession. We also find that CDS changes are negatively related to changes in
three-month T-bill rates and changes in term spreads; and they are positively associated
with inflation and both credit spread measures. These findings are consistent with
21
expectations, confirming that macroeconomic factors affect a firm’s credit risk. Among
the macroeconomic variables, the two credit spreads show the greatest ability to account
for correlation in changes in CDS spreads.
In panel B of table 4, we present four models. We include all the firm-level and
macroeconomic variables in column 1. In column 2, we include the firm-level and two
credit spread variables. In column 3, we include the firm-level and five macroeconomic
variables (excluding credit spreads). In column 4, we include all the firm-level, market-
level, and macroeconomic variables. Because of the correlations among them, some of
the variables no longer have the right signs of regression coefficients and some other
variables lose statistical significance. It is clear that a combination of all seven
macroeconomic variables can reduce the correlation in changes in CDS spreads by 6
percentage points. Columns 2 and 3 show that the ability of macroeconomic variables to
explain correlation in changes in CDS spread is largely due to the two credit spread
measures. Column 4 of panel B shows that the market variables can contribute only
marginal explanatory power beyond what is accounted for by the macroeconomic and
firm-level variables.
22
Table 4. Effect of Macroeconomic Variables on the Correlation in Changes in CDS Spreads Table 4 shows regression results of changes in CDS spreads on firm-level, market-level, and macroeconomic variables. Firm-level variables are firm stock returns, changes in firm leverage, and changes in firm equity volatility. The market variables are changes in VIX, returns of the NYSE-AMEX-NASDAQ value-weighted index of the month, and changes in market leverage. The macroeconomic variables are real GDP growth, changes in capacity utilization, inflation, changes in three-month T-bill rates, term spread (the difference between the 10-year T-bond yield and the three-month T-bill yield), the yield difference between BBB and AAA bonds, and the yield difference between AAA bonds and 10-year T-bonds. For each regression model, we report the average pairwise correlation in the residuals in the last row. In panel A, we include each macroeconomic variable in the regression models one by one. In panel B, we use combinations of macroeconomic and market variables. The robust standard errors are in brackets. ** and *** represent statistical significance at the 5 percent and 1 percent levels, respectively.
Panel A
Independent Variables Model 1 Model 2 Model 3 Model 4 Model 5 Model 6 Model 7
Table 4. Effect of Macroeconomic Variables on the Correlation in Changes in CDS Spreads (cont’d.)
Panel B
Independent Variables Model 1 Model 2 Model 3 Model 4
Firm returns –0.370*** [0.025]
–0.390*** [0.025]
–0.423*** [0.025]
–0.359*** [0.026]
Change in firm leverage 0.323*** [0.083]
0.314*** [0.083]
0.323*** [0.083]
0.328*** [0.083]
Change in firm volatility 0.116*** [0.011]
0.123*** [0.011]
0.145*** [0.012]
0.114*** [0.011]
Real GDP growth –0.232*** [0.063]
–0.365*** [0.062]
–0.251*** [0.064]
Change in capacity utilization 0.015*** [0.002]
–0.001 [0.002]
0.014*** [0.003]
Inflation 3.813*** [0.293]
3.840*** [0.278]
3.569*** [0.296]
Change in term spread –0.06 [0.536]
–6.858*** [0.442]
0.005 [0.526]
Change in three-month T-bill rate –4.564*** [0.796]
–10.710*** [0.742]
–4.263*** [0.798]
Change in spread between BBB and AAA 40.620*** [1.558]
36.916*** [1.400]
39.106*** [1.622]
Change in spread between AAA and T-bond 21.627*** [1.267]
24.907*** [1.014]
20.344*** [1.243]
Change in VIX 0.002** [0.001]
Change in market leverage –0.640** [0.251]
Market aggregate return –0.08 [0.050]
Constant 0.005*** [0.002]
0.007*** [0.001]
0.006*** [0.002]
0.007*** [0.002]
Observations 25,113 25,113 25,113 25,113
R2 16% 15% 12% 16%
Residual correlation 0.07 0.08 0.12 0.07
24
25
Industry Effect
Table 5 shows the average pairwise correlation in CDS spread changes among
firms in each of the 11 Fama-French industries.12 The table shows much variation in
correlation in credit risk among firms in the same industry. Over the study period, the
energy sector has the highest correlation among all industries, whereas the health care
sector has the lowest correlation. Only four of the 11 industries have a higher average
correlation than the overall average of 21 percent.
The ranking of correlation by industry changed over the six-year study period.
The financial industry had the highest correlation in 2001 and 2002, suggesting that an
economic downturn affects financial firms more than others. The energy industry had the
highest correlation from 2004 to 2006, likely driven by volatile price movements in oil.
The health care, medical equipment, and drug industries had the lowest correlations in
three of the six years, and consumer nondurable goods had the lowest correlation in two
years. These findings suggest that less cyclical industries have lower correlations in credit
risk.
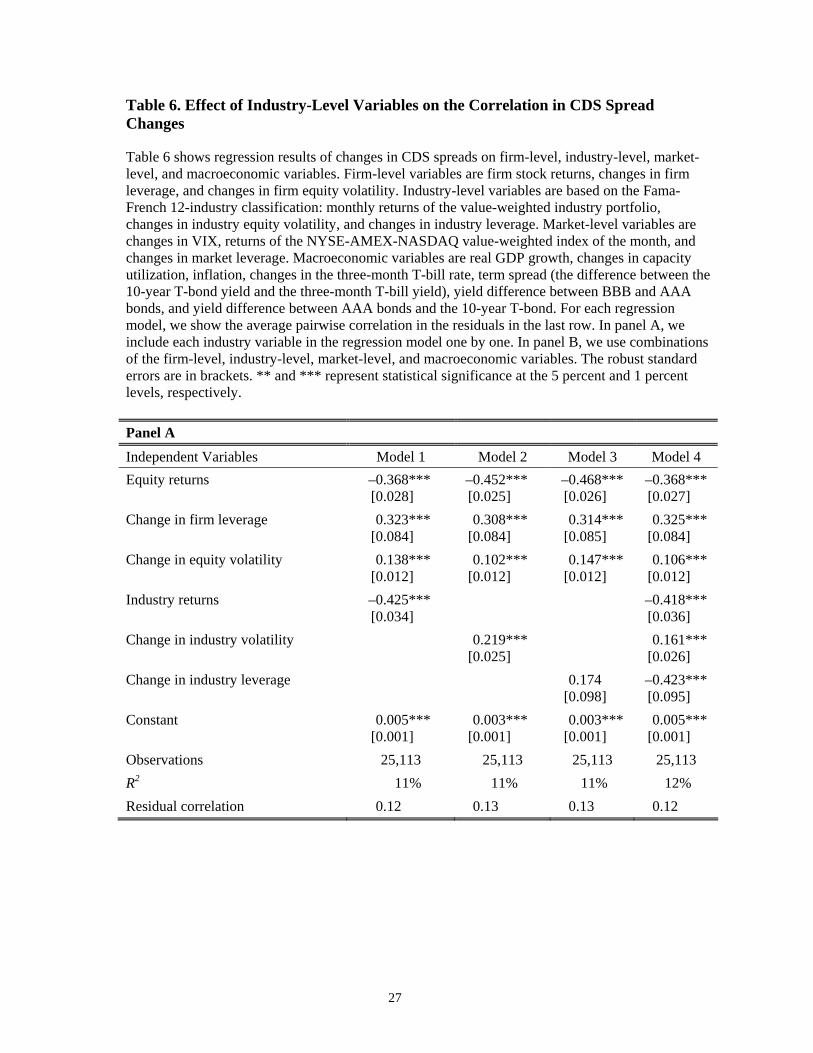
Table 5 shows the existence of an industry effect, which we examine in table 6.
Panel A of table 6 shows firm-level and industry-level variables. We find that changes in
industry volatility are positively related to changes in CDS spreads, whereas industry
returns are negatively related to changes in CDS spreads. When it is used alone, industry
leverage change is positively related to changes in CDS spreads. When all three industry
variables are used together, industry return and volatility retain their signs of regression
12 We omitted the 12th industry (which consisted of miscellaneous firms) from the analysis.
Table 5. Correlation in CDS Spread Changes Across Industries
Table 5 shows the average pairwise correlation in CDS spread changes across the 11 industries in our sample. We use the Fama-French 12-industry classification. Ind1 refers to consumer nondurables; Ind2 to consumer durables; Ind3 to manufacturing; Ind4 to energy; Ind5 to chemicals and allied products; Ind6 to business equipment; Ind7 to telephone and television transmission; Ind8 to utilities; Ind9 to wholesale, retail, and other services; Ind10 to health care, medical equipment, and drugs; and Ind11 to finance. The classification follows the rules set by the French data library. We omitted the Industry 12 category, which includes mines, construction, building materials, transportation, hotels, business services, and entertainment. We required a minimum of six observations to calculate pairwise correlations; there were not enough observations for Ind10 in 2001 to make this calculation.
Table 6. Effect of Industry-Level Variables on the Correlation in CDS Spread Changes
Table 6 shows regression results of changes in CDS spreads on firm-level, industry-level, market-level, and macroeconomic variables. Firm-level variables are firm stock returns, changes in firm leverage, and changes in firm equity volatility. Industry-level variables are based on the Fama-French 12-industry classification: monthly returns of the value-weighted industry portfolio, changes in industry equity volatility, and changes in industry leverage. Market-level variables are changes in VIX, returns of the NYSE-AMEX-NASDAQ value-weighted index of the month, and changes in market leverage. Macroeconomic variables are real GDP growth, changes in capacity utilization, inflation, changes in the three-month T-bill rate, term spread (the difference between the 10-year T-bond yield and the three-month T-bill yield), yield difference between BBB and AAA bonds, and yield difference between AAA bonds and the 10-year T-bond. For each regression model, we show the average pairwise correlation in the residuals in the last row. In panel A, we include each industry variable in the regression model one by one. In panel B, we use combinations of the firm-level, industry-level, market-level, and macroeconomic variables. The robust standard errors are in brackets. ** and *** represent statistical significance at the 5 percent and 1 percent levels, respectively.
Panel A
Independent Variables Model 1 Model 2 Model 3 Model 4
Equity returns –0.368*** [0.028]
–0.452*** [0.025]
–0.468*** [0.026]
–0.368***[0.027]
Change in firm leverage 0.323*** [0.084]
0.308*** [0.084]
0.314*** [0.085]
0.325***[0.084]
Change in equity volatility 0.138*** [0.012]
0.102*** [0.012]
0.147*** [0.012]
0.106***[0.012]
Industry returns –0.425*** [0.034]
–0.418***[0.036]
Change in industry volatility 0.219*** [0.025]
0.161***[0.026]
Change in industry leverage 0.174 [0.098]
–0.423***[0.095]
Constant 0.005*** [0.001]
0.003*** [0.001]
0.003*** [0.001]
0.005***[0.001]
Observations 25,113 25,113 25,113 25,113
R2 11% 11% 11% 12%
Residual correlation 0.12 0.13 0.13 0.12
27
Table 6. Effect of Industry-Level Variables on the Correlation in CDS Spread Changes (cont’d.)
Panel B
Independent Variables Model 1 Model 2 Model 3 Model 4 Firm returns –0.352***
[0.027] –0.355***[0.027]
–0.351*** [0.027]
Change in firm leverage 0.329*** [0.083]
0.337***[0.084]
0.332*** [0.083]
Change in firm volatility 0.106*** [0.012]
0.107***[0.012]
0.106*** [0.012]
Industry returns –0.116*** [0.036]
–0.109** [0.043]
–0.098** [0.042]
–0.427***[0.042]
Change in industry volatility 0.048* [0.027]
0.132***[0.026]
0.042 [0.027]
0.280***[0.026]
Change in industry leverage –0.331*** [0.090]
–0.314***[0.091]
–0.306*** [0.090]
–0.266***[0.095]
Change in VIX 0.001** [0.001]
0.001** [0.001]
0.001** [0.001]
Change in market leverage –1.468***[0.245]
–0.469* [0.249]
–1.643***[0.252]
Market aggregate return –0.610***[0.056]
–0.012 [0.057]
–0.514***[0.059]
Real GDP growth –0.218*** [0.064]
–0.246*** [0.065]
–0.309***[0.069]
Change in capacity utilization 0.014*** [0.002]
0.014*** [0.003]
–0.004* [0.003]
Inflation 3.575*** [0.301]
3.509*** [0.302]
2.457***[0.285]
Change in term spread –0.270 [0.539]
–0.229 [0.534]
–5.282***[0.441]
Change in three-month T-bill rate –4.648*** [0.830]
–4.530*** [0.833]
–8.039***[0.743]
Change in spread between BBB and AAA bonds
20.020*** [1.230]
19.615*** [1.222]
Change in spread between AAA bonds and T-bond
38.990*** [1.626]
38.468*** [1.648]
Constant 0.006*** [0.002]
0.008***[0.001]
0.007*** [0.002]
0.010***[0.002]
Observations 25,113 25,113 25,113 25,387
R2 16% 12% 16% 9%
Residual correlation 0.07 0.13 0.07 0.12
28
coefficients, while industry leverage shows an opposite sign, suggesting the existence of
multicollinearity. In the first three columns of panel B, we add market and
macroeconomic variables and find that results on the industry-level variables generally
do not change.
The last rows of table 6 show that the industry effect has only a trivial effect on
the correlation in CDS spread changes. When all observable variables are included
(column 3, panel B), the average correlation is 7 percent; in column 4, panel B of table
4—where industry variables are not included—the correlation is also 7 percent. This
suggests that although industry variables are significantly related to changes in CDS
spreads, the industry effect only marginally accounts for correlation in credit risk across
firms.
Contribution by Contagion
We have shown that common risk factors such as market variables, industry
variables, and macroeconomic variables (excluding credit spreads) have a limited effect
on correlation in changes in CDS spreads, and that the correlation is mainly driven by
firm-level variables and credit spreads. However, both common risk factors and
contagion can affect firm-level variables and credit spreads. To assess the upper bound of
the correlations that could be attributed to contagion, we include in the last column of
panel B in table 6 the variables affected only by common risk factors. We find that the
average residual correlation is 0.12.
Comparing column 3 in panel B of table 6 with the first column in table 2, where
no control variables are included, we conclude that the observable covariates can explain
14 percentage points of the correlations in credit risks. The remaining 7 percentage points
29
should be due to contagion; thus, contagion contributes to at least one-third of the
correlations in changes in CDS spreads. Further, comparing the last column in panel B of
table 6 with the first column in table 2, we conclude that the contagion-free common risk
factors can explain at least 9 percentage points, with the remaining 12 percentage points
possibly caused by contagion. Thus, contagion could account for as much as 57 percent
of the overall correlation in credit risks.
These numbers are much higher than those reported by Das and colleagues (2007)
and suggest that contagion is not only statistically significant but also economically
significant in causing correlation in credit risk. Our evidence suggests that future research
in credit modeling must take contagion into consideration.
Additional Investigations
Our findings were derived from linear models. Can nonlinear terms be responsible
for the correlation in credit risk? To address this concern, we included higher order terms
and some interactive terms in the model, and found that the results did not change
qualitatively. For example, when we included both the first- and second-order terms of all
the observable variables, the average residual correlation declined to 6.2 percent, which is
still statistically and economically significant. Thus, adding nonlinear interactive terms
does not shrink the residual correlation drastically. The same was true when we added
third- and fourth-order terms. Although it is possible that a particular combination of
higher order and interactive terms may lead to close-to-zero residual correlations, we are
wary of this approach because reduced-form models are very atheoretical and additional
higher order terms lack theoretical reasoning, risking overfitting and poor out-of-sample
fit.
30
Is contagion the result of illiquidity in the market? To address this question, we
included several liquidity measures in the regression model, such as a stock market
liquidity measure proposed by Amihud (2002) and a measure describing the CDS market
depth (the number of contributors for the CDS spread quotes). Even after taking market
liquidity into consideration, the residual correlation did not shrink substantially and was
still significantly positive. The finding suggests that market illiquidity may not be the sole
contributor to contagion.
We also investigated whether contagion shows up only during economic
downturns. In each year of our study period, the proportion of correlation in credit risk
that could not be explained by the observable factors exceeded 30 percent. Therefore, it
seems that contagion is a general phenomenon in various economic conditions. Because
of the magnitude, it is important for future research to incorporate unobservable risk
factors into credit models, both theoretically and empirically.
V. Correlations in Changes in CDS Spreads Over Time and by Rating Group
The second question we investigated is how the correlation pattern changes over
time and across different credit quality firms. We grouped firms according to their credit
ratings; panel A of table 7 shows the average correlation in CDS spread changes over
time among investment-grade firms and speculative-grade firms.
The first column shows variation in credit risk correlation over time. The mean
correlation is the highest at 0.34 in 2001, when the economy was in recession. As the
economic environment improved from 2001 to 2003, the mean correlation in CDS spread
changes declined from 0.34 to 0.23 in 2002 and to 0.14 in 2003. This pattern is consistent
with the theoretical prediction that the correlation should be higher during economic
31
downturns (see, e.g., Erlenmaier and Gersbach 2001, and Gersbach and Lipponer 2000).
The increased correlation in 2004 and 2005 is possibly due to credit problems at General
Motors and Ford Motor Company. A study by Acharya, Schaefer, and Zhang (2008)
shows that the increase in credit risk in these two companies led to excess co-movement
in CDS spreads of all firms. These authors found that the co-movement quickly declined
after the two companies were downgraded, which is consistent with the low correlation in
2006.
Table 7. Pairwise Correlation Over Time and by Rating Groups
Table 7 shows the average pairwise correlation of all firms and by rating groups. Firms rated BAA and above are classified as investment-grade; firms rated BA and below are classified as speculative-grade. Panel A shows average pairwise correlations in the changes in CDS spreads; panel B shows average pairwise correlations in the changes in asset volatility. Panel A. Changes in CDS Spreads
Year All Firms Investment-Grade Speculative-Grade 2001 0.34 0.34 0.35 2002 0.23 0.22 0.29 2003 0.14 0.14 0.21 2004 0.20 0.21 0.28 2005 0.22 0.21 0.29 2006 0.12 0.13 0.13 2001–2006 0.21 0.21 0.23 Panel B. Changes in Asset Volatility


![arXiv:1506.01066v2 [cs.CL] 8 Jan 2016Visualizing and Understanding Neural Models in NLP Jiwei Li1, Xinlei Chen 2, Eduard Hovy and Dan Jurafsky1 1Computer Science Department, Stanford](https://static.documents.pub/doc/80x56/5f3ca7828612073ebc0229ca/arxiv150601066v2-cscl-8-jan-2016-visualizing-and-understanding-neural-models.jpg)


