Correlation of Seismic, Well Logging and Pyrolysis Analysis for Evaluating Hydrocarbon Potential – A Case
Study of Oil Fields in Muglad Basin, Sudan
Mohamed Elfatih Z. GANDOL1,2, Ram Raj MATHUR2,*, Ali A. M. EISAWI1
1Faculty of Petroleum and Minerals, Al Neelain University, Khartoum-12702, Sudan 2Department of Geophysics, Centre of Exploration Geophysics, Osmania University, Hyderabad-500007, India
Abstract The Muglad and Melut basins and the Baggara Graben form the oil and gas fields of Sudan and South Sudan. The reservoirs rich in hydrocarbon content are sandstones of the Aptian-Lower Albian Abu Gabra formation deposited during the first rifting phase. Integrated seismic data, well logs and Pyrolysis analysis were carried out to generate correlation models between Azraq, Bamboo and Heglig oil fields in the Muglad rift basin. The study was based on 6 seismic lines, 8 master logs, 4 wireline logs and 303 cutting samples selected from eight wells. The seismic profiles identified the structural effects of normal and reverse faults exist with horst and graben structures formed and give rise to parallel set of faults. The stratigraphic correlation model of well logs has established 12 main units in the Muglad basin, in good agreement with earlier studies. The Rock-Eval pyrolysis results of 303 samples carried out to assess the hydrocarbon content and to evaluate the source rock quality from the Azraq, Bamboo and Heglig wells indicate that the hydrocarbon potentiality of the Abu Gabra formation decreases from the north to south in agreement with the average Total Organic Carbon (TOC) values 2.34, 0.45 and 1.22% respectively. The average values of the Potential Hydrocarbons (S2) also support the TOC results. The correlation model developed from these studies show a general increase of the thickness from the north to south, which emphasizes the fact that the fault system is a result of tectonic rifting of the Muglad basin. The present approach has served as a correlation between the effect of the structural features and the hydrocarbon quality of the Muglad basin.
Keywords: Abu Gabra formation, Azraq, Bamboo, Heglig, TOC, Seismic, Well Logging, Rock-Eval pyrolysis analysis
Cite This Article: Mohamed Elfatih Z. GANDOL, Ram Raj MATHUR, and Ali A. M. EISAWI, “Correlation of Seismic, Well Logging and Pyrolysis Analysis for Evaluating Hydrocarbon Potential – A Case Study of Oil Fields in Muglad Basin, Sudan.” Journal of Geosciences and Geomatics, vol. 4, no. 4 (2016): 82-90. doi: 10.12691/jgg-4-4-2.
1. Introduction Exploration for oil and gas in Sudan and South Sudan
commenced in 1974. The exploration was initiated in the Muglad and Melut basins, and the Baggara Graben. The first discovery was made in 1979 at Abu Ghabra. The oil field wildcat-Abu Gabra-1 was the first successful oil well in Sudan.
The study area (Figure 1) includes three major oil fields in Sudan namely Heglig, Bamboo and Azraq fields, located in the Muglad basin, south west of Sudan. Muglad basin is a rift basin ([1,2]) which extends across the border of Sudan and the Republic of South Sudan (greater part) and comprises important oil fields in both countries. Muglad basin represents a significant part of the Central African Shear Zone which extends from Cameroon through Chad into Sudan. The basin is trending in NW-SE direction and approximately 1200 km in length and 300 km in width. It extends from the northern part at the Southern Darfur State, passes southwards through the
South Kordofan State in Sudan, the Upper Nile and the Equatorial States in South Sudan and link with the Anza Trough in northwestern Kenya. The northern end of the Muglad basin terminates against the uplifted basement complexes of the Darfur Dome, whereas the northwestern part ends at the Baggara basin which is an E–W trending sedimentary basin, that formed synchronous with the Muglad basin and other Cretaceous sedimentary basins of West and Central Africa.
The Muglad sedimentary basin is characterized by thick continental clastic sequences of Jurassic, Cretaceous age ([1,3]). The thickness of sediment cover is about 13,716 m deposited in the Kaikang Trough, the deepest part of the Muglad basin. The main drainage in the Muglad basin is the White Nile River and its tributaries Bahr Elgazal, Bahr El Arab and Bahr El Zaraf. The White Nile is flowing across the southern and the eastern parts of the Muglad basin. The southern part of the White Nile River is called Bahr El Jabal. The Khor Abu Habel and Wadi Khadari are significant drainage systems, while the Kordofan and Darfur are seasonal streams.
Journal of Geosciences and Geomatics 83
In the present paper we used the mud log and well log data to generate correlation models for the three oil fields in Heglig, Bamboo and Azraq in Muglad Basin, Sudan and South Sudan. From the 2-D seismic sections along these well sections the different structural and stratigraphic disposition of the sub-surface has been delineated. The hydrocarbon content is evaluated using the Rock-Eval analysis. The analysis includes Total Organic Carbon (TOC) ([4,5,6,7,8,9]) and the Potential Hydrocarbon parameter (S2) ([10,11,12]], which were used to generate a correlation model with the structural features inferred from the seismic and well sections.
Figure 1. Location map of the study area in South Sudan
2. Stratigraphy of the Muglad Basin
The Precambrian Basement Complex, the Upper Jurassic / Lower Cretaceous–Paleogene/ Neogene strata, the Paleogene/Neogene–Quaternary sediments of the Umm Rawaba [13] formation and the Superficial deposits [14] form the main stratigraphic units of the Muglad basin.
The basement complex in the Muglad basin is predominantly composed of Precambrian and Cambrian metamorphic rocks with limited occurrences of igneous rocks [1]. The lower strata, which is Late Jurassic / Early Cretaceous to Neogene age in the Muglad basin are non-marine sediments deposited in lakes, deltas, alluvial fans and fluvial environments. Based on the cyclic subdivision of the “Nubian Sandstone” of NW Sudan, the sedimentary rocks of the Muglad basin belong to the upper or the Nubian Cycle ([1,15]).
The basement rocks cropping at the NE, NW and SW edges of the Muglad basin constitute the elevated shoulders
of the rift basin. These rocks are part of the Sudanese shield and comprise a metamorphic terrain dating back to the Archean Era are intruded by local igneous formation. The evolution of these formations have undergone multiple deformation and re-deposition that ended with the Pan African Tectono Thermal Episode [16] at about 550 Ma. The core samples of the basement rocks in two wells in the NW Muglad area, Baraka-1 and Adila-1 have been studied and their primary composition being granitic and granodioritic gneisses are dated as 540 ±40 Ma [1].
Kaska [15] has established five spore/pollen zones for the Early Cretaceous to Paleogene non-marine sediments of the central Sudan. These zones are: Early Cretaceous, Middle Cretaceous, Late Cretaceous, Early Paleocene and Oligocene/Late Eocene. The discovered flora is related to the Africa–South America (ASA) flora province. As a result to the repeated rifting, subsidence and sedimentation, three coarsening upward cycles have formed (Figure 2).
Figure 2. A generalized stratigraphy of the Muglad basin [1]
The Muglad basin is structurally dominated by dip-slip normal faults. The three rifting cycles (Figure 2, [1,2,13,14,17,18]) resulted in a long complex history of horst and graben development and the formation of a highly complicated fault system.
Figure 3 shows two structural profile (X-X') across the Abu Gabra trend of northern Muglad basin and (Y-Y') across Unity trend of southern Muglad basin [1]. The predominant fault orientation is parallel or subparallel to the strike of the primary graben and basin margins. These longitudinal faults strike N40° – 50°W. Faults oblique to
84 Journal of Geosciences and Geomatics
the primary trends of the Muglad, Melut and Blue Nile basins are common. The complex history of these formations has depicted as rotated fault blocks, drape folds and reverse drag folds.
3. Geophysical Studies Figure 4 shows the location of six 2-D seismic profiles
(GN09-099-PSTM (1), GN09-098-PSTM (2), GN09-096-PSTM (3), GN09-093-PSTM (4), GN09-092-PSTM (5) and GN09-091-PSTM (6)) and the wells drilled in the study area. Core samples were collected from these exploratory wells and their depths are shown in Table 1.
Figure 3. Structural cross sections across Abu Gabra and Unity, Muglad basin [1]
Table 1. Depths of the wells in the oil fields Oil Field Well Depth (m)
Heglig Hamra SE-1 3739 Garad AG-1 4009
Bamboo Bamboo AG-1 4260 Jamouse NW-1 3581
Seyal N-1 3116
Azraq Azraq A-1 2766 Azraq C-3 2800
Azraq SW-1 3460
The well log analysis was carried out from the 8 Masterlogs and 4 wireline logs collected from these wells. For the Rock–Eval pyrolysis analysis 303 unwashed samples were collected from the oil fields. For the pyrolysis method the hydrocarbons (HC), carbon dioxide (CO2) and carbon monoxide (CO) evolved during both anoxic pyrolysis and oxidative pyrolysis phases have been measured.
The stratigraphic correlation model has been established by using available well logs for the eight study wells (Figure 5). The twelve main stratigraphic units in the Muglad basin from the oldest to youngest; Abu Gabra formation, Bentiu formation, Darfur Group (Aradieba, Zarga, Ghazal and Baraka formations), Kordofan Group (Amal, Nayil, Tandi, Adok and Zeraf formations) and the youngest sediments are Holocene deposits and Umm Rawaba formation have been identified from the well log correlations and their depths have been established.
Figure 4. Location map of the wells and seismic profiles
The depth of Abu Gabra formations from these wells ranges between 1084 to 1450 m in Azraq field, 2030 to 2379 m in Bamboo field and between 3077 to 3396 m in Heglig field. This large difference in the depths is due to the structural complexity in the Muglad basin. A second correlation model (Figure 6) prepared using four wireline logs of four wells adjacent to the seismic profiles also emphasize that the formations in Heglig area have greater depths and thickness than the Bamboo and Azrag areas. These findings are in collaboration with the structural map of the Muglad basin (Figure 3). Thus it can be inferred that the shallow depths of the rock formations in Azraq area are due to northern edges of the Muglad basin.
The interpreted seismic sections are shown in Figure 7 to Figure 12. These seismic sections have been interpreted
Journal of Geosciences and Geomatics 85
as the upper part of Abu Gabra formation which represents the interface between Bentiu Formation and Abu Gabra formation. Also, the upper part of the
basement which represents the younger surface of the Precambrian basement in the study area and are marked in the seismic sections.
Figure 5. Stratigraphic correlation model of the Muglad basin oil fields
Figure 6. Correlation model of four wells and seismic lines of Muglad basin oil fields
Figure 7. Interpreted seismic section of GN09-099-PSTM (1) profile
Fault locations are identified from the seismic images from the displacement of the formations ([19]). The interpreted faults for the seismic sections show that the major faults are parallel to each other and the minor faults do not show any relationship with the major faults.
86 Journal of Geosciences and Geomatics
Figure 8. Interpreted seismic section of GN09-098-PSTM (2) profile
Figure 9. Interpreted seismic section of GN09-096-PSTM (3) profile
The top of Abu Gabra formation was identified for three seismic profiles, GN09-098-PSTM, GN09-093-PSTM and GN09-092-PSTM as shown in Figure 8, Figure 9 and Figure 10. The interpretations of these seismic profiles are in collaboration with the Jamouse NW-1 well in which the Abu Gabra horizon was identified from well cores.
Figure 10. Interpreted seismic section of GN09-093-PSTM (4) profile
Figure 11. Interpreted seismic section of GN09-092-PSTM (5) profile
In GN09-099-PSTM seismic section (Figure 7) the two central major normal faults form a horst structure where
Journal of Geosciences and Geomatics 87
the block lies between these two faults is moved upward, which led to a shallower basement in the central portion of the oil fields. The basement horizon was picked at two way times (TWT) corresponding to 2200, 950 and 3450 msec. The variations in the arrival times indicate movements resulted from faulting.
The GN09-098-PSTM seismic section (Figure 8) in which Jamouse NW-1 well is intersected with the top of Abu Gabra formation was picked as a horizon at 2030 m. In this seismic section one major fault is in the central portion represented by a light blue color is identified as a normal fault (Figure 8). The Abu Gabra formation is at 650 and 1800 m sec and the top of the basement top at 1000 and 3200 m sec in this section.
In the GN09-096-PSTM (Figure 9) seismic section the fault in the middle of the section is a reverse fault. The basement horizons are observed at 2800, 3500 and 1100 m sec on the TWT section.
The shallower basement is observed to the right side of the profile on the GN09-093-PSTM (Figure 10) seismic section as observed by a normal fault and collaborates with the Jamouse NW-1 well data. The Abu Gabra formation was identified in this section at 1600 and 550 m sec. The basement was observed at 2650, 2800 and 800 m sec.
In GN09-092-PSTM section (Figure 11) the top of Abu Gabra formation was interpreted at the TWT of 400 and 1550 m sec, which is in correlation with the Jamouse NW-1 well. The basement depth is at 850 and 1100 m sec on either side of the normal fault as indicated by light green color in the seismic section.
The normal faults are indicated by green and yellow colors (Figure 12) which are due to the shallower basement depths on the right side of the seismic section of GN09-091-PSTM in the figure. The interpretation of the 2-D seismic sections indicates that the region of study is on the edge portion of the Muglad basin.
Figure 12. Interpreted seismic section of GN09-091-PSTM (6) profile
Figure 13. Variation of Total Organic Content (TOC) with depth in the Azraq exploratory oil wells
88 Journal of Geosciences and Geomatics
Figure 14. Variation of Total Organic Content (TOC) with depth in the Bamboo exploratory oil well
4. Pyrolysis Analysis
The range of the TOC values of the Abu Gabra formation as measured from the samples of the wells in the Azraq, Bamboo and Heglig oil fields is shown in Table 2. The TOC values of each individual well in these areas are shown in Figure 13, Figure 14 and Figure 15.
Figure 15. Variation of Total Organic Content (TOC) with depth in the Heglig exploratory oil wells
The TOC% averages in individual wells in the three oil fields are Azraq A-1 (1.88%), Azraq C-3 (2.14%), Azraq SW-1 (2.73%), Seyal N-1 (14%), Jamouse NW-1 (0.47%), Bamboo AG-1 (0.54%), Garad AG-1 (1.38%) and Hamra SE-1 (1.02%). From these values it can be inferred that the Hydrocarbon content for the Azra field is very good, for the Bamboo field is fair, while for the Heglig field it is fair to good (Table 2).
Table 2. TOC from well samples of the Abu Gabra formations Oil Field Range of TOC % Average TOC % Hydrocarbon
Quality Azraq 0.3 – 5.32 2.34 Very Good
Bamboo 0.03 – 1.98 0.45 Fair
Heglig 0.25 – 3.95 1.22 Fair to Good
The Potential Hydrocarbon (S2) in mg HC/g measured using the pyrolysis analysis from the samples of the wells in the Azraq, Bamboo and Heglig oil fields is shown in Table 3. The S2 averages measured in mg HC/g in individual wells in the three oil fields are Azraq A-1(7.83), Azraq C-3(10.17), Azraq SW-1(16.4), Seyal N-1(0.19), Jamouse NW-1(0.39), Bamboo AG-1(0.61), Garad AG-1(0.19) and Hamra SE-1(3.95). The S2 values indicate that the Hydrocarbon content of the Abu Gabra formation for the Azra field is very good, for the Bamboo field is fair to poor, while for the Heglig field it is fair to good (Table 3).
Table 3. Pyrolysis values (S2) HC/g of the Abu Gabra formations as obtained from well samples
Oil Field Pyrolysis values (S2) HC/g
Average S2 values HC/g
Hydrocarbon Quality
Azraq 0.37 – 38.38 12.38 Very Good
Bamboo 0.0 – 3.83 0.41 Poor to Fair
Heglig 0.19 – 3.95 1.22 Fair to Good
Journal of Geosciences and Geomatics 89
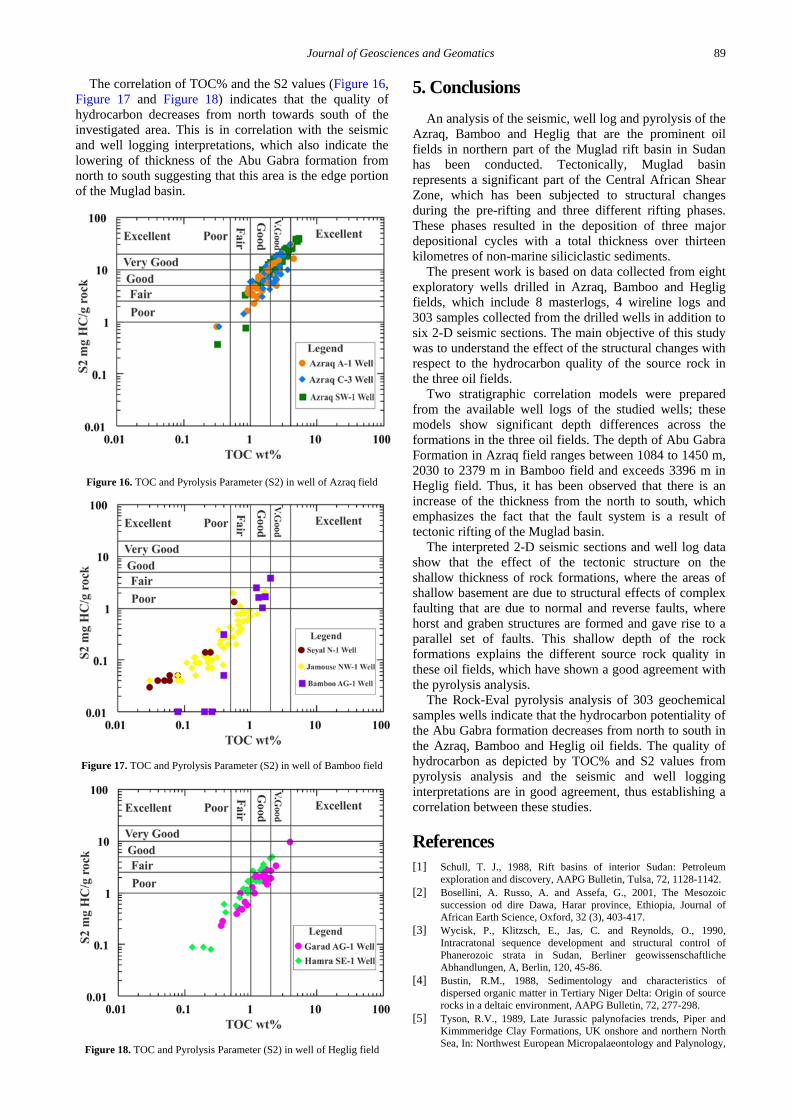
The correlation of TOC% and the S2 values (Figure 16, Figure 17 and Figure 18) indicates that the quality of hydrocarbon decreases from north towards south of the investigated area. This is in correlation with the seismic and well logging interpretations, which also indicate the lowering of thickness of the Abu Gabra formation from north to south suggesting that this area is the edge portion of the Muglad basin.
Figure 16. TOC and Pyrolysis Parameter (S2) in well of Azraq field
Figure 17. TOC and Pyrolysis Parameter (S2) in well of Bamboo field
Figure 18. TOC and Pyrolysis Parameter (S2) in well of Heglig field
5. Conclusions An analysis of the seismic, well log and pyrolysis of the
Azraq, Bamboo and Heglig that are the prominent oil fields in northern part of the Muglad rift basin in Sudan has been conducted. Tectonically, Muglad basin represents a significant part of the Central African Shear Zone, which has been subjected to structural changes during the pre-rifting and three different rifting phases. These phases resulted in the deposition of three major depositional cycles with a total thickness over thirteen kilometres of non-marine siliciclastic sediments.
The present work is based on data collected from eight exploratory wells drilled in Azraq, Bamboo and Heglig fields, which include 8 masterlogs, 4 wireline logs and 303 samples collected from the drilled wells in addition to six 2-D seismic sections. The main objective of this study was to understand the effect of the structural changes with respect to the hydrocarbon quality of the source rock in the three oil fields.
Two stratigraphic correlation models were prepared from the available well logs of the studied wells; these models show significant depth differences across the formations in the three oil fields. The depth of Abu Gabra Formation in Azraq field ranges between 1084 to 1450 m, 2030 to 2379 m in Bamboo field and exceeds 3396 m in Heglig field. Thus, it has been observed that there is an increase of the thickness from the north to south, which emphasizes the fact that the fault system is a result of tectonic rifting of the Muglad basin.
The interpreted 2-D seismic sections and well log data show that the effect of the tectonic structure on the shallow thickness of rock formations, where the areas of shallow basement are due to structural effects of complex faulting that are due to normal and reverse faults, where horst and graben structures are formed and gave rise to a parallel set of faults. This shallow depth of the rock formations explains the different source rock quality in these oil fields, which have shown a good agreement with the pyrolysis analysis.
The Rock-Eval pyrolysis analysis of 303 geochemical samples wells indicate that the hydrocarbon potentiality of the Abu Gabra formation decreases from north to south in the Azraq, Bamboo and Heglig oil fields. The quality of hydrocarbon as depicted by TOC% and S2 values from pyrolysis analysis and the seismic and well logging interpretations are in good agreement, thus establishing a correlation between these studies.
References [1] Schull, T. J., 1988, Rift basins of interior Sudan: Petroleum
exploration and discovery, AAPG Bulletin, Tulsa, 72, 1128-1142. [2] Bosellini, A. Russo, A. and Assefa, G., 2001, The Mesozoic
succession od dire Dawa, Harar province, Ethiopia, Journal of African Earth Science, Oxford, 32 (3), 403-417.
[3] Wycisk, P., Klitzsch, E., Jas, C. and Reynolds, O., 1990, Intracratonal sequence development and structural control of Phanerozoic strata in Sudan, Berliner geowissenschaftliche Abhandlungen, A, Berlin, 120, 45-86.
[4] Bustin, R.M., 1988, Sedimentology and characteristics of dispersed organic matter in Tertiary Niger Delta: Origin of source rocks in a deltaic environment, AAPG Bulletin, 72, 277-298.
[5] Tyson, R.V., 1989, Late Jurassic palynofacies trends, Piper and Kimmmeridge Clay Formations, UK onshore and northern North Sea, In: Northwest European Micropalaeontology and Palynology,
90 Journal of Geosciences and Geomatics
Batter, D.J., Keen, M.C. (Eds.), the British Micropalaeontological Society Series, Ellis Horwood, Chichester, 135-172.
[6] Tyson, R. V., 1995, Sedimentary Organic Matter: Organic Facies and Palynofacies, Chapman and Hall, London.
[7] Jarvie, D.M., 1991, Total Organic Carbon (TOC) analysis: In: Source and migration processes and evaluation techniques, Merril, R.K. (Ed.), Tulsa, Treatise of Petroleum Geology. AAPG Bulletin, 113-118.
[8] Bordenave, M.L., Espitalié, J., Laplat, P., Oudin, J. L., Vandenbrouke, M., 1993, Screening techniques for source rock evaluation, In: Applied Petroleum Geochemistry, Bordenave, M.L. (Ed.), Editions Technip, Paris, 217-279.
[9] Behar, F., Beaumont, V., and Penteado, H.L. De B., 2001, Rock-Eval Technology: Performances and developments, Oil and Gas Science and Technology - Rev. IFP., 56 (2), 111-134.
[10] Espitalié J., Madec M., Tissot B., Mennig J.J., Leplat P., 1977, Source rock characterization method for petroleum exploration, In: Annual Offshore Techn. Conference, 9th, Proceedings, 439-444.
[12] Rezaee, R., 2002, Petroleum Geology:, Alavi Publication.
[13] Ahmed, A. S., 1983, Geology of south central Sudan basin, lithostratigraphy and sedimentary evolution, M. Sc. Thesis, University of Khartoum, Khartoum, Sudan.
[14] Vail, J. R., 1978, Outline of the geology and mineral deposits of the Democratic Republic of Sudan and adjacent areas, Overseas Geol. Miner. Resour., London, 49.
[15] Kaska, H.V., 1989, A spore and pollen zonation of the Early Cretaceous to Tertiary non-marine sediments of Central Sudan:, Palynology 131, 79–90.
[16] Schandelmeier, H., Klitzsch, E., Hendriks, F. and Wycisk, P., 1987, Structural developments of north-east Africa since Precambrian times Berliner geowissenschaftliche Abhandlungen, A, Berlin, 75, 5-24.
[17] El Shafie, A. A., 1975, Lithology of the Umm Rawaba Formation and its Paleageography in connection with water problems, Sudan, Ph.D. Thesis, geological Exploration Institute, Moscow.
[18] Fairhead, J. D., 1988, Mesozoic plate tectonic reconstruction of the central south Atlantic Ocean: The role of the west and central African rift system, Tectonophysics, 155, 181-195.
[19] Sheriff, R. E. and Geldart L. P., 1995, Exploration Seismology, Cambridge University Press.


![Application of Remote Sensing for the Mapping of ...pubs.sciepub.com/jgg/2/5/3/jgg-2-5-3.pdf · development of composite S0/S1/S2 fabrics (Figure 2a). The D 2 tangential phase [5],](https://static.documents.pub/doc/80x56/5ed5c7be3e6f6128a847c2ce/application-of-remote-sensing-for-the-mapping-of-pubs-development-of-composite.jpg)


