35
CORRELATION
| Date post: | 14-Dec-2015 |
| Category: |
Documents |
| Upload: | bella-priestly |
| View: | 242 times |
| Download: | 1 times |
CORRELATION

Overview of Correlation
What is a Correlation? Correlation Coefficients Coefficient of Determination Test for Significance Correlation and Causality Partial and Part Correlations
What is a Correlation?
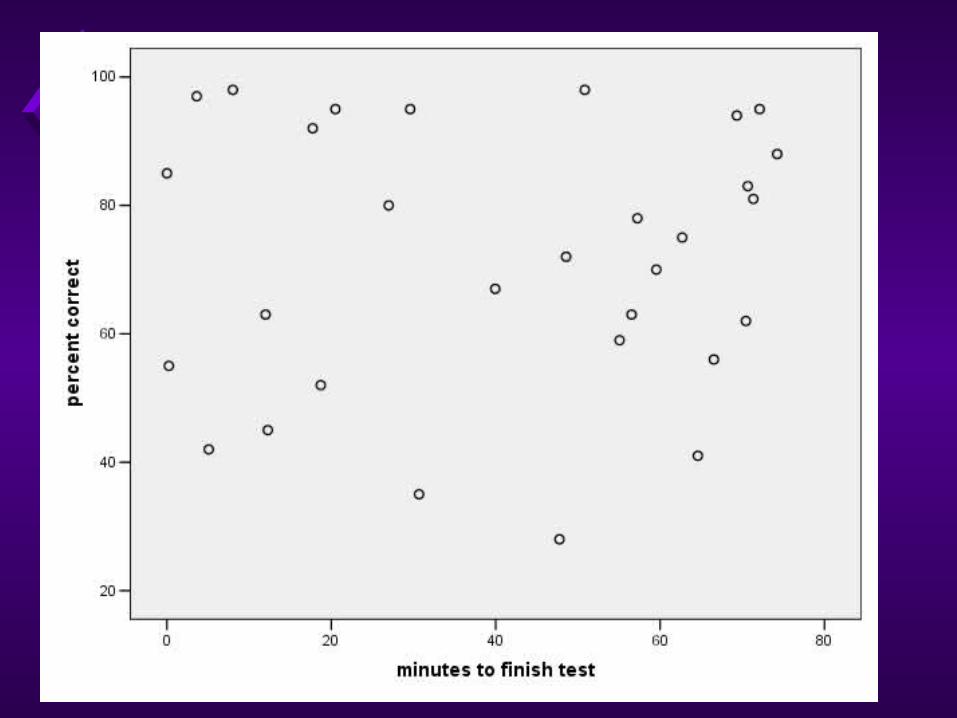
Degree of linear relationship between variables
Each individual is measured on both variables
What is a Correlation?
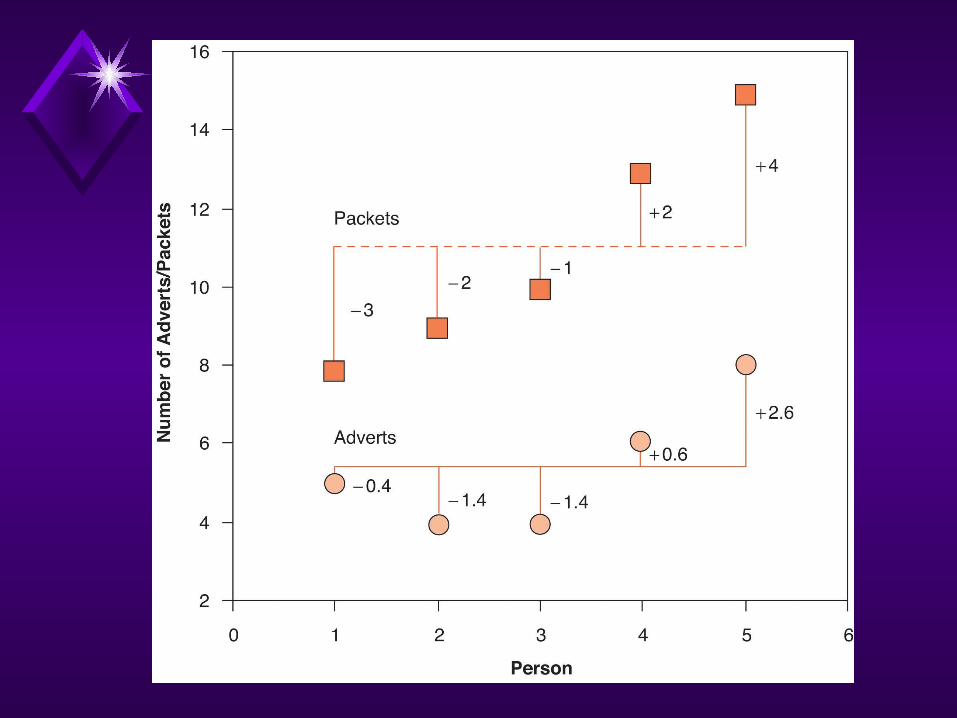
Comparison of the way scores deviate from their means on the two variables
Standardized covariance
Cross-Product Deviation
Find the difference between each person’s scores and the mean of the variable (deviation).
For each person, multiply the two deviations together.
Do the deviations tend to go in the same direction?

Covariance
Add up all the cross-product deviations and average them.
The more covariance, the more the two variables go together, or co-vary.
Covariance is not standardized, so it’s hard to interpret.
Pearson r
Standardized covariance Used for two interval/ratio
variables Varies from -1 to +1
Pearson r
Absolute value indicates strength of relationship .1 - small .3 - medium .5 - large

Pearson r
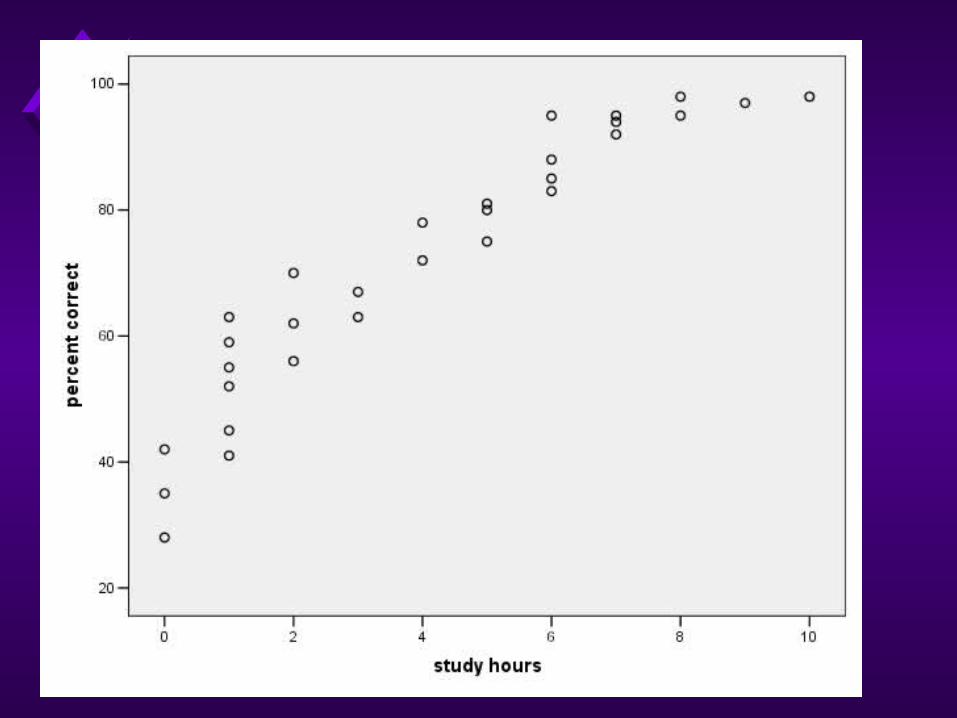
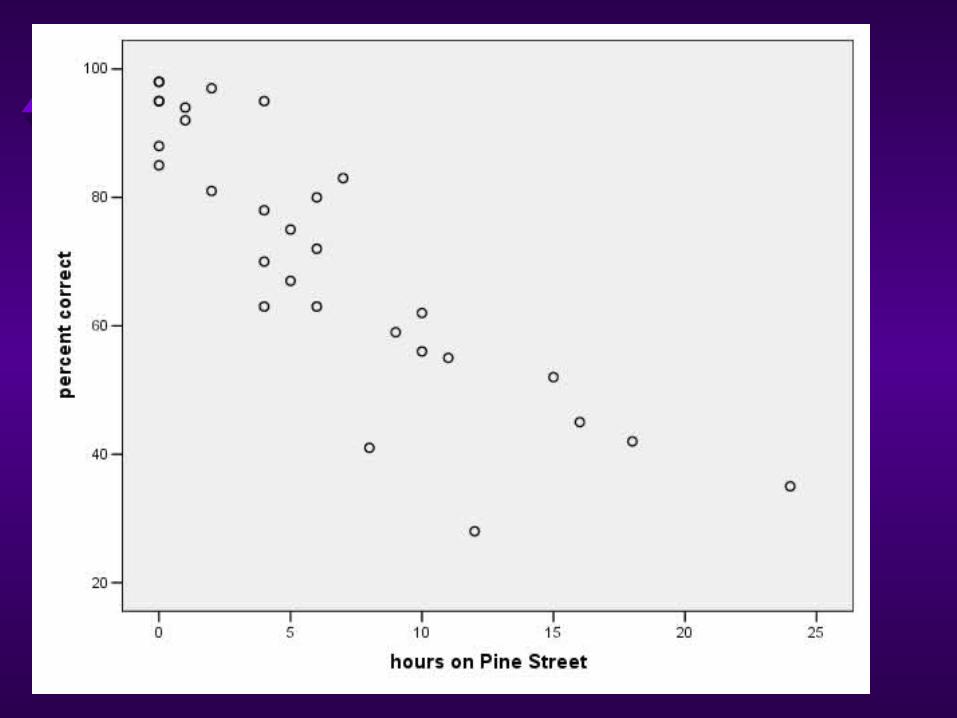
Sign indicates direction of correlation Positive: increases on one variable
correspond to increases on the other variable
Negative: increases on one variable correspond to decreases on the other variable


Other Correlation Coefficients
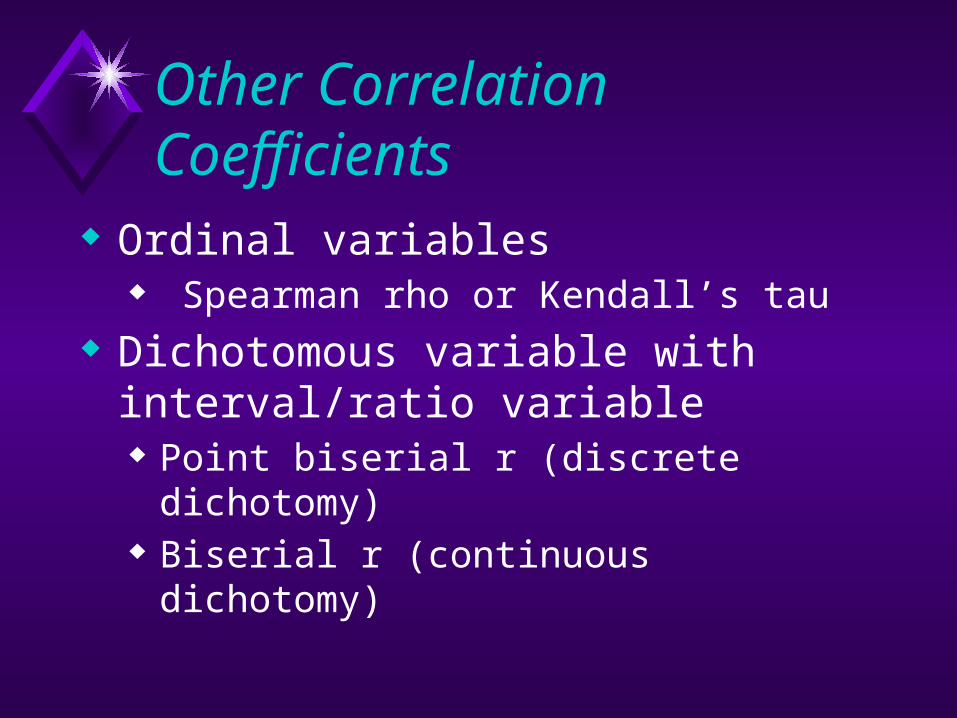
Ordinal variables Spearman rho or Kendall’s tau
Dichotomous variable with interval/ratio variable Point biserial r (discrete dichotomy) Biserial r (continuous dichotomy)

Other Correlation Coefficients
Two dichotomous variables Phi coefficient
About Dichotomous Variables
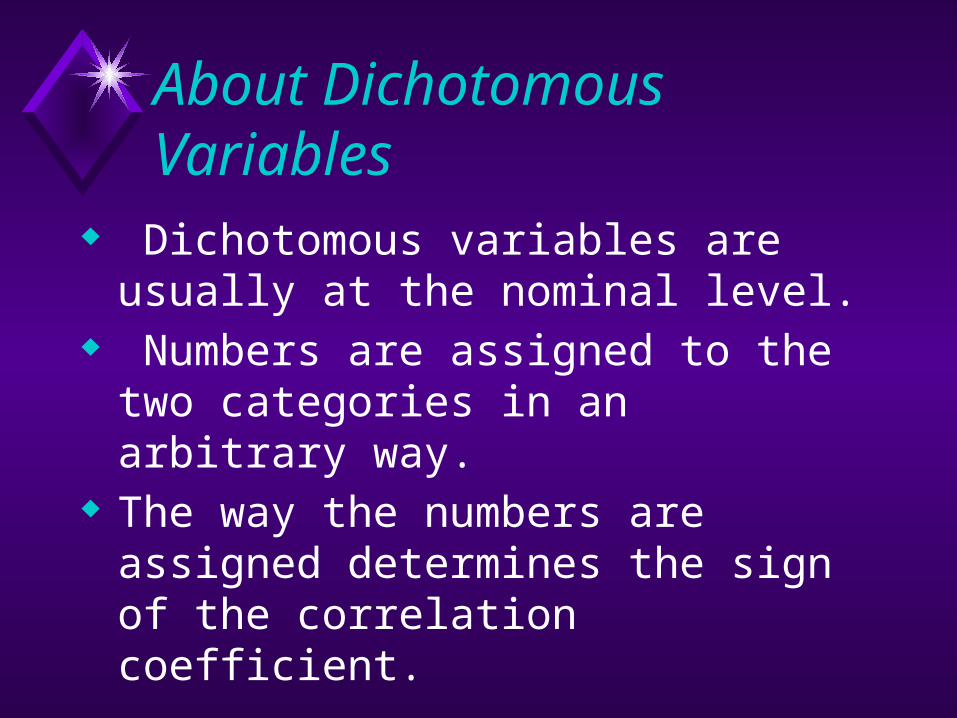
Dichotomous variables are usually at the nominal level.
Numbers are assigned to the two categories in an arbitrary way.
The way the numbers are assigned determines the sign of the correlation coefficient.
Review Question!
How is covariance related to the correlation coefficient?
Coefficient of Determination
Measures proportion of explained variance in Y based on X
r2
Testing r for Significance
Null hypothesis is usually that r is zero in the population.
One tailed vs. two-tailed

Assumptions
Appropriate types of data Independent observations Normal distributions Linear relationship
Example APA format
The Pearson r was computed between rated enjoyment of frog legs and level of neuroticism. The correlation was statistically significant, r(58) = .28, p = .03.
Review Question
If r = .28, then r2 = .08. What does the .08 represent?
Review Question!
If p = .03, what probability does the .03 represent? There is a 3% chance of…..?

Correlation and Causality
A correlation by itself does not show that one variable causes the other.
A correlation may be consistent with a causal relationship.
The Third Variable Problem
A correlation between X and Y could be caused by a third variable influencing both X and Y.
The Directionality Problem
A correlation between X and Y could be a result of X causing Y or Y causing X.

Partial Correlation Used to “partial out” the effects of a
third variable (X2) on the relationship between X1 and Y
Correlation between X1 and Y with the influence of X2 removed from both X1 and Y

YX1
X2
Partial r2

Interpreting Partial Correlations
Compare the simple bivariate correlation to the partial correlation.
If the partial correlation is lower, it suggests that X2 is mediating the relationship between X1 and Y.
Part Correlation
Also called: semi-partial correlation Correlation between X1 and Y with
the influence of X2 (and other predictor variables) removed from just X1
Indicates amount of unique variance in Y explained by X1
Used in Multiple Regression Analysis

X2
X1
Part r2
Y

YX1
X2
Partial r2

Choosing Stats
Patrons at a bar are randomly assigned to one of three information conditions. In one condition, they taste a beer without being given any information about it. In a second condition, they are told that it is an inexpensive brand of beer. In a third condition, they are told that it is an expensive brand of beer. Their ratings of the taste quality are compared across the three conditions.


