28
Correlation
| Date post: | 16-Dec-2015 |
| Category: |
Documents |
| Upload: | austin-hutchinson |
| View: | 219 times |
| Download: | 2 times |

Correlation

The ProblemThe Problem
• Are two variables related?Are two variables related? Does one increase as the other increases?Does one increase as the other increases?
• e. g. skills and incomee. g. skills and income
Does one decrease as the other increases?Does one decrease as the other increases?• e. g. health problems and nutritione. g. health problems and nutrition
• How can we get a numerical measure How can we get a numerical measure of the degree of relationship? of the degree of relationship?

ScatterplotsScatterplots
• Examples from textExamples from text See next three slidesSee next three slides
• Infant mortality and number of Infant mortality and number of physiciansphysicians
• Life expectancy and health care Life expectancy and health care expendituresexpenditures
• Cancer rate and solar radiationCancer rate and solar radiation
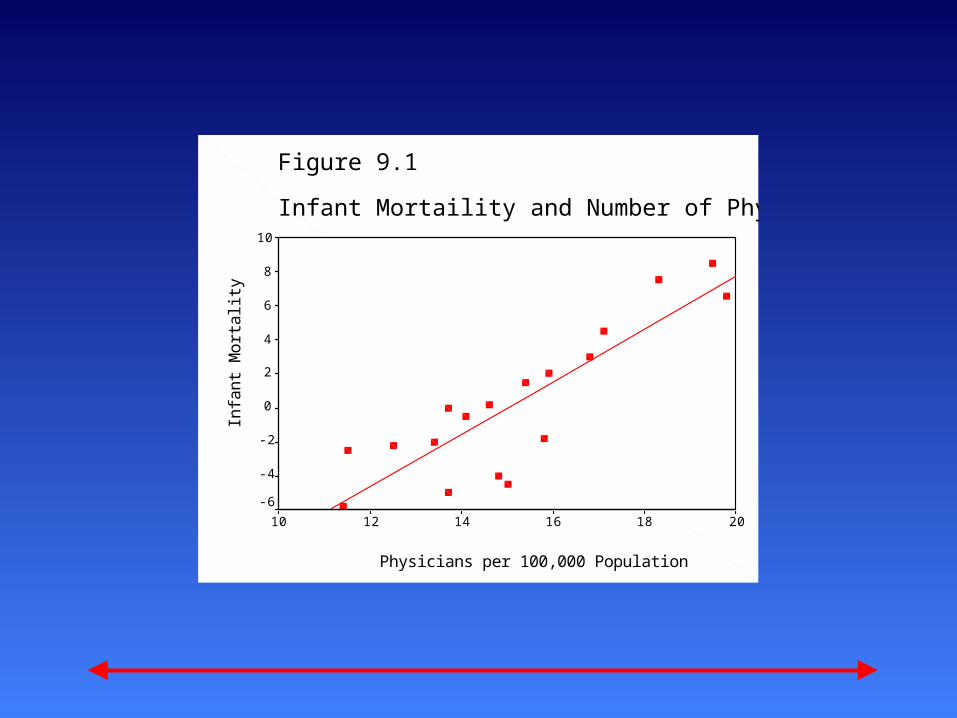
Figure 9.1
Infant Mortaility and Number of Physicians
Physicians per 100,000 Population
201816141210
Infa
nt
Mo
rta
lity
10
8
6
4
2
0
-2
-4
-6

Figure 9.2
Life Expectancy and Health Care Costs
Health Care Expenditures
1600140012001000800600400200
Life
Exp
ect
an
cy (
Ma
les)
74
73
72
71
70
69
68
67
66

Figure 9.3
Cancer Rate and Solar Radiation
Solar Radiation
600500400300200
Bre
ast
Ca
nce
r R
ate
34
32
30
28
26
24
22
20

An ExampleAn Example
• An actual course with both a lab and An actual course with both a lab and an exam component of final gradesan exam component of final grades
• Plotting exam component against Plotting exam component against lab componentlab component Fairly weak relationshipFairly weak relationship
Relationship is positiveRelationship is positive

Total Points in Lab
20018016014012010080
Tota
l Po
ints
on
Exa
ms
140
120
100
80
60 Rsq = 0.1368

Exams and LabsExams and Labs
• Note relationship is weak, but real.Note relationship is weak, but real.
• Note most data cluster on right.Note most data cluster on right.
• Why do we care about relationship?Why do we care about relationship? What would students conclude if there were What would students conclude if there were
no relationship?no relationship?
What if the relationship were near perfect?What if the relationship were near perfect?
What if the relationship were negative?What if the relationship were negative?

Heart Disease and Heart Disease and CigarettesCigarettes
• Landwehr & Watkins report data on Landwehr & Watkins report data on heart disease and cigarette smoking heart disease and cigarette smoking in 21 developed countriesin 21 developed countries
• Data have been rounded for Data have been rounded for computational convenience.computational convenience. The results were not affected.The results were not affected.

The DataThe DataCigarette Consumption and Coronary Heart Disease Mortality for 21 Countries
Cig. 11 9 9 9 8 8 8 6 6 5 5CHD 26 21 24 21 19 13 19 11 23 15 13
Cig. 5 5 5 5 4 4 4 3 3 3CHD 4 18 12 3 11 15 6 13 4 14
Cig. = Cigarettes per adult per dayCHD = Cornary Heart Disease Mortality per 10,000 population
Surprisingly, the U.S. is the first country on the list--the country with the highest consumption and highest mortality.

Scatterplot of Heart Scatterplot of Heart DiseaseDisease
• CHD Mortality goes on ordinateCHD Mortality goes on ordinate Why?Why?
• Cigarette consumption on abscissaCigarette consumption on abscissa Why?Why?
• What does each dot represent?What does each dot represent?
• Best fitting line included for clarityBest fitting line included for clarity

Cigarette Consumption per Adult per Day
12108642
CH
D M
ort
alit
y p
er 1
0,00
0
30
20
10
0
{X = 6, Y = 11}

What Does the Scatterplot What Does the Scatterplot Show?Show?
• As smoking increases, so does As smoking increases, so does coronary heart disease mortality.coronary heart disease mortality.
• Relationship looks strongRelationship looks strong
• Not all data points on line.Not all data points on line. This gives us “residuals” or “errors of This gives us “residuals” or “errors of
prediction”prediction”• To be discussed laterTo be discussed later

Correlation CoefficientCorrelation Coefficient
• A measure of degree of relationship.A measure of degree of relationship.
• Sign refers to direction.Sign refers to direction.
• Based on covarianceBased on covariance Measure of degree to which large Measure of degree to which large
scores go with large scores, and small scores go with large scores, and small scores with small scoresscores with small scores

CovarianceCovariance
• The formulaThe formula
• How this works, and whyHow this works, and why
• When would covWhen would covXYXY be large and positive? be large and positive?
• When would covWhen would covXYXY be large and negative? be large and negative?
1))((
NYYXX
CovXY

Correlation CoefficientCorrelation Coefficient
• Symbolized by Symbolized by rr
• Covariance Covariance ÷÷ (product of st. dev.) (product of st. dev.)
YX
XY
ssCov
r

CalculationCalculation
• CovCovXYXY = 11.13 = 11.13
• ssXX = 2.33 = 2.33
• ssYY = 6.69 = 6.69
71.59.1513.11
)69.6)(33.2(13.11cov
YX
XY
ssr

Correlation--cont.Correlation--cont.
• Correlation = .71Correlation = .71
• Sign is positiveSign is positive Why?Why?
• If sign were negativeIf sign were negative What would it mean?What would it mean?
Would not alter the Would not alter the degreedegree of relationship. of relationship.

Factors Affecting Factors Affecting rr
• Range restrictionsRange restrictions See next slideSee next slide
• Data only for countries with low consumptionData only for countries with low consumption
• NonlinearityNonlinearity e.g. age and size of vocabularye.g. age and size of vocabulary
• Heterogeneous subsamplesHeterogeneous subsamples Everyday examplesEveryday examples

Countries With Low Countries With Low ConsumptionsConsumptionsData With Restricted Range
Truncated at 5 Cigarettes Per Day
Cigarette Consumption per Adult per Day
5.55.04.54.03.53.02.5
CH
D M
ort
alit
y p
er
10
,00
0
20
18
16
14
12
10
8
6
4
2

Testing Testing rr
• Population parameter = Population parameter =
• Null hypothesis Null hypothesis HH00: : = 0 = 0
Test of linear independenceTest of linear independence
What would a true null mean here?What would a true null mean here?
What would a false null mean here?What would a false null mean here?
• Alternative hypothesis (Alternative hypothesis (HH11) ) 0 0
Two-tailedTwo-tailed

Tables of SignificanceTables of Significance
• Table in Appendix E.2Table in Appendix E.2
• For For NN - 2 = 19 - 2 = 19 dfdf, , rrcritcrit = .433 = .433
• Our correlation > .433Our correlation > .433
• Reject Reject HH00 Correlation is significant.Correlation is significant. Greater cigarette consumption associated with Greater cigarette consumption associated with
higher CHD mortality.higher CHD mortality.

Computer PrintoutComputer Printout
• Printout gives test of significance.Printout gives test of significance.
• See next slide.See next slide. Double asterisks with footnote indicate Double asterisks with footnote indicate pp < .01. < .01.

SPSS PrintoutSPSS PrintoutCorrelations
.713**
.000
21
PearsonCorrelationSig.(2-tailed)NPearsonCorrelationSig.(2-tailed)N
CigaretteConsumption perAdult per Day
CHD Mortalityper 10,000
CigaretteConsumptionper Adult per
Day
CHDMortality per10,000
Correlation is significant at the 0.01 level(2-tailed).
**.

Intercorrelation MatrixIntercorrelation Matrix
• Matrix of correlations of several variables Matrix of correlations of several variables at once.at once.
• Example from Kliewer et al (1998) Example from Kliewer et al (1998) JCCPJCCP 99 young children99 young children
Measured level ofMeasured level of• Witness violence, Intrusive thoughts, Social Witness violence, Intrusive thoughts, Social
support, and Internalizing symptomssupport, and Internalizing symptoms
Define these variablesDefine these variables

Cont.

Intercorrelation Matrix--Intercorrelation Matrix--cont.cont.
• Describe the table.Describe the table.
• What does this tell us about the What does this tell us about the effects of witnessing violence?effects of witnessing violence?
• What role does social support play?What role does social support play?


