CORRELATIONS BETWEEN STRUCTURE ANDFUNCTION IN THE DESIGN OF THE BAT LUNG:
A MORPHOMETRIC STUDY
BYJ. N. MAINADepartment of Veterinary Anatomy, University of Nairobi,
P.O. Box 30197, Nairobi, Kenya
AND A. S. KING
Department of Veterinary Anatomy, University of Liverpool,P.O. Box 147, Liverpool L69 3BX, England
Accepted 12 December 1983
SUMMARY
1. The lungs of five species of bat Pipistrellus pipistrellus, Miniopterusminor (Peters), Tadarida mops (De Blainville), Cynopterus brachyotis(Muller) and Cheiromeles torquatus (Horstield) have been analysed bymorphometric techniques.
2. The mean body weight (W) ranged from 5 g in Pipistrellus pipistrellusto 1732 in Cheiromeles torquatus; the lung volume (VL) ranged from0-3 cm in Pipistrellus to 10cm3 in Cheiromeles.
3. The volume densities or the main components of the bat lung, namelythe parenchyma [Vv(p,L)] (the gas exchange region) and the non-parenchyma [Vv(np,L)], were closely similar, the Vv(p,L) constituting amean value of 84-2% and the Vv(np,L) 15-8% in the five species.
4. The VL, the surface area of the blood-gas (tissue) barrier (St), thepulmonary capillary blood volume (Vc), and the total morphometric pul-monary diffusing capacity (DL02) were all strongly correlated with bodyweight. The harmonic mean thickness of the blood-gas (tissue) barrier (iht)and the surface density of the blood-gas (tissue) barrier [Sv(t,p)] werepoorly correlated with W.
5. The bats had a remarkably higher VL than either birds or terrestrialmammals. The Vc in the bat lung was similar to that in the bird lung buthigher than that of the terrestrial mammals. The bats had a more extensiveSt than either the birds or the terrestrial mammals. In the bats the iht wasthicker than in the birds but thinner than that of the terrestrial mammals.These pulmonary structural adaptations culminated in a higher DL02 in thebat than either in the birds or in the terrestrial mammals.
6. The superior morphometric properties of the bat lung coupled withthe established physiological adaptations may help to explain how the batlung is capable of providing the immense amount of oxygen demanded byflight.
Reprint requests to J. N. Maina.Key words: Bat, lung, morphometry.
44 J. N. MAINA AND A. S. KING
INTRODUCTION
Bats are unique among mammals in their capacity for continuous flapping flight(Greenhall & Paradiso, 1968; Wimsatt, 1970; Thomas & Suthers, 1972; Dawson,1975; Yalden & Morris, 1975; Thomas, 1975, 1980; Walker, 1975; Jurgens, Bartels& Bartels, 1981). Bats have thus been able to exploit widely dispersed ecologicalniches, and consequently show a remarkable adaptive radiation giving rise to about1000 out of the 4200 mammalian species (Wimsatt, 1970; Thomas & Suthers, 1972;Yalden & Morris, 1975). Windtunnel experiments (Tucker, 1972; Carpenter, 1975;Thomas, 1975) have shown that flapping flight is energetically a very demandingform of exercise, being substantially beyond the energetic capacity of terrestrialmammals of similar size during maximum exercise. For example, a budgerigar flyinghorizontally at its most economical speed increases its oxygen consumption to about13 times its standard metabolic rate, which is about 1-5 times the oxygen consump-tion of a mouse running hard in an exercise wheel (Tucker, 1968a,b). In turbulentair or when ascending the bird increases its oxygen consumption for short periodsby about 20-30 times, whereas even a good human athlete can achieve for a fewminutes an increase of only 15-20 times (Tucker, 1969). Bats have been shown toincrease their oxygen consumption during sustained flight by at least 20 times(Bartholomew, Leitner & Nelson, 1964; Carpenter, 1975). In general, the energeticsof bat flight appear to be comparable to that of birds (Studier & Howell, 1969;Thomas & Suthers, 1972; Carpenter, 1975; Dawson, 1975; Thomas, 1975; Jurgenset al. 1981).
The general anatomy of bats is, of course, fundamentally similar to that ofterrestrial mammals (Yalden & Morris, 1975), and in at least one species the generalmicroscopic structure of the pulmonary parenchyma is known to resemble that ofother mammals (Maina, King & King, 19826). In contrast, birds have evolvedvoluminous air sacs which continuously and undirectionally ventilate the compact,rather rigid lung (for review of anatomy see King, 1966; Duncker, 1971; for physi-ology see Schmidt-Nielsen, 1975; Scheid, 1979). Moreover the blood-gas relation-ship in the avian parabronchus is cross-current as opposed to the uniform pool in thepulmonary alveoli of bats and all other mammals (Scheid & Piiper, 1970; Piiper &Scheid, 1973). The cross-current design is functionally superior to the uniform pool,since a higher degree of arterialization can be attained for an equal degree of ventila-tion (Scheid & Piiper, 1970; Schmidt-Nielsen, 1975; Piiper & Scheid, 1973).Furthermore, examination of the structure of the exchange tissue of the avian lung bymorphometric methods indicates that pulmonary parameters such as the thinness ofthe blood—gas barrier and the surface area of the barrier per gram body weight aresuperior in birds as compared with mammals generally, leading to a higher anatomicaldiffusing capacity for oxygen per gram body weight in birds than in mammals (Maina& Settle, 1982).
Despite having an essentially mammalian type of lung, bats nevertheless appear tohave an exercise capacity as good as that of birds. The question then arises, might thebat lung possess subtle structural adaptations such as can only be disclosed bymorphometric methods? This conclusion was indeed reached by Maina & Nicholson(1982) and Maina et al. (19826) from quantitative observations on the lung of a
Morphometry of the bat lung 45
• t {Epomophorus wahlbergi). However, this is the only exhaustive publishedmorphometric study of the bat lung and was limited to a single species.
The present investigation expands our previous work on Epomophorus by extendingmorphometric techniques to the lungs of five additional bat species of widely differingbody weights and modes of life. Comparisons are made with corresponding data fromthe lungs of birds and terrestrial mammals.
MATERIALS AND METHODS
Definitions of symbols used in the tables and text
Deo2 - diffusing capacity (conductance) of the erythrocyte for oxygen.DL02 - total morphometric pulmonary diffusing capacity for oxygen.Dmo2 - membrane diffusing capacity for oxygen.Dpo2 - diffusing capacity of the plasma layer for oxygen.Dto2 — diffusing capacity of the tissue barrier for oxygen.He - pulmonary capillary haematocrit.Kpo2 — physical coefficient for permeation of the plasma layer by oxygen.Kto2 ~ physical coefficient for permeation of the tissue barrier by oxygen.Sa - surface area of the alveolar epithelium.Sc - surface area of the capillary endothelium.Se - surface area of the intracapillary erythrocytes.Sp - surface area of the plasma layer.St - surface area of the tissue (blood-gas) barrier.Va - volume of the alveoli.Vc — volume of the capillary blood.Ve - volume of the erythrocytes.VL - volume of the lung.Vnp - volume of the non-parenchymatous regions of lungs.Vp - volume of the parenchyma (gas exchange) tissue.Vt — volume of the tissue of the interalveolar septa.W — body weight.O02 - coefficient for oxygen uptake by whole blood.ihp — harmonic mean thickness of the plasma layer.tht - harmonic mean thickness of the tissue barrier.ft - arithmetic mean thickness of the tissue barrier.Vv(p,L) - volume density of the parenchyma, i.e. Vp/VL.Vv(np,L) — volume density of the non-parenchymatous tissue, i.e. Vnp/VL.Sv(t,p) - surface density of the tissue (blood-gas barrier), i.e. St/Vp.
The lungs of 24 wild specimens of adult bats of mixed sexes from five specieshave been analysed by morphometric techniques. The bats were killed soon aftercapture by an intraperitoneal injection with barbiturate, and weighed at once. Thesubsequent procedure for fixation, processing and analysis of the lungs wasessentially similar to that adopted by Maina et al. (19826), but the main points
feere as follows.
46 J. N. MAINA AND A. S. KING
Table 1. The species investigated in this study
Species Suborder Family Descriptive English names
Pipistrellus pipistrellus* microchiroptera vespertilionidae ordinary bat, pipistrelleMiniopterus minorf microchiroptera vespertilionidae ordinary bat, long-winged batTadarida mops\ microchiroptera molossidae free-tailed batCynopterus brachyotisX megachiroptera pteropodidae fruit bat, flying foxes, short-nosed
fruit batCheiromeles torquatus% microchiroptera molossidae free-tailed bat, hairless bat
'Pipistrellus was caught in Scotland (U.K.).tMiniopterus was caught in Kenya.J Tadarida, Cynopterus and Cheiromeles was caughtin Malaysia.
Immediately after death an incision was made just caudal to the xiphisternum andthe diaphragm carefully perforated (avoiding puncturing the lungs) on both sides ofthe mediastinum; this created a pneumothorax which caused the lungs to collapse.The trachea was then cannulated and the lungs fixed in situ by intratracheal infusionwith 2-3% glutaraldehyde buffered in sodium cacodylate (pH7-4, total osmolarity350 mosmol I"1). The infusion was done by gravity from a height of 25 cm above thesupine body. When the fixative stopped flowing the trachea was ligated caudal to thecannula. The volumes of the left and right lungs were estimated by the water displace-ment method of Scherle (1970).
Electron microscopyOne complete transverse slice was taken from each of the lobes of the lung and diced
into small pieces (about 2 mm3) for electron microscopy. These pieces were postfixedin 2 % osmium tetroxide, block stained in 2 % uranyl acetate in maleic acid, anddehydrated in graded ethanol (starting at 50 %) and acetone before infiltration andembedding in Taab resin. Two blocks were taken at random from a group derivedfrom each of the lobes and trimmed to eliminate non-parenchymal tissue; ultrathinsections were cut, counterstained with lead citrate, and examined electron micro-scopically. Five electron micrographs (from each block) were taken from predeter-mined corners of the grid squares (to avoid bias) of the first technically adequatesection at a primary magnification of X3000, and the subsequent analysis was perfor-med at about X7500 with a superimposed quadratic lattice grid. This magnificationwas found to be optimal as it gave a relatively large field but still enabled the requisiteparenchymal components to be identified and quantified. A total of 50 micrographswas analysed for each animal. Point counting was employed to estimate volumes,intersection counting to estimate surface areas, and intercept length measurement toestimate harmonic mean thicknesses (Weibel, 1970/71). The arithmetic mean thick-ness of the tissue barrier was estimated by a random short line test grid (Weibel &Knight, 1964). The surface density of the tissue barrier was calculated from its surfacearea and parenchymal volume. The surface area of the plasma layer was estimated asthe mean of the surface area of the capillary endothelium (Sc) and that of the erythro-cytes (Se) (Weibel, 1970/71). In case of an overlap of erythrocytes only the inter-sections of the test grid with the outer surface of the erythrocytes (the surface directly
Journal of Experimental Biology, Vol. I l l F ig . 1
J. N. MAINA AND A. S. KING (Faang p. -4
Morphometty of the bat lung 47
•jacent to the endothelium) were considered, this avoids an overestimate of Se andconsequently Sp. As plasma is more of a layer than a surface it was thought reasonableto estimate its surface area (Sp) from the areas of its two boundaries, the endotheliumand erythrocytes. The morphometric pulmonary diffusing capacities (conductances)for oxygen of the tissue barrier (Dtc^), plasma (Dpo2), and erythrocyte (Deo2) werecalculated using the physical coefficients for oxygen permeation of the tissue barrier
and plasma layer (Kpoz), and the coefficient for oxygen uptake by whole blood, as estimated for mammalian tissue and cited by (Weibel, 1970/71). The value
of 002 was adjusted for a venous haematocrit of 60 % reported in a bat by Thomas &Suthers (1972). The membrane diffusing capacity for oxygen (D11102) a nd the totalmorphometric pulmonary diffusing capacity (DLo2) were calculated from theindividual serial conductances, the model used being that developed by Weibel(1970/71).
Light microscopy
The remaining parts of the lobes were cut in 7 /im serial transverse paraffin sections.Three sections were taken from each lobe at predetermined equidistant intervals,stained with haematoxylin and eosin and analysed for the volume density of theparenchyma (tissue involved in gas exchange) and of the non-parenchyma by pointcounting using a 100 point Zeiss integrating graticule at X200 magnification. Theabsolute volumes of these two components could then be calculated from the volumeof the lungs.
RESULTS
The results are summarized in Tables 2-8. In Cheiromeles torquatus and Cynop-terus brachyotis the alveoli constituted 91% and 92% respectively of the paren-chyma, while the lowest value (81 %) was observed in Pipistrellus pipistrellus, themean for all five species being 87 %. The mean volume densities of the pulmonaryblood capillaries and the tissue of the interalveolar septa in the five species of bat were7% and 6% respectively. The components of the parenchyma, and the blood gasbarrier are shown in Fig. 1.
The surface areas of the resistance barriers constituting the air haemoglobin pathway,namely the blood-gas (tissue) barriers (St), alveolar epithelium (Sa), capillary endo-thelium (Sc), and the erythrocytes (Se), are shown in Table 4. St is functionally a
Fig. 1. (A) A scanning electron micrograph of the bat lung showing the non-parenchymatous regionrepresented by a terminal bronchus (Tb), a large blood vessel (Bv) and the alveolar duct (Ad). Theparenchyma consists of alveolar sacs and alveoli (AT). Critical point dried material. X330. (B) Atransmission electron micrograph of the pulmonary parenchyma of the bat lung showing alveoli (A)separated by an interalveolar septa which consists of blood capillaries (C). The air and blood gasexchange media are separated by a blood—gas (tissue) barrier (B). The capillaries contain erythrocytes(is). W, white blood cell;/3, plasma layer. X7000. (C) A high power transmission electron micrographshowing the blood—gas barrier. The tissue barrier consists of an epithelial cell (Ep), which is normallyoverlaid with a thin surfactant layer (which was not preserved in this preparation), an interstitium (In)and an endothelial cell (En).P, plasma; A, alveoli; E, erythrocyte. X21 000. All preparations are fromTadarida mops.
48 J. N. MAINA AND A. S. KING
Table 2. Body weight (W), lung volume (VL), volume density [Vv(p, L)J and absolutevolume (Vp) of the parenchyma and volume density [Vv(np, L)J and absolute volume
(Vnp) of the non-parenchymatous regions of the lungs of five species of bat
The absolute values appertain to both lungs together.Values are meana 1 s.D.The symbols in this and subsequent tables are explained in the Methods sections.
• Out of seven specimens of Cynopterus brachyotis only five were fixed well enough for electron microscopy.The values of N in this table apply to the subsequent tables.The values appertain to both lungs together and are means ± s.D.
more meaningful parameter than Sa as it takes into account only those areas of thealveolar epithelium where gas exchange actually takes place. It was felt that St, whichcan be directly determined, was a much more accurate estimate of the morphometricpulmonary diffusing capacity rather than estimating St as the mean of Sa and Sc(Weibel, 1970/71). In this study the values of St, Sa and Sc are given in Table 5 andthe difference in estimating St both ways is clearly apparent. It consistently appearsin this study, and our previous ones, that the indirect way of estimating St leads to anoverestimate of the surface area available for gas exchange and consequently that ofthe diffusing capacity. Obviously Sa will always be higher than St when these valuesare estimated together on the same preparations.
Ratios of some parameters of the components of the parenchyma are shown inTable 6. Pipistrellus pipistrellus and Tadarida mops had the highest values (respec-tively 63 and 56cm2g~1) for the surface area of the blood-gas (tissue) barrier per unitbody weight (St/W); the lowest values were observed in Cheiromeles torquatus(33-3cm2g~') and Cynopterus brachyotis (30cm2g~'). The ratio Sv(t,p) expressesthe surface density of the blood-gas (tissue) barrier and thus indicates the relativealveolar diameter (see Discussion). The highest value of Sv(t,p) was observed in aspecimen of Pipistrellus pipistrellus (153 mm2 mm"3), and the lowest (31 mm2mm~3)in a specimen of Cynopterus brachyotis. The ratio Vc/Sa has been defined as capillaii
Morphometry of the bat lung 49
Table 4. Surface areas of the resistance barriers that constitute the air-haemoglobinpathway in the lungs of five species of bat
loading (Perry, 1978; Gehr et al. 1980) and expresses the degree of exposure of bloodto air, a lower ratio indicating a higher degree of exposure (Perry, 1978). The lowestvalue of Vc/Sa was found in Pipistrellus pipistrellus (mean 0-32 cm3 m~2). Relativelyhigh values of Vc/Sa (means 0-80 and 0-71 cm3 m~2) were observed in Tadarida mopsand Miniopterus minor respectively.
Table 6 gives the harmonic and arithmetic mean thicknesses of the blood—gas(tissue) barrier and the plasma layer. The thinnest harmonic mean thickness of thetissue barrier, iht, (0-184 /im) was found in a specimen of Pipistrellus pipistrellus; thethickest barrier (0-313/im) was found in a specimen of Cynopterus brachyotis. Thelowest and the highest values of the arithmetic mean thickness (ft) of the blood-gas(tissue) barrier (1-12 and 1-81 /im) were again observed respectively in a specimen ofPipistrellus pipistrellus and a specimen of Cynopterus brachyotis.
In Table 7 are shown the morphometric pulmonary diffusing capacities of the three
50 J. N . MAINA AND A. S. K I N G
Table 7. Morphometric pulmonary diffusing capacities of the resistance barriers of the'air-haemoglobin pathway in the lungs of five species of bat
The values (mlC^mirT1 mmHg"1) appertain to both lungs together and are means ± 9.D.The values of Dpoj, Deoj, Dmo2 and DLoz are means of the maximum and minimum values.
barriers constituting the air-haemoglobin pathway; also shown are the membranediffusing capacity and the total morphometric pulmonary diffusing capacity. Thehighest mean values of the specific (weight normalized) total morphometric pulmon-ary diffusing capacity, DL02/W (mlOzmin"1 mmHg"1 kg"1), were found inPipistrellus pipistrellus and Tadaridamops (11 -S3 and 10-2 mlO2 min"1 mmHg"1 kg"1
respectively). The lowest mean values of DL02/W were found in Cheiromelestorquatus (4-18) and Cynopterus brachyotis (4i19ml02min~1mmHg~1 kg"1).
DISCUSSION
The structure of the lung is adapted to meet the oxygen demands of an animal,which in turn will reflect various factors such as body weight and mode of life. Batsare excellent fliers in terms of speed, distance and manoeuvrability (Hartman, 1963;Krzanowski, 1964; Griffin, 1970; Vaughan, 1970; Schmidt-Nielsen, 1975, 1979;Yalden & Morris, 1975; Walker, 1975; Norberg, 1976; Snyder, 1976; Bouverot,1978). It has been shown that bats have developed specializations of the oxygentransport system in the form of a relatively large heart, high haematocrit, highhaemoglobin concentration, a high oxygen capacity and low oxygen affinity of theblood (Hartman, 1963; Thomas &Suthers, 1972; Snyder, 1976; Jiirgense*al. 1981).However, Snyder (1976) observed that the haematological parameters of Cynopterusbrachyotis are within the range of the values reported for non-flying mammals andeven lower than those of the laboratory mouse; he nevertheless observed that thisspecies of bat had a heart weight 60 % greater than that expected of a non-flyingmammal and comparable to that of a bird. In the present study it will be shown thatthe bat lung is morphologically well adapted for gas exchange; furthermore there areindications that individual species seem to be adapted according to their small or largesize and their energetic or non-energetic life style.
Lung volume
Jiirgensef al. (1981), on the basis of measurements of lung weight, concluded thatbats had proportionately larger lungs than small terrestrial mammals. Our morpho-metric observations confirm that bats do indeed have immensely large lungs comparedwith those of both birds and terrestrial mammals (Fig. 2, Table 5). The mean lunM
Morphometry of the bat lung 51
felume in the five species of bats examined here per gram body weight (VL/W) was^074 cm3 g"1. In contrast, the mean VL/W for eight species of shrews examined byGehreJ al. (1980) was only 0-030 cm3 g"1; the VL/W in the violet-eared humming-bird was 0-043 cm3g~1 (Dubach, 1981). Thus, the specific lung volume (i.e. volumeper gram body weight) of our bats was 2-5 times greater than that of the shrews and
100000
* Mammals VL = 34-95W1 °13 r = 0-994
o Bats VL = 59-43W1"07 r = 0-925
1000 10000
Body weight (W, g)
Fig. 2. Double logarithmic plot of lung volume (VL) against body weight (W). The values of VLappertain to the combined volumes of the left and right lungs. The bird line is based on 148 data pointsfor the 148 individual birds representing 41 species examined by Maina (1982). The data points forthe domestic fowl are entered separately. The terrestrial mammal line was based on 40 data points forthe value of VL in some 20 terrestrial mammalian species examined by Gehr el al. (1981), fallingwithin the same weight range as the birds. The bat line is based on 29 specimens from six species; thevalues of the fruit bat Epomophorus mahlbergi incorporated in the calculation of the regression linewere reported in detail in Maina, King & King (1982i). The bats have a remarkably larger lungvolume than the mammals and the birds. The mammals in turn have a larger lung volume than thebirds. In the three groups of animals VL is very strongly correlated with W.
52 J. N. MAINA AND A. S. KING
almost twice that of the hummingbird. Even more remarkable was the fruit h4Epomophoms wahlbergi, which had a specific lung volume of 0-13 cm3g~1 (Maina elal. 19826), i.e. about 4-3 times greater than the shrews.
Tenney & Remmers (1963), however, in their plot of lung volume against body weightin a large number of mammalian species, included a value for an unnamed species of batwhich fell slightly below the common regression line. This discrepancy could possiblybe due to species differences or to the technique used for fixing and measuring lungvolume. Tenney & Remmers removed the lungs immediately after death and kept theminflated at a pressure of 20 cm of water until they were dry. Unfortunately this techniquegives no assurance that the volume of the dried lungs was similar to their volume in situ.Comparison of their values with those obtained here is therefore inconclusive.
Surface area of the blood-gas (tissue) barrierThree of our five species of bats exhibited relatively high values of the surface area
of the blood-gas (tissue) barrier per gram body weight (St/W). Thus the mean valuesof St/W obtained in Pipistrellus pipistrellus, Miniopterus minor and Tadarida mopswere respectively 63, SO and 56 cm2 g"1. These values are substantially higher than thevalues of 26, 26, 43, 29 and 46cm2g-' obtained by Maina (1982) and Maina & King(1982) in anseriform, charadriiform, columbiform, piciform and passeriform avianspecies respectively. They are also much higher than the mean value of 33cm2g~'reported by Gehr et al. (1980) for eight species of shrew. On the other hand, therelatively low values of St/W in Cynopterus brachyotis (30cm2g~') and Cheiromelestorquatus (33 cm2g"') are closely similar to the mean values for the shrews (Gehr etal. 1980; Weibel, 1979). The value of St/W found in the violet-eared hummingbirdwas 87cm2g~1 (Dubach, 1981), and this exceeds all of the five bat species in thepresent study. However, the highest values of St/W reported so far in any vertebrate(138cm2g"1) occurred in the fruit-bat Epomophorus wahlbergi (Maina et al. 19826).The plot (Fig. 3) suggests that bats may prove to have a more extensive blood—gas(tissue) barrier than birds in general or terrestrial mammals of comparable size,though undoubtedly examination of more species of bats is called for.
The relatively high values of St/W in Tadarida mops could be associated with thecapacity for fast and sustained flight in molossid bats (Vaughan, 1966, 1970; Yalden& Morris, 1975). The values of St/W in Pipistrellus pipistrellus are higher than thoseof Tadarida though Vaughan (1966) observed that vespertilionid bats exhibit slowerflight close to the ground. The insectivorous bats like Pipistrellus pipistrellus have,however, to be more manoeuvrable and fly continuously in search of food (Vaughan,1970). Pipistrellus pipistrellus is one of the smallest bats (Yalden & Morris, 1975).This, and the need for sustained flight when feeding, may account for the high valueof St/W in this species of bat.
Tenney & Remmers (1963) reported the value of the alveolar surface area in anunnamed species of bat to be similar to that of terrestrial mammals. To estimatealveolar surface areas they used relatively thick sections 100 pan, which werephotographed at low power (presumably using a light microscope). Analysis of tissuesat low magnifications gives an underestimate due to lack of resolution (Dunnill, 1962).The value for the bat obtained by Tenney & Remmers (1963) is not therefore compar-able with our study.
Morphometry of the bat lung 53
Surface density of the blood-gas (tissue) barrier
The surface area of the blood-gas (tissue) barrier per unit volume of parenchyma,Sv(t,p), shows how much of the barrier has been packed into a unit containingvolume. A large diffusing surface area can be achieved by an increase in either the liingvolume, or the lung partitioning, or both (Tenney & Remmers, 1963; Geelhaar &Weibel, 1971; Weibel, 1979). The value Sv(t,p) is an indicator of the relative sizes ofthe terminal gas exchange units. The values of Sv(t,p) in mammalian lungs are ingeneral relatively lower than those of the avian species (Fig. 4). For instance the meanvalue of Sv(t,p) in the eight species of shrew examined by Gehr et al. (1980) was
100
1 0 •
X)
3
1
0 1 •
t
en
001 -
0001
r = 0-997= 52-5W°"'7*r= 0-989= 48-31W'"ol4r = 0-913
10 100
Body weight (W, g)
1000 10000
Fig. 3. Double logarithmic plot of the surface area of the blood—gas (tissue) barrier (St) against bodyweight (W). The values of St appertain to the combined left and right lungs. The bird line is basedon 87 data points for the 87 individual birds representing 25 species examined by Maina (1982), thisnumber is lower than that given in Fig. 1 due to unsatisfactory degree of fixation for electron micro-scopy. The mammalian line is based on the species as in Fig. 1. The bat line is based on the five specieswhich are the subject of this study and Epomophorus wahlbergi reported in Maina, King & King(19826). St in the bats is higher than in the birds and the terrestrial mammals. St is strongly correlatedwith body weight in these three groups of animals.
54 J. N. MAINA AND A. S. KING
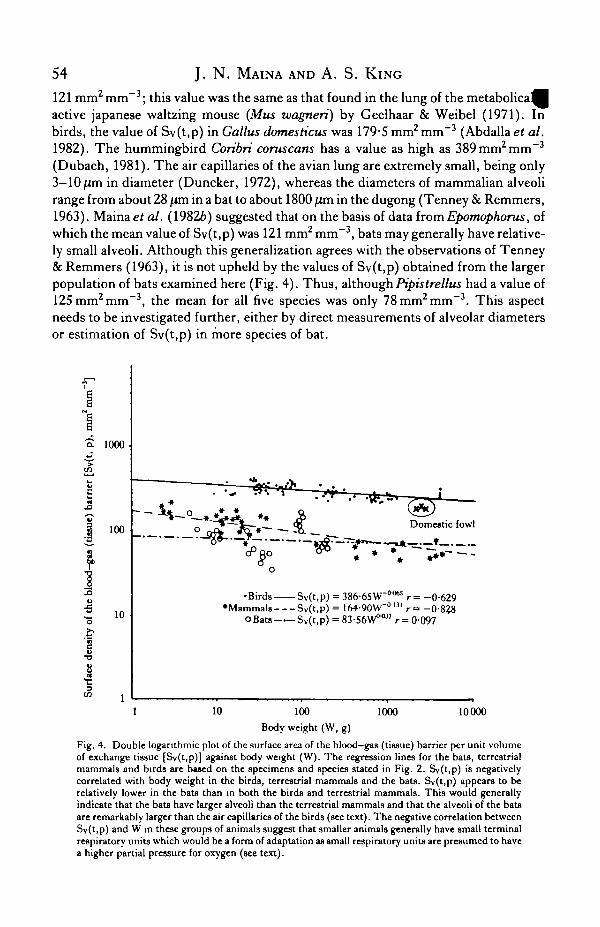
121 mm2 mm~3; this value was the same as that found in the lung of the metabolicaMactive Japanese waltzing mouse (Mus wagneri) by Geelhaar & Weibel (1971). Inbirds, the value of Sy(t,p) in Gallus domesticus was 179-5 mm2 mm"3 (Abdalla et al.1982). The hummingbird Coribri coruscans has a value as high as 389 mm2 mm"3
(Dubach, 1981). The air capillaries of the avian lung are extremely small, being only3-10jUm in diameter (Duncker, 1972), whereas the diameters of mammalian alveolirange from about 28 fim in a bat to about 1800 jum in the dugong (Tenney & Remmers,1963). Maina et al. (19826) suggested that on the basis of data from Epomophorus, ofwhich the mean value of Sv(t,p) was 121 mm2 mm~3, bats may generally have relative-ly small alveoli. Although this generalization agrees with the observations of Tenney& Remmers (1963), it is not upheld by the values of Sv(t,p) obtained from the largerpopulation of bats examined here (Fig. 4). Thus, althoughPipistrellus had a value of125 mm2 mm"3, the mean for all five species was only 78 mm2 mm"3. This aspectneeds to be investigated further, either by direct measurements of alveolar diametersor estimation of Sv(t,p) in more species of bat.
1000 •
.6
100
1t 10o
•Birds Sv(t,p) = 386-6SW"M" r = -0-629•Mammals Sv(t,p) = 164-9OW-0131 r « - 0 - 8 ? 8
OBats Sv(t.p) = SS-SGW*""3 r = 0-097
10 100
Body weight (W, g)
1000 10000
Fig. 4. Double logarithmic plot of the surface area of the blood-gas (tissue) barrier per unit volumeof exchange tissue [Sv(t,p)] against body weight (W). The regression lines for the bats, terrestrialmammals and birds are based on the specimens and species stated in Fig. 2. Sv(t,p) is negativelycorrelated with body weight in the birds, terrestrial mammals and the bats. Sv(t,p) appears to berelatively lower in the bats than in both the birds and terrestrial mammals. This would generallyindicate that the bats have larger alveoli than the terrestrial mammals and that the alveoli of the batsare remarkably larger than the air capillaries of the birds (see text). The negative correlation betweenSv(t,p) and W in these groups of animals suggest that smaller animals generally have small terminalrespiratory units which would be a form of adaptation as small respiratory units are presumed to havea higher partial pressure for oxygen (see text).
Morphotnetry of the bat lung 55
Harmonic mean thickness of the blood-gas (tissue) barrierThis parameter (Tht) is the most appropriate estimator of the barrier conductance
to oxygen (Weibel & Knight, 1964; Weibel, 1970/71, 1973; Hughes, 1980). Thethinner the barrier, the greater will be its conductance to oxygen. The smallest Ththitherto reported in a mammalian lung was 0-230/im in a specimen of the shrew{Suncus etruscus) by Gehr et al. (1980).
In the bats examined here the smallest Tht (0-184/im) was observed in one of thespecimens of Pipistrellus pipistrellus, this value being the thinnest barrier reported inany mammalian lung so far. It is apparent from Fig. 5 that the bats have a thickerTht than the active birds, but a thinner Tht than the terrestrial mammals. The Tht inthe lungs of flightless species of birds was generally thicker than that of the bat. Thus,Tht in Gallus domesticus was 0-314pan (Abdalla et al. 1982), 0-320/im in Numidameleagris (Abdalla & Maina, 1981), and 0-385/im in Meleagris gallopavo (Dubach,1981).
Volume of pulmonary capillary bloodThe volume of the pulmonary capillary blood is an important parameter since it
Fig. S. Double logarithmic plot of the harmonic mean thickness of the blood-gas (tissue) barrier(Tht) against body weight (W). The regression lines for the bats, birds and terrestrial mammals arebased on the specimens and species stated in Fig. 2. The bats had a thicker blood-gas (tissue) barrierthan the birds but the barrier in the bats was thinner than in the terrestrial mammals. The Tht isgenerally weakly correlated with W in the animals. The blood-gas (tissue) barrier in the domestic fowlis thicker than in the active (wild) species of birds, and is apparently as thick as in the bats.
56 J. N. MAINA AND A. S. KING
10000-
83
1000-
100 '
10-
Domestic fowl
• Birds A•Mammals A
o B a t s — A
= 5-84W°'33r= 0-984= 4 0 1 W 0 " 0 r = 0-994= S13W°9 SV = 0-882
10 100Body weight (W, g)
1000 10000
Fig. 6. Double logarithmic plot of the pulmonary capillary blood volume (Vc) against body weight(W). The values of Vc appertain to the combined left and right lungs. The number of birds, terrestrialmammals and bats on which the regression lines are based are as in Fig. 2. Vc in the bats is apparentlyhigher than in the terrestrial mammals but very little different from that in the birds. Vc is stronglycorrelated with W in these three groups of animals.
influences the total morphometric pulmonary diffusing capacity for oxygen. Fig. 6indicates that a bat does have a larger amount of blood in the gas exchange tissue(parenchyma) than a terrestrial mammal of the same body weight. However, thevolumes of the pulmonary capillary blood in the bat and bird appear to be much thesame. Duncker (1973) remarked that the relatively large volume of blood in the avianlung may be a possible reason for its high degree of efficiency; such an observationmay also apply to the bat lung.
Total morphometric pulmonary diffusing capacity
The total morphometric pulmonary diffusing capacity for oxygen (DL02) estimatesthe maximum possible conductance in the lung under perfect conditions of ventilationand perfusion over the entire barrier (Weibel, 1970/71; Siegwart, Gehr, Gil |
Morphometry of the bat lung 57
c'iO
3Q
•c
io
•§•o
10000-
1000-
100-
10-
cP
Domestic fowl
• Birds D L ^ = 8 - 2 5 ^ " * r = 0-978•Mammals DL0, = 5-54W0"930 r = 0-992
oBats — DLo,= 1OW0"'12 r = 0-866
10 100Body weight (W, g)
1000 10000
Fig. 7. Double logarithmic plot of the mean total morphometnc pulmonary diffusing capacity(DL02) against body weight (W). The values of DL02 appertain to the combined left and right lungs.The regression lines for the bats, birds and terrestrial mammals are based on the specimens andspecies as stated in Fig. 2. DL02 is higher in the bats than in both birds and terrestrial mammals. Thisis as a result of VL, St and Vc being fairly high in bats in addition to the relatively small iht; St, Vcand tht are utilized in calculating DL02 • DL02 is strongly correlated to body weight in these threegroups of animals. DLoj in the domestic fowl is remarkably low.
Weibel, 1971), although such conditions are seldom realised even during strenuousexercise. The physiologically-estimated pulmonary diffusing capacity is thus alwayslower than that estimated morphometrically. Apparently the physiological pulmonarydiffusing capacity has not been estimated for any bat.
In the six species of bat which have so far been examined, the highest value ofDL02/W (ZOmlOamin"1 mmHg~1kg~1) was found in Epomophorus (Maina et al.\982b). In the species investigated in the present study, the highest value was foundin a specimen of Pipistrellus pipistrellns (13 mlOzmin"1 mmHg"'kg"1). Relativelyhigh values of DL02/W were also found in Tadarida mops, the mean for this speciesbeing lOmlOzmin"1 mmHg~1kg~1. The lowest values of DL02/W in our five•oecies (mean 4-2mlO2min~1 mmHg-'kg"1) were found both in Cynopterus
58 J. N. MAINA AND A. S. KING
Table8. Summary of the allometric (regression) functions y = aWb (y being a pulmon-ary variable; a, the y-intercept; W, body weight; and b the slope - the scaling factorbetween y and W) and correlation coefficients (r) of the main pulmonary components
Units: VL, mm3; St, cm2; Vc, mm3; Sv(t, p), i r a n ' i m " 1 ; iht, nm; DLo,, m m ^ m i r T 1 mmHg"1; W, g.• T h e values of the fruit bat Epomophorus wahlbergi reported in Maina, King & King (19826) were incor-
porated with those of the bats examined here, in the calculation of these regression functions.The symbols are defined in the Methods section.
brachyotis and Cheiwmeles torquatus. However, the values of DLo2/W even inCynopterus and Cheiromeles are slightly higher than the mean value of 4mlO2min~1
mmHg"1 kg"1 in the eight species of shrew examined by Gehr et al. (1980). Fig. 7clearly shows that the DL02 of the bats so far examined is higher than that of bothbirds and terrestrial mammals. This is mainly as a result of the extensive and thinblood—gas (tissue) barrier, and the higher pulmonary capillary blood volume in thebats. When these morphological features of the bat lung are combined with thehaematological adaptations which have been found in several species of bat, theyappear to constitute effective adaptations for transferring the large amount of oxygenrequired by flight.
The molossid bats tend to be regarded as the most advanced bats (Griffin, 1970;Yalden & Morris, 1975). These insectivorous bats are speedy and enduring flyers, achiropteran version of swallows and swifts (Vaughan, 1970). It might be expected thatthe energetic demands of this mode of life would entail an advanced level of respirat-ory specialization. Among our bats, the molossid Tadarida mops did have a relativelyhigh morphometric diffusing capacity for oxygen. On the other hand the lowest valueoccurred in Cheiromeles torquatus, another molossid species. Among the six speciesof bat which we have now examined, by far the most outstanding respiratory adapta-tions have been found in the fruit bat Epomophorus wahlbergi. The big fruit bats haveoften been regarded as relatively 'primitive'. However, the body conformation ofEpomophorus has been adapted to house lungs which are extraordinarily large andhave a most extensive area for gas exchange, features which culminate in a morpho-metric diffusing capacity for oxygen of exceptional magnitude; on the other hand,Cynopterus brachyotis had a very low DL02. Both of these pteropodid species are saidto travel long distances to and from their feeding sites (Yalden & Morris, 1975), butCynopterus seems to be entirely incapable of hovering (Snyder, 1976). Thehaematological parameters for Cynopterus differ very little from those of a terrestrialmammal (Snyder, 1976). Jepsen (1970) cast doubt on the concept of 'primitiveness',which includes being 'less highly organized anatomically', and noted that the debate
Morphometry of the bat lung 59
tLds to be 'short on information'. We hope that data on the respiratory characteristicsbat species may broaden the basis for discussion.It is notable that the volume proportions of the parenchyma and non-parenchyma
in the bats which we have investigated are fairly constant and are similar to those ofthe lungs of the terrestrial mammals (Burri & Weibel, 1971; Gehr & Erni, 1980). Thevolume proportions of the main components of the parenchyma (alveoli, bloodcapillaries and the tissue of the interalveolar septa) in the bat lung are also similar tothose reported for terrestrial mammals (Gehr, Bachofen & Weibel, 1978; Gehr et al.1980; Gehr & Erni, 1980). In birds it has been found (Maina, 1982; Maina, Abdalla& King, 1982a) that the volume proportion of the exchange tissue is higher in themore active species of bird. The results of the present study of the bat lung areconsistent with the suggestion by Maina et al. (19826) that these basic proportions ofthe mammalian lung have become uniformly optimized in the course of evolution,whereas the avian lung has been sufficiently adaptable to permit even these basicproportions to be varied. Both orders possess enough flexibility for detailed refine-ments of the exchange surface. But for bats, confronted by immense energeticdemands imposed by flight, this alone must have been insufficient: their sole remain-ing resource was greatly to increase the size of the lung as a whole.
The authors are indebted to the British Council for financial support which madeour collaboration possible. We gratefully acknowledge the help received from manycolleagues. In Kenya: Professor F. A. Mutere, Kenyatta University College, Nairobi,in the course of writing this paper; Mrs G. Hinga and Miss B. Waweru for skilfullytyping the manuscript. In the Universiti Pertanian Malaysia: Dr R. Stuebing, DrBertha Allison, Dr Lloyd Whitten and Dr M. Vidyadaran, for invaluable aid withmaterial. In the University of Aberdeen: Dr Paul Racey, for generous help withmaterial and background information. In the University of Liverpool: D. Zoe Kingfor assistance with material in Malaysia, electron microscopy and criticism of themanuscript; Julie Henry for extensive and expert electron microscopy.
R E F E R E N C E S
ABDALLA, M. A. & MAINA, J. N. (1981). Quantitative analysis of the exchange tissue of the avian lung(Galliiformes).J. Mat. 133, 677-680.
ABDALLA, M. A., MAINA, J. N., KING, A. S., KING, D. Z. & HENRY, J. (1982). Morphometrics of the avianlung. 1. The domestic fowl (Gallus gallus variant domesticus). Respir. Physiol. 47, 267—278.
BARTHOLOMEW, G. A., LEITNER, P. & NELSON, J. E. (1964). Body temperature, oxygen consumption, andheart rate in three species of Australian flying foxes. Physiol. Zool. 37, 179—198.
BOUVEROT, P. (1978). Control of breathing in birds compared with mammals. Physiol. Rev. 58, 604-655.BURRI, P. H. tc WEIBEL, E. R. (1971). Morphometric estimation of pulmonary diffusion capacity. 11. Effect
of P02 on the growing rat lung to hypoxia and hyperoxia. Respir. Physiol. 11, 247—264.CARPENTER, R. E. (1975). Flight metabolism of flying foxes. In Swimming and Flying in Nature, Vol. 2, (eds
T. Y. T. Wu, C. J. Brokaw & C. Brennen), pp. 883-890. New York: Plenum Publishing Corporation.DAWSON, R. W. (1975). Avian physiology. Ann. Rev. Physiol. 37, 441-465.DUBACH, M. (1981). Quantitative analysis of the respiratory system of the House Sparrow, Budgerigar, and
Violet-eared Hummingbird. Respir. Physiol. 46, 43—60.DUNCKER, H. R. (1971). The lung air-sac system of birds: A contribution to the functional anatomy of the
respiratory apparatus. Ergebn. Attat. EnttoickGesch. 45, 1-171.DUNCKER, H. R. (1972). Structure of avian lungs. Respir. Physiol. 14, 44-63.DUNCKER, H. R. (1973). Der quantitative AufbaudesLungenluftsacksystemsder Vogel. Verh. anal. Ges.,Jena•17, 197-204.
60 J. N. MAINA AND A. S. KING
DUNNILL, M. S. (1962). Quantitative methods in the study of pulmonary pathology. Thorax 17, 320-328iGEELHAAR, A. & WEIBEL, E. R. (1971). Morphometric estimation of pulmonary diffusion capacity. 111. Tl
effect of increased oxygen consumption in Japanese Waltzing Mice, Respir. Physiol. 11, 354-366.GEHR, P., BACHOFEN, M. & WEIBEL, E. R. (1978). The normal human lung: ultrastructure and morphometric
estimation of diffusion capacity. Respir. Physiol. 32, 121-140.GEHR, P. & ERNI, H. (1980). Morphometric estimation of pulmonary diffusion capacity in two horse lungs.
Respir. Physiol. 41, 199-210.GEHR, P., MWANGI, D. K., AMMAN, A., MALOIY, G. M. O., TAYLOR, C. R. & WEIBEL, E. R. (1981). Design
of the mammalian respiratory system. V. Scaling morphometric diffusing capacity to body mass: wild anddomestic mammals. Respir. Physiol. 44, 61—86.
GEHR, P., SEHOVIC, S., BURRI, P. H., CLAASSEN, H. & WEIBEL, E. R. (1980). The lung of shrews: morpho-metric estimation of diffusion capacity. Respir. Physiol. 40, 33—47.
GREENHALL, A. M. & PARADISO, J. D. (1968). Bats and Bat Banding. Washington, D.C.: Bureau of Sport,Fisheries and Wildlife Resource Publication, 72.
GRIFFIN, D. R. (1970). Migrations and homing of bats. In Biology of Bats, Vol. 1, (ed. W. A. Wimsatt), ch.7, pp. 233-264. London: Academic Press.
HARTMAN, F. A. (1963). Some flight mechanisms of bats. OhioJ. Set. 63, 59-65.HUGHES, G. M. (1980). Morphometry of fish gas exchange organs in relation to their respiratory function. In
Environmental Physiology of Fishes, (ed. M. A. Ali), pp. 33-56. New York: Plenum Publishing Corporation.JEPSEN, G. L. (1970). Bat origins and evolution. In Biology of Bats, Vol. 1, (ed. W. A. Wimsatt), pp. 1-64.
London: Academic Press.JORGENS, K. D., BARTELS, H. & BARTELS, R. (1981). Blood oxygen transport and organ weights of small bats
and small non-flying mammals. Respir. Physiol. 45, 243-260.KING, A. S. (1966). Structural and functional aspects of the avian lung and air sacs. Int. Rev. gen. exp. Zool.
2, 171-267.KRZANOWSKI, A. (1964). Three long flights by bats. J . Mammal. 45, 152.MAINA, J. N. (1982). Qualitative and quantitative observations on the lungs of Aves with comments on the lung
of a species of Chiroptera: A morphological study. Ph.D. thesis, University of Liverpool.MAINA, J. N., ABDALLA, M. A. & KING, A. S. (1982a). Light microscopic morphometry of the lung of 19 avian
species. Acta anat. 112, 264-270.MAINA, J. N. & KING, A. S. (1982). Morphometrics of the avian lung. 2. The Wild Mallard (Anasplatyrhyn-
chos) and Graylag Goose (Anser anser). Respir. Physiol. 50, 299-310.MAINA, J. N., KING, A. S. & KING, D. Z. (19826). A morphometric analysis of the lung of a species of bat.
Respir. Physiol. 50, 1-11.MAINA, J. N. & NICHOLSON, T. (1982). The morphometric pulmonary diffusing capacity of a bat,
Epomophorus xaahlbergi.J. Physiol., Land. 325, 36-37P.MAINA, J. N. & SETTLE, J. G. (1982). Allometric comparisons of some morphometric parameters of avian and
mammalian lungs. J. Physiol., Land. 330, 28P.NORBERG, U. M. (1976). Aerodynamics of hovering flight in long-eared bat Plecotus auritus.J. exp. Biol. 65,
459-470.PERRY, S. F. (1978). Quantitative anatomy of the lungs of the Red-eared Turtle, Pseudemys scripta elegans.
Respir. Physiol. 35, 245-262.PIIPER, J. & SCHEID, P. (1973). Gas exchange in avian lungs: Models and experimental evidence. In Com-
parative Physiology, (eds L. Bolis, K. Schmidt-Nielsen & S. H. P. Maddrell), pp. 161-185. Amsterdam:North-Holland Publishing Co.
SCHEID, P. (1979). Mechanisms of gas exchange in birds. Rev. Physiol. Biochem. Pharmacol. 86, 137—186.SCHEID, P. & PIIPER, J. (1970). Analysis of gas exchange in the avian lung: Theory and experiments in the
domestic fowl. Respir. Physiol. 9, 246-262.SCHERLE, W. F. (1970). A simple method for volumetry of organs in quantitative stereology. Microskopie 26,
57-60.SCHMIDT-NIELSEN, K. (1975). Recent advances in avian respiration. inAvian Physiology, (ed. M. Peaker), pp.
33—47. London: Academic Press.SCHMIDT-NIELSEN, K. (1979). How Animals Work. Cambridge: Cambridge University Press.SIEGWART, B., GEHR, P., GIL, J. & WEIBEL, E. R. (1971). Morphometric estimation of pulmonary diffusion
capacity. IV. The normal dog lung. Respir. Physiol. 13, 141-159.SNYDER, G. K. (1976). Respiratory characteristics of whole blood and selected aspects of circulatory physiology
in the common shortnosed fruit bat Cynopterus brachyotes. Respir. Physiol. 28, 239-247.STUDIER, E. H. & HOWELL, D. J. (1969). Heart rate of female big brown bats in flight. J . Mammal. 50, 842-845.TENNEY, S. M. & REMMERS, J. E. (1963). Comparative quantitative morphology of the mammalian lung:
diffusing area. Nature, Land. 197, 54-56.THOMAS, S. P. (1975). Metabolism during flight in two species of bats, Phyllostomus hastatus and Pteropus
gouldii.J. exp. Biol. 63, 273-293.THOMAS, S. P. (1980). The physiology and energetics of bat flight. In The Proceeding of the 5th International
Bat Research Conference, (eds D. W. Wilson & A. Gardner), pp. 393-402. Texas Technical Press.
Morphometry of the bat lung 61S, S. P. &SUTHERS, R. A. (1972). The physiology and energetics of bat flight. J. exp. Biol. 57, 317-335.R, V. A. (1968a). Upon the wings of the wind. New Scientist 38, 694-696.
TUCKER, V. A. (19686). Respiratory exchange and evaporative water loss in the flying budgerigar.,7. exp. Biol.48, 67-87.
TUCKER, V. A. (1969). Energetics of bird flight. Scient. Am. 220, 70-78.TUCKER, V. A. (1972). Respiration during flight in birds. Respir. Physiol. 14, 75-82.VAUGHAN, T. A. (1966). Morphology and flight characteristics of molossid bats. J . Mammal. 47, 249-260.VAUGHAN, T. A. (1970). Flight patterns and aerodynamics. In Biology of Bats, Vol. 1, (ed. W. A. Wimsatt),
pp. 195-215. London: Academic Press.WALKER, E. P. (1975). Mammals of the World, Vol. 1. New York: John Hopkins Press.WEIBEL, E. R. (1970/71). Morphometric estimation of pulmonary diffusion capacity. I. Model and method.
Respir. Physiol. 11, 54-75.WEIBEL, E. R. (1973). Morphological basis of alveolar-capillary gas exchange. Physiol. Rev. 53, 419-495.WEIBEL, E. R. (1979). Oxygen demand and size of respiratory structures in mammals. lnEvolution of Respirat-
ory Processes: A Comparative Approach, (eds S. C. Wood & C. Lenfant), pp. 289-346. New York: MarcelDekker. »
WEIBEL, E. R. & KNIGHT, B. E. (1964). A morphometric study on the thickness of the pulmonary air-bloodbarrier. J. Cell Biol. 21, 367-384.
WIMSATT, W. A. (1970). Biology of Bats, pp. XI-XII . London: Academic Press.YALDEN, D. W. & MORRIS, P. A. (1975). The Lives of Bats. London: David and Charles.