GSJ: Volume 7, Issue 4, April 2019, Online: ISSN 2320-9186
www.globalscientificjournal.com
PARTIAL REPLACEMENT OF CLAY WITH RIVER SAND
IN THE PRODUCTION OF BURNT CLAY BRICKS Gbagir Kwaghgba
1, Jagba A. Shedrack
1 and Ijoh H. Uvirsue
1
1 Federal University of Agriculture, Makurdi, Nigeria
Corresponding email: [email protected], [email protected]
ABSTRACT
This study investigates the partial replacement of clay with river sand in burnt clay production at
0 %, 5 %, 10 %, 15 %, 20 %, and 25 % river sand. Preliminary tests were conducted on the
aggregates to determine its suitability. Experiment tests which include density, water absorption
and compressive strength were also conducted. The density, water absorption and compressive
strength values range from 1646-1743 kg/m3, 9.97-14.79% and 2.94-5.76 N/mm
2 respectively.
The results show that at 5% river sand replacement; the density increase with increase in sand
content but gave the least value in water absorption capacity. Also, for the compressive test
carried out, the samples at 5% river sand replacement gave the maximum compressive strength.
It has therefore been established in this study that clay in partial replacement with river sand can
improve the properties of burnt clay bricks especially when mixed at 5% river sand replacement
with clay content as this gives the best possible outcome in the production of fired clay bricks
carried out in this study. Conclusively, for most low cost residential buildings and other
structural work where burnt clay brick is applicable for use, 5% river sand is recommended to
improve the properties of the burnt clay bricks.
Keywords: Partial replacement, River sand, Burnt clay, Water absorption, Compressive strength
GSJ: Volume 7, Issue 4, April 2019 ISSN 2320-9186
242
GSJ© 2019 www.globalscientificjournal.com
1.0 INTRODUCTION
The construction industry provides the facilities and infrastructure that people need to function
and it is therefore the fundamental foundation on which humanity exists, develops and survives.
However, approximately 50% of all global resources are consumed by the construction industry,
representing six billion tonnes of industrial raw materials each year (Augenbroe et al., 1998;
Edwards and Hyett, 2001; Kim and Rigdon, 1998; Sev, 2009). There is today an ever increasing
problem of providing adequate yet affordable housing in sufficient numbers in most developing
countries. In the last few decades, resources have remained scarce, housing demands have risen
and the urgency to provide immediate practical solutions has become more acute (Hadjri et al.,
2007). As prices of building materials increase sharply, there should therefore be a growing
awareness to relate research to local materials as alternatives for the construction of functional
but low-cost dwellings both in the urban and rural areas of developing countries. One of such
local material that is being researched is clay brick.
Before the invention of cement, all forms of houses were constructed using locally available
material such as clay bricks, thatched raffia palm and bamboo for roofing and Nigeria as a
country has several large deposits of clay scattered all over the country which have not yet been
exploited on a technical scale even till date (Saridharan and Venkatappa, 1973). Brick is a
rectangular block of clay or a similar material that is baked until it is hard and then used for
building houses, walls or other large permanent structures (Encarta English Dictionary, 2009).
Usage of burnt bricks dates back to the stone age (i.e. 2500 BC) as recorded in the Bible story of
“The Tower of Babel” in Genesis chapter 11 verse 3 where the people were said to “make bricks
and burn them thoroughly.” They had brick for stone, and asphalt for mortar (Maxwell, 2007 –
NKJV).
Clay brick is the first man-made artificial building material and one of the oldest building
materials known. Its widespread use is mainly due to the availability of clay in most countries.
Its durability and aesthetic appeal also contribute to its extensive application in both load bearing
and non-load bearing structures. The properties of clay units depend on the mineralogical
compositions of the clays used to manufacture the unit, the manufacturing process and the firing
temperature (Hendry, 1991). The raw materials for burnt brick production which comprise
predominantly various proportions of sand, silt and clay soils are derived from the deposits along
GSJ: Volume 7, Issue 4, April 2019 ISSN 2320-9186
243
GSJ© 2019 www.globalscientificjournal.com
the flood plains of major rivers and seasonal streams. These deposits when mixed, kneaded,
compacted in moulds and fired, produce bricks for building construction. It is however
interesting to note that burnt bricks fired at a kiln temperature, of 1000 oC produce red to reddish
brown bricks but beyond this temperature, a dark blue coloured vitrified clinker results which
melts and fuses together in a heap usually discarded by natives and referred to as iron stone" (Tse
and Akpen, 2008).
The importance of locally manufactured bricks has been emphasized in many countries due to
their effortless availability and low cost; also, bricks have been upgraded as one of the longest
lasting and strongest materials, made from locally available sources. Common building brick is
made of a mixture of clay that have been subjected to several processes, depending on the nature
of the material, the method of manufacture and the character of the finished product (Edward and
Robert, 2011; Raut et al., 2011). Burnt brick is normally stronger than sun dried brick, but
weaker than cement bricks in terms of strength and durability (Raut et al., 2011). This drawback
in the overall efficiency of the clay brick can be improved by doping with a suitable agricultural
waste along with clay in the manufacturing process. Doping materials are used to upgrade the
bond in-between the particles, thus the strength of the brick, which is either cementitious or
pozzolanic materials (Alaa and Ali, 2013). Lime is a traditional pozzolanic material; wood ash,
sawdust ash and fly ash are non-traditional pozzolanic materials. Rice husks, sawdust, coal are
organic materials. These organic materials control the burning temperature of the bricks, which
is of principal importance. The higher burning temperature produces the higher quality brick
(Fernando, 2017).
Sand is often added to the clay during mixing by some manufacturers in order to reduce
shrinkage, since the drying shrinkage is dependent upon pore spaces within the clay and the
mixing water (Brownell, 1976). River sand can be mixed with clay soil and other materials to
manufacture brick (Tamaraukuro and Japo, 2016). Adegoke and Ajayi, (2003), posited that a
good material for shelter provision must allow participation from the community and thereby
improving the economy of that community. This is what they called appropriate technology.
Such materials must be readily available, appropriate (economically (i.e. affordable) and
physically) to the environmental demands, thermally efficient and socially acceptable (Olusola,
GSJ: Volume 7, Issue 4, April 2019 ISSN 2320-9186
244
GSJ© 2019 www.globalscientificjournal.com
2005). This research therefore seeks to investigate the applicability of river sand in partial
replacement of clay in burnt clay brick production at varying mix ratios.
2.0 MATERIALS AND METHODS
The two major materials used in this work are clay and river sand. The clay was collected near
the river bank of River Bar while the fine aggregate (river sand) was also collected from the
middle of the same river located in Mbakya Mbayion Gboko Local Government Area of Benue
State. Some tools and equipment were used such as hand trowel, shovel, head pans, digital
weighing balance, scoop, tampering rod and compression testing machine. Preliminary test such
as moisture content, particle size distribution, specific gravity, consistency limit test, and
compaction test were performed. The moisture content, specific gravity and the sieve analysis of
the sand used were determine according to BS EN 1097-5:2008; the consistency limit test
according to BS 1377: 1990 and the compaction tests were also determine. Water used for
mixing and curing was obtained from a potable source.
Production of Burnt Clay Bricks
The production of burnt clay bricks was carried out in four stages namely winning and clay
preparation, moulding, drying and firing. Winning and clay preparation was the first step in the
production of burnt clay bricks. The clay after manual collection was moved to an open air
storage area where it was prepared for moulding. The clay samples were batched alongside the
river sand at selected percentages of 0% 5%, 10%, 15%, 20% and 25% of dry weight of soil and
was mixed thoroughly by adding water until approximately the optimum moisture content as
determined during compaction was reached, in order to obtain a homogeneous mix. The resulted
mix was plastic enough to facilitate moulding but not too plastic as that could result in warping,
twisting or cracking during the drying phase. After preparation of the samples at varying mix, the
batched materials were placed in a mould of size 215 mm x 103 mm x 65 mm. The freshly
produced bricks were stored in the open air in rows. They were covered temporarily with dried
grass to ensure protection against adverse weather condition for one week to ensure proper
drying. The properly dried bricks were stacked with a provision for firing. The staked bricks
were covered with a thick layer of soil paste to reduce the loss of heat during firing. These bricks
were produced according to BS 3921:1985 specification.
GSJ: Volume 7, Issue 4, April 2019 ISSN 2320-9186
245
GSJ© 2019 www.globalscientificjournal.com
Experimental Tests
(a) Density
Density test was conducted on the bricks produced. The mass and the volume of the bricks were
determined. The mass was determine by weighing each brick on weighing balance while the
volume of each brick was determined by taking the reduced lengths and height of the sides after
firing. Equation (1) was used to calculate the density of bricks.
(1)
where,
ρ = density of brick, (kɡ/m3)
m = mass of brick (kɡ)
v = volume of brick (m3)
(b) Water Absorption Test
Moulded bricks were initially dried in an oven at a constant temperature of 105⁰C after which
they were cooled at room temperature and their weights were obtained as M₁. The dried samples
were then immersed completely in water for 24 hours. Each sample was removed, wiped out of
any traces of water with damp cloth and weighed as M₂. Water absorption after 24 hours
immersion in water is given by the formula:
(2)
where,
Wa = water absorption, (%)
M1 = weight of fired brick, (ɡ)
M2 = weight of wet brick, (ɡ)
(c) Compressive Strength Test
After curing has been completed for the bricks to attain their full strength, each brick specimen
were centrally positioned on the universal testing machine between the plates. Applied load was
gradually increased on the specimen in order to crush it. The value at which the load failed was
recorded. The compressive strength of the bricks was determined using Equation 3. Five bricks
were tested for each replacement percentage and the average values were recorded in N/mm2.
The compressive strength of each brick was determined.
GSJ: Volume 7, Issue 4, April 2019 ISSN 2320-9186
246
GSJ© 2019 www.globalscientificjournal.com
(3)
where,
σ = Compressive strength, (N/mm2)
F = Force applied before crushing, (N)
A = Area of brick, (mm2)
3.0 RESULTS AND DISCUSSION
The natural moisture content of the clay sample gives 10.30 % of water. Table 1 shows the
specific gravity results of the river sand in varying percentage of replacement. It could be seen
that the values increase gradually from 2.44 at 0 % to 2.64 at 100%. At both 20% and 25%, the
mixtures have the same specific gravity values which display a typical form of consistency. The
mixture having no clay content with 100% river sand has a specific gravity of 2.64 while the
mixture having no river sand with 100% clay has a specific gravity of specific gravity of 2.44.
This result for river sand is typical for materials which composed mainly of quartz while that of
clay is typical for materials with sedimentary clays as established by Terzaghi et al. (1996).
Table 1: Specific Gravity
River Sand Percentage Specific Gravity Values
0 %
5 %
10 %
15 %
20 %
25 %
100 %
2.44
2.50
2.53
2.57
2.60
2.60
2.64
Table 2 reveals the Atterberg limit test results conducted on the mixture both with and without
river sand in varying percentage of replacement. The Atterberg’s limit values were observed to
reduce with increase in river sand content.
Table 2: Summary of Atterberg Limits Test Results
River Sand
(%)
Liquid Limit
(%)
Plastic Limit
(%)
Plasticity Index
(%)
Shrinkage Limit
(%)
0
5
10
15
20
25
35.50
31.50
29.80
27.50
26.40
25.80
19.60
18.00
17.00
16.60
16.10
16.30
15.90
13.50
12.80
10.90
10.30
9.50
9.30
5.70
4.30
3.60
2.90
2.50
GSJ: Volume 7, Issue 4, April 2019 ISSN 2320-9186
247
GSJ© 2019 www.globalscientificjournal.com
It could be observed that the soil generally possess a low liquid limit (i.e. 35.50 % < 50.00 %).
The liquid limit was observed to decrease from 35.50 % at 0 % River Sand to a minimum value
of 25.80 % at 25 % River Sand. The same condition occurs for plastic limit (PL). These results
therefore affect the outcome of the plasticity index. According to American Association of State
Highway and Transportation Officials (AASHTO) soil classification system and Unified soil
classification system (USCS) classification, the mixtures is classified as A-7-6 and CH soil
respectively. Also, according to the classification of Chen, (1988), it can be described as having
medium swell potential.
Table 3 summarizes the compaction test results. From the test results, the maximum dry density
(MDD) of the sample ranged from 1.53 to 1.65 g/cm3 and the optimum moisture content ranges
17.60 to 18.00%.
Table 3: Summary of Compaction Test Results
River Sand
(%)
Maximum Dry Density
(g/cm3)
Optimum Moisture
Content (%)
0
5
10
15
20
25
1.53
1.60
1.61
1.61
1.63
1.65
18.00
17.90
17.70
17.60
17.70
17.80
It could be observed from Table 3 that optimum moisture content of the soil decreases with
increase in river sand content while maximum dry density of the soil increased considerably with
increase in river sand. This may be attributed to the molecular rearrangement resulting in the
formation of transitional compounds of different densities.
The particle size distribution test results done on the clay sample using hydrometer analysis
method and that performed on the river sand were presented in charts. Figures 1 and 2 show the
result of the particle size distribution of both the clay and the river sand.
GSJ: Volume 7, Issue 4, April 2019 ISSN 2320-9186
248
GSJ© 2019 www.globalscientificjournal.com
Figure 1: Particle Size Distribution of Clay Sample
Figure 2: Particle Size Distribution of River Sand
From the hydrometer analysis, it was found that the sample contained 13.5 % clay, 47 % silt and
39.5 % sand with low liquid and plastic limit. This low liquid and plastic limit can be traced to
the high content of silt and sand present. The sand is mainly medium to fine grained. Therefore
the soil sample is classified as silty-sand-clay. The sand, silt and clay particles present in the soil
GSJ: Volume 7, Issue 4, April 2019 ISSN 2320-9186
249
GSJ© 2019 www.globalscientificjournal.com
samples are important in achieving a higher degree of compaction and the desired densification.
The coefficient of uniformity (Cu) and the coefficient of curvature (Cc) of river sand were gotten
to be 4.28 and 1.0 respectively. Therefore the river sand was classified as a well-graded medium
sand.
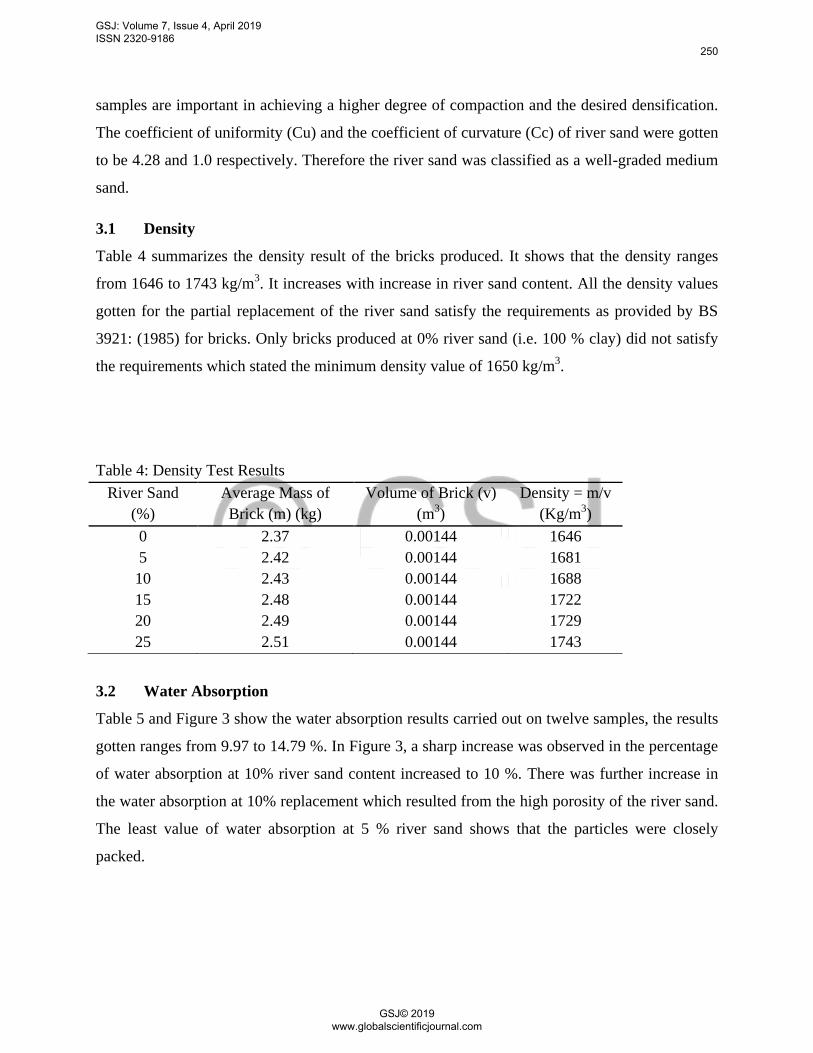
3.1 Density
Table 4 summarizes the density result of the bricks produced. It shows that the density ranges
from 1646 to 1743 kg/m3. It increases with increase in river sand content. All the density values
gotten for the partial replacement of the river sand satisfy the requirements as provided by BS
3921: (1985) for bricks. Only bricks produced at 0% river sand (i.e. 100 % clay) did not satisfy
the requirements which stated the minimum density value of 1650 kg/m3.
Table 4: Density Test Results
River Sand
(%)
Average Mass of
Brick (m) (kg)
Volume of Brick (v)
(m3)
Density = m/v
(Kg/m3)
0
5
10
15
20
25
2.37
2.42
2.43
2.48
2.49
2.51
0.00144
0.00144
0.00144
0.00144
0.00144
0.00144
1646
1681
1688
1722
1729
1743
3.2 Water Absorption
Table 5 and Figure 3 show the water absorption results carried out on twelve samples, the results
gotten ranges from 9.97 to 14.79 %. In Figure 3, a sharp increase was observed in the percentage
of water absorption at 10% river sand content increased to 10 %. There was further increase in
the water absorption at 10% replacement which resulted from the high porosity of the river sand.
The least value of water absorption at 5 % river sand shows that the particles were closely
packed.
GSJ: Volume 7, Issue 4, April 2019 ISSN 2320-9186
250
GSJ© 2019 www.globalscientificjournal.com
Table 5: Water Absorption Test Results at Varying River Sand Replacement
River Sand
(%)
Sample
number
Initial Wt. of
Specimen
W1 (g)
Final Wt. of
Specimen
W2 (g)
% Water
Absorption
Average.
%Water
Absorption
0
5
10
15
20
25
A
B
A
B
A
B
A
B
A
B
A
B
2498
2546
2323
2453
2450
2472
2350
2395
2458
2401
2505
2485
2813
2833
2553
2699
2772
2812
2675
2730
2804
2759
2878
2850
12.61
11.27
9.91
10.02
13.14
13.75
13.83
13.99
14.08
14.91
14.89
14.69
11.94
9.97
13.45
13.91
14.50
14.79
Figure 3: Water Absorption of Clay Burnt Bricks Replaced with River Sand
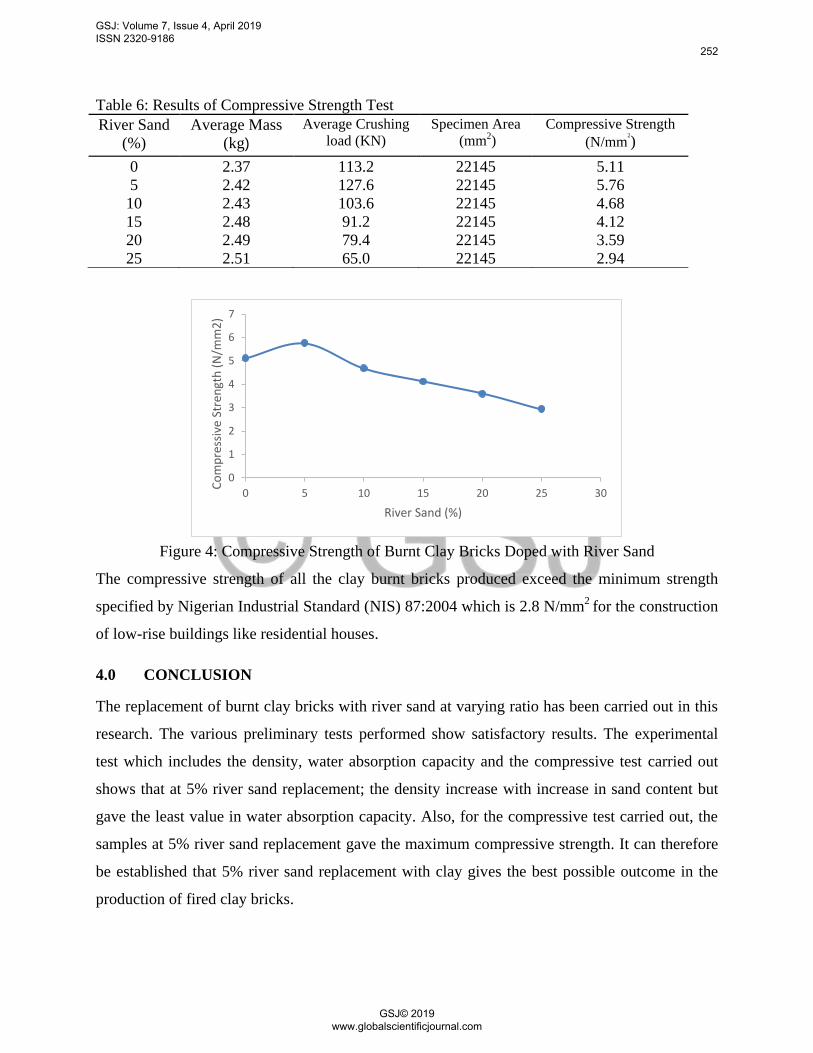
3.3 Compressive Strength
Table 6 and Figure 4 show the compressive strength result. The compressive strength results
ranges from 2.94 and 5.76 N/mm2. It can be seen that the value of the compressive strength
increase from 5.11 at 0% replacement to a value of 5.76 N/mm2 at 5 % river sand replacement.
After the increment, a steady decrease was observed in the compressive strength as the
percentage replacement of river sand increases in the brick produced.
0
2
4
6
8
10
12
14
16
0 5 10 15 20 25 30
Wat
er A
bso
rpti
on
(%
)
River Sand (%)
GSJ: Volume 7, Issue 4, April 2019 ISSN 2320-9186
251
GSJ© 2019 www.globalscientificjournal.com
Table 6: Results of Compressive Strength Test
River Sand
(%)
Average Mass
(kg)
Average Crushing
load (KN)
Specimen Area
(mm2) Compressive Strength
(N/mm2
)
0
5
10
15
20
25
2.37
2.42
2.43
2.48
2.49
2.51
113.2
127.6
103.6
91.2
79.4
65.0
22145
22145
22145
22145
22145
22145
5.11
5.76
4.68
4.12
3.59
2.94
Figure 4: Compressive Strength of Burnt Clay Bricks Doped with River Sand
The compressive strength of all the clay burnt bricks produced exceed the minimum strength
specified by Nigerian Industrial Standard (NIS) 87:2004 which is 2.8 N/mm2
for the construction
of low-rise buildings like residential houses.
4.0 CONCLUSION
The replacement of burnt clay bricks with river sand at varying ratio has been carried out in this
research. The various preliminary tests performed show satisfactory results. The experimental
test which includes the density, water absorption capacity and the compressive test carried out
shows that at 5% river sand replacement; the density increase with increase in sand content but
gave the least value in water absorption capacity. Also, for the compressive test carried out, the
samples at 5% river sand replacement gave the maximum compressive strength. It can therefore
be established that 5% river sand replacement with clay gives the best possible outcome in the
production of fired clay bricks.
0
1
2
3
4
5
6
7
0 5 10 15 20 25 30
Co
mp
ress
ive
Stre
ngt
h (
N/m
m2
)
River Sand (%)
GSJ: Volume 7, Issue 4, April 2019 ISSN 2320-9186
252
GSJ© 2019 www.globalscientificjournal.com
REFERENCES
Adegoke, C.O. and Ajayi, J.A. (2003): “Manufacturing and Industrial Capacity Building in
Nigeria: Imperative of Appropriate Technology”, Proceedings of National Engineering
Conference on the Engineer in the Nigerian Society, NSE, 8-12th
Dec., Ibadan, Pp.67- 71.
Alaa, A.S. and Ali, A.M. (2013): Manufacturing of Bricks in the Past, in the Present and in the
Future: A state of the Art Review. International Journal of Advances in Applied
Sciences vol 2: 145-156.
Augenbroe G, Pearce AR, Guy B and Kibert CJ (1998) Sustainable construction in the United
States of America. CIB-W82 World Congress Report. See http://mac.com (accessed
18/05/2011).
British Standards Institution, BS 3921, (1985): British Standard Specification for Clay Bricks
London, United Kingdom.
BS EN 1097-5: 2008. Tests for Mechanical and Physical Properties of Aggregates.
Determination of the Water Content by Drying in a Ventilated Oven. British Standards
Institution, London, United Kingdom.
Edward, A. and Robert, H. (2011): Fundamental of Residential Construction. 3rd edition, John
Wiley & Sons, San Francisco, USA, pp. 1-672.
Edwards, B. and Hyett, P. R. (2001) Guide to Sustainability. RIBA, London, UK.
Encarta English Dictionary (2009); Website: www.microsoft encarta.com.
Fernando, P.R. (2017): Experimental Investigation of the Effect of Fired Clay Brick on Partial
Replacement of Rice Husk Ash (RHA) with Brick Clay. Advance Recycling Waste
Management 2: 120-127.
Hadjri K, Osmani M and Baiche B (2007) Attitudes towards earth building for Zambian housing
provision. Proceedings of the Institution of Civil Engineers – Engineering Sustainability
160(3): 141–149, http://dx.doi.org/10.1680/ensu.2007.160.3.
Hendry, A.W. (1991): Reinforced and Prestressed Concrete. Longman Scientific and technical,
John Wiley and sons, Inc., New York.
GSJ: Volume 7, Issue 4, April 2019 ISSN 2320-9186
253
GSJ© 2019 www.globalscientificjournal.com
Kim, J. J. and Rigdon, B. (1998). Sustainable Architecture Module: Qualities, Use and Examples
of Sustainable Building Materials. National Pollution Prevention Center for Higher
Education, University of Michigan, Ann Arbor, MI, USA.
Maxwell, J. C. (2007): The Holy Bible – NKJV, the Maxwell Leadership Bible.
Olusola, K. O. (2005); “Factors Affecting Compressive Strength and Elastic Properties of
Laterized Concrete”, Unpublished Ph.D. Thesis, Department of Building, Obafemi
Awolowo University, Ile-Ife.
Raut, S.P. Ralegaonkar, R.V. and Mandavgane, S.A. (2011): “Development of Sustainable
Construction Material Using Industrial and Agricultural Solid Waste” A review of
waste-create bricks. Construction and Building Material, 25: 4037-4043.
Saridharan, A. and Venkatappa, R. G. (1973): Mechanisms Controlling Volume Change of
Saturated Clay and the Role of the Effective Stress Concept. Geotecnique. 23(3): 359-
382.
Sev, A. (2009). How can the construction industry contribute to sustainable development? A
conceptual framework. Sustainable Development, 17: 161–173.
Tamaraukuro, A. and Japo, O. A. (2016): Improving Durability of Rural Buildings in Riverine
Niger Delta Region: A Case Study on Need to Utilize Appropriate Technology
International Journal of African Society, Cultures and Traditions, Vol.4, No.1, pp.17-43.
Terzaghi, K. Peck, R. B and Mesri, G. (1996): Soil Mechanics in Engineering Practice, John
Wiley & Sons, New York, NY, USA, 1996.
Tse, A.C. and Akpen, G.D. (2008): Suitability of Flood Plain and Deposits for the Production of
Burnt Bricks in Parts of Benue State, Central Nigeria. Journal of Mining and Geology,
Nigerian Mining and Geo-sciences Society, (Accepted for publication), 2008.
GSJ: Volume 7, Issue 4, April 2019 ISSN 2320-9186
254
GSJ© 2019 www.globalscientificjournal.com