Page 1
Accepted Manuscript
Corrosion behavior of Mg-5Al-xZn alloys in 3.5 wt.% NaCl solution
Nguyen Dang Nam, Motilal Mathesh
PII: S0925-8388(14)01593-XDOI: http://dx.doi.org/10.1016/j.jallcom.2014.07.014Reference: JALCOM 31642
To appear in: Journal of Alloys and Compounds
Received Date: 28 November 2012Revised Date: 3 July 2014Accepted Date: 3 July 2014
Please cite this article as: N.D. Nam, M. Mathesh, Corrosion behavior of Mg-5Al-xZn alloys in 3.5 wt.% NaClsolution, Journal of Alloys and Compounds (2014), doi: http://dx.doi.org/10.1016/j.jallcom.2014.07.014
This is a PDF file of an unedited manuscript that has been accepted for publication. As a service to our customerswe are providing this early version of the manuscript. The manuscript will undergo copyediting, typesetting, andreview of the resulting proof before it is published in its final form. Please note that during the production processerrors may be discovered which could affect the content, and all legal disclaimers that apply to the journal pertain.
Page 2
1
Corrosion behavior of Mg-5Al-xZn alloys in 3.5 wt.% NaCl solution
Nguyen Dang Nam1,*, Motilal Mathesh2
1Petroleum Department, Petrovietnam University, Ba Ria City, Ba Ria - Vung Tau
Province 74000, Vietnam
2School of Life and Environmental Sciences, Deakin University, Geelong Waurn Ponds
Campus, Victoria 3220, Australia
*Corresponding author Tel.: Tel.: +84 643 738 879, Fax: +84 643 733 579
E-mail address: [email protected]
ABSTRACT
Five types of Mg-5Al alloys with different weight percentages of Zn ranging from 0
to 4 wt.% were examined using electrochemical techniques and surface analysis. The
electrochemical results indicated that the Mg-5Al alloys containing Zn have a lower
corrosion and hydrogen evolution rates than the Mg-5Al based specimens with a
decrease of value being observed with the decrease in Zn content. Zn addition induced
the precipitation of Mg-Al and Mg-Zn phases in the Mg matrix along with grain
refinement and increased an interaction of Zn oxide with Mg and Al products serving as
a corrosion barrier.
Keywords: Mg alloys, Zinc, Microstructure, Grain refinement, Hydrogen evolution rate,
Corrosion resistance
Page 3
2
1. Introduction
Mg and its alloys are used as engineering materials in automotive, aerospace and
electronic fields [1-3] that requires high specific toughness, high specific strength to
weight ratio and lightweight properties [4]. Magnesium alloys have superior physical
and mechanical properties which make them extremely attractive for applications in
field which have requirement of lightweight materials. Research activities on
magnesium alloys have increased significantly, which includes the development of:
computational materials science and engineering approaches in alloy development
together with thermodynamic and first-principles modeling; mechanistic understanding
and development of creep-resistant casting alloys; mechanistic understanding and
modeling of deformation, including mechanical twinning and dynamic recrystallization;
and texture modification via alloying and processing [5]. However, as one of the most
reactive metals, the poor intrinsic corrosion resistance of magnesium alloys has limited
their widespread application.
Improvements in the mechanical properties and corrosion resistance have led to
greater interest of magnesium alloys for aerospace and special applications. There have
been many attempts to improve the corrosion resistance of magnesium alloys by adding
certain alloying elements [6-15], refining its microstructure [16-21], anti-corrosion
coating [22-27], and control of the orientations [28,29]. At present, it has been
successfully used to enhance the strength and ductility of wrought magnesium alloys
produced via processes such as extrusion, rolling, forging, twin-roll strip casting and
equal channel angular pressing [30-36]. Among these techniques, extrusion is very
useful for its technical and economical advantages in the production of structural
Page 4
3
components [37]. Several wrought magnesium alloys with stable secondary-phase
particles have been developed using grain size refinement by hot extrusion method [38-
46]. In these processes, grain growth could be inhibited due to the dispersion or
precipition of secondary-phase particles and an improved microstructure could be
achieved by thermomechanical processes.
A thinner film formation is featured by Al addition to Mg alloys which contains a
mixture of MgO/Al2O3 and/or Mg(OH)2/Al(OH)3 ameliorating its protective behavior
due to the presence of Al in the passive layer [47,48]. But, Al improves the corrosion
resistance of Mg alloys only at higher concentrations. In recent years, Zn has been
added to improve the mechanical properties [49-51]. The enhancement in the
mechanical properties of these magnesium alloys is due to formation of a long periodic
stacking structure [52-54]. It was reported that the addition of Zn element can
effectively increase the strength and improve the plasticity. In addition, Zn has been
showed to have a great potential for employment in manufacture of new generation
biodegradable implants [45-57]. Zn addition also significantly refined the grain size of
the extruded Mg-Mn alloy as well as enhanced the mechanical properties [58-60]. This
reveals that Zn addition as an alloying element enhances the mechanical property and it
is necessary to provide a base for the understanding of corrosion performance. In order
to determine the corrosion behavior of Mg-5Al alloys in corrosive solutions, this work
was carried out on, Mg-5Al, Mg-5Al-1Zn, Mg-5Al-2Zn, Mg-5Al-3Zn, Mg-5Al-4Zn
alloys and conducted on the basics of electrochemical measurements and surface
analysis.
2. Experimental
Page 5
4
2.1. Specimen preparation
Pure Mg (99.9 %) ingot was melted in a stainless steel crucible under the protection of
gas mixture containing SF6 and CO2. The calculated amounts of 5 wt.% Al and 1, 2, 3,
and 4 wt.% Zn were added to the Mg melt. After solidification, the ingots were
subjected to homogenizing treatment at 400 ˚C for 14 h. The homogenized ingots were
machined, which were used as raw materials for extrusion. The extrusion of billets was
performed at 320 ˚C. In addition to this, extrusion ratio of 25:1 and speed of 0.15 mm/s.
were applied. The chemical compositions of tested alloys were determined by Optical
Emission Spectroscopy. Alloys with chemical compositions were 5.000 Al, 0.005 Si,
0.004 Fe, 0.003 Cu, 0.007 Ni, while the difference between measured and specified
composition of Zn is imperceptible. The specimens for electrochemical tests were first
cold-mounted on a mounting cup and then finished by grinding with 600-grit silicon
carbide paper.
2.2. Electrochemical investigation methods
All of the electrochemical experiments were performed at room temperature in 1000
ml of 0.6 M NaCl solution with aeration. The exposed area was 1 cm2. Potentiodynamic
polarization tests were performed using an EG&G PAR 263A potentiostat for the DC
measurements. A graphite counter electrode was used, with a saturated calomel
electrode as the reference. Prior to the potentiodynamic polarization test, the samples
were immersed in the solution for 1 h in order to stabilize the open-circuit potential. The
potential of the electrodes was swept at a rate of 0.166 mV/s in the range from initial
potential of -250 mV versus Ecorr to final potential of -1.3 VSCE. The electrochemical
impedance spectroscopy (EIS) and corrosion potential measurements were conducted
Page 6
5
using a IM6e system with a commercial software program for the AC measurements.
The amplitude of the sinusoidal perturbation was 10 mV. The frequency range was from
100 kHz to 1 Hz. The hydrogen evolution rate of the alloys was investigated by
immersion tests. The specimens, with dimensions of 10 mm × 10 mm × 2 mm, were
prepared by grinding each side with 600-grid emery paper and degreasing the surfaces
with ethanol prior to corrosion testing. The hydrogen evolution rate was used as an
indicator of the corrosion rate which was monitored every 1 hour. Alloy specimens for
hydrogen gas collection, to characterize the corrosion rate during solution immersion,
were immersed in 1000 ml of 0.6 M NaCl solution with aeration. The hydrogen evolved
during the corrosion experiment was collected in a burette above the corroding
specimens. The overall magnesium corrosion reaction,
Mg + H+ + H2O = Mg
2+ + H2 (1)
shows that one molecule of hydrogen is evolved for each atom of corroded magnesium.
2.3. Surface analysis
The crystal structure of the specimens was investigated by XRD using Cu Kα radiation.
For the observation of the microstructure, optical microscope was used. The specimens
were mechanically sanded with sand paper (#220, 600, 1200, 2000, and 4000) and then
fine polished with 0.1 µm alumina powders. These specimens were then etched in a
mixture of solution containing acetic acid (10 ml), picric acid (5 g), distilled water (10
ml) and ethanol (70 ml of 95% purity). To investigate the relationship between the
electrochemical behavior and surface morphology, the specimens were examined by
SEM after 6 hours of immersion test. The surface products were examined by X-ray
photoelectron spectroscopy (XPS) after 1 h of the open-circuit potential.
Page 7
6
3. Results and discussion
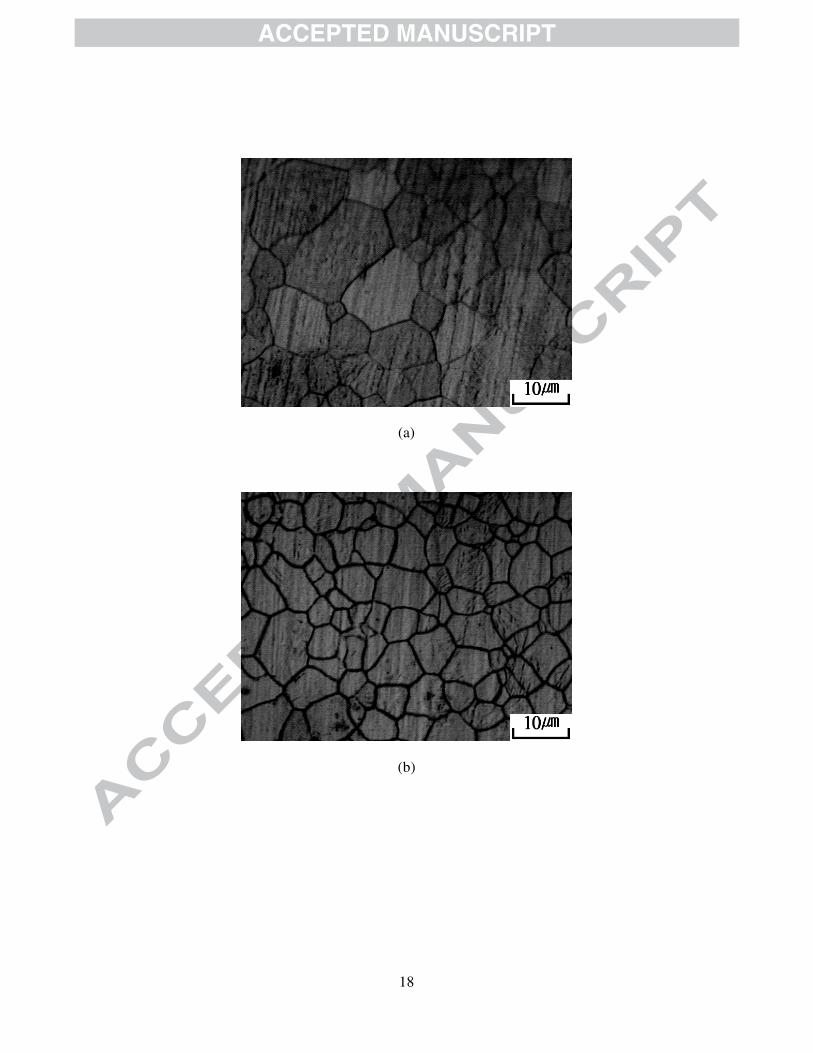
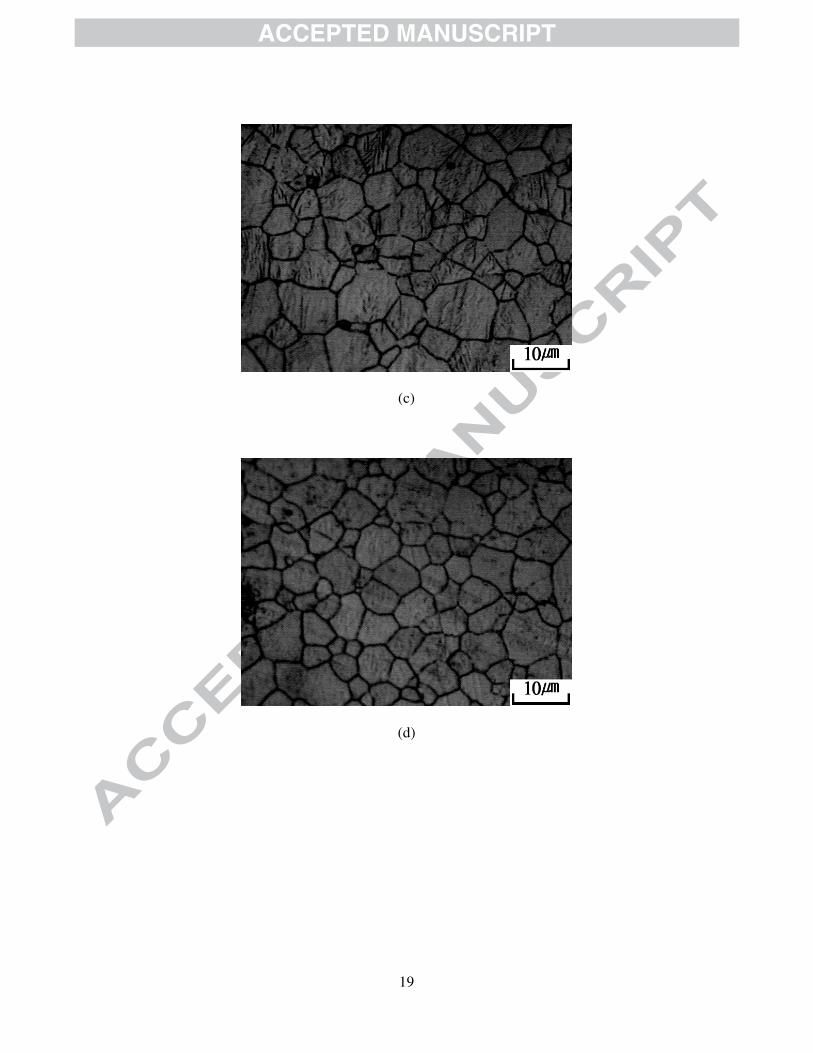
Fig. 1 compares the microstructures of the Mg-5Al alloys with different amounts of
Zn content. The microstructures consisted of only the α-Mg matrix. The addition of Zn
decreased the grain size of the Mg-5Al alloy and also showed appearance of an
increased amount of new fine grains at the grain boundary due to the recrystallization.
In general, the microstructure included primary α grains surrounded by new fine grains.
The specimens had relatively smaller α-Mg grains with increasing Zn content which
may influence the corrosion performance since uniform corrosion product is expected to
act as a barrier. The phase compositions of the specimens were examined by XRD as
shown in Fig. 2. There is no significant difference in the α-Mg peaks between the Mg-
5Al and Zn-containing specimens. The results also show the well-defined peaks of Mg
and Mg17Al12 with an additional peak close to the reflections by Mg2Zn. The intensity
of the Mg2Zn diffraction peaks increases with increasing Zn content due to an increase
reaction between Mg and Zn.
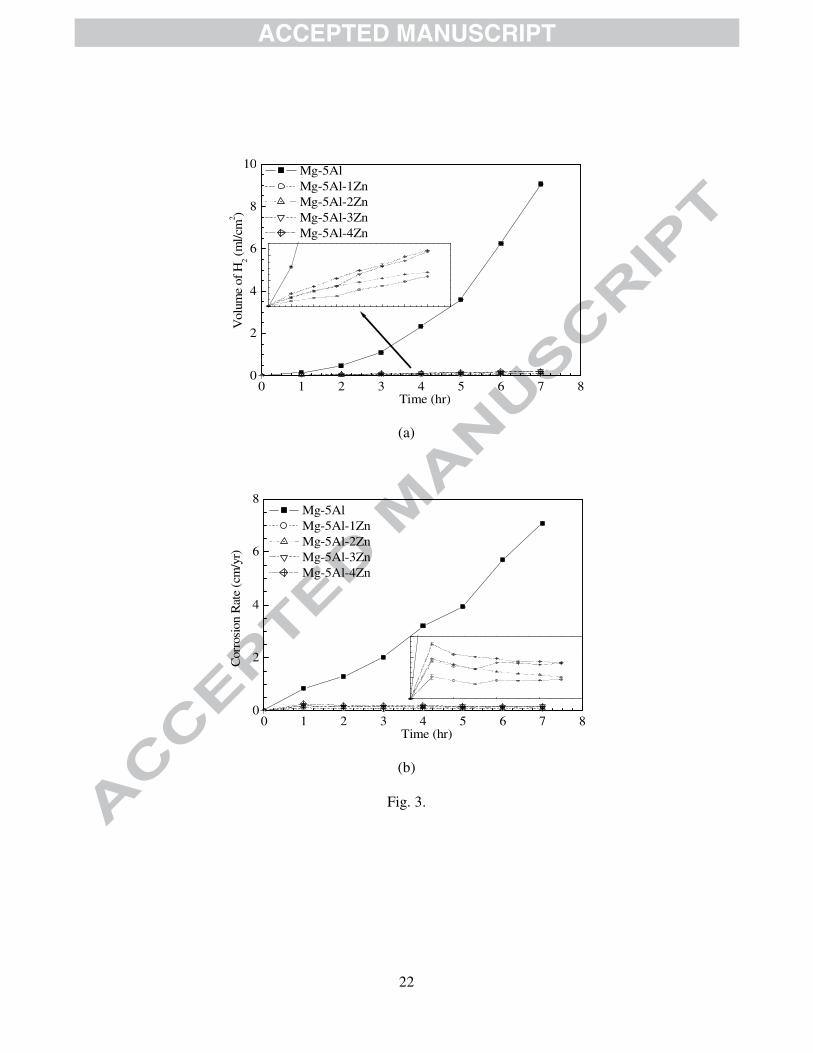
Fig. 3 (a) shows the hydrogen evolution rate and Fig. 3 (b) shows the corrosion rate of
the alloys calculated by hydrogen evolution rate. All specimens exhibited an increase in
hydrogen evolution rate with increasing immersion time during 7 h. The hydrogen
evolution rate for Mg-5Al based alloy increased strongly with exposure time and were
significantly larger than that of Zn-containing specimens. The hydrogen evolution
volume of Mg-5Al-xZn alloys in Fig. 3 (a) can be ranked in a decreasing series as: Mg-
5Al > Mg-5Al-4Zn > Mg-5Al-3Zn > Mg-5Al-2Zn > Mg-5Al-1Zn. The result showed
that the corrosion rate of the Zn-containing samples was stable during 7 h immersion time,
while it increased quickly in case of Mg-5Al based alloy. The result suggested that
Page 8
7
hydrogen evolution rate of a corroding magnesium alloy at its open current potential is
equal to its corrosion rate and reflects to some degree the electrochemical activity of Mg
alloy. In addition, hydrogen evolution rate allows studying the variation in corrosion
rate with immersion time.
Fig. 4 shows the polarization curves of the Mg-5Al alloys as a function of Zn content
in 0.6 M NaCl solution. All alloys demonstrated active corrosion behavior, as the
current density increased continuously with increasing potential. The corrosion current
density increased with increase in Zn content. Table 1 lists the corrosion properties
observed from potentiodynamic polarization. The corrosion rate was determined using
the Tafel extrapolation method, based on Faraday’s law [61-63]:
Corrosion rate (cm/y)ρ××
×××=
Fz
Micorr
71016.3
(2)
where icorr is the corrosion current density (A/cm2), M is the molar mass of the metal
(g/mole), z is the number of electrons transferred per metal atom, F is the Faraday’s
constant, and ρ is the density of the metal (g/cm3). Polarization resistance (Rp) value
was obtained from eq (2) [64]:
)(3.2 cacorr
cap
iR
ββ
ββ
+×= (3)
where βa and βc are the anodic and cathodic Tafel slope, respectively. The corrosion
current density of the alloys was calculated using Eq. (3) under the assumption that βa
and βc are equal to 0.1 V/decade. Similarly, corrosion rate of the alloys was calculated
from the EIS measurements by using Eq. (2).
Fig. 5 (a) and (b) present the Nyquist and Bode plots after immersion for 1 h at Ecorr.
The high spectra are used to detect the local surface defects, whereas the medium and
Page 9
8
low frequency spectra detect the processes within the corrosion product and at the
metal/corrosion product interface, respectively. The impedance spectrum of the Mg-
5Al-xZn alloy exhibits a capacitive loop in the high frequency range and an inductive
loop in the low frequency range. The aperture of impedances and impedance modulus
|Z| of the Zn-containing alloys are greater than that of the Mg-5Al based alloy which
increase with a decrease of Zn content. These results confirmed the increase in
impedance gained via the addition of Zn due to the formation of a corrosion product
layer. The electrochemical response to the impedance tests for these materials was best
simulated with the equivalent circuits as shown in Fig. 5 (c) [65], in which Rs represents
the solution resistance between working electrode and reference electrode. Rc represents
resistance of corrosion product layer, Cc represents capacitance of corrosion product
layer, CPE represents the constant phase element for the double layer capacitance, Rct
represents the charge transfer resistance during electrochemical reaction. A constant-
phase element representing a shift from an ideal capacitor was used instead of the
capacitance itself, for simplicity. The impedance of a phase element is defined as:
ZCPE = [C(jω)n]-1
(4)
where C is capacitance; j is the current; ω is the frequency and -1 = n = 1. The value of
n seems to be associated with the non-uniform distribution of current as a result of
roughness and surface defects. The n value of a CPE indicates: capacitance, Warburg
impedance, resistance and an inductance when n=1, 0.5, 0, -1 respectively. In the
present study, n was consistently maintained near 0.8, as a result of the deviation from
ideal dielectric behavior. The low frequency inductance loop is described with Rdiff
(inductance resistance) and L (inductance). In this case, the polarization resistance, Rp,
is calculated from the equivalent circuit in Fig. 4 (c) as shown in the equation:
Page 10
9
Rp = Rs + Rct + Rdiff (5)
The fitting results are presented in Table 2. It indicates that resistances of Zn-containing
specimens are much higher than that of Mg-5Al based alloy which increases with
decrease of Zn content.
Fig. 6 compares the average corrosion rate for alloys obtained from hydrogen
evolution rate measurement and electrochemical methods. The corrosion rate in the case
of the electrochemical measurements can be inferred from the corrosion current density,
based on Faraday’s law. In addition, the hydrogen evolution volume rate, VH (ml/cm2.d)
can be related to the corrosion rate according to the equation [66]:
PH (cm/y) = 0.2279 VH (6)
The average corrosion rate of the alloys using the above methods was ranked in the
following order: Mg-5Al > Mg-5Al-4Zn > Mg-5Al-3Zn > Mg-5Al-2Zn > Mg-5Al-1Zn.
It indicated that Zn-containing Mg-5Al alloy have lower corrosion rates than Mg-5Al
based alloy, and the corrosion rate decreases with decreasing Zn content. In summary,
the electrochemical and hydrogen evolution rate measurements showed that the
corrosion resistance of Mg-5Al alloy can be improved significantly by Zn addition.
Fig. 7 shows SEM images of the surface morphology after the hydrogen evolution test
for 7 h immersion at Ecorr. A severe corrosion was observed on the Mg-5Al based alloy
due to large number of hydrogen bubbles, while less corrosion was observed in case of
Zn containing specimens, especially for Mg-5Al-1Zn.
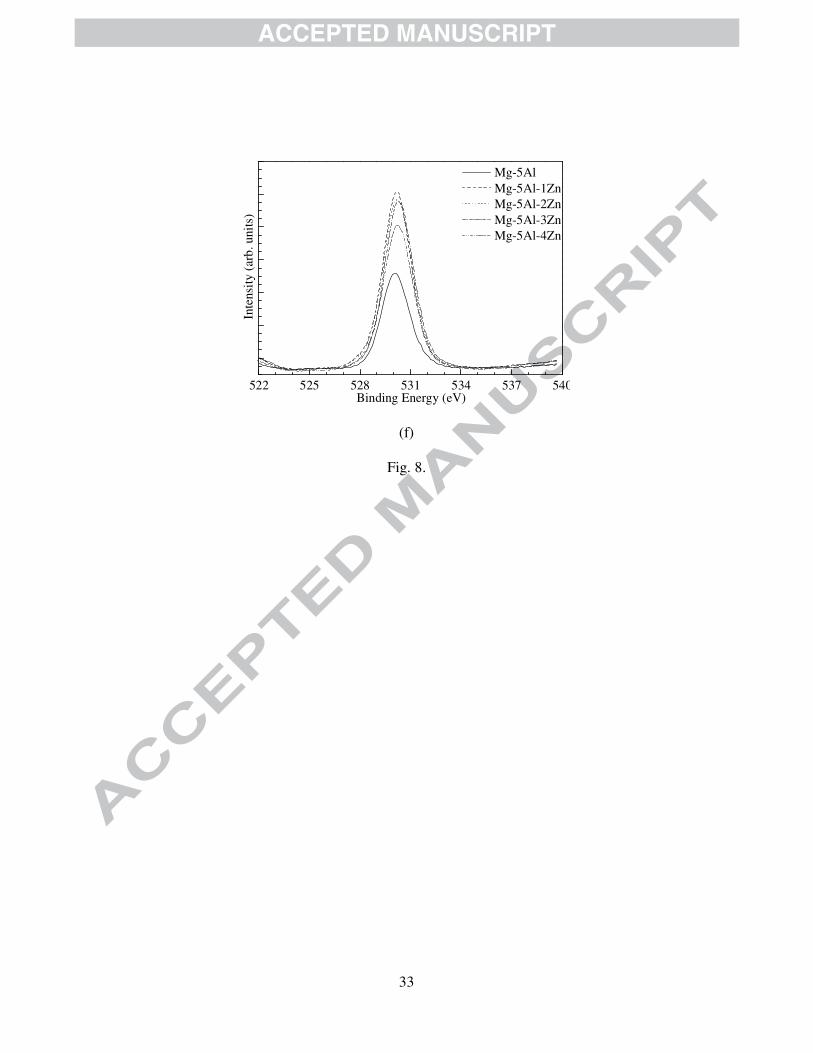
Fig. 8 shows XPS results of the specimen surfaces after exposing the alloys to the 0.6
M NaCl solution for 1 h at room temperature. This figure shows that the peaks of Mg,
Al, Cl, Zn and O exist. Oxygen KVV correspond to peak in the region near 1100 eV.
The narrow XPS spectra for Mg 2p, Al 2p, Zn 2p, Cl 2p, and O 1s regions are shown in
Page 11
10
Figs. 8 (b, c, d, e and f), respectively. The spectra of Mg 2s, 2p and Al 2p corresponds to
MgO/Mg(OH)2 and Al2O3/Al(OH)3 on the surface of the alloys. When specimens are
immersed in 0.6 M NaCl solution, the corrosion attack on magnesium is severe due to
easy penetration of the oxide/hydroxide products by Cl‾ ions and the formation of a
basic chloride salt (MgCl2), which is readily accommodated in the layered structure of
MgO/Mg(OH)2 and Al2O3/Al(OH)3. The O 1s spectra were composed of two peaks
corresponding to the signals from oxygen in the oxide at 530.05 eV and oxygen in the
hydroxyl groups at 531.70 eV. In addition, a small Cl peak was observed in the Mg-5Al-
1Zn specimen. This figure also shows the appearance of Al 2p and O 1s peaks which are
enriched with decreasing Zn content, while lesser intensity Mg peak was obtained in the
case of Mg-5Al alloy. The binding energy of Zn 2p was approximately 1020 eV as
shown in Fig. 8 (f). The presence of ZnO on the surface of the Zn-containing alloys
decreased the corrosion rate due to a decrease in the hydrogen evolution rate. Compared
to the Zn 2p oxide peaks in Fig. 8 (f), the alloy contribution for the 1 wt.% Zn-
containing alloy has higher peaks than the peaks from other alloys. The results indicated
that the enriched Mg, Al and Zn products played an important role in improving the
corrosion products of magnesium alloys, thereby providing better corrosion protection
which inhibited the adsorption of Cl- ions.
4. Conclusions
The addition of Zn caused a decrease in grain size of the α-Mg solid solution phase.
The corrosion and hydrogen evolution rates of Zn-containing alloys were lower than
that of Mg-5Al based alloy which increased with increasing Zn content. EIS showed
Page 12
11
that the semicircle was less depressed in case of Zn-containing specimens. In addition,
the total resistance also decreased with increasing Zn content. Zn addition to Mg-5Al
alloys facilitates the formation and interaction of Mg, Al, and Zn oxides on the alloy
surface. In addition, the amount of chloride in the surface products decreases with
decreasing Zn content, indicating a more adherent corrosion products on the Mg-5Al-
1Zn alloy surface.
Acknowledgement
The authors are grateful for the support of Vietnam Oil and Gas Group, PetroVietnam
University and the National Foundation for Sciences and Technology Development
(NAFOSTED 2014).
Page 13
12
References
[1] G.L. Makar, J. Kruger, J. Electrochem. Soc. 37 (1990) 414-421.
[2] S. Schumann, H. Friedrich, The use of magnesium in cars - Today and in future.
In: B.L. Mordike, K.U. Kainer, Editors, Magnesium Alloys and Their Application,
Volkswagen AG, Wolfsburg (1998).
[3] B. Viehweger, A. Karabet, M. During, L. Schaeffer, Mat.-wiss. u. Werkstofftech
36 (2005) 211-217.
[4] S. Schumann, H. Friedrich, Engineering requirements, strategies and examples, in:
Magnesium Technology, Metallurgy, Design Data, Applications, H.E. Friedrich,
B.L. Mordike (Eds.), Berlin (2006).
[5] S.R. Agnewa, J.F. Nie, Scripta Mater. 63 (2010) 671-673.
[6] N.D. Nam, W.C. Kim, J.G. Kim, K.S. Shin, H.C. Jung, J Alloys Compd. 509
(2011) 4839-4847.
[7] K.H. Kim, N.D. Nam, J.G. Kim, K.S. Shin, H.C. Jung, Intermetallics 19 (2011)
1831-1838.
[8] Y. Liu, Q. Wang, Y. Song, D. Zhang, S. Yu, X. Zhu, J Alloys Compd. 473 (2009)
550-556.
[9] S. Candan, M. Unal, E. Koc, Y. Turen, E. Candan, J Alloys Compd. 509 (2011)
1958-1963.
[10] N.D. Nam, J.G. Kim, K.S. Shin, H.C. Jung, Scripta Mater. 63 (2010) 625-628.
[11] J. Zhang, Z. Leng, M. Zhang, J. Meng, R. Wu, J Alloys Compd. 509 (2011) 1069-
1078.
Page 14
13
[12] N.D. Nam, M.Z. Bian, M. Forsyth, M. Seter, M. Tan, K.S. Shin, Corros. Sci. 64
(2012) 263-271.
[13] E.P. Banczek, L.M.C. Zarpelon, R.N. Faria, I. Costa, J Alloys Compd. 479 (2009)
342-347.
[14] W.C. Kim, N.D. Nam, J.G. Kim, J.I. Lee, Electrochem. Solid-State Lett. 14 (2011)
C21-C24.
[15] N.D. Nam, W.C. Kim, J.G. Kim, K.S. Shin, H.C. Jung, Corros. Sci. 51 (2009)
2942-2949.
[16] M. Sun, G. Wu, J. Dai, W. Wang, W. Ding, J Alloys Compd. 494 (2010) 426-433.
[17] B. Homayun, A. Afshar, J Alloys Compd. 607 (2014) 1-10.
[18] Q. Liu, W. Cheng, H. Zhang, C. Xu, J. Zhang, J Alloys Compd. 590 (2014) 162-
167.
[19] N.D. Nam, M. Mathesh, M. Forsyth, D.S. Jo, J Alloys Compd. 542 (2012) 199-
206.
[20] S. Liu, Y. Zhang, H. Han, J Alloys Compd. 491 (2010) 325-329.
[21] R. Zeng, K.U. Kainer, C. Blawert, W. Dietzel, J Alloys Compd. 509 (2011) 4462-
4469.
[22] T.M. Yue, H. Xie, X. Lin, H.O. Yang, J Alloys Compd. 512 (2012) 328-331.
[23] M. Laleh, F. Kargar, J Alloys Compd. 509 (2011) 9150-9156.
[24] H.-W. Chang, M.-X. Zhang, A. Atrens, H. Huang, J Alloys Compd. 587 (2014)
527-532.
[25] S. Sonmez, B. Aksakal, B. Dikici, J Alloys Compd. 596 (2014) 125-131.
[26] T. Tokunaga, K. Matsuura, M. Ohno, J Alloys Compd. 601 (2014) 179-185.
Page 15
14
[27] L. Rama Krishna, G. Poshal, A. Jyothirmayi, G. Sundararajan, J Alloys Compd.
578 (3013) 355-361.
[28] K.S. Shin, M.Z. Bian, N.D. Nam, JOM (2012) 664-670.
[29] C.R. McCall, M.A. Hill, and R.S. Lillard, Corros. Eng. Sci. Technol. 40 (2005)
337-343.
[30] B.H. Lee, S.M. Kim, M.E. Mehtedi, E. Evangelista, C.S. Lee, Met. Mater. Int. 16
(2010) 197-203.
[31] M.J. Tan, X. Zhang, Mater. Sci. Eng. A 244 (1998) 80-85.
[32] K.K. Deng, K. Wu, X.J. Wang, Y.W. Wu, X.S. Hu, M.Y. Zheng, W.M. Gan, H.G.
Brokmeier, Mater. Sci. Eng. A 527 (2010) 1630-1635.
[33] J. Miao, B. Ye, Q. Wang, T. Peng, J Alloys Compd. 561 (2013) 184-192.
[34] Y.S. Jeong, W.J. Kim, Corros. Sci. 82 (2014) 392-403.
[35] G.F. Lima, M.R.M. Triques, C.S. Kiminami, W.J. Botta, A.M. Jorge Jr., J Alloys
Compd. (2014) S405-S408.
[36] F.M. Lu, A.B. Ma, J.H. Jiang, D.H. Yang, Y.C. Yuan, L.Y. Zhang, J Alloys
Compd. (2014) 140-145.
[37] V.V.B. Prasad, B.V.R. Bhat, Y.R. Mahajan, P. Ramakrishnan, Mater. Manuf.
Process. 16 (2001) 841-853.
[38] H. Somekawa, T. Mukai, Mater. Sci. Eng. A 459 (2007) 366-370.
[39] S.S. Park, G.T. Bae, D.H. Kang, I.H. Jung, K.S. Shin, N.J. Kim, Scripta Mater. 57
(2007) 793-796.
[40] T. Homma, N. Kunito, S. Kamado, Scripta Mater. 61 (2009) 644-647.
[41] K.O. Ishi, C.L. Mendis, T. Homma, S. Kamado, T. Ohkubo, K. Hono, Acta Mater.
57 (2009) 5593-5604.
Page 16
15
[42] T. Homma, C.L. Mendis, K. Hono, S. Kamado, Mater. Sci. Eng. A 527 (2010)
2356-2362.
[43] M.A. Jabbari-Taleghani, J.M. Torralba, J Alloys Compd. 595 (2014) 1-7.
[44] W.X. Wu, L. Jin, Z.Y. Zhang, W.J. Ding, J. Dong, J Alloys Compd. 585 (2014)
111-119.
[45] Q. Wang, K. Liu, Z. Wang, S. Li, W. Du, J Alloys Compd. 602 (2014) 32-39.
[46] X. Xia, Q. Chen, J. Li, D. Shu, C. Hu, S. Huang, Z. Zhao, J Alloys Compd. 610
(2014) 203-211.
[47] Z.P. Xu, G.Q. Lu, Chem. Mater. 17 (2005) 1055-1062.
[48] J.H. Zhang, X.L. Zhoub, J.A. Wang, J. Mol. Catal. A-Chem. 247 (2006) 222-226.
[49] Y. Gao, Q.D. Wang, J.H. Gu, Y. Zhao, Y. Tong, D.D. Yin, J Alloys Compd. 477
(2009) 374-378.
[50] X.B. Liu, R.S. Chen, E.H. Han, J. Alloys Compd. 465 (2008) 232-238.
[51] T. Honma, T. Ohkubo, S. Kamado, K. Hono, Acta Mater. 55 (2007) 4137-4150.
[52] T. Homma, N. Kunito, S. Kamado, Scripta Mater. 61 (2009) 644-647.
[53] K. Liu, J.H. Zhang, G.H. SU, D.X. Tang, L.L. Rokhlin, F.M. Elkin, J. Meng, J
Alloys Compd. 481 (2009) 811-818.
[54] Y.M. Zhu, A.J. Morton, J.F. Nie, Acta Mater. 58 (2010) 2936-2947.
[55] D.D. Yin, Q.D. Wang, Y. Gao, C.J. Chen, J. Zheng, J Alloys Compd. 509 (2011)
1696-1704.
[55] B. Zberg, P.J. Uggowitzer, J.F. Löffler, Nat. Mater. 8 (2009) 887-891.
[56] J. Zhang, N. Kong, Y. Shi, J. Niu, L. Mao, H. Li, M. Xiong, G. Yuan, Corros. Sci.
85 (2014) 477-481.
Page 17
16
[57] Y. Lu, A.R. Bradshaw, Y. L. Chiu, I.P. Jones, The role of precipitates in the bio-
corrosion performance of Mg-3Zn in simulated body fluid, Journal of Alloys and
Compounds (2014), doi: http://dx.doi.org/10.1016/j.jallcom.2014.06.078.
[58] Y.D. Song, Z.E. Lin, Z.S. Yan, Trans. Nonferrous Met. Soc. China 18 (2008) 763-
768.
[59] X. Xia, A.S. Zadeh, C. Zhang, A.A. Luo, X. Zeng, Y.A. Chang, D.S. Stone, J
Alloys Compd. 593 (2014) 71-78.
[60] A. Sanaty-Zadeh, X. Xia, A.A. Luo, D.S. Stone, J Alloys Compd. 583 (2014) 434-
440.
[61] N.D. Nam, J.G. Kim, Corros. Sci. 52 (2010) 3377-3384.
[62] K.H. Kim, S.H. Lee, N.D. Nam, J.G. Kim, Corros. Sci. 53 (2011) 3576-3587.
[63] N.D. Nam, M.J. Kim, Y.W. Jang, J.G. Kim, Corros. Sci. 52 (2010) 14-20.
[64] D.A. Jonse, Principles and Prevention of Corrosion, Printice-Hall, NJ (1996).
[65] X. Yu, J. Wang, M. Zhang, P. Yang, L. Yang, D. Cao, J. Li, Solid State Sci. 11
(2009) 376-381.
[66] Z. Shi, A. Atrens, Corros. Sci. 53 (2011) 226-246.
Page 18
17
Figure captions
Fig. 1. Optical microscope of (a) Mg-5Al, (b) Mg-5Al-1Zn, (c) Mg-5Al-2Zn, (d) Mg-
5Al-3Zn, and (e) Mg-5Al-4Zn alloys.
Fig. 2. XRD patterns of (a) Mg-5Al, (b) Mg-5Al-1Zn, (c) Mg-5Al-2Zn, (d) Mg-5Al-
3Zn, and (e) Mg-5Al-4Zn alloys: a; α-Mg, b; Mg17Al12, and c; Mg2Zn.
Fig. 3. (a) Hydrogen evolution and (b) Corrosion rate of the Mg-5Al-xZn samples
immersed in 3.5 wt.% NaCl at room temperature as function of immersion time.
Fig. 4. Potentiodynamic polarization curves of Mg-5Al as a function of Zn content.
Fig. 5. Impedance spectra on (a) Nyquist plots and (b) Bode plots and (c) equivalent
circuit for fitting the EIS data.
Fig. 6. Average the corrosion rate calculated using potentiodynamic polarization, EIS,
and the hydrogen evolution measurements in 3.5 wt.% NaCl at room temperature.
Fig. 7. SEM images of the specimens tested after 6 h immersion in 3.5 wt.% NaCl at
room temperature: (a) Mg-5Al, (b) Mg-5Al-1Zn, (c) Mg-5Al-2Zn, (d) Mg-5Al-3Zn, and
(e) Mg-5Al-4Zn alloys.
Fig. 8. XPS peak analysis for the surface products of the Mg-5Al-xZn alloys: (a) survey
scan spectra and narrow scan spectra of (b) Mg, (c) Al, (d) Zn, (e) Cl, and (f) O.
Page 22
21
20 30 40 50 60 70 80
(a)
Inte
nsi
ty (
Arb
.un
its)
2θ (Degree)
(b)
(d)
(c)
c b aaa aaaaabb
aaaa(e)
Fig. 2.
Page 23
22
0 1 2 3 4 5 6 7 80
2
4
6
8
10 Mg-5Al
Mg-5Al-1Zn
Mg-5Al-2Zn
Mg-5Al-3Zn
Mg-5Al-4ZnV
olu
me
of
H2 (
ml/
cm2)
Time (hr)
(a)
0 1 2 3 4 5 6 7 80
2
4
6
8 Mg-5Al
Mg-5Al-1Zn
Mg-5Al-2Zn
Mg-5Al-3Zn
Mg-5Al-4Zn
Corr
osi
on R
ate
(cm
/yr)
Time (hr)
(b)
Fig. 3.
Page 24
23
10-6
10-5
10-4
10-3
10-2
10-1
-1.8
-1.7
-1.6
-1.5
-1.4
-1.3
-1.2
Pote
nti
al
(VS
CE)
Current Density (A/cm2)
Mg-5Al
Mg-5Al-1Zn
Mg-5Al-2Zn
Mg-5Al-3Zn
Mg-5Al-4Zn
Fig. 4.
Page 25
24
0 200 400 600 800 1000 1200 1400 1600
-400
-200
0
200
400
600
-Z"
(Ω.c
m2)
Z' (Ω.cm2)
Mg-5Al
Mg-5Al-1Zn
Mg-5Al-2Zn
Mg-5Al-3Zn
Mg-5Al-4Zn
(a)
10-1
100
101
102
103
104
105
106
101
102
103
-20
0
20
40
60
80 Mg-5Al
Mg-5Al-1Zn
Mg-5Al-2Zn
Mg-5Al-3Zn
Mg-5Al-4Zn
|Z
| (Ω
.cm
2)
Frequency (Hz)
Ph
ase
An
gle
(D
eg)
(b)
Page 26
25
Rdiff
LRc
CPE
Cc
Rct
Rs
(c)
Fig. 5.
Page 27
26
0.1
0.2
0.3
0.4
0.70
0.75
0.80
0.85
Mg-5Al-xZn Alloys
Aver
age
Corr
osi
on R
ate
(cm
/yr)
0Zn 1Zn 2Zn 3Zn 4Zn
Fig. 6.
Page 31
30
0 200 400 600 800 1000 1200
O KVV
Zn2p
Mg2p
Al2p
Mg2s
Cl2p
O1s
Mg-5Al
Mg-5Al-1Zn
Mg-5Al-2Zn
Mg-5Al-3Zn
Mg-5Al-4Zn
Binding Energy (eV)
Inte
nsi
ty (
arb
. u
nit
s)
(a)
78 80 82 84 86 88 90 92 94 96 98
Mg2s
Mg-5Al
Mg-5Al-1Zn
Mg-5Al-2Zn
Mg-5Al-3Zn
Mg-5Al-4Zn
Binding Energy (eV)
Inte
nsi
ty (
arb
. u
nit
s)
Page 32
31
40 42 44 46 48 50 52 54 56 58
Mg2p
Mg-5Al-1Zn
Mg-5Al-2Zn
Mg-5Al-3Zn
Mg-5Al-4Zn
Inte
nsi
ty (
arb. unit
s)
Binding Energy (eV)
(b)
62 64 66 68 70 72 74 76 78 80 82
Mg-5Al
Mg-5Al-1Zn
Mg-5Al-2Zn
Mg-5Al-3Zn
Mg-5Al-4Zn
Binding Energy (eV)
Inte
nsi
ty (
arb
. u
nit
s)
(c)
Page 33
32
1000 1010 1020 1030 1040 1050 1060
Mg-5Al-1Zn
Mg-5Al-2Zn
Mg-5Al-3Zn
Mg-5Al-4Zn
Inte
nsi
ty (
arb
. u
nit
s)
Binding Energy (eV)
(d)
190 192 194 196 198 200 202 204 206
Mg-5Al
Mg-5Al-1Zn
Mg-5Al-2Zn
Mg-5Al-3Zn
Mg-5Al-4Zn
Inte
nsi
ty (
arb
. u
nit
s)
Binding Energy (eV)
(e)
Page 34
33
522 525 528 531 534 537 540
Mg-5Al
Mg-5Al-1Zn
Mg-5Al-2Zn
Mg-5Al-3Zn
Mg-5Al-4Zn
Binding Energy (eV)
Inte
nsi
ty (
arb
. unit
s)
(f)
Fig. 8.
Page 35
34
Table 1. Critical parameters from potentiodynamic polarization curves for Mg-5Al-xZn
alloys in 3.5 wt.% NaCl as a function of Zn addition.
Sample Ecorr (VSCE) icorr (µA/cm2 ) βa (V/decade) -βc (V/decade)
#1 -1.53 367 0.051 0.199
-1.54 370 0.025 0.170
-1.54 366 0.023 0.160
Average -1.54 368
#2
-1.57 67 0.020 0.146
-1.54 65 0.018 0.134
-1.53 63 0.019 0.142
Average -1.55 65
#3
-1.55 102 0.016 0.140
-1.57 124 0.019 0.126
-1.54 112 0.017 0.132
Average -1.55 113
#4
-1.55 173 0.022 0.167
-1.55 163 0.015 0.155
-1.56 169 0.020 0.158
Average -1.55 168
#5
-1.56 202 0.033 0.172
-1.57 172 0.035 0.186
-1.57 197 0.033 0.178
Average -1.56 190
Page 36
35
Table 2. Fitting results of EIS measurements (CP = corrosion product).
Specimen Rs
(Ω.cm2)
CCP
(µF/cm2)
RCP
(Ω.cm2)
CPE2 Rct
(Ω.cm2)
L
(H.cm2)
Rdiff
(Ω.cm2) C
(µF/cm2)
n
(0~1)
# 1 15.2 19.1 0.5 102.3 0.4293 131 260 66
# 2 5.4 8.6 52.2 11.5 0.8937 903 3315 230
# 3 5.5 10.9 32.2 32.5 0.8453 783 3121 148
# 4 4.9 11.4 23.1 55.5 0.8239 695 3273 138
# 5 5.2 14.0 10.4 61.0 0.8180 443 3107 108
Page 37
36
Research highlights
Zinc is found to be a good alloying element for corrosion resistance of Mg-5Al alloy
in 3.5 wt.% NaCl solution. Zinc has an advantage of improving corrosion
performance with decreasing zinc content. The benefits of the zinc in corrosion
performance of Mg-5Al alloy is satisfactorily discussed and confirmed by
electrochemical and surface analysis results.