Page 1
Corrosion of Copper and Steel Alloys
in the Presence of Acetobacter sp. in a
Simulated UST Sump Environment
Jeffrey Sowards & Elisabeth Mansfield Applied Chemicals and Materials Division, NIST – Boulder, CO
Collaborators: Chase Williamson & John Spear Dept. of Civil & Environmental Engineering, Colorado School of Mines –
Golden, CO
Page 2
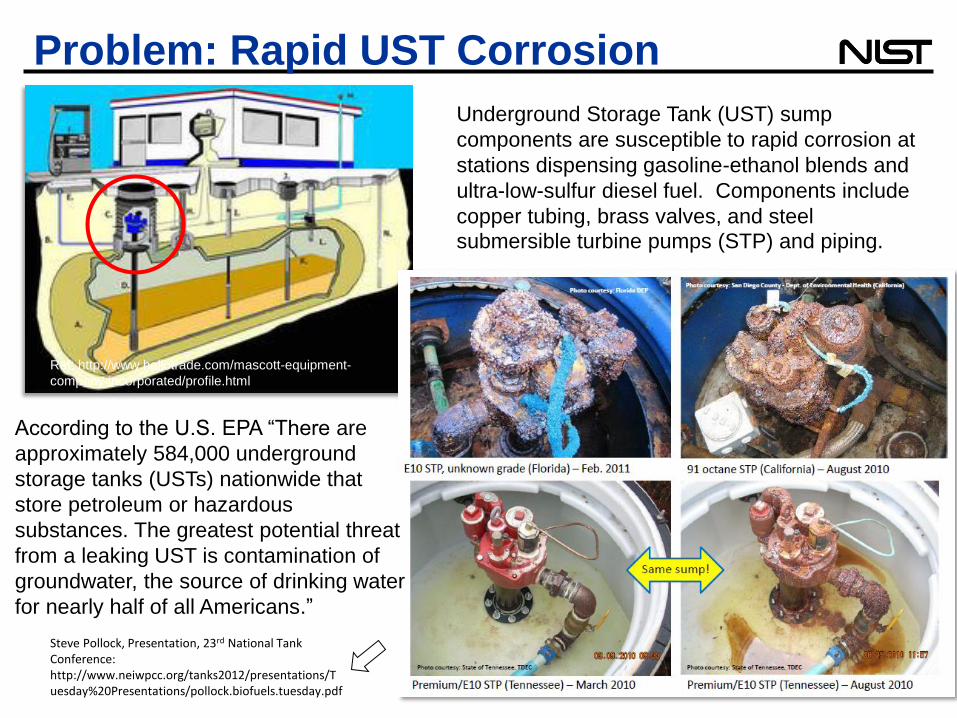
Problem: Rapid UST Corrosion
Ref: http://www.hellotrade.com/mascott-equipment-
company-incorporated/profile.html
Underground Storage Tank (UST) sump
components are susceptible to rapid corrosion at
stations dispensing gasoline-ethanol blends and
ultra-low-sulfur diesel fuel. Components include
copper tubing, brass valves, and steel
submersible turbine pumps (STP) and piping.
Steve Pollock, Presentation, 23rd National Tank Conference: http://www.neiwpcc.org/tanks2012/presentations/Tuesday%20Presentations/pollock.biofuels.tuesday.pdf
According to the U.S. EPA “There are
approximately 584,000 underground
storage tanks (USTs) nationwide that
store petroleum or hazardous
substances. The greatest potential threat
from a leaking UST is contamination of
groundwater, the source of drinking water
for nearly half of all Americans.”
Page 3
Current Objectives
• Test a Hypothesis: Can Acetobacter sp. cause highly accelerated corrosion of UST components in the presence of ethanol?
• Measure the corrosion rates of various materials used in fuel handling exposed to biotically produced acetic acid – These data can aid in determining inspection intervals and other design
protocols for systems handling ethanol fuel
• Develop a test methodology for evaluating corrosion in biofuel systems contaminated with microbes – Such a test will aid in selection of corrosion-resistant materials,
coatings, inhibitors, and biocides
• Improve measurement methodology: Provide measurements to evaluate corrosion real-time and improve measurement strategies to improve predictive nature of measurements. – Such a test will aid in the selection of measurement strategies
necessary to monitor corrosion effectively to prevent devastating failure.
Inspectors of USTs have noticed rapid corrosion and a vinegar-like odor
when accessing the sumps. Microbiologically influenced corrosion (MIC)
is suspected of contributing to the accelerated damage of UST systems
dispensing ethanol-blended fuels.
Page 4
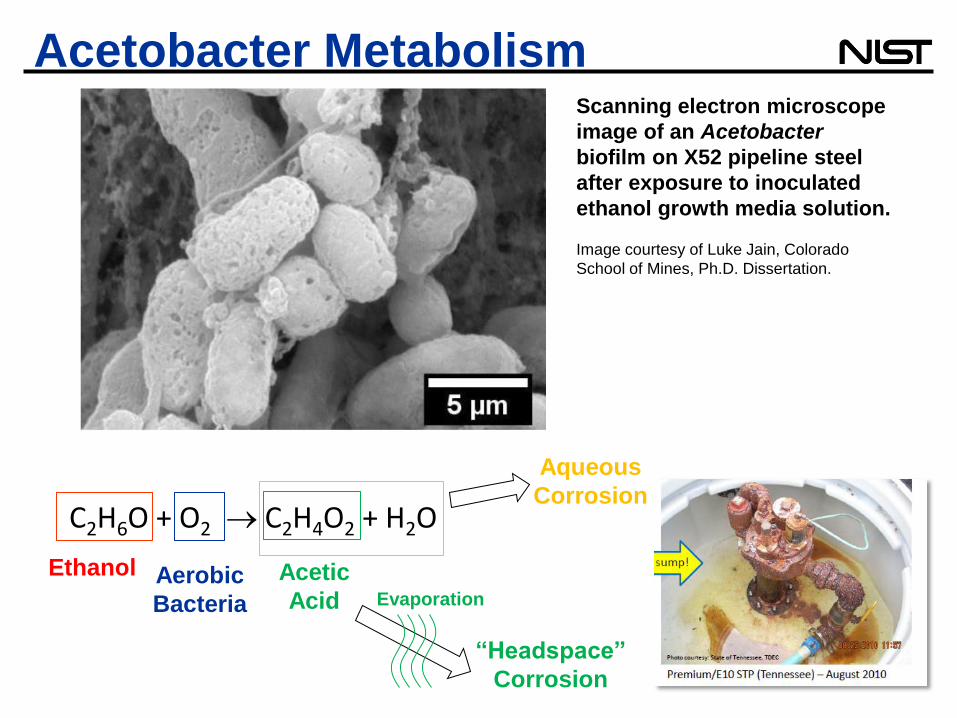
Acetobacter Metabolism Scanning electron microscope
image of an Acetobacter
biofilm on X52 pipeline steel
after exposure to inoculated
ethanol growth media solution.
Image courtesy of Luke Jain, Colorado
School of Mines, Ph.D. Dissertation.
C2H6O + O2 C2H4O2 + H2O
Ethanol Aerobic
Bacteria
Acetic
Acid Evaporation
“Headspace”
Corrosion
Aqueous
Corrosion
Page 5
EXPERIMENTAL METHODS
Bacteria Culture and Corrosion Experiments
Page 6
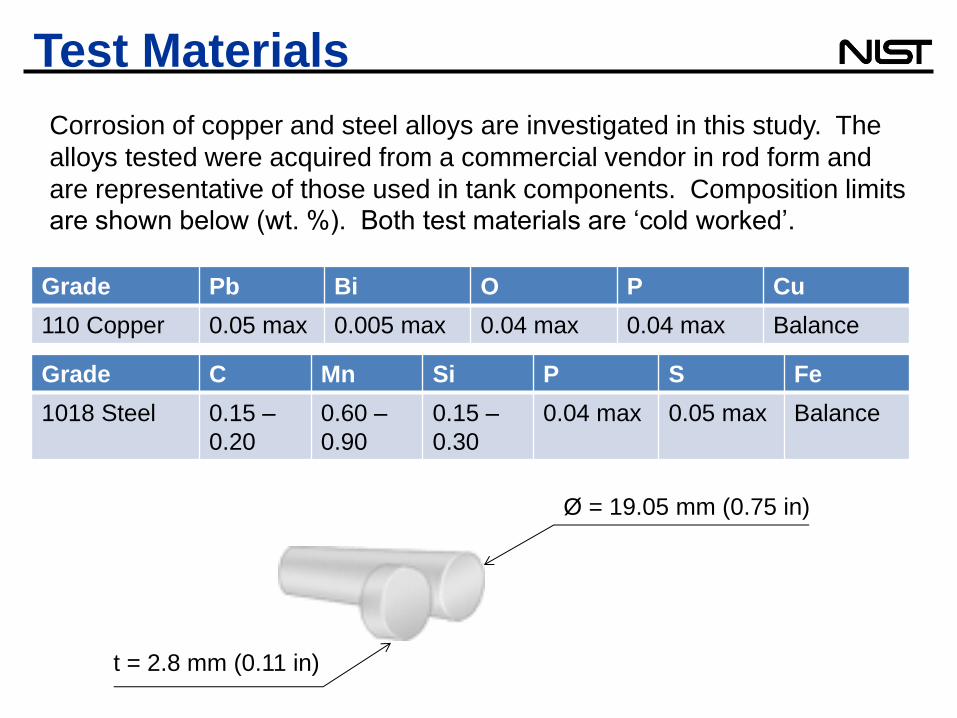
Test Materials
Grade C Mn Si P S Fe
1018 Steel 0.15 –
0.20
0.60 –
0.90
0.15 –
0.30
0.04 max 0.05 max Balance
Grade Pb Bi O P Cu
110 Copper 0.05 max 0.005 max 0.04 max 0.04 max Balance
Ø = 19.05 mm (0.75 in)
t = 2.8 mm (0.11 in)
Corrosion of copper and steel alloys are investigated in this study. The
alloys tested were acquired from a commercial vendor in rod form and
are representative of those used in tank components. Composition limits are shown below (wt. %). Both test materials are ‘cold worked’.
Page 7
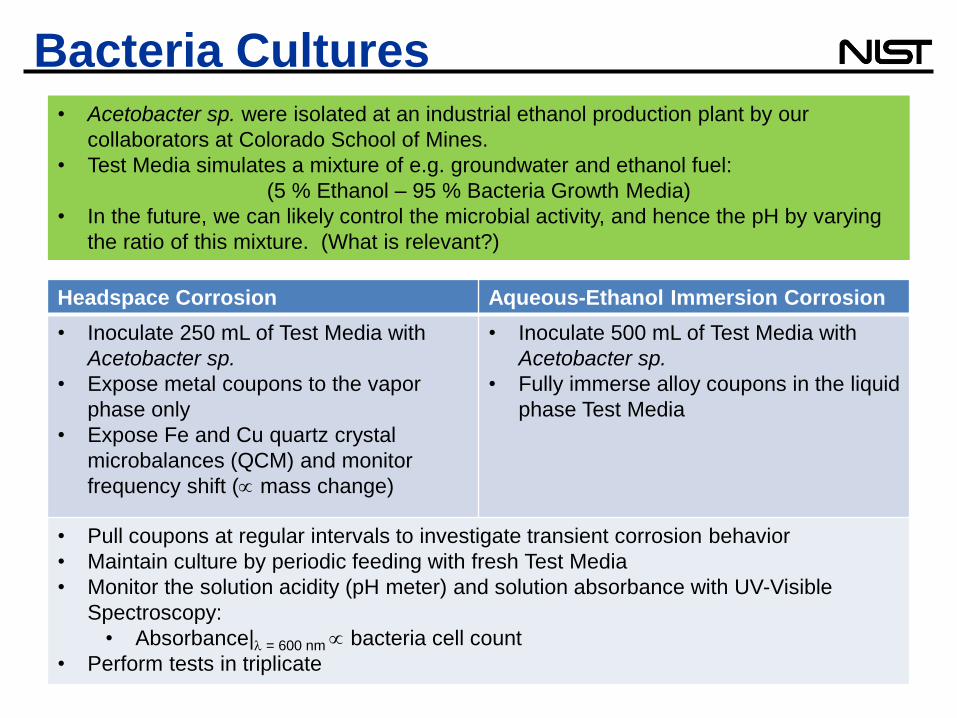
Bacteria Cultures • Acetobacter sp. were isolated at an industrial ethanol production plant by our
collaborators at Colorado School of Mines.
• Test Media simulates a mixture of e.g. groundwater and ethanol fuel:
(5 % Ethanol – 95 % Bacteria Growth Media)
• In the future, we can likely control the microbial activity, and hence the pH by varying
the ratio of this mixture. (What is relevant?)
Headspace Corrosion Aqueous-Ethanol Immersion Corrosion
• Inoculate 250 mL of Test Media with
Acetobacter sp.
• Expose metal coupons to the vapor
phase only
• Expose Fe and Cu quartz crystal
microbalances (QCM) and monitor
frequency shift ( mass change)
• Inoculate 500 mL of Test Media with
Acetobacter sp.
• Fully immerse alloy coupons in the liquid
phase Test Media
• Pull coupons at regular intervals to investigate transient corrosion behavior
• Maintain culture by periodic feeding with fresh Test Media
• Monitor the solution acidity (pH meter) and solution absorbance with UV-Visible
Spectroscopy:
• Absorbance| = 600 nm bacteria cell count
• Perform tests in triplicate
Page 8
Test
Coupon
View looking UP
from Tank Bottom
Coated
QCM
diameter = 19 mm
thickness = 2.8 mm
Inoculated
Test Solution
Pipette
Coupon
Fixture
QCM
Fixture
Tank
(1 L)
𝑃𝐻𝐴𝑐 + 𝑃𝐻2𝑂 + 𝑃𝐸𝑡𝑂𝐻 + 𝑃𝑖
250 mL
Headspace Corrosion Test Setup
Page 9
Measuring Bacteria Kinetics
pH = -0.52ln(t) + 5.6584 R² = 0.9816
0.01
0.1
2
2.2
2.4
2.6
2.8
3
3.2
3.4
3.6
3.8
4
0 200 400 600 800 1000
So
lution
ab
so
rba
nce
(
= 6
00
nm
)
So
lution
acid
ity (
pH
)
Time (hr)
Tank 1 – Copper Headspace
pH = 2.62 ± 0.09
pH(t) = -0.43ln(t) + 5.3084 R² = 0.954
0.01
0.1
1
2
2.2
2.4
2.6
2.8
3
3.2
3.4
3.6
3.8
4
0 200 400 600 800 1000
So
lution
ab
so
rba
nce
(
= 6
00
nm
)
So
lution
acid
ity (
pH
)
Time (hr)
Tank 1 – 1018 Headspace
pH = 2.63 ± 0.04
Liquid samples were collected from the tank
bottoms daily and acidity and Acetobacter cell
density were measured.
• The initial pH was slightly higher in the
copper tests; however, both series of tests
decayed to similar pH levels in the solution.
• The tanks produced repeatable bacteria
behavior in copper and steel corrosion tests.
pH
Optical
Density
Page 10
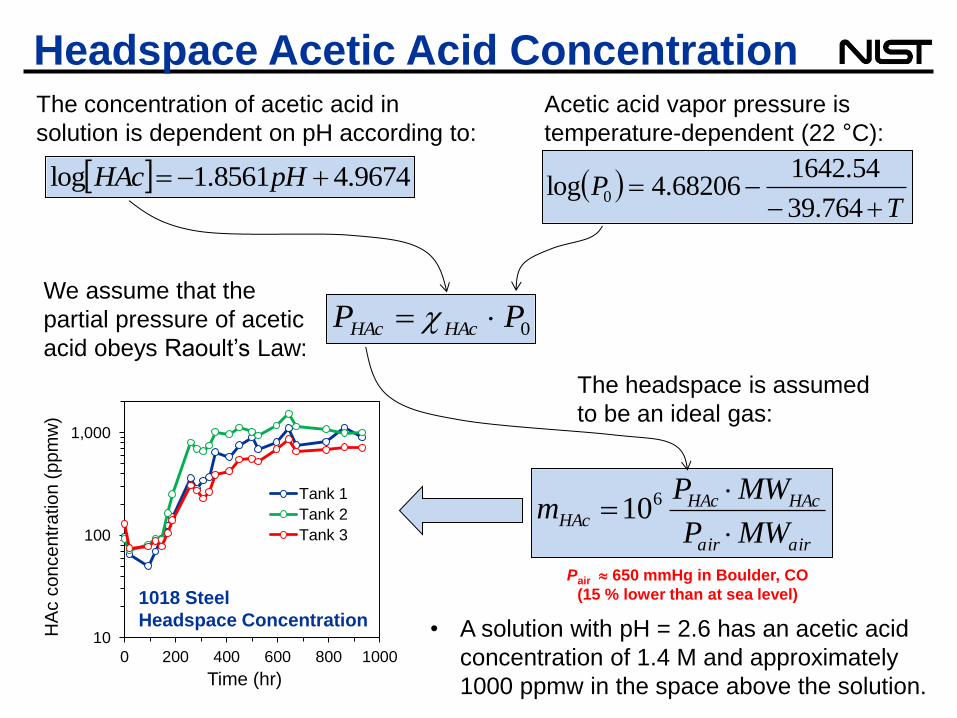
Headspace Acetic Acid Concentration
10
100
1,000
0 200 400 600 800 1000
HA
c c
on
ce
ntr
atio
n (
pp
mw
)
Time (hr)
Tank 1
Tank 2
Tank 3
0PP HAcHAc
T
P
764.39
54.164268206.4log 0
9674.48561.1log pHHAc
airair
HAcHAcHAc
MWP
MWPm
610
Acetic acid vapor pressure is
temperature-dependent (22 °C):
We assume that the
partial pressure of acetic
acid obeys Raoult’s Law:
The concentration of acetic acid in
solution is dependent on pH according to:
The headspace is assumed
to be an ideal gas:
1018 Steel
Headspace Concentration • A solution with pH = 2.6 has an acetic acid
concentration of 1.4 M and approximately
1000 ppmw in the space above the solution.
Pair 650 mmHg in Boulder, CO
(15 % lower than at sea level)
Page 11
Corrosion Rate Measurements
Here we report
corrosion rate data
in units of mm/y.
Page 12
HEADSPACE CORROSION
Copper and Carbon Steel
Page 13
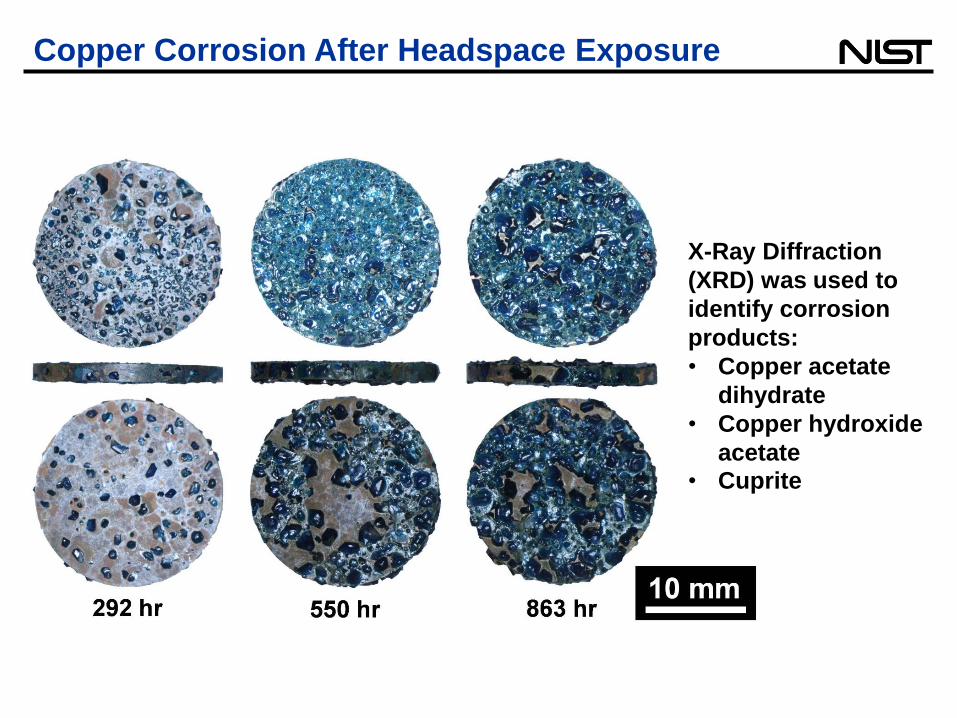
X-Ray Diffraction
(XRD) was used to
identify corrosion
products:
• Copper acetate
dihydrate
• Copper hydroxide
acetate • Cuprite
Copper Corrosion After Headspace Exposure
Page 14
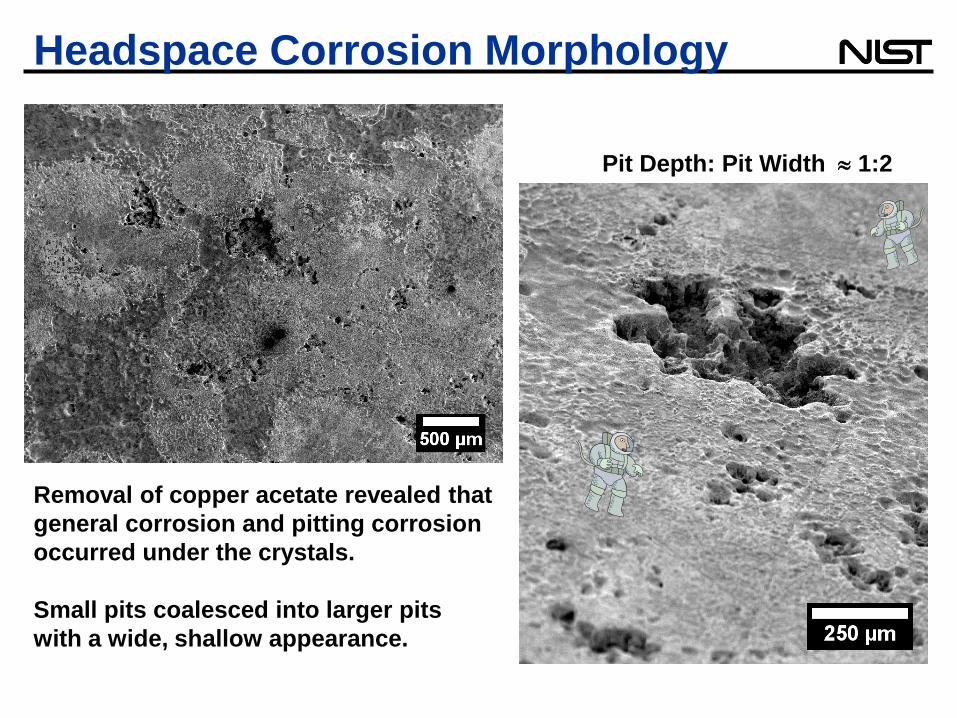
Headspace Corrosion Morphology
Pit Depth: Pit Width 1:2
Removal of copper acetate revealed that
general corrosion and pitting corrosion
occurred under the crystals.
Small pits coalesced into larger pits
with a wide, shallow appearance.
Page 15
Steel Corrosion After Headspace Exposure
Corrosion product on the steel
grew in thickness with longer
exposure periods, and flaked easily
from the coupons.
XRD was used to identify
corrosion products:
• Iron oxides
• Iron hydroxides
Page 16
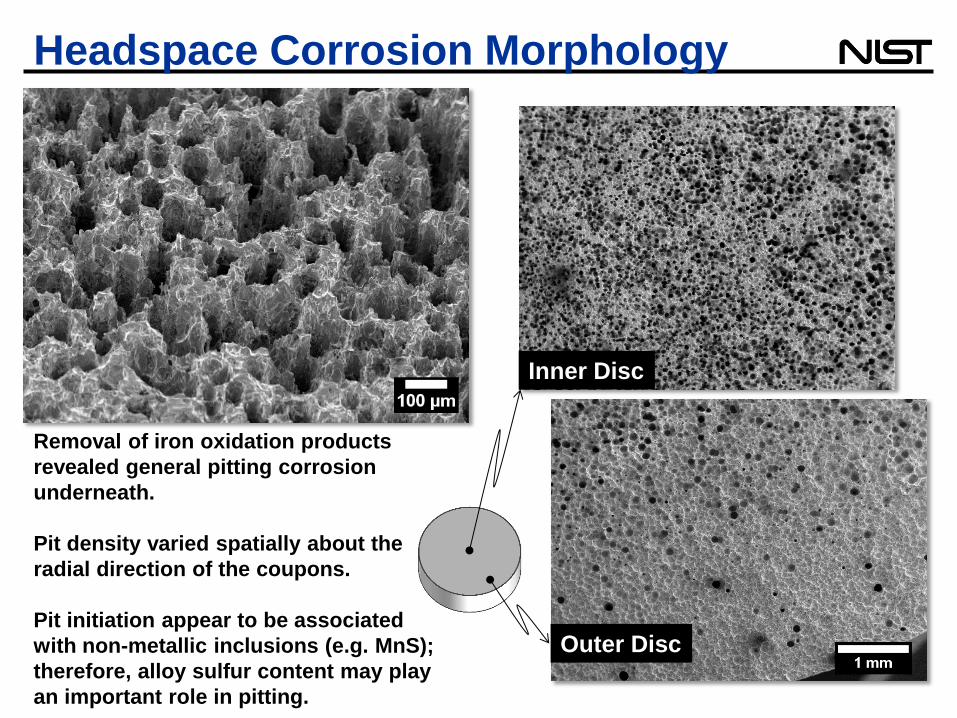
Headspace Corrosion Morphology
Removal of iron oxidation products
revealed general pitting corrosion
underneath.
Pit density varied spatially about the
radial direction of the coupons.
Pit initiation appear to be associated
with non-metallic inclusions (e.g. MnS);
therefore, alloy sulfur content may play
an important role in pitting.
Outer Disc
Inner Disc
Page 17
Headspace Corrosion Rate & Model
Material A0 (mm/y) n R2
Copper 8.6 x 10⁻³ 0.3097 0.998
Steel 128 x 10-3 0.3078 0.999
x/t = corrosion rate (mm/y)
A0 = initial corrosion rate (mm/y)
t = exposure time (hr)
Lower n greater
protectiveness of surface film
Atmospheric
Corrosion
Empirical Model1
ntAt
x
0
1. C. Leygraf. Atmospheric Corrosion (2007).
dx/dt = 0.128t0.3078 R² = 0.999
0
0.2
0.4
0.6
0.8
1
1.2
0 200 400 600 800 1000
Corr
osio
n R
ate
(m
m/y
)
Time (hr)
Fe Thin Film Deposited
on QCM dx/dt = 0.0086t0.3097
R² = 0.998 0
0.01
0.02
0.03
0.04
0.05
0.06
0.07
0.08
0.09
0.1
0 200 400 600 800 1000
Co
rrosio
n R
ate
(m
m/y
)
Time (hr)
Copper Carbon Steel
Page 18
MIC IN AQUEOUS ETHANOL
SOLUTION (SUMP BOTTOM)
Copper and Carbon Steel
Page 19
Copper Corrosion Damage
Intergranular
Attack
Fine Pitting
In Scratches
Corrosion rate after 36 days
exposure was:
0.051 mm/y 0.010 mm/y
Deep intergranular attack was
observed indicating that stress-
corrosion cracking may lead to
greatly accelerated perforation
of copper tubing.
Page 20
Steel Corrosion Damage Corrosion rate after 39 days exposure was:
0.061 mm/y 0.003 mm/y
This is comparable to the copper headspace and
immersion coupons. Such a low rate may be
related to bacterial attachment, which could
protect the steel by a passivation mechanism.
However, the surface was covered with pits within
ferrite grains, although some attack at interphase
boundaries was noted. Dislocation Etch Pits Pearlite Boundary Attack
Page 21
Summary
Copper Corrosion
• Corrosion rates of ~0.06 mm/y were
measured in the headspace and while
immersed in solution.
• At this rate it would take ~15 years to
corrode through a copper tube with 1.2
mm wall thickness.
• Localized corrosion was observed on
the cold-worked copper material!
Therefore, stress-corrosion cracking is a
likely concern in bent copper tubing and
would greatly reduce the tubing life and
lead to leakage.
Steel Corrosion
• Corrosion rates of Steel in the
headspace were severe(> 1 mm/y).
• The submersible pump casings are
steel (or cast iron) and total
replacement will be both necessary and
costly at thousands of filling stations.
• Acetobacter Biofilm may actually
decrease corrosion as demonstrated by
the low corrosion rate of steel (~0.06
mm/y) while immersed in the solution.
• In a controlled laboratory environment, Acetobacter sp. produced corrosion
damage similar to that seen on UST sump components during field inspections.
• Corrosion rates of Copper and Steel alloys were measured after headspace
exposure and exposure to inoculated ethanol growth solution.
• We developed a test method that can be used to screen materials and assess
various techniques to prevent corrosion.
Page 22
What Next?
• Standard Practices for Headspace Biocorrosion Testing
• Biocide Efficacy
– Glutaraldehyde has already shown effectiveness in controlling
Acetobacter corrosion of steel
• Coatings
– Organic coatings need good acid resistance and good solvent
resistance
• Inhibitors
• Headspace Gas Analysis
• In situ Monitoring/Detection with e.g., QCM
Page 24
Test Materials
Grade C Mn Si P S Fe
1018 Steel 0.15 –
0.20
0.60 –
0.90
0.15 –
0.30
0.04 max 0.05 max Balance
Grade Pb Bi O P Cu
110 Copper 0.05 max 0.005 max 0.04 max 0.04 max Balance
Ø = 19.05 mm (0.75 in)
t = 2.8 mm (0.11 in)
Corrosion of copper and steel alloys are investigated in this study. The
alloys tested were acquired from a commercial vendor in rod form and
are representative of those used in tank components. Composition limits are shown below (wt. %). Both test materials are ‘cold worked’.
Page 25
Bacteria Cultures • Acetobacter sp. were isolated at an industrial ethanol production plant by our
collaborators at Colorado School of Mines.
• Test Media simulates a mixture of e.g. groundwater and ethanol fuel:
(5 % Ethanol – 95 % Bacteria Growth Media)
• In the future, we can likely control the microbial activity, and hence the pH by varying
the ratio of this mixture. (What is relevant?)
Headspace Corrosion Aqueous-Ethanol Immersion Corrosion
• Inoculate 250 mL of Test Media with
Acetobacter sp.
• Expose metal coupons to the vapor
phase only
• Expose Fe and Cu quartz crystal
microbalances (QCM) and monitor
frequency shift ( mass change)
• Inoculate 500 mL of Test Media with
Acetobacter sp.
• Fully immerse alloy coupons in the liquid
phase Test Media
• Pull coupons at regular intervals to investigate transient corrosion behavior
• Maintain culture by periodic feeding with fresh Test Media
• Monitor the solution acidity (pH meter) and solution absorbance with UV-Visible
Spectroscopy:
• Absorbance| = 600 nm bacteria cell count
• Perform tests in triplicate
Page 26
Immersion Corrosion Test Setup
𝑃𝐻𝐴𝑐 + 𝑃𝐻2𝑂 + 𝑃𝐸𝑡𝑂𝐻 + 𝑃𝑖
Coupon
Fixture 500 mL
Pipette
Tank
(1 L)
Inoculated Test Solution
Page 27
Measuring Bacteria Kinetics
0.01
0.1
2
2.2
2.4
2.6
2.8
3
3.2
3.4
3.6
3.8
4
0 200 400 600 800 1000
So
lution
ab
so
rba
nce
(
= 6
00
nm
)
So
lution
acid
ity (
pH
)
Time (hr)
Tank 4 – Copper Immersed
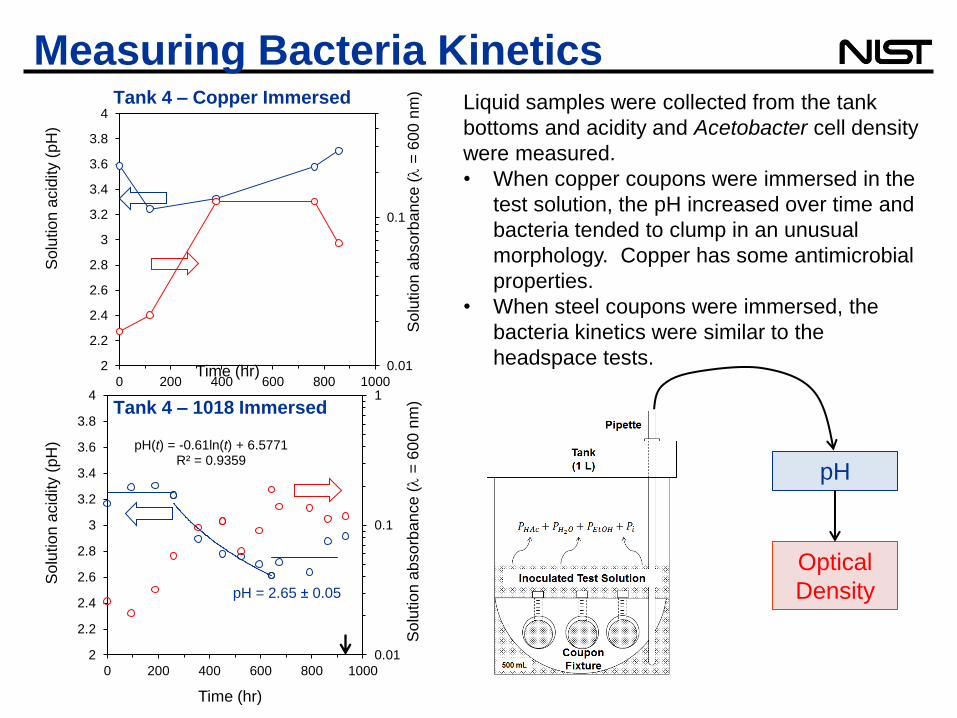
pH(t) = -0.61ln(t) + 6.5771 R² = 0.9359
0.01
0.1
1
2
2.2
2.4
2.6
2.8
3
3.2
3.4
3.6
3.8
4
0 200 400 600 800 1000
So
lution
ab
so
rba
nce
(
= 6
00
nm
)
So
lution
acid
ity (
pH
)
Time (hr)
Tank 4 – 1018 Immersed
pH = 2.65 ± 0.05
Liquid samples were collected from the tank
bottoms and acidity and Acetobacter cell density
were measured.
• When copper coupons were immersed in the
test solution, the pH increased over time and
bacteria tended to clump in an unusual
morphology. Copper has some antimicrobial
properties.
• When steel coupons were immersed, the
bacteria kinetics were similar to the
headspace tests.
pH
Optical
Density
Page 28
Acetic Acid Concentration
• Acetic acid (HAc) is a weak acid and dissociates only partially in an aqueous-
ethanol mixture; therefore, pH is not a direct reading of its concentration.
• Acetic acid headspace concentration is dependent on both temperature and
solution pH. We determine concentration with calculations (next slide) and the
presented here are merely estimates.
Aqueous Solution Headspace
log [HAc] = -1.8561*pH + 4.9674R² = 0.9649
-3
-2.5
-2
-1.5
-1
-0.5
0
2.5 3 3.5 4
log
[H
Ac]
pH
10
100
1000
18 20 22 24 26 28 30 32 34
HA
c c
on
ce
ntr
atio
n in
air
(p
pm
w)
Temperature (°C)
pH
2.6
2.8
3.0
3.2
3.4
3.6
Page 29
Headspace Acetic Acid Concentration
10
100
1,000
0 200 400 600 800 1000
HA
c c
on
ce
ntr
atio
n (
pp
mw
)
Time (hr)
Tank 1
Tank 2
Tank 3
0PP HAcHAc
T
P
764.39
54.164268206.4log 0
9674.48561.1log pHHAc
airair
HAcHAcHAc
MWP
MWPm
610
Acetic acid vapor pressure is
temperature-dependent (22 °C):
We assume that the
partial pressure of acetic
acid obeys Raoult’s Law:
The concentration of acetic acid in
solution is dependent on pH according to:
The headspace is assumed
to be an ideal gas:
1018 Steel
Headspace Concentration • A solution with pH = 2.6 has an acetic acid
concentration of 1.4 M and approximately
1000 ppmw in the space above the solution.
Pair 650 mmHg in Boulder, CO
(15 % lower than at sea level)
Page 30
Calculating Corrosion Rate
We report data in
these common
units of corrosion
rate.
Page 31
0
5
10
15
20
25
30
35
40
0 100 200 300 400
Ma
ss o
f co
rro
sio
n p
rod
uct re
mo
ve
d (
mg)
Immersion time (s)
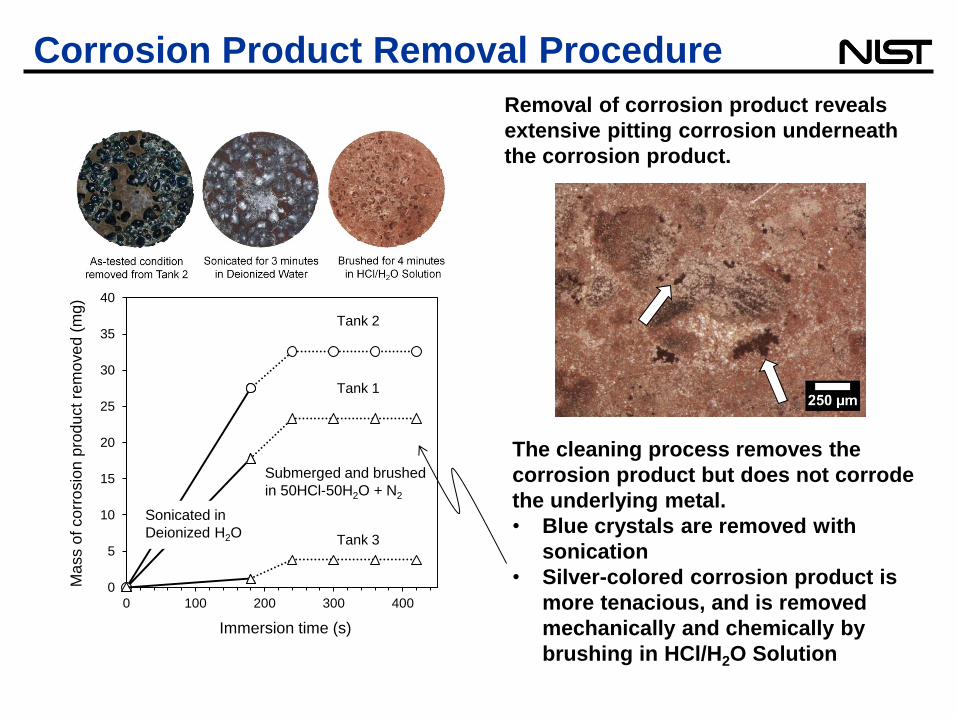
Sonicated in
Deionized H2O
Submerged and brushed
in 50HCl-50H2O + N2
Tank 3
Tank 1
Tank 2
The cleaning process removes the
corrosion product but does not corrode
the underlying metal.
• Blue crystals are removed with
sonication
• Silver-colored corrosion product is
more tenacious, and is removed
mechanically and chemically by
brushing in HCl/H2O Solution
Removal of corrosion product reveals
extensive pitting corrosion underneath
the corrosion product.
Corrosion Product Removal Procedure
Page 32
Surface
Pitting
Corrosion was not as extensive on the
immersion coupons as compared to the
headspace coupons. Pit morphology
exhibited a shallow and coalesced
appearance. The test solution notably
turned a blue color during testing,
indicating the presence of dissolved
copper acetate.
Copper Corrosion After Immersion
Page 33
Copper Corrosion Rate
0
0.02
0.04
0.06
0.08
0.1
0.12
0.14
0
0.01
0.02
0.03
0.04
0.05
0.06
0.07
0 200 400 600 800 1000
Film
gro
wth
rate
(g·m
-2·h
r-1)
Corr
osio
n r
ate
(g·m
-2·h
r-1)
Exposure time (hr)
Average Film Growth Rate
Tanks 1,2,3
Tank 4
Average Corrosion Rate
Tanks 1,2,3
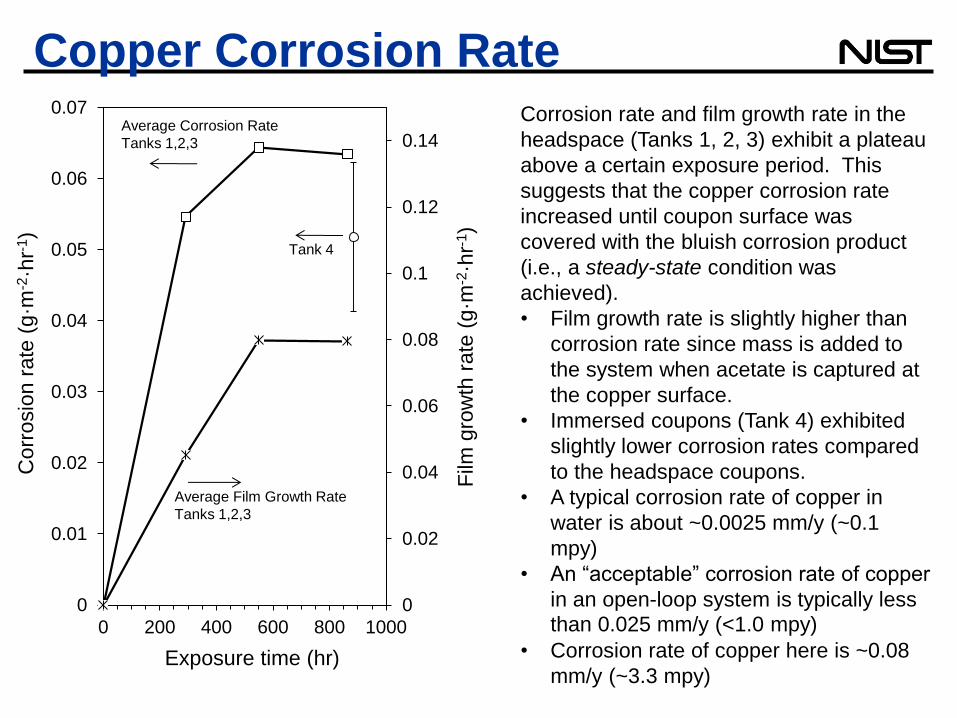
Corrosion rate and film growth rate in the
headspace (Tanks 1, 2, 3) exhibit a plateau
above a certain exposure period. This
suggests that the copper corrosion rate
increased until coupon surface was
covered with the bluish corrosion product
(i.e., a steady-state condition was
achieved).
• Film growth rate is slightly higher than
corrosion rate since mass is added to
the system when acetate is captured at
the copper surface.
• Immersed coupons (Tank 4) exhibited
slightly lower corrosion rates compared
to the headspace coupons.
• A typical corrosion rate of copper in
water is about ~0.0025 mm/y (~0.1
mpy)
• An “acceptable” corrosion rate of copper
in an open-loop system is typically less
than 0.025 mm/y (<1.0 mpy) • Corrosion rate of copper here is ~0.08
mm/y (~3.3 mpy)
Page 34
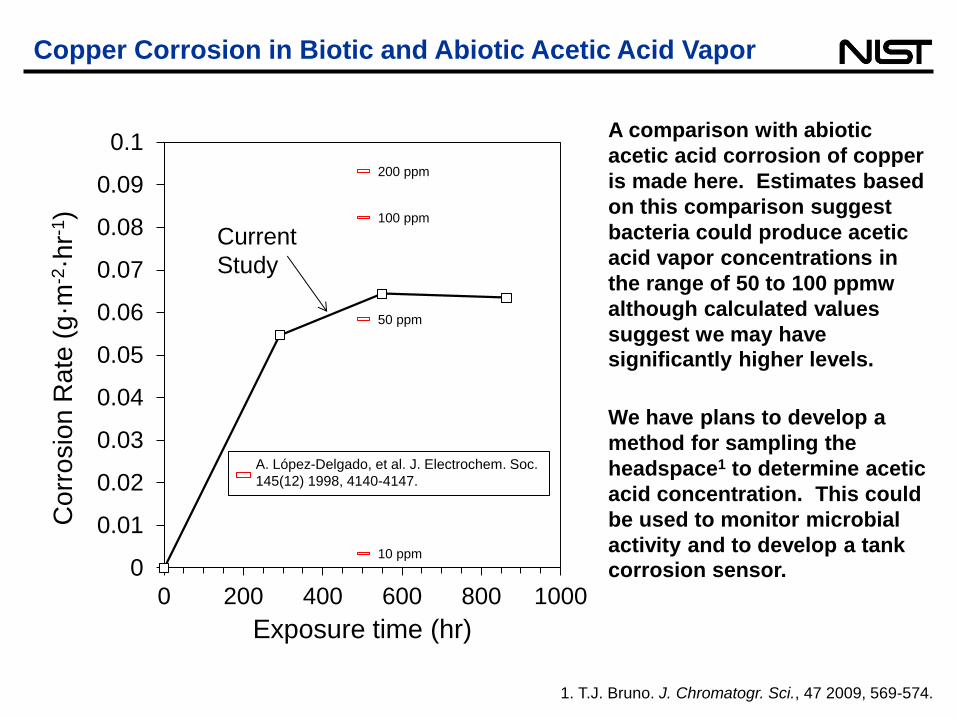
10 ppm
50 ppm
100 ppm
200 ppm
0
0.01
0.02
0.03
0.04
0.05
0.06
0.07
0.08
0.09
0.1
0 200 400 600 800 1000
Co
rro
sio
n R
ate
(g
·m-2
·hr-
1)
Exposure time (hr)
A. López-Delgado, et al. J. Electrochem. Soc.
145(12) 1998, 4140-4147.
Copper Corrosion in Biotic and Abiotic Acetic Acid Vapor
We have plans to develop a
method for sampling the
headspace1 to determine acetic
acid concentration. This could
be used to monitor microbial
activity and to develop a tank
corrosion sensor.
A comparison with abiotic
acetic acid corrosion of copper
is made here. Estimates based
on this comparison suggest
bacteria could produce acetic
acid vapor concentrations in
the range of 50 to 100 ppmw
although calculated values
suggest we may have
significantly higher levels.
Current
Study
1. T.J. Bruno. J. Chromatogr. Sci., 47 2009, 569-574.
Page 35
Steel Corrosion Rate
0
0.5
1
1.5
2
2.5
3
3.5
0
0.1
0.2
0.3
0.4
0.5
0.6
0.7
0.8
0.9
1
0 200 400 600 800 1000
Film
gro
wth
rate
(g·m
-2·h
r-1)
Corr
osio
n r
ate
(g·m
-2·h
r-1)
Exposure time (hr)
Headspace
Corrosion
Rate
Immersed
Corrosion
Rate (Tank 4)
Average Film
Growth Rate
Corrosion rate likely has some dependence
of the film growth as seen in the copper
corrosion.
• Corrosion rate of 1018 steel coupons
exposed to headspace was an order of
magnitude greater than copper in the
headspace and continuously increased
with exposure time. (> 1 mm/y !!!)
• Film-growth rate on headspace coupons
is higher since mass is added to the
system when iron oxidation products are
captured by the steel surface.
• Immersed coupons exhibited
significantly lower corrosion rates than
in the headspace. Microbial attachment
(formation of a biofilm) may play a role
in this behavior.
Page 36
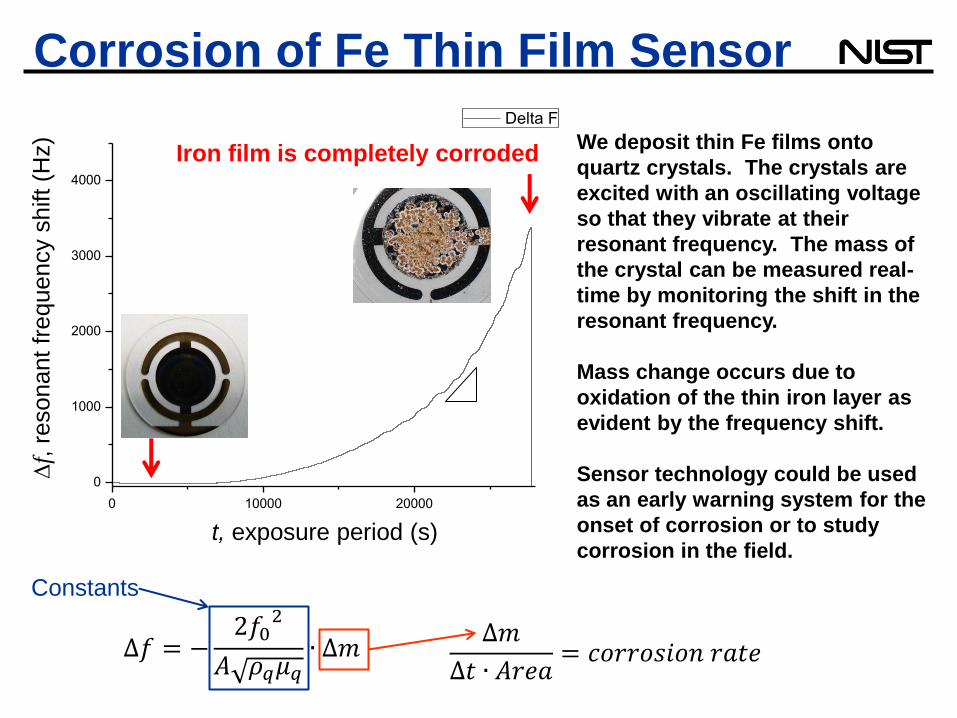
Corrosion of Fe Thin Film Sensor
0 10000 20000
0
1000
2000
3000
4000
De
lta
F
Time (s)
Delta F
Iron film is completely corroded
f,
resona
nt
frequency s
hift (H
z)
t, exposure period (s)
We deposit thin Fe films onto
quartz crystals. The crystals are
excited with an oscillating voltage
so that they vibrate at their
resonant frequency. The mass of
the crystal can be measured real-
time by monitoring the shift in the
resonant frequency. Mass change occurs due to
oxidation of the thin iron layer as
evident by the frequency shift.
Sensor technology could be used
as an early warning system for the
onset of corrosion or to study
corrosion in the field.
Δ𝑓 = −2𝑓0
2
𝐴 𝜌𝑞𝜇𝑞∙ Δ𝑚
Δ𝑚
Δ𝑡 ∙ 𝐴𝑟𝑒𝑎= 𝑐𝑜𝑟𝑟𝑜𝑠𝑖𝑜𝑛 𝑟𝑎𝑡𝑒
Constants
Page 37
0
0.01
0.02
0.03
0.04
0.05
0.06
0.07
0.08
0.09
0 200 400 600 800 1000
Corr
osio
n r
ate
(m
m·y
-1)
Time (hr)
HeadspaceCorrosion Rate
Immersed CorrosionRate (Tank 4)
0.0
0.1
0.2
0.3
0.4
0.5
0.6
0.7
0.8
0.9
1.0
1.1
0 200 400 600 800 1000
Co
rro
sio
n r
ate
(m
m·y
-1)
Time (hr)
HeadspaceCorrosion Rate
Immersed CorrosionRate (Tank 4)
Copper Steel
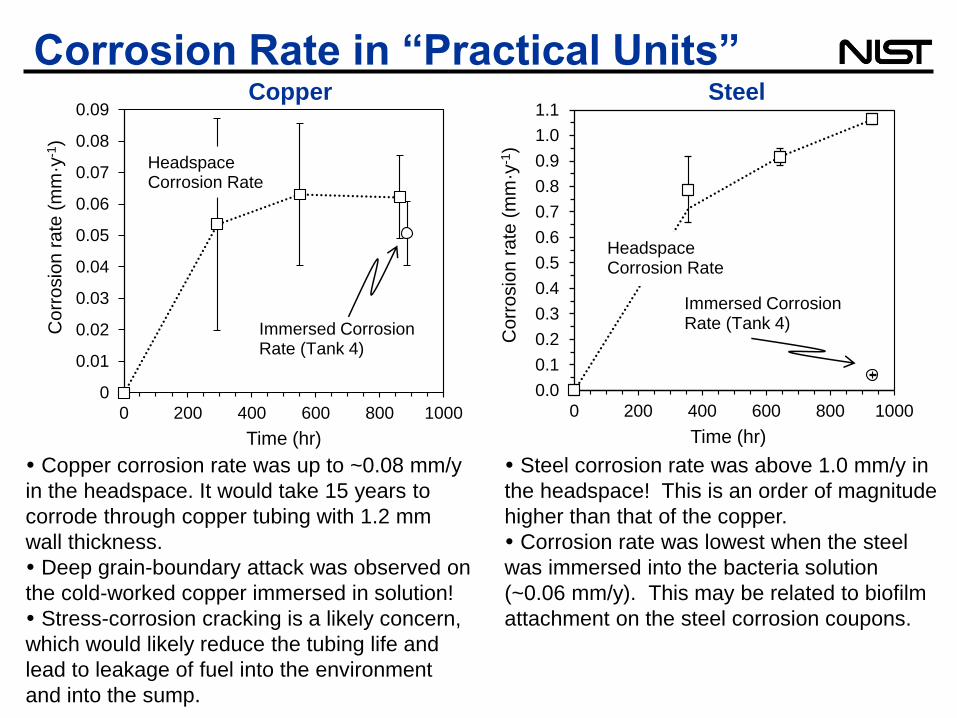
Corrosion Rate in “Practical Units”
Copper corrosion rate was up to ~0.08 mm/y
in the headspace. It would take 15 years to
corrode through copper tubing with 1.2 mm
wall thickness.
Deep grain-boundary attack was observed on
the cold-worked copper immersed in solution!
Stress-corrosion cracking is a likely concern,
which would likely reduce the tubing life and
lead to leakage of fuel into the environment
and into the sump.
Steel corrosion rate was above 1.0 mm/y in
the headspace! This is an order of magnitude
higher than that of the copper.
Corrosion rate was lowest when the steel
was immersed into the bacteria solution
(~0.06 mm/y). This may be related to biofilm
attachment on the steel corrosion coupons.
Page 38
Summary • In a controlled laboratory environment, Acetobacter sp. produce corrosion
damage similar to that seen on UST sump components during field inspections
• Corrosion rates of Copper were measured in the headspace and immersed in
inoculated ethanol growth solution – A general corrosion rate of ~0.08 mm/y was measured in the headspace and 0.06 mm/y immersed
in solution.
– 15 years would be needed to corrode through a copper pipe of 1.2 mm wall thickness from the
outside.
– Localized corrosion was observed on the cold-worked copper material! Therefore, stress-corrosion
cracking is a likely concern in bent copper tubing and would greatly reduce the tubing life and lead
to leaks, which exacerbate the MIC.
• Corrosion rates of Steel were measured and the data show severe corrosion in
the headspace (> 1 mm/y) – The pump casings are steel (or cast iron) and total replacement will be both necessary and costly.
– The UST are steel; therefore, bacterial contamination could degrade wall thickness and result in
spillage.
– A biofilm may actually decrease corrosion as illustrated by the low corrosion rate of steel while
immersed (~0.06 mm/y).
• We developed a test that can be used to screen materials and investigate
methods of preventing corrosion