SANDIA REPORT SAND 2013-8256 Unlimited Release September 2013 Corrosion of High Temperature Alloys in Solar Salt at 400, 500, and 680°C Alan M. Kruizenga, David D. Gill, Marianne LaFord, Geoffrey McConohy Prepared by Sandia National Laboratories Albuquerque, New Mexico 87185 and Livermore, California 94550 Sandia National Laboratories is a multi-program laboratory managed and operated by Sandia Corporation, a wholly owned subsidiary of Lockheed Martin Corporation, for the U.S. Department of Energy's National Nuclear Security Administration under contract DE-AC04-94AL85000. Approved for public release; further dissemination unlimited.
Transcript
SANDIA REPORT SAND 2013-8256 Unlimited Release September 2013
Corrosion of High Temperature Alloys in Solar Salt at 400, 500, and 680°C Alan M. Kruizenga, David D. Gill, Marianne LaFord, Geoffrey McConohy Prepared by Sandia National Laboratories Albuquerque, New Mexico 87185 and Livermore, California 94550
Sandia National Laboratories is a multi-program laboratory managed and operated by Sandia Corporation, a wholly owned subsidiary of Lockheed Martin Corporation, for the U.S. Department of Energy's National Nuclear Security Administration under contract DE-AC04-94AL85000. Approved for public release; further dissemination unlimited.
2
Issued by Sandia National Laboratories, operated for the United States Department of Energy by Sandia Corporation. NOTICE: This report was prepared as an account of work sponsored by an agency of the United States Government. Neither the United States Government, nor any agency thereof, nor any of their employees, nor any of their contractors, subcontractors, or their employees, make any warranty, express or implied, or assume any legal liability or responsibility for the accuracy, completeness, or usefulness of any information, apparatus, product, or process disclosed, or represent that its use would not infringe privately owned rights. Reference herein to any specific commercial product, process, or service by trade name, trademark, manufacturer, or otherwise, does not necessarily constitute or imply its endorsement, recommendation, or favoring by the United States Government, any agency thereof, or any of their contractors or subcontractors. The views and opinions expressed herein do not necessarily state or reflect those of the United States Government, any agency thereof, or any of their contractors. Printed in the United States of America. This report has been reproduced directly from the best available copy. Available to DOE and DOE contractors from U.S. Department of Energy Office of Scientific and Technical Information P.O. Box 62 Oak Ridge, TN 37831 Telephone: (865) 576-8401 Facsimile: (865) 576-5728 E-Mail: [email protected] Online ordering: http://www.osti.gov/bridge Available to the public from U.S. Department of Commerce National Technical Information Service 5285 Port Royal Rd. Springfield, VA 22161 Telephone: (800) 553-6847 Facsimile: (703) 605-6900 E-Mail: [email protected] Online order: http://www.ntis.gov/help/ordermethods.asp?loc=7-4-0#online
Corrosion of High Temperature Alloys in Solar Salt at 400, 500, and 680°C
Alan M. Kruizenga1, David D. Gill2, Marianne LaFord1 1. 8223: Materials Chemistry
2. 6123: Concentrating Solar Technologies Sandia National Laboratories
P.O. Box 0969 Livermore, California 94551-MS9403
Abstract
Corrosion tests at 400, 500, and 680°C were performed using four high temperature alloys; 347SS, 321SS In625, and HA230. Molten salt chemistry was monitored over time through analysis of nitrite, carbonate, and dissolved metals. Metallography was performed on alloys at 500 and 680°C, due to the relatively thin oxide scale observed at 400°C. At 500°C, corrosion of iron based alloys took the form of chromium depletion and iron oxides, while nickel based alloys also had chromium depletion and formation of NiO. Chromium was detected in relatively low concentrations at this temperature. At 680°C, significant surface corrosion occurred with metal losses greater than 450microns/year after 1025hours of exposure. Iron based alloys formed complex iron, sodium, and chromium oxides. Some data suggests grain boundary chromium depletion of 321SS. Nickel alloys formed NiO and metallic nickel corrosion morphologies, with HA230 displaying significant internal oxidation in the form of chromia. Nickel alloys both exhibited worse corrosion than iron based alloys likely due to preferential dissolution of chromium, molybdenum, and tungsten. .
4
5
ACKNOWLEDGMENTS Authors would like to gratefully acknowledge the skillful metallography preparation and methodical SEM work of Ryan Nishimoto and Andrew Gardea, with electron microprobe analysis of Miles Clift.
A. Sample pull Schedule and Order ................................................................................... 41
B. Salt Specifications ........................................................................................................ 42
Distribution ................................................................................................................................... 43
FIGURES Figure 1: Visual appearance of salt operated at different temperatures ........................................ 11 Figure 2: Sample tree and samples after exposure in 680°C salt .................................................. 12 Figure 3 : Example of heat flow data collected by DSC measurements ....................................... 13 Figure 4: Nitrite concentration with calculated equilibrium values [11] ...................................... 16 Figure 5: Dissolved metals detected in 500 and 680°C melt. Tungsten was only detected at 3000 hours in the 500°C melt. Nickel was detected in 680°C melt. Additional Cr at 680°C will arise from the containment vessel, which is 316SS. ............................................................................. 16 Figure 6: Changes in Specific heat Curves for 680°C Operating Temperature ............................ 18 Figure 7: Changes in Specific Heat Curves for 600°C Salt for Various Operating Times ........... 18 Figure 8: Change in Melting Point for Salt at 680°C after Various Operating Times ................. 18 Figure 9: Change in Melting Point for Salt at 600°C ................................................................... 19 Figure 10: Comparison between a heat flow curve from Rogers and Janz (left) and this work (right). ........................................................................................................................................... 20 Figure 11: Influence of Nitrite Content on Melting Point ............................................................ 21 Figure 12: Effect of nitrite and nitrate on melting temperature .................................................... 22 Figure 13: Changes in Melting Temperature after Heating at 300°C and 500°C ......................... 22 Figure 14: Graphs of heat of fusion (left column) and Specific Heats (right column) for 680°C salt (top row) and 600°C salt (bottom row) .................................................................................. 23
7
Figure 15: Weight gain and descaled loss of iron based alloys for temperatures of 400°C and 500°C. ........................................................................................................................................... 25 Figure 16: Weight gain (left) and descaled weight loss (right, 1025 hour only) data for alloy 347SS and 321SS at 680°C. Note plot on right does not start from zero. .................................... 26 Figure 17: 347SS after 3064 hours at 500°C, iron oxide with no formation of NaFeO2. ............ 26 Figure 18: 321SS after 3064 hours exposure at 500°C. No detection of sodium, with XRD scans indicating magnetite formation. .................................................................................................... 26 Figure 19: 347SS after 1025 hours exposure at 680°C. Phases of NaFeO2 were detected with XRD after 520 hours (bottom left), with mixed oxide detected at 1025 hours (bottom right). Corrosion proceeded uniformly with no obvious grain boundary depletion of chromium. ......... 27 Figure 20: 321SS corrosion at 1025 hours at 680°C. Slight Cr depletion was observed along grain boundaries, as indicated by X-ray map (bottom left). ......................................................... 28 Figure 21: 500°C exposure for 3064 hours on HA230. Surface corrosion at lower temperatures could not be adequately resolved by microscopy methods used, though XRD indicated formation of NiO. .......................................................................................................................................... 30 Figure 22: In625 corrosion product evolution based on exposure temperature ............................ 31 Figure 23: Weight gain and descaled information for HA230 and In625 at 400°C and 500°C. .. 32 Figure 24: Weight gain data for 680°C exposure of HA230 and In625 (left). Descaled data (right) for 1025 hour exposure only. ........................................................................................................ 32 Figure 25: HA230 after 1025 hours at 680°C. Line scan and XRD data clearly indicates phases of NiO and metallic nickel, with small peaks that appeared to correspond to iron oxide. ........... 33
Figure 26: XRD scan of HA230 after descaling process was performed on 1025 hour, 680°C sample. No base alloy was detected, only phases of chromia and nickel, clearly indicating internal oxidation present. ............................................................................................................. 33
Figure 27: In625 after 1025 hour exposure at 680°C. Nickel and NiO were present as primary corrosion products. ........................................................................................................................ 34
Figure 28: 400°C removal schedule and sample ID ..................................................................... 41
Figure 29: 500°C removal schedule and sample ID ..................................................................... 41
Figure 30: 680°C removal schedule and sample ID ..................................................................... 42
TABLES Table 1: Compositions of alloys investigated in 400, 500, and 680°C experiments .................... 12 Table 2: Values of Thermo-physical properties for Various Conditions of Solar Salt at 680°C Operating Temperature ................................................................................................................. 17 Table 3: Values of Thermo-physical properties for Various Conditions of Solar Salt at 600°C Operating Temperature ................................................................................................................. 17 Table 4: Optimelt Images of salt experiments for 680°C Salts .................................................... 19 Table 5: Optimelt Images of Salts Operated at 600°C For Various Lengths of Time .................. 19 Table 6: Corrosion Rates and projections for iron based alloys ................................................... 25 Table 7: Corrosion Rates and projections for nickel based alloys ................................................ 31
8
NOMENCLATURE BSE Back Scatter Electron Image CTE Coefficient of Thermal Expansion EDS Energy dispersive spectroscopy HA Haynes Alloy In Inconel Alloy M” Mass normalized by surface area (mg/cm2) SEM Scanning Electron Microscopy SEI Secondary Electron Image SNL Sandia National Laboratories SS Stainless Steel X Oxide thickness XRD X-ray diffraction WDS Wavelength Dispersive Spectroscopy
9
1. INTRODUCTION Concentrating solar power (CSP) efficiency is increased using high operating temperature where bulk salt temperatures approach 600°C. Wall temperatures will be higher than this in order to achieve adequate temperature differentials needed for turbulent convection heat transfer. Molten salt corrosion tests in the past that have been performed above 600°C have attempted to control salt chemistry by increasing the oxygen overpressure, thus altering equilibrium concentrations of anions present [1]. However, practical considerations for large thermal energy storage tanks, such as those used in Solar Two [2], with oxygen overpressures present non-trivial engineering considerations and costs. Past work looking at many alloys at 677°C were helpful in understanding qualitative rankings between alloys [3]. 14 day tests (336 hour) were employed for ranking corrosion performance, with little microscopy to ascertain if intergranular attack or internal oxidation was present. Four alloys of interest, two iron based (347SS and 321SS) and two nickel based (HA230 and In625), are investigated at 400, 500 and 680°C. These will provide a more complete data set to complement work performed at 600°C [4].
10
11
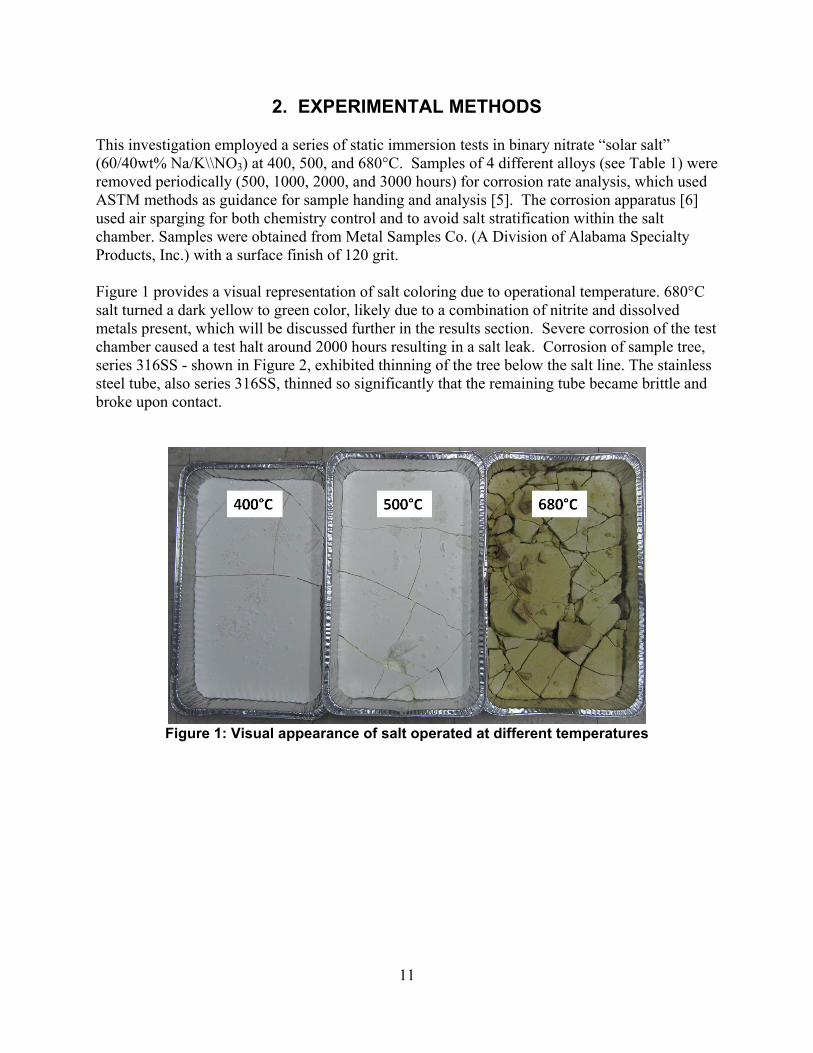
2. EXPERIMENTAL METHODS This investigation employed a series of static immersion tests in binary nitrate “solar salt” (60/40wt% Na/K\\NO3) at 400, 500, and 680°C. Samples of 4 different alloys (see Table 1) were removed periodically (500, 1000, 2000, and 3000 hours) for corrosion rate analysis, which used ASTM methods as guidance for sample handing and analysis [5]. The corrosion apparatus [6] used air sparging for both chemistry control and to avoid salt stratification within the salt chamber. Samples were obtained from Metal Samples Co. (A Division of Alabama Specialty Products, Inc.) with a surface finish of 120 grit. Figure 1 provides a visual representation of salt coloring due to operational temperature. 680°C salt turned a dark yellow to green color, likely due to a combination of nitrite and dissolved metals present, which will be discussed further in the results section. Severe corrosion of the test chamber caused a test halt around 2000 hours resulting in a salt leak. Corrosion of sample tree, series 316SS - shown in Figure 2, exhibited thinning of the tree below the salt line. The stainless steel tube, also series 316SS, thinned so significantly that the remaining tube became brittle and broke upon contact.
Figure 1: Visual appearance of salt operated at different temperatures
12
Figure 2: Sample tree and samples after exposure in 680°C salt
Characterization of corrosion rates relied upon removal of corrosion products, which employed a combination of chemical and mechanical techniques. After removal from molten salt immersion vessels, samples were placed in a boiling sodium hydroxide and potassium permanganate solution, rinsed, and placed in a diammonium citrate solution. 400 and 500°C samples, which had minimal surface corrosion, were fully cleaned by repeating this chemical bathing process for several cycles. 680°C samples required both chemical baths and mechanical abrasion using grit blasting to complete the removal of corrosion products [4]. Further chemical baths were needed after the grit blasting to remove scales still present on the HA230 and In625.
Table 1: Compositions of alloys investigated in 400, 500, and 680°C experiments
† Actual composition from heat Metal loss rates calculated in this report are reported in microns/year using the following equation:
( )
Equation 1
Where M” is descaled mass loss per unit area (mg/cm2), is alloy density (g/cm3) and T time hours [7]. The assumption behind this equation is that corrosion proceeds in a linear fashion over the course of a year, which is the conservative approach. Standard metallography techniques were also used to assess materials corrosion by using scanning electron microscopy, electron microprobe, and x-ray diffraction [4].
13
Three thermo-physical quantities of the aged salt were measured: melting point, heat of fusion, and specific heat. Using a Mettler Toledo DSC (Model: DSC823, Serial Number: 5126041530), the heat flow was measured from 100°C to 350°C using a heating rate of 10 K/ minute at atmospheric pressures under argon cover gas. All samples were massed to an accuracy of ±0.1 mg. Samples were prepared for each condition of thermally aged salt and were tested on the DSC in triplicate with a blank reference and a sapphire standard. All samples used a standard 40 microliter aluminum pan with a hermetically sealed lid for testing. The melting point and heat of fusion were calculated using onset and integration functions on Mettler Toledo’s software package. The specific heat for a given temperature was calculated using the following formula:
Equation 2
Where HF is the blank subtracted heat flow [mW], m is the mass in mg, and Cp is the specific heat [J/g-K] for the object noted by the subscript. This equation is valid provided the heating rate for both the sapphire standard and sample are the same. Before examining the unknown properties of contaminated salts with the DSC, samples of potassium nitrate and sodium nitrate were tested and compared with literature values in order to gain confidence in the methods employed. Both the samples were measured within 5% of the literature values reported elsewhere [8]. Below is a sample of DSC data obtained from Mettler Toledo’s software package:
Figure 3 : Example of heat flow data collected by DSC measurements
DSC results of the aged salts were found to show non-eutectic properties. Thus, it was necessary to confirm the melting point data using a system called Optimelt (Stanford Research Systems, Serial Number 97656) by the following procedure: First, samples were ground into a powder and placed in 1.5 mm diameter capillary tubes. Second, samples were heated at 10 K/minute from 120°C to 350°C in air. In this experiment, the liquidus point of the system can be most accurately measured and is reported in Table 2. Error for this measurement is estimated to be ±3 °C for each sample.
14
15
3. RESULTS
A. Molten Salt Analysis
i. Salt Chemistry Measurements Significant differences in temperatures studied over this corrosion test resulted in different salt chemistry behavior. Analysis can be divided into two categories: results at or below 500°C and results at 680°C. Salt samples were acquired during metal sample pulls, nominally at 500, 1000, 2000, and 3000 hours. Samples were stored in a closed vial after removal, within a desiccant chamber, unless transported. The nitrate salts used for the test were refined grade materials acquired from SQM America. Though not specifically measured before testing, the salt is guaranteed to have component values within the specifications shown in the Appendix B. Salt analysis of samples taken during corrosion testing was performed using standard chemistry techniques, which tested for nitrite and nitrate content, dissolved metals (Cr, Ni, Fe, Ti, W, Mo), chloride, and carbonate. Chloride was constant throughout tests, as expected, present on an average of 0.058wt%. The salts were conditioned after melting by maintaining the salt at 500°C for more than a week. This insured that adequate time and temperature were used to release water from the salt and also to react any magnesium into magnesium oxide which would precipitate to the bottom out of the melt. This reaction is responsible for the majority of the NOx release with new salt and the week timeframe with bubbling to stir has proven effective in significantly completing this reaction. Carbonate ( ) concentration was less than 0.2wt% for the entire duration of tests performed at temperatures of 400 and 500°C. concentration varied substantially at 680°C, ranging from 0.2wt% at 520 hours to 1.7wt% at 2000 hours. This illustrated CO2, from the air sparge gas, was behaving as an oxide scavenger. It is expected that a salt not subjected to a constant source of CO2 would result in a higher concentration of oxide anions, which would further participate in oxidation processes. High amounts of could lead to formation of insoluble products over time that may lead to plugging of valves or piping [9]. Nitrite equilibrium behavior was also monitored over time. The relative concentration of nitrite can be determined through the dominant reaction with oxygen:
⁄ Equation 3
( ) Equation 4 G is the Gibbs energy of formation as determined by [10, 11], R the ideal gas constant, K the equilibrium coefficient. It was found that experimentally determined values of nitrite followed qualitative trends in temperature, but were found to be consistently low as indicated in Figure 4. It was unclear what caused this quantitative inconsistency in measured and calculated nitrite values, but similar behavior was also documented in while performing 600°C tests within the same system [4].
16
Dissolved metals varied based on temperature (Figure 5). At 400°C all dissolved metals were less than 30ppm, where Cr was the highest concentration detected; 22ppm at 3000 hours. Cr content increased slightly with the temperature of 500°C to 44ppm. Also, trace amounts of Mo and W also detected (also Figure 5). 680°C yielded obvious increases in metal dissolution rate and content. Cr content over 7400 ppm was detected at 2000 hours, with significant concentrations of Mo and W. Tungsten and molybdenum are soluble in nitrate salts by formation of tungstates and molybdates [12-15]. The detection of nickel in the melt, albeit in low concentrations, was not expected in light of previous experiments. While this result continues to be somewhat surprising, the constant value throughout 2000 hours of testing does indicate a low solubility. Nickel present in the melt, whether soluble or insoluble, is from the corrosion of the nickel based alloys. Presence of soluble nickel in the melt may be a result of a NiWO4, which was identified other work [15, 16] or perhaps could be the result of a nickelate ion.
Figure 4: Nitrite concentration with calculated equilibrium values [11]
Figure 5: Dissolved metals detected in 500 and 680°C melt. Tungsten was only detected
at 3000 hours in the 500°C melt. Nickel was detected in 680°C melt. Additional Cr at 680°C will arise from the containment vessel, which is 316SS.
17
ii. Changes in Molten Salt Physical Properties due to Corrosion and Impurities Results and Discussion for 680°C and 600°C Salts
The data collected was used to compare the thermo-physical properties of pure solar salt to the salt used in the corrosion studies. Below are tables and graphs summarizing different thermo-physical quantities for various hours of use, including values from literature for comparison. 600°C salt was obtained from archival samples from a previous test [4].
Table 2: Values of Thermo-physical properties for Various Conditions of Solar Salt at
Figure 6: Changes in Specific heat Curves for 680°C Operating Temperature
Figure 7: Changes in Specific Heat Curves for 600°C Salt for Various Operating Times
Figure 8: Change in Melting Point for Salt at 680°C after Various Operating Times
0
1
2
3
4
5
6
7
8
9
10
110 160 210 260
Spe
cifi
c H
eat
(J/
g K
)
Temperature (°C)
520Hours
1025Hours
2000Hours
Pure Salt
0
1
2
3
4
5
6
7
8
9
10
150 170 190 210 230 250 270 290 310
Spe
cifi
c H
eat
(J/
g K
)
Temperature (°C)
3000Hours4000HoursPure Salt
1000Hours
140
150
160
170
180
190
200
210
220
230
0 500 1000 1500 2000 2500 3000 3500 4000 4500
Me
ltin
g p
oin
t (°
C)
Hours of Operation
This Work Literature Value
Example Liquidus Points for Pure and 2000 Hour Salt
19
Melting Point Results
Figure 9: Change in Melting Point for Salt at 600°C
185
190
195
200
205
210
215
220
225
0 1000 2000 3000 4000 5000
Me
ltin
g p
oin
t (°
C)
Hours of Operation
This Work
LiteratureValue
Table 4: Optimelt Images of salt experiments for 680°C Salts
100°C 199°C 207°C 247°C Optical images showing the melting process of nitrate salts. From left to right- Pure Solar Salt, 520 hours, and 2000 hours of use at 680°C. Each photo starting at 199°C demonstrates the liquidus point of one of the salts. Note the 40°C temperature difference between the liquidus point of 520 hour salt and pure solar salt.
Table 5: Optimelt Images of Salts Operated at 600°C For Various Lengths of Time
120°C 227°C 232°C Optical images showing the melting process of nitrate salts. From left to right- 1000 hours, 3000 hours, and 4000 hours of use at 600°C. These three salts show a nearly identical liquidus point which produces a discrepancy between the DSC data and optimelt data for the 1000 hour salt. This is most likely an artifact of DSC measurements, as the melting point of all three salts is very similar.
Pure Salt 520 h 2000
h
1000 h 3000 h 4000h
20
Melting point Discussion
From the results above, it is clear that the melting range of the solar salt decreases as the salt is exposed to high temperatures and impurities. The heat capacity curves for thermally aged salt indicate that the melting range is broadened and shifted to lower temperatures. The broadening of the melting point is due to these non-eutectic properties of the mixture. Each component of the mixture melts at a different temperature and results in a larger melting range. Optimelt measurements show very good agreement with data taken from the DSC, confirming the decrease in melting point. The specific heat curves also indicate the liquidus point of the salt (see Figure 6). This value was used in comparison with the values measured from Optimelt. These effects have been documented previously by Rogers and Janz who showed that a small concentration of nitrite ions and oxides in the melt can cause significant changes in thermo-physical properties of solar salt [17]. Figure 10 shows the similarities between the heat curves measured by Rogers and Janz and the heat curves measured in this work. Even though the salt studied in this work is of composition 65/35 mol% sodium to potassium, as compared to 50/50% for Rogers and Janz, the two heat curves bear striking resemblance to each other. These similarities suggest that metal impurities produced by corrosion are not likely to be the cause of the changes in melting point of the salt mixture. In addition, measurements taken from the Solar Two project indicate similar results for a fully operational concentrating solar power plant [18]. Figure 11 shows the correlation between the nitrite concentration and the melting point. Correlations between other impurities showed no significant relationship to melting point. However, the oxide content of the salt remains unknown and could potentially have some effect.
Figure 10: Comparison between a heat flow curve from Rogers and Janz (left) and this
work (right).
A
B
Curve A- Before Corrosion Test Curve B- After Corrosion Test at 600° for 1000 hours
21
Figure 11: Influence of Nitrite Content on Melting Point
In addition to the previous literature, nitrite composition has been known to produce mixtures with much lower melting points than solar salt. For example, the HITEC mixture of NaNO3 , KNO3, and NaNO2 has a melting point of 142°C [19]. This behavior also qualitatively matches phase diagrams produced over 50 years ago by Berul and Bergman (See Figure 12). In order to attempt and explain the changes in melting point of the nitrate salt mixture, samples of salts operated at 680°C for 500 and 2000 hours were heated in a furnace at 300°C along with a sample of pure solar salt. Alumina crucibles were used for heating and roughly 2-4 grams of each salt were tested. Once every 24 or 48 hours, small amounts of the molten salt were collected and tested using the Optimelt system to determine if any changes in nitrite concentration produced by the 300°C furnace affected the melting point of the salt. After 168 hours at 300°C, the furnace temperature was increased in order to increase the kinetics of the reaction between nitrite and nitrate (Equation 2). Different nitrate/nitrite ratios will change the melting point of the salt. If no change is found, other impurities in the mixture are likely causing the change in melting point. Figure 13 shows the changes in melting point of three salts as they are held at 300°C over many days. After 7 days with minimal changes in melting point, the temperature of the furnace was raised to 500°C to attempt to change the nitrite concentration faster. At this temperature, the melting point was observed to rise significantly, suggesting that the nitrite content is responsible for the decrease in melting temperature. Furthermore, there are no external chemical sources or sinks that could have changed the composition of the melt except for the change in nitrite concentration.
y = -6.49x + 228.95 R² = 0.9434
0
50
100
150
200
250
0 2 4 6 8 10 12
Me
ltin
g P
oin
t (°
C)
Nitrite Content (wt%)
680°C Operating Temperature 600°C Operating Temperature
22
Figure 12: Effect of nitrite and nitrate on melting temperature
Figure 13: Changes in Melting Temperature after Heating at 300°C and 500°C
Specific Heat and Heat of Fusion Results and Discussion Regarding the specific heat of used salt, measurements show no observable changes due to impurities. Any change in value is within one standard deviation from the literature value of pure
23
salt. Rogers and Janz also noted that the specific heat of the mixture changes very little when heated in air. This is most likely due to the relatively small amount of impurities added or produced in the salt mixture. Since the specific heat can be calculated as a weighted average based on the mole percent and specific heat of each component, very small additions of nitrite or metals are not likely to have a significant effect on the specific heat. However, the heat of fusion seems to show noticeable changes after all three of the salts operated at 680°C. This phenomenon is more difficult to explain because heat of fusion cannot be calculated using simple analytical methods.
Figure 14: Graphs of heat of fusion (left column) and Specific Heats (right column) for 680°C salt (top row) and 600°C salt (bottom row)
This mixture, named solar salt, is a 40/60% by weight mixture of KNO3 and NaNO3. When operating at high temperatures, the corrosion products are dissolved in the molten salt and the high temperatures convert some of the nitrates in to nitrites. The previous experiments have shown that the melting point undergoes the most significant change of the three properties studied- specific heat, heat of fusion, and melting point. This change in melting point has been shown to be caused by the change in equilibrium products at high temperatures and most likely
0
20
40
60
80
100
120
0 500 1000 1500 2000 2500
He
at o
f Fu
sio
n (
J /
g )
Hours of Operation
This Work Literature Value
0
0.5
1
1.5
2
2.5
3
0 500 1000 1500 2000 2500
Spe
cifi
c H
eat
at
32
7°C
(J
/ g
K )
Hours of Operation
This Work
Literature Value
0
20
40
60
80
100
120
0 1000 2000 3000 4000
He
at o
f Fu
sio
n (
J /
g )
Hours of Operation
This Work
Literature Value
0
0.5
1
1.5
2
2.5
0 2000 4000
Spe
cifi
c H
eat
at
32
7°C
(J
/ g
K )
Hours of Operation
This Work Literature Value
24
has little to do with the amount of corrosive products dissolved in the salt. The changes in melting point have also been shown to be reversible when samples are heated to a slightly lower operating temperature than the original corrosion experiments. Moreover, the heat of fusion shows a slight decrease for an increase in operating time. However, the specific heat does not show any significant change within the error of the measurements.
B. Fe-Cr-Ni alloys (347SS and 321SS)
i. 400-500°C corrosion
Iron based austenitic alloy 347SS and 321SS were investigated at 400, 500, and 680°C, with behavior that can be separated into 400/500°C and 680°C corrosion. Corrosion rates, for temperatures below 500°C, indicated minimal depth of affected alloy (Table 6). In fact, 400°C corrosion was so slight that optical and SEM images yielded little information and are not included here. 500°C exhibited surface corrosion with higher corrosion rates than 400°C. Performance of alloys was excellent with rates that indicate corrosion to be insignificant under these conditions. Formation of surface oxides showed no sodium oxides at 400/500°C with XRD results indicating magnetite (Fe3O4); this is consistent with other results [20, 21]. Chromium depletion was present in oxidation scales, as indicated by line scan data of 347SS (Figure 17) and 321SS (Figure 18), where predominately iron oxide remained.
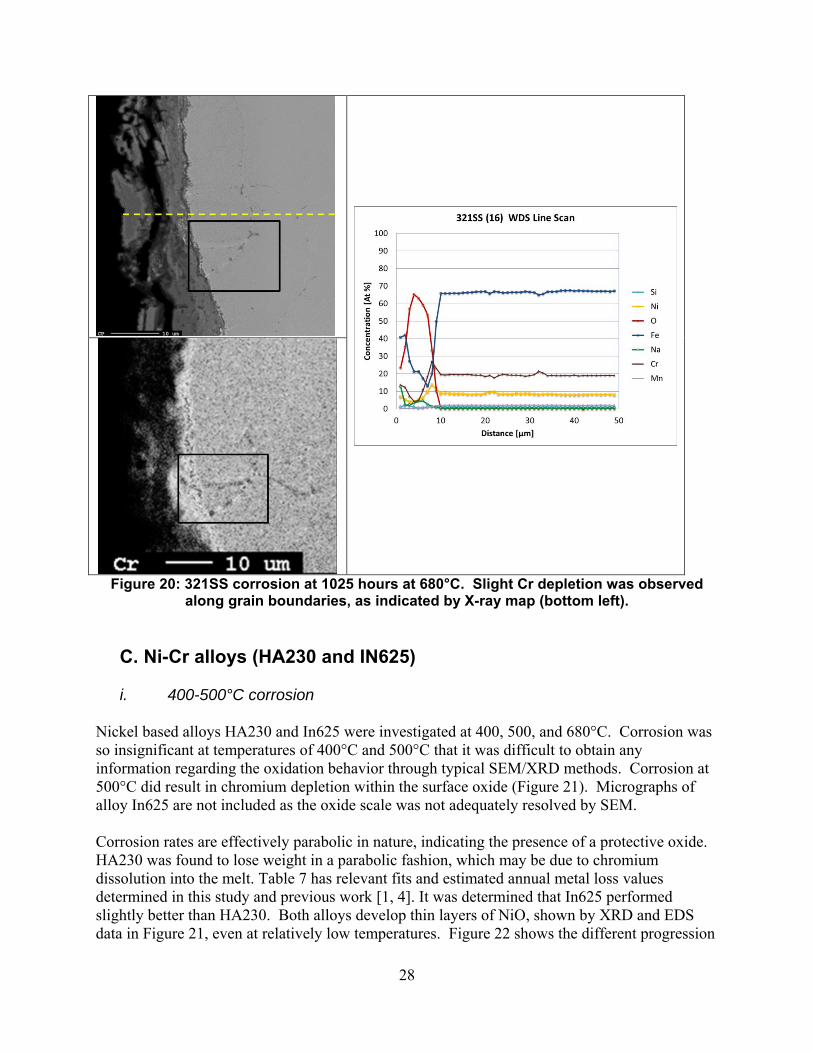
ii. 680°C corrosion 680°C exposure resulted in a significant increase in corrosion. Similarities are present between oxidation at 600°C [4] and oxidation at 680°C, in that NaFeO2 forms on the outer surface and mixed oxides beneath the sodium ferrite, there are obvious differences in the mixed oxides present. Oxides formed at 680°C are richer in nickel and chromium content than at 600°C (Figure 19, Figure 20). This result is presumably driven by the accelerated rate of attack of the base alloy. Simultaneous and competing processes are occurring; oxygen diffusing inwardly, metals (chromium most obviously) diffusing outwardly, and corrosion product spallation. This resulted in a quasi-steady state behavior where chromium is not fully depleted in corrosion scales. Corrosion proceeded uniformly on 347SS with no intergranular attack (Figure 19). XRD and line scan indicate typical corrosion products in the form of sodium ferrite and other iron oxides. 321SS had indication of preferential chromium depletion along grain boundaries, as observed in x-ray maps in Figure 20. Line scan results yield significantly less sodium content than 347SS corrosion products, which may be the result of higher spallation [4].
25
Table 6: Corrosion Rates and projections for iron based alloys
a. Based on 3064 hour data (Equation 1). b. Based on 1025 hour data
1. Reference [4]after 3000 hours
Figure 15: Weight gain and descaled loss of iron based alloys for temperatures of 400°C and 500°C.
26
Figure 16: Weight gain (left) and descaled weight loss (right, 1025 hour only) data for
alloy 347SS and 321SS at 680°C.
Figure 17: 347SS after 3064 hours at 500°C, iron oxide with no formation of NaFeO2.
Figure 18: 321SS after 3064 hours exposure at 500°C. No detection of sodium, with XRD
scans indicating magnetite formation.
27
Figure 19: 347SS after 1025 hours exposure at 680°C. Phases of NaFeO2 were detected
with XRD after 520 hours (bottom left), with mixed oxide detected at 1025 hours (bottom right). Corrosion proceeded uniformly with no obvious grain boundary depletion of
chromium.
28
Figure 20: 321SS corrosion at 1025 hours at 680°C. Slight Cr depletion was observed
along grain boundaries, as indicated by X-ray map (bottom left).
C. Ni-Cr alloys (HA230 and IN625)
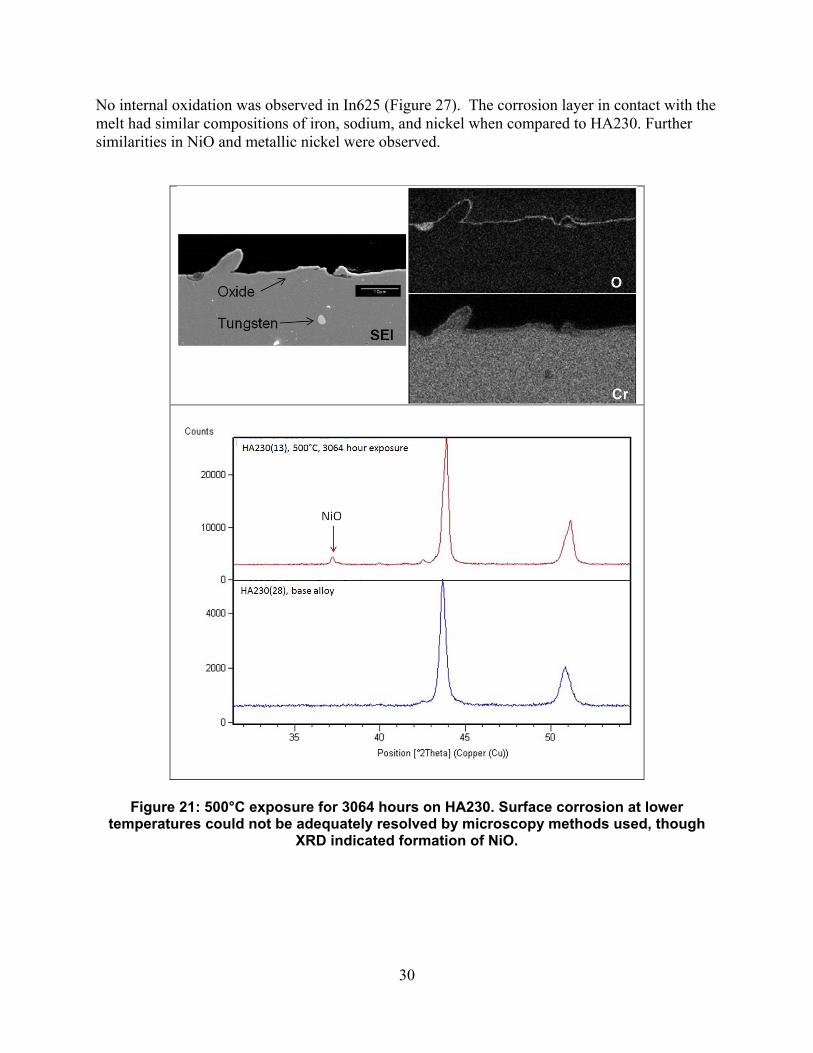
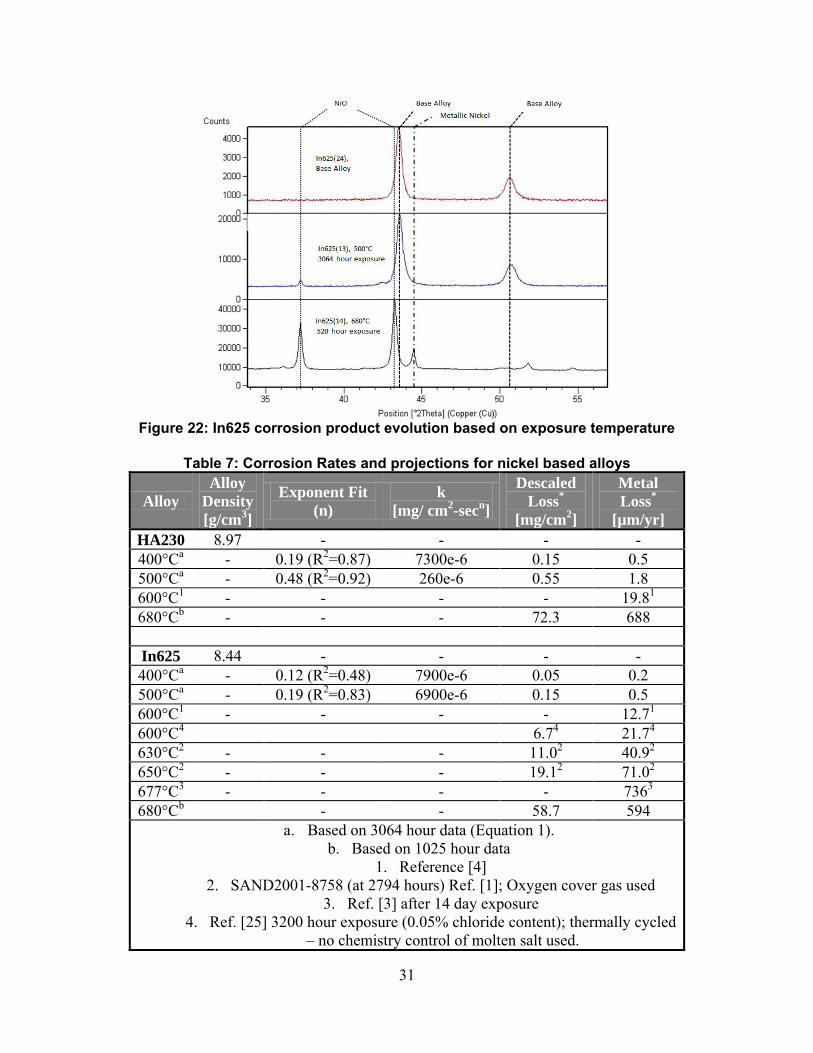
i. 400-500°C corrosion Nickel based alloys HA230 and In625 were investigated at 400, 500, and 680°C. Corrosion was so insignificant at temperatures of 400°C and 500°C that it was difficult to obtain any information regarding the oxidation behavior through typical SEM/XRD methods. Corrosion at 500°C did result in chromium depletion within the surface oxide (Figure 21). Micrographs of alloy In625 are not included as the oxide scale was not adequately resolved by SEM. Corrosion rates are effectively parabolic in nature, indicating the presence of a protective oxide. HA230 was found to lose weight in a parabolic fashion, which may be due to chromium dissolution into the melt. Table 7 has relevant fits and estimated annual metal loss values determined in this study and previous work [1, 4]. It was determined that In625 performed slightly better than HA230. Both alloys develop thin layers of NiO, shown by XRD and EDS data in Figure 21, even at relatively low temperatures. Figure 22 shows the different progression
29
in corrosion products from base alloy through 500 and 680°C for In625. The observed difference in performance between these alloys is likely due to relative concentrations of soluble metals in the alloy, as HA230 has 14wt% tungsten.
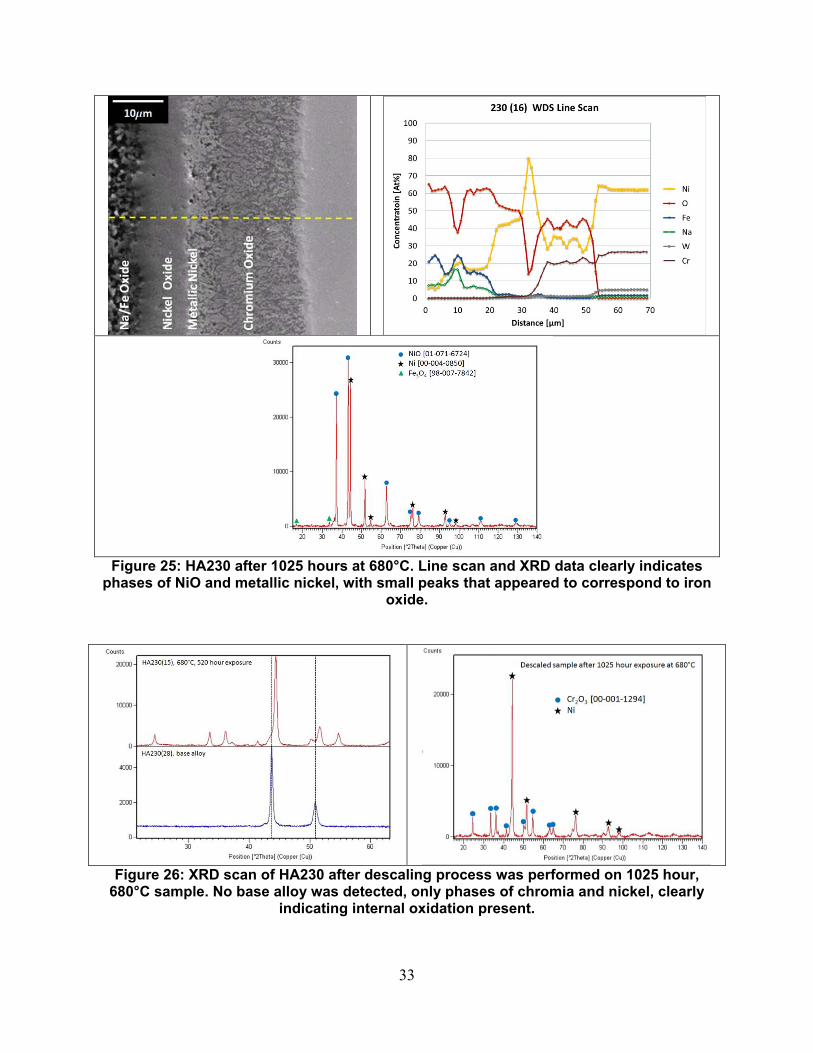
ii. 680°C corrosion Oxidation was severe for both alloys at 680°C. Table 7 shows a comparison of metal loss for alloys at several temperatures and conditions, including experiments performed at Sandia and elsewhere. Previous data investigating In625 in nitrate salts is available and an attempt was made to compare, contrast, and understand if any conclusions could be made. The most similar experiment using In625 to this test found performance that was 20-23% different [3], though this is acceptable given the limited statistics available. Corrosion of In625 increases dramatically above 650°C. Increase in corrosion rate is the result of two major parameters: temperature difference and salt chemistry. Tests investigating temperatures of 630 and 650°C employed an O2 overpressure to promote a difference in molten salt equilibrium [1]. Direct comparison of nitrite equilibriums in both oxygen covered melts were approximately equivalent to values predicted at 600°C in air, approximately 4-5wt%, in addition to corrosion mechanisms being similar. These similarities motivated the use of accelerated aging criteria, thus determining activation energies. Molten chemistry of nitrate salts is quite complex [22, 23] with changes in ullage gas resulting in a variety of different melt chemistries. Presence of an O2 cover gas is speculated to influence relative concentrations of nitrite, nitrate, oxide, peroxide, superoxide, hydroxide [22], though to what extent this seems to be controversial in the literature. Nitrite concentration, as one point of comparison, was nearly more than a factor of two higher in air sparged 680°C melts. Significant changes in salt chemistry do not lend toward a direct comparison of performance and more work is need for similar chemistry conditions to understand the effect of corrosion at such high temperatures. Alloy HA230 formed a complex oxide structure, consisting of several distinct layers (Figure 25). Layers in direct contact with the salt tended to be rich in iron, sodium and oxygen. Largely this was difficult to identify and trace peaks of magnetite were found in diffraction data. Formation of NiO was present, confirmed by both XRD and EMP. Phases of metallic nickel separated a comparatively thick layer of internal oxidation. This layer of oxide was determined to be chromia (Cr2O3) after first removing surface oxide and utilizing XRD, shown in Figure 26. This behavior can be understood by considering the Gibbs free energy of formation which favors chromia formation in the presence of low partial pressures of oxygen[24]. The formation of internal oxidation on HA230 was observed at 600°C [4], while no internal oxidation was found present in other nickel alloys (HA242, In625, or HA214). One major difference in HA230 is ternary nature of the alloy (Ni-22Cr-14W) and other work noticed susceptibility of Ni-W alloy to internal oxidation at high temperatures[16]. Data in Figure 26 confirmed suspicions that the internal oxidation was not included in the corrosion rate data for Figure 24 and Table 7 and will need to be considered from a design standpoint, which will result in more metal loss than determined through descaling analysis.
30
No internal oxidation was observed in In625 (Figure 27). The corrosion layer in contact with the melt had similar compositions of iron, sodium, and nickel when compared to HA230. Further similarities in NiO and metallic nickel were observed.
Figure 21: 500°C exposure for 3064 hours on HA230. Surface corrosion at lower
temperatures could not be adequately resolved by microscopy methods used, though XRD indicated formation of NiO.
31
Figure 22: In625 corrosion product evolution based on exposure temperature
Table 7: Corrosion Rates and projections for nickel based alloys
a. Based on 3064 hour data (Equation 1). b. Based on 1025 hour data
1. Reference [4] 2. SAND2001-8758 (at 2794 hours) Ref. [1]; Oxygen cover gas used
3. Ref. [3] after 14 day exposure 4. Ref. [25] 3200 hour exposure (0.05% chloride content); thermally cycled
– no chemistry control of molten salt used.
32
Figure 23: Weight gain and descaled information for HA230 and In625 at 400°C and 500°C.
Figure 24: Weight gain data for 680°C exposure of HA230 and In625 (left). Descaled data
(right) for 1025 hour exposure only.
33
Figure 25: HA230 after 1025 hours at 680°C. Line scan and XRD data clearly indicates
phases of NiO and metallic nickel, with small peaks that appeared to correspond to iron oxide.
Figure 26: XRD scan of HA230 after descaling process was performed on 1025 hour,
680°C sample. No base alloy was detected, only phases of chromia and nickel, clearly indicating internal oxidation present.
34
Figure 27: In625 after 1025 hour exposure at 680°C. Nickel and NiO were present as
primary corrosion products.
35
36
37
4. CONCLUSIONS Corrosion assessment of four steels (321SS, 347SS, HA230, and In625) was completed for three temperatures; 400, 500, and 680°C. This test was a follow-on test to complement a previous experiment at 600°C. Salt chemistry measurements had nitrite concentrations slightly lower than expected by equilibrium calculations. No significant amounts of metals were found in 400°C and 500°C salts. Significant amounts of chromium, molybdenum, and tungsten were dissolved into the 680°C melt. Low concentrations of nickel were detected in the melt at this temperature. Corrosion at temperatures of 400°C and 500°C was low for all alloys investigated. Nickel based steels resulted in slightly less corrosion. Performance at this temperature, best to worst, is as follows: In625 > HA230 > 347SS > 321SS. The nickel alloys both form protective NiO, which does well in protecting the base alloy. Iron based alloys form an iron oxide, which tend to be less protective in practice than nickel oxide. Corrosion at 680°C was significant as metal wastage occurred. Iron based alloys outperformed nickel alloys by 30% to 50%. Soluble transition metals, specifically Cr, Mo, and W, were found in appreciable concentrations in the melt and are thought to be the driving mechanism in performance at 680°C. NiO was the primary corrosion product for both nickel alloys, though phases of metallic nickel were also detected. HA230 exhibited internal oxidation in the form of a nickel/chromium oxide, while In625 exhibited primarily NiO. This internal oxidation may not be accounted for in corrosion rates and further microscopy will provide insight. Iron based alloys out performed nickel alloys under these harsh conditions. No attempt was made to determine activation energy for alloys tested here. Corrosion mechanisms between low temperature conditions were different than mechanisms found at 600°C. Further data points in the range of 600-680°C are needed to complete an activation energy study that could be used for accelerated aging predictions, where salt chemistry conditions are appropriately similar.
38
5. REFERENCES 1. Bradshaw, R.W. and S. Good, Accelerated corrosion testing of a nickel-base alloy in a
molten salt, 2001, SAND2001-8758, Sandia National Laboratories, Livermore C. A. 2. Pacheco, J.E., et al., Final test and evaluation results from the Solar Two project, 2002,
SAND2002-0120, Sandia National Laboratories, Albuquerque N. M. 3. Slusser, J.W., et al., CORROSION IN MOLTEN NITRATE-NITRITE SALTS. Journal of
Metals, 1985. 37(7): p. 24-27. 4. Kruizenga, A.M., D.D. Gill, and M. LaFord, Materials Corrosion of High Temperature
Alloys Immersed in 600°C Binary Nitrate Salt, 2013, SAND2013-2526, Sandia National Laboratories, Livermore C.A.
5. Standard Practice for Preparing, Cleaning, and Evaluating Corrosion Test Specimens, in G1-032003, ASTM International.
6. Gill, D.D., et al., DESIGN, FABRICATION AND TESTING OF AN APPARATUS FOR MATERIAL COMPATIBILITY TESTING IN NITRATE SALTS AT TEMPERATURES UP TO 700°C, in 5th International Conference on Energy Sustainability2011, ASME: Washington, DC, USA. p. 6.
7. Jones, D.A., Principles and prevention of corrosion1996, Upper Saddle River, NJ: Prentice Hall.
8. Takahashi, Y., R. Sakamoto, and M. Kamimoto, Heat capacities and latent heats of LiNO3, NaNO3, and KNO3. International Journal of Thermophysics, 1988. 9(6): p. 1081.
9. Bradshaw, R.W. and D.E. Meeker, High-temperature stability of ternary nitrate molten salts for solar thermal energy systems. Solar energy materials, 1990. 21(1): p. 51-60.
10. Nissen, D.A., Thermophysical properties of the equimolar mixture sodium nitrate-potassium nitrate from 300 to 600.degree.C. Journal of Chemical & Engineering Data, 1982. 27(3): p. 269-273.
11. Nissen, D.A. and D.E. Meeker, NITRATE NITRITE CHEMISTRY IN NANO3-KNO3 MELTS. INORGANIC CHEMISTRY, 1983. 22(5): p. 716-721.
12. Afanasiev, P. and D.H. Kerridge, Reactivity of V2O5, MoO3 and WO3 in molten KNO3, studied by mass spectrometry. Journal of Alloys and Compounds, 2001. 322(1-2): p. 97-102.
13. Oryshich, I.V. and O.S. Kostyrko, INFLUENCE OF MOLYBDENUM, TUNGSTEN, AND COBALT ON THE CORROSION OF HIGH-TEMPERATURE STRENGTH NICKEL ALLOYS IN MOLTEN SALTS. Metal Science and Heat Treatment (English Translation of Metallovedenie i Termicheskaya Obrabotka, 1985. 27(9-10): p. 740-746.
14. Yurkinskii, V.P., et al., INTERACTION OF MOLYBDENUM AND TUNGSTEN WITH MOLTEN NITRATES OF ALKALI METALS. Journal of applied chemistry of the USSR, 1984. 57(3 pt 1): p. 476-479.
15. Deloume, J.-P., et al., Study of the reaction of tungsten carbide in molten alkali metal nitrates. Syntheses of divalent (s and d blocks) metal tungstates. Journal of Solid State Chemistry, 2003. 174(1): p. 1-10.
16. Ganster, P., B. Pujilaksono, and K. Wolski. Kinetics and mechanism of high temperature internal oxidation of Ni-14wt%W alloy at 1000C. in 8th International Conference on Diffusion in Materials, DIMAT 2011, July 3, 2011 - July 8, 2011. 2012. Dijon, France: Trans Tech Publications Ltd.
39
17. Rogers, D.J. and G.J. Janz, MELTING-CRYSTALLIZATION AND PREMELTING PROPERTIES OF NANO3-KNO3. ENTHALPIES AND HEAT CAPACITIES. 1982. V
27(N 4): p. 424-428. 18. Speidel, P.J., et al., Performance of the solar two central receiver power plant. Journal
De Physique. IV : JP, 1999. 9(3): p. Pr3-181 - Pr3-188. 19. Kearney, D., et al., Assessment of a molten salt heat transfer fluid in a parabolic trough
solar field. Journal of Solar Energy Engineering, Transactions of the ASME, 2003. 125(2): p. 170-176.
20. Bradshaw, R.W. and S.H. Goods, Corrosion of alloys and metals by molten nitrates, 2001, SAND2000-8727, Sandia National Laboratories, Livermore C. A.
21. Goods, S.H., et al., Corrosion of stainless and carbon steels in molten mixtures of industrial nitrates, 1994, SAND94-8211, Sandia National Laboratories, Livermore C. A.
22. Lovering, D.G., Molten salt technology1982, New York: Plenum Press. 23. Picard, G.S., T.A. Flament, and B.L. Tremillon, ACIDITY AND THERMOCHEMICAL
STABILITY OF MOLTEN SODIUM NITRATE AND NITRITE MIXTURES. Journal of The Electrochemical Society, 1985. 132(4): p. 863-868.
24. Barin, I. and O. Knacke, Thermochemical properties of inorganic substances1973, Berlin; New York: Springer-Verlag.
25. Bradshaw, R.W. and S.H. Goods, Corrosion resistance of nickel-base alloys in molten alkali nitrates, 2000, SAND2000-8240, Sandia National Laboratories, Livermore C. A.
40
41
APPENDIX:
A. Sample pull Schedule and Order Samples were removed using a sample interval method. Four additional alloys were tested using this method, 625SQ, P91, Cr2-1/4 and HR120, but were not analyzed due to budgetary constraints.
Figure 28: 400°C removal schedule and sample ID
Figure 29: 500°C removal schedule and sample ID
42
Figure 30: 680°C removal schedule and sample ID
B. SALT SPECIFICATIONS
43
DISTRIBUTION External (electronic)
1 Joseph Stekli US DOE Office of the Solar Energy Technology Program Route Symbol: EE-2A Building: L'ENF950
Washington, DC 20585 1 Bruce Kelly Abengoa Solar 11500 West 13th Avenue Lakewood, CO 1 David Wasyluk Babcock & Wilcox Power Generation Group 20 S. Van Buren Avenue Barberton, Ohio 44203 1 Greg Kolb SolarReserve 1205 Lawrence Ct. NE Albuquerque, NM 87112 1 Lee Flowers Haynes International, Inc. 1020 West Park Avenue Kokomk, IN 46904-9013 1 Matthew Bender ATI Allegheny Ludlum 1300 Pacific Avenue Natrona Heights, PA 15065, USA 1 Craig Tyner eSolar 3355 W. Empire Avenue Suite 200 Burbank, CA 91504 1 Trent Maxwell Alstom Power 1201 Riverfront Parkway Chattanooga TN 37402
44
Internal (electronic)
1 MS1127 David Gill 6123 1 MS1127 Subhash Shinde 6123 1 MS1127 William Kolb 6123 1 MS9153 Timothy Shepodd 8200 1 MS9402 Ryan Nishimoto 8651 1 MS9403 Alan Kruizenga 8223 1 MS9403 Adam Rowen 8223 1 MS0899 Technical Library 9536