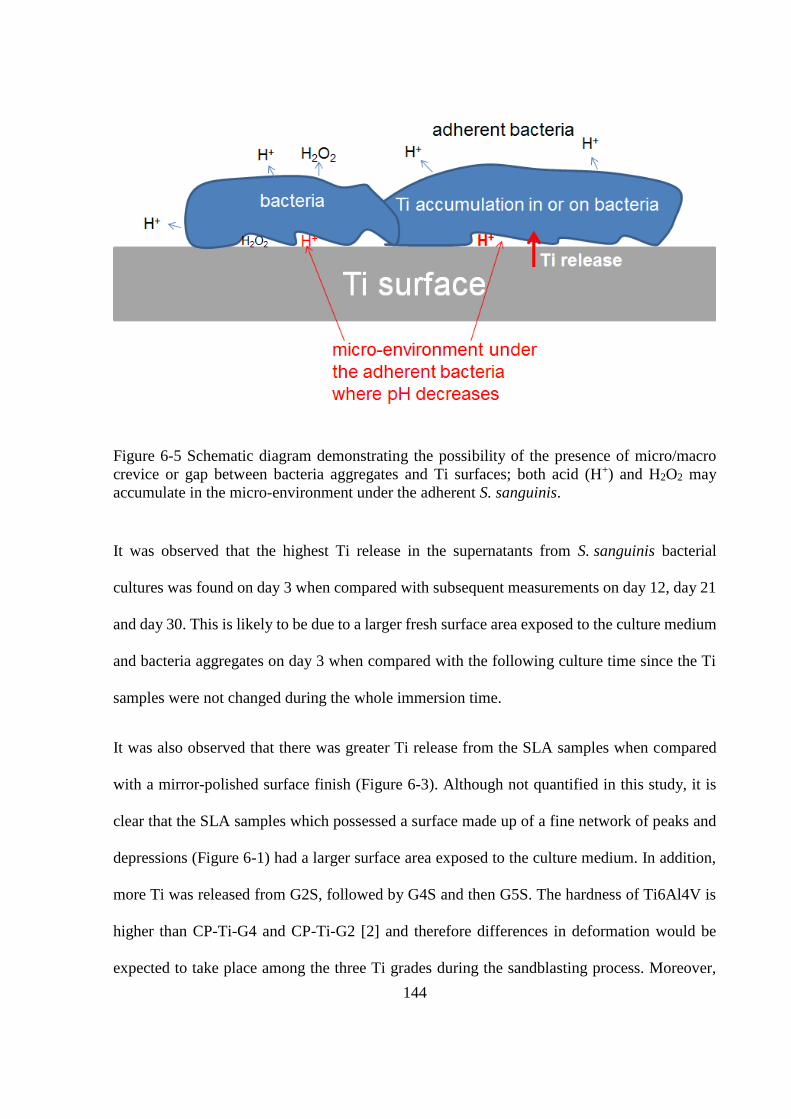
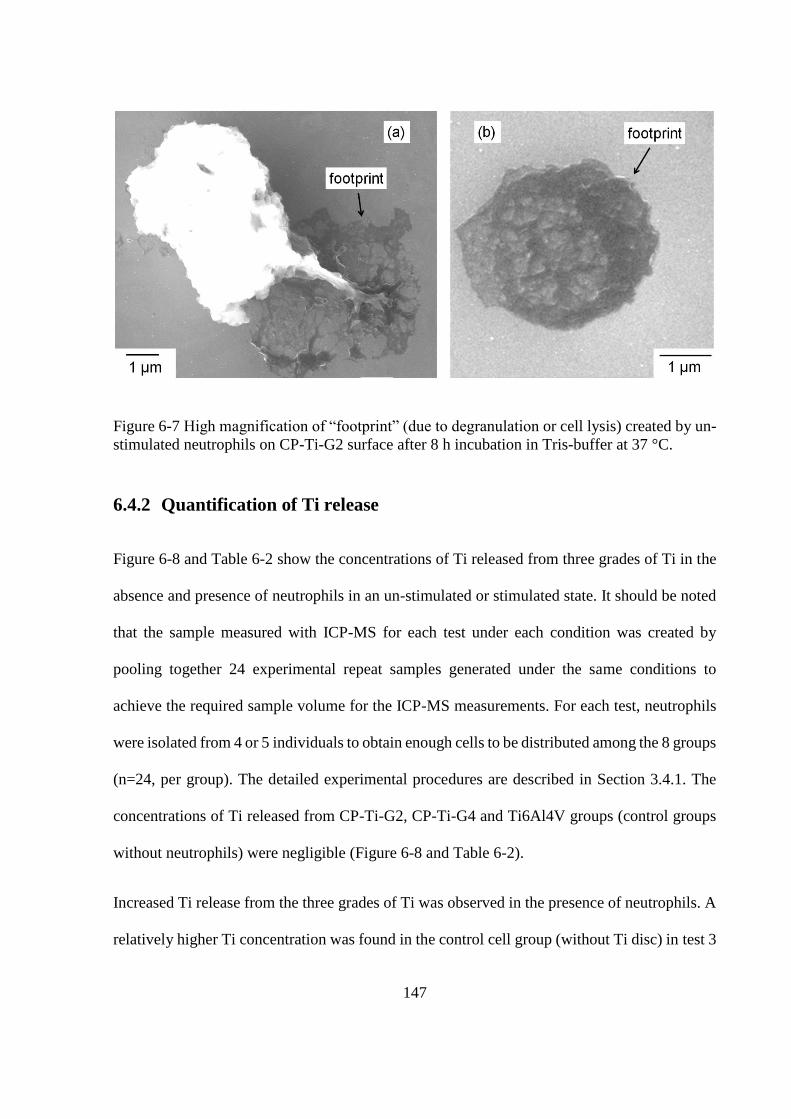
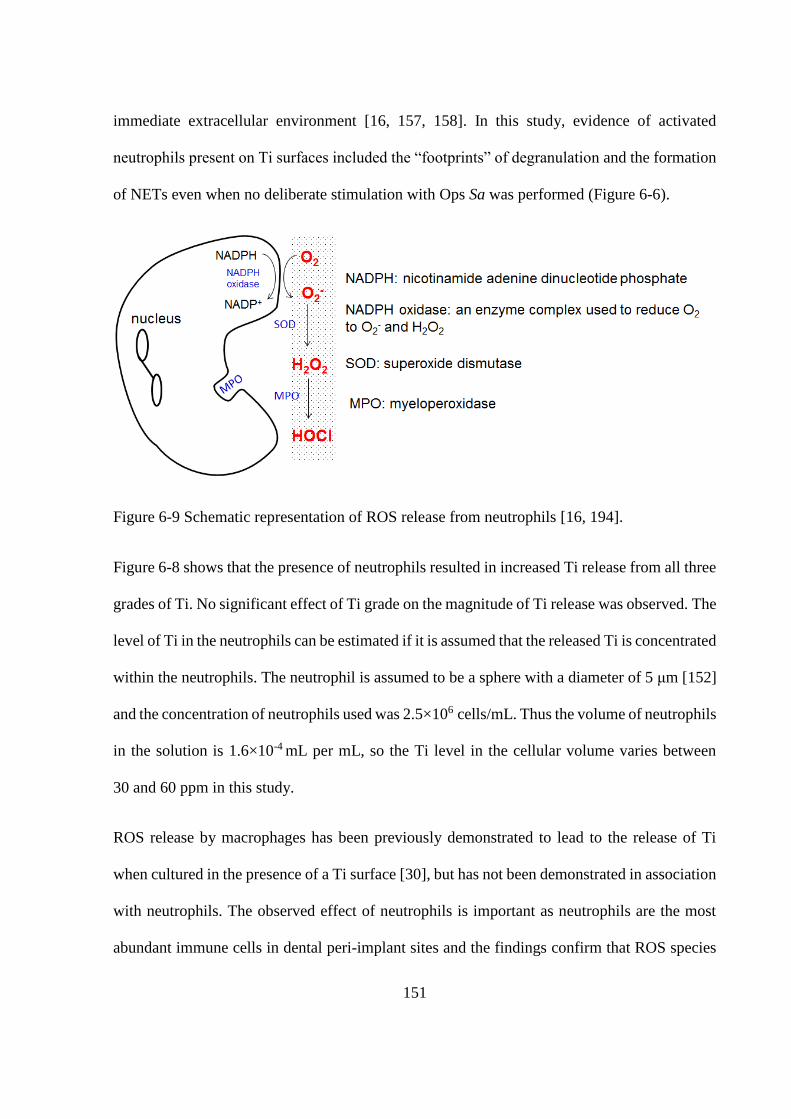
Page 1
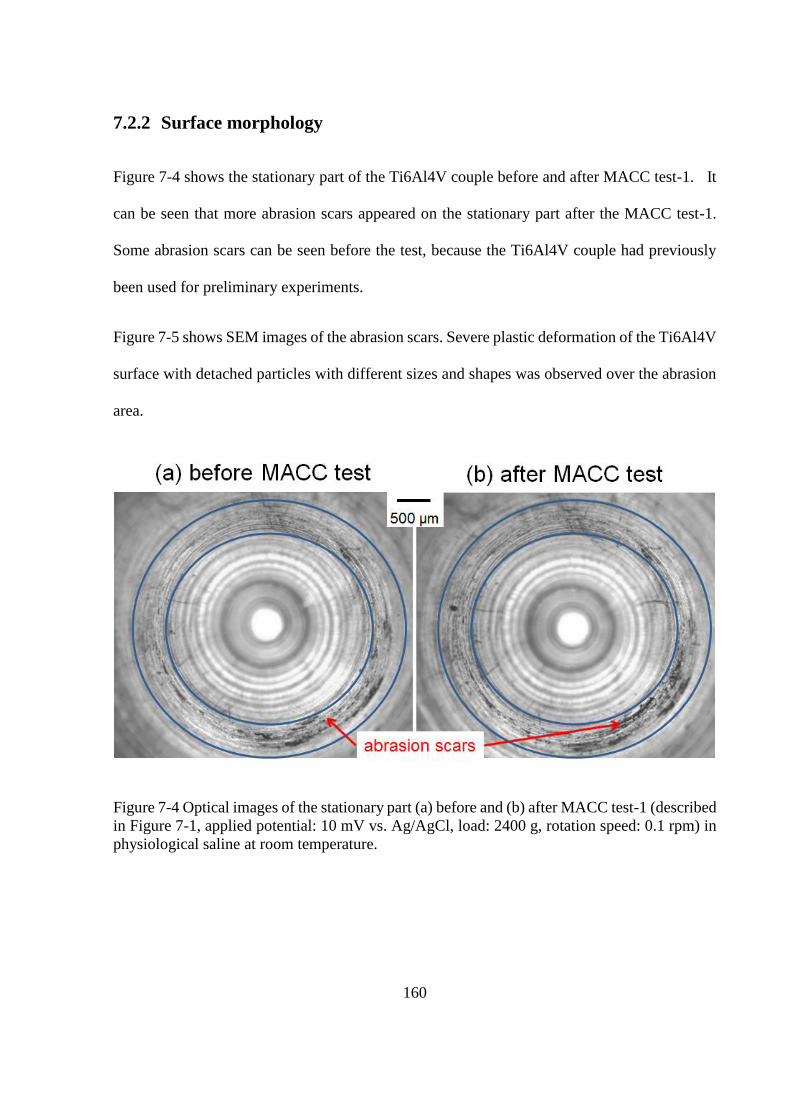
CORROSION OF TITANIUM FOR
BIOMEDICAL APPLICATIONS
by
Fei Yu
A thesis submitted to the University of Birmingham
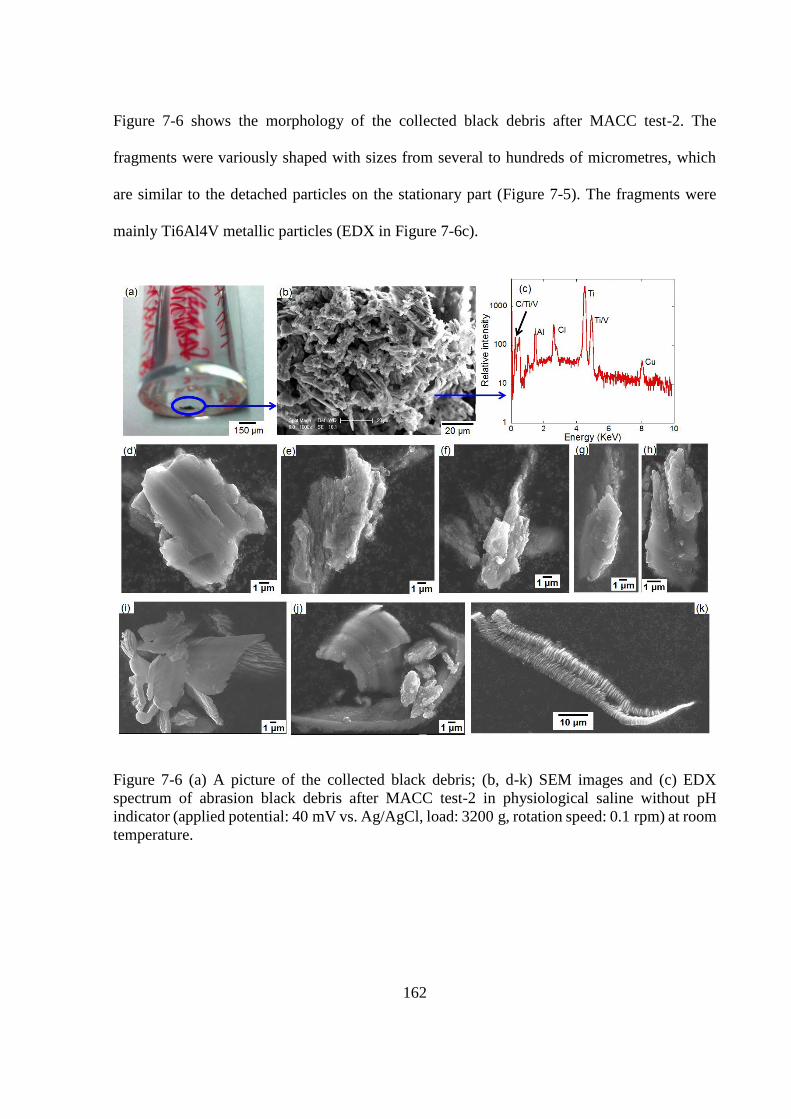
for the degree of DOCTOR OF PHILOSOPHY
School of Metallurgy and Materials
University of Birmingham
March 2015
Page 2
University of Birmingham Research Archive
e-theses repository This unpublished thesis/dissertation is copyright of the author and/or third parties. The intellectual property rights of the author or third parties in respect of this work are as defined by The Copyright Designs and Patents Act 1988 or as modified by any successor legislation. Any use made of information contained in this thesis/dissertation must be in accordance with that legislation and must be properly acknowledged. Further distribution or reproduction in any format is prohibited without the permission of the copyright holder.
Page 3
ABSTRACT
Ti and its alloys have been widely used in the manufacture of biomedical implanted devices
since the 1950s because of their biocompatibility, corrosion resistance and suitable mechanical
properties. However, corrosion-related failures of Ti implants are observed. It has also been
found that the corrosion products, including metal ions and/or debris/particles, can induce
unfavourable biological responses which in turn may lead to the failure of Ti implants.
In the current study, the corrosion of three grades of Ti (CP-Ti Grade 2, CP-Ti Grade 4 and
Ti6Al4V) in a series of simulated peri-implant environments has been characterised by
measuring ion release and characterising surface morphology. Electrochemical tests have been
used to identify the mechanisms leading to the observed corrosion behaviour. Corrosion in the
presence of chemical species found in the peri-implant environment (lipopolysaccharide (LPS),
a component of Gram-negative bacterial cell walls and a potent mediator of peri-implant
inflammation, albumin, an abundant protein, and H2O2, an important inflammation product)
was studied. Corrosion mediated by the presence of bacteria (early colonisers of Ti surfaces in
the oral environment) and abundant immune cells (neutrophils) found in peri-implant sites was
investigated. Finally a novel apparatus was designed and fabricated to simulate mechanically-
assisted crevice corrosion (MACC) of Ti implants in representative physiological solutions.
LPS was observed to enhance Ti corrosion in slightly acidic and neutral conditions (pH 4-7)
whilst it inhibited Ti dissolution in highly acidic environments (pH 2). Both albumin and H2O2
influenced the corrosion of Ti and the co-existence of both species considerably enhanced the
corrosion of Ti6Al4V more than either species in isolation. The β phase of Ti6Al4V was found
to be preferentially attacked in the presence of H2O2. The presence of an early bacterial
Page 4
coloniser of dental implants Streptococcus sanguinis and the presence of human neutrophils
promoted Ti release from all three grades of Ti. In addition, MACC simulation was
demonstrated and the development of aggressive crevice chemistry observed. The presence of
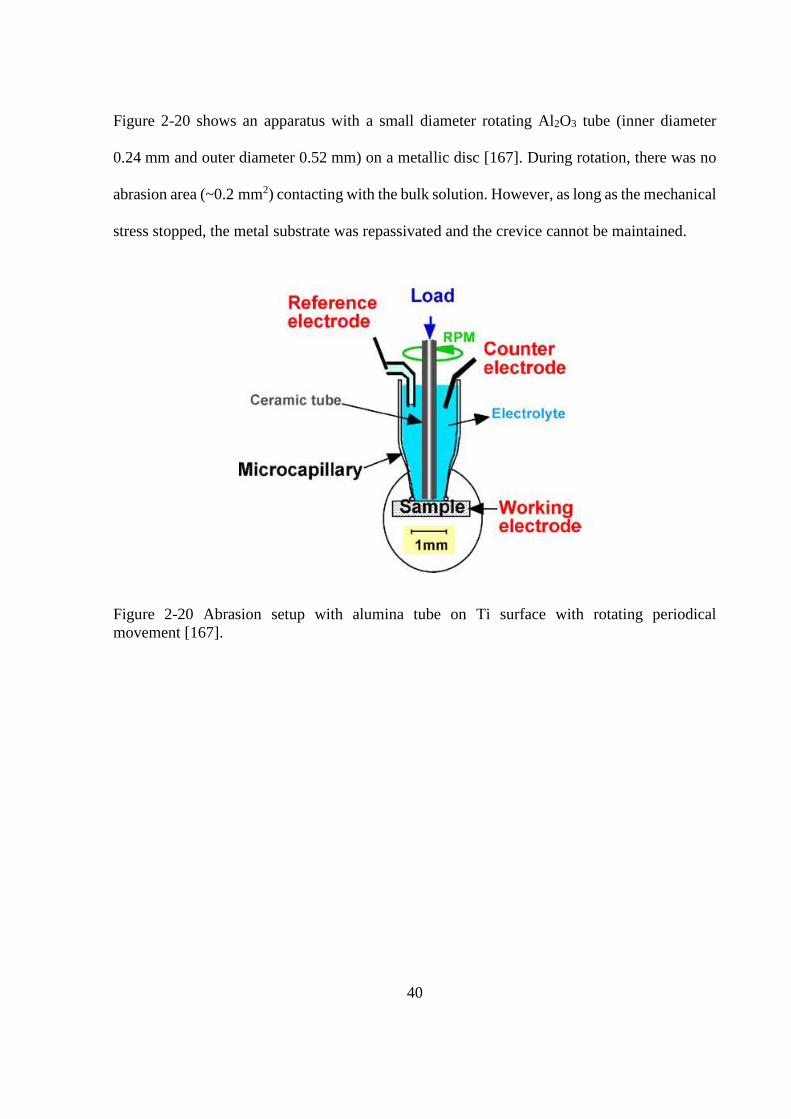
albumin decreased the abrasion charge of Ti6Al4V during MACC while LPS and H2O2 did not
show a measurable change.
Predicting the behaviour of metallic biomaterials in physiological conditions is essential to
inform medical device manufacture and prevent adverse outcomes for patients. Despite this
unfavourable biological responses to materials that are in widespread use are reported, in vitro
simulation of materials behaviour is often highly simplistic and fails to account for the
complexity of the peri-implant environment. In this study it was demonstrated that chemical
species (pH, LPS, H2O2 and albumin), biological cells (early colonising bacteria and innate
immune cells) and MACC may significantly modify the corrosion properties of biomedical Ti
alloys.
Page 5
ACKNOWLEDGEMENT
Here I would like to thank all the people who have offered the most generous help. First of all,
I would like to give the most sincere gratitude to my supervisors, Prof Alison Davenport and
Prof Owen Addison. They have given me the best opportunity to work on my subject and guided
me to be a good scientist. Alison’s guidance, criticism and patience are invaluable for me. Also,
Owen has supported me really a lot on both science and life his encouragement is really
important. I would never have finished this PhD thesis without my supervisors.
Secondly, I really need to thank the technicians, Mr. Steve West and Mr. Andrew Tanner, who
have given splendid support on fabricating the MACC apparatus. It is a really significant part
of my work, and it would be impossible without all these nice people. Also, I need to thank Dr
Stephen Baker, who has carried out so many ICP-MS tests for me, his patience is highly
appreciated. I also would like to thank the volunteers for providing bloods and the nurses.
Thirdly, I would never forget to thank all my dear colleagues and friends, who are or were in
the corrosion group at the School of Metallurgy and Materials: Weichen (helped me a lot on
electrochemistry work), Liya, Sophie, Rowena, Haval, Steven, Angus, George, Sara and in the
Biomaterial Unit at School of Dentistry: Sonam (helped me a lot on neutrophils work), Rachel,
Krunal, Gareth... I wish everybody the best on career and life.
I would like to thank University of Birmingham and China Scholarship Council (CSC) for
funding my study.
Last but not least, I could never thank enough to my lovely family and Fiancé for their
understanding, patience and concern.
Page 6
TABLE OF CONTENTS
1 INTRODUCTION .......................................................................................... 1
2 LITERATURE REVIEW ............................................................................... 4
2.1 Ti and its alloys ............................................................................................................ 4
2.1.1 Biomedical applications ....................................................................................... 4
2.1.2 CP-Ti and Ti6Al4V .............................................................................................. 6
2.1.2.1 Mechanical properties ....................................................................................... 6
2.1.2.2 Microstructure ................................................................................................... 6
2.2 Corrosion of Ti alloys .................................................................................................. 8
2.2.1 Ti surface .............................................................................................................. 8
2.2.2 Electrochemistry of Ti corrosion .......................................................................... 8
2.2.3 General corrosion of Ti....................................................................................... 10
2.2.4 Pitting corrosion of Ti ........................................................................................ 11
2.2.5 Crevice corrosion of Ti ....................................................................................... 12
2.2.6 Mechanically-assisted crevice corrosion (MACC)............................................. 13
2.3 Characterisation of Ti corrosion in the body ............................................................. 15
2.3.1 Introduction ........................................................................................................ 15
2.3.2 Metal ion release ................................................................................................. 15
2.3.3 Detection of Ti particles/debris in human tissues ............................................... 16
2.3.4 Mechanically-assisted crevice corrosion (MACC) of Ti implants ..................... 17
2.3.4.1 Corrosion features of Ti femoral stem of orthopaedic implants ..................... 17
2.3.4.2 Corrosion features of modular tapers .............................................................. 19
2.3.5 Effects on human tissues .................................................................................... 21
2.4 Corrosion of Ti alloys in vitro studies ....................................................................... 22
2.4.1 Introduction ........................................................................................................ 22
Page 7
2.4.2 Effect of environment acidity on corrosion of Ti alloys .................................... 23
2.4.2.1 Introduction ..................................................................................................... 23
2.4.2.2 Effect of pH on corrosion of Ti alloys ............................................................ 24
2.4.2.3 Effect of HCl on corrosion of Ti alloys .......................................................... 24
2.4.3 Effect of inorganic species on corrosion of Ti alloys ......................................... 26
2.4.4 Effect of organic species on corrosion of Ti alloys ............................................ 30
2.4.4.1 Introduction ..................................................................................................... 30
2.4.4.2 Effect of albumin on corrosion of Ti alloys .................................................... 30
2.4.4.3 Combination effect of albumin and H2O2 ....................................................... 31
2.4.4.4 Effect of LPS on corrosion of Ti alloys .......................................................... 32
2.4.5 Effect of prokaryotic cells (bacteria) on corrosion of Ti alloys ......................... 33
2.4.6 Effect of human cells (leukocytes) on corrosion of Ti alloys ............................ 34
2.4.7 In vitro studies on mechanically-assisted crevice corrosion (MACC) ............... 36
2.4.7.1 Introduction ..................................................................................................... 36
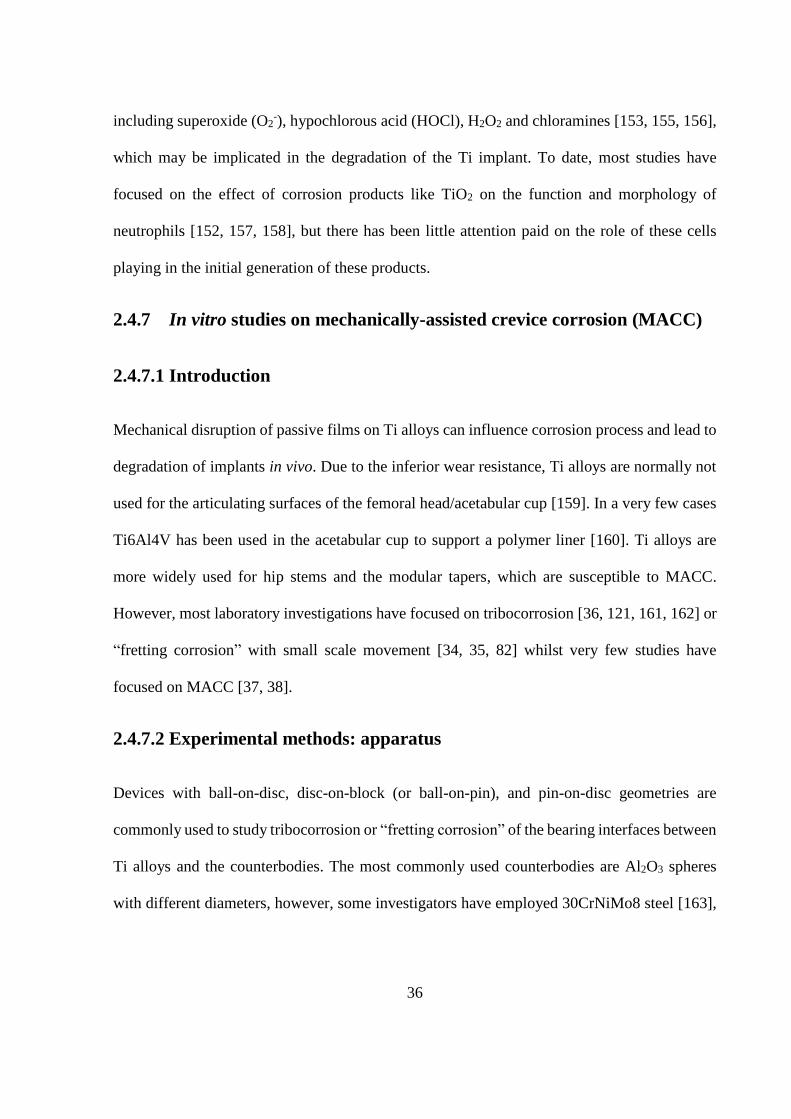
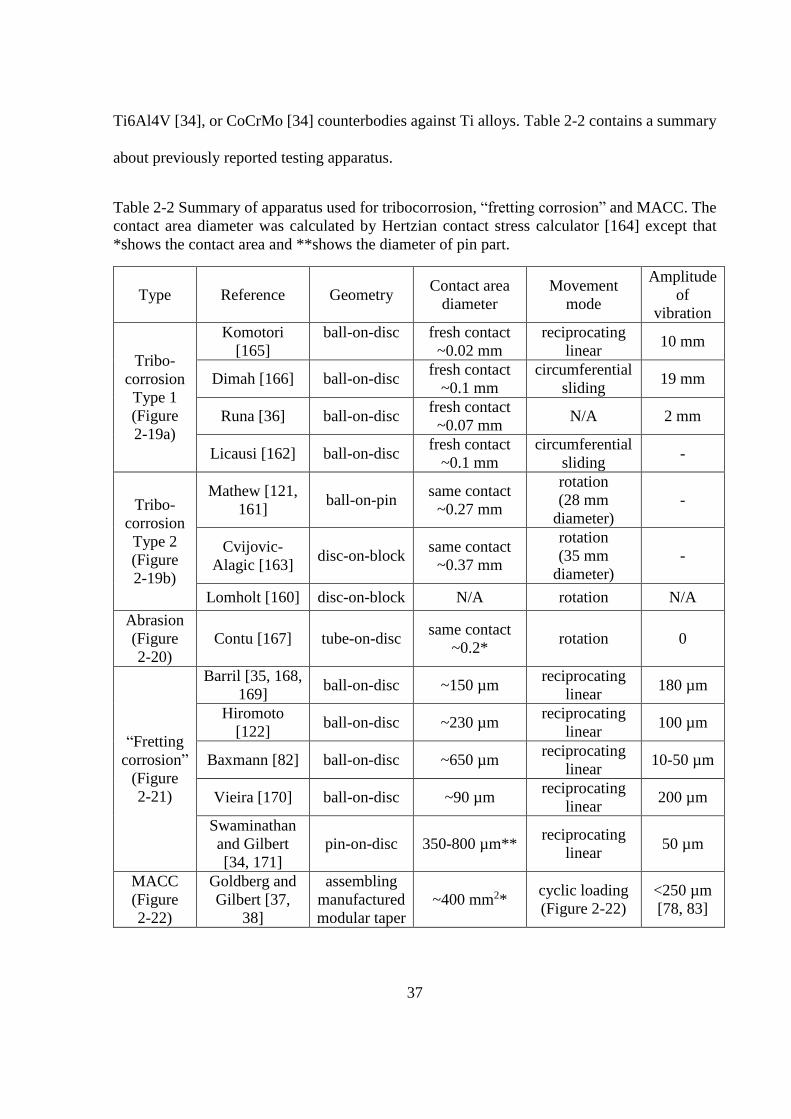
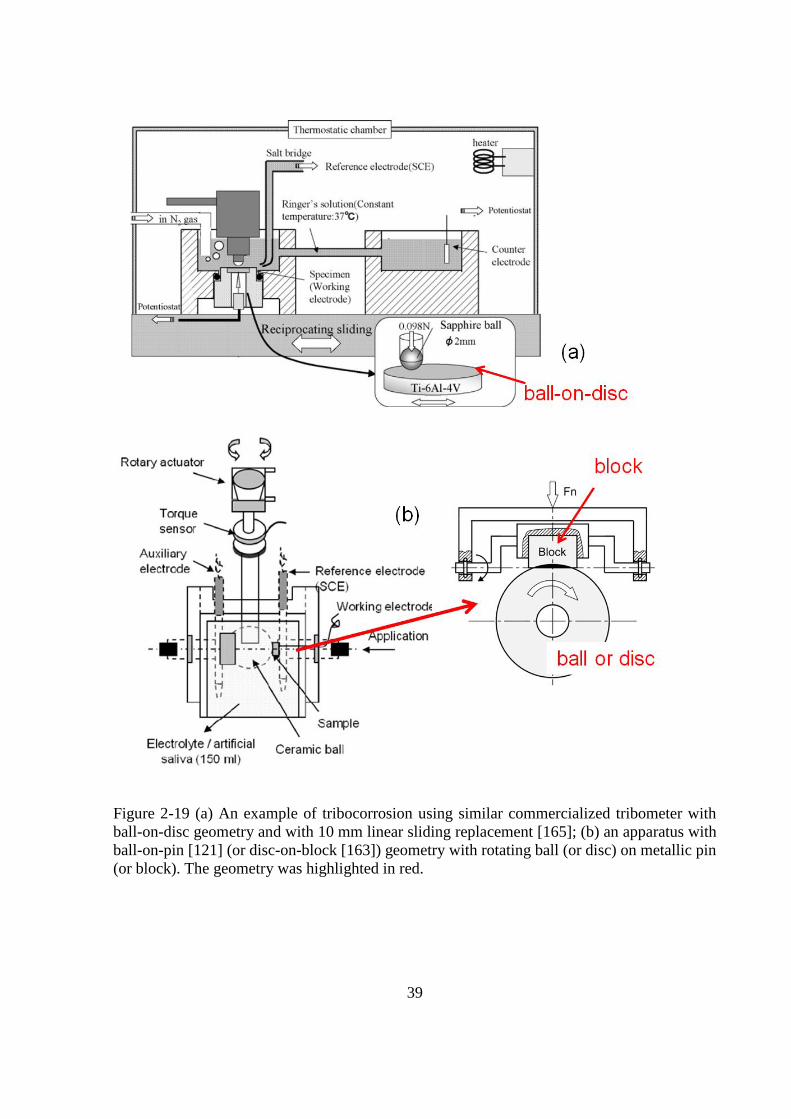
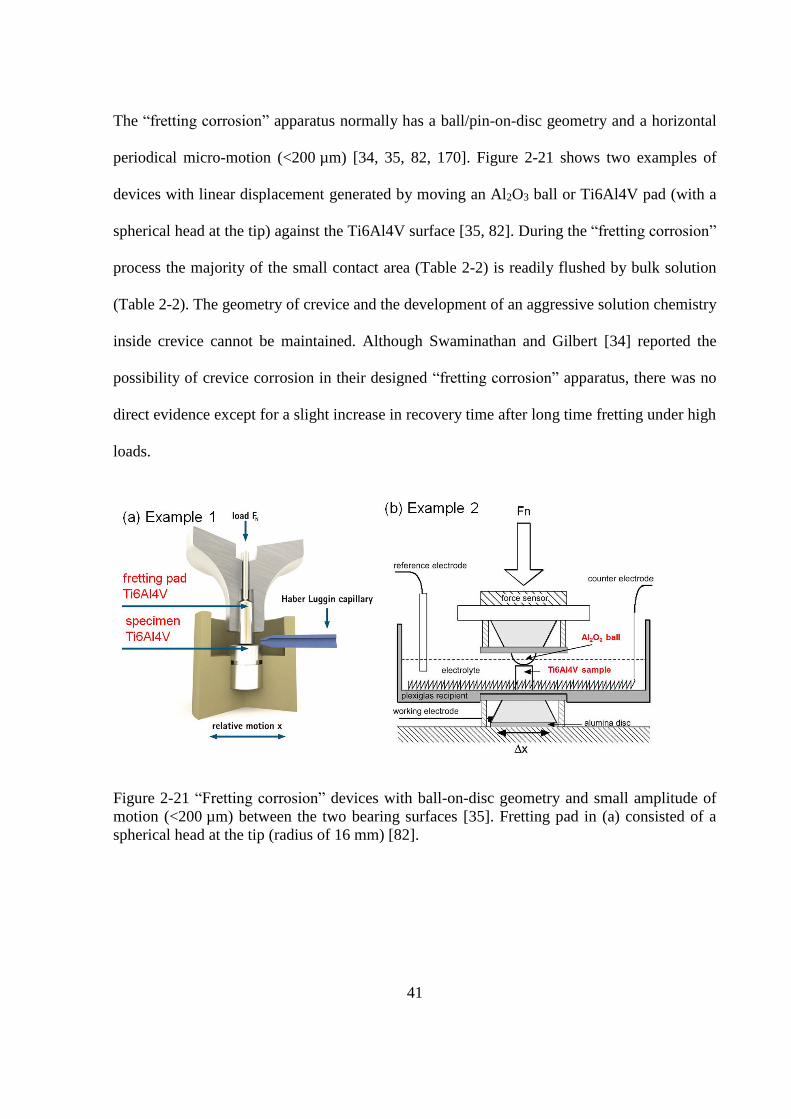
2.4.7.2 Experimental methods: apparatus ................................................................... 36
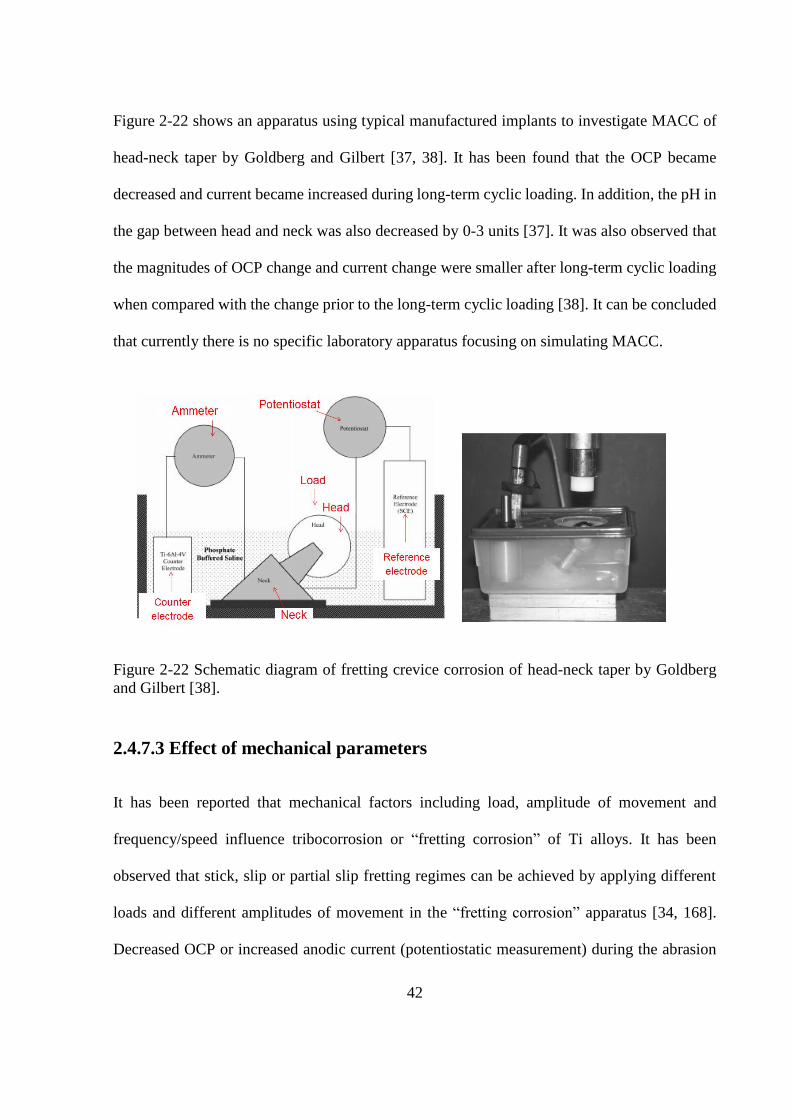
2.4.7.3 Effect of mechanical parameters ..................................................................... 42
2.4.7.4 Effect of chemical species .............................................................................. 43
2.5 Summary and aims ..................................................................................................... 44
3 MATERIALS AND METHODS .................................................................. 46
3.1 Ti sample preparation ................................................................................................ 46
3.1.1 Mirror-polished surface ...................................................................................... 46
3.1.2 Sandblasted-acid-etched (SLA) surface ............................................................. 47
3.2 Immersion tests .......................................................................................................... 49
3.2.1 Effect of pH and lipopolysaccharide (LPS) on Ti corrosion .............................. 49
3.2.2 Effect of H2O2 on Ti corrosion ........................................................................... 50
Page 8
3.2.3 Effect of H2O2 in combination with albumin on Ti corrosion ............................ 50
3.3 Culture of Streptococcus sanguinis (S. sanguinis) on Ti surfaces ............................. 51
3.4 Incubation of Ti with isolated human neutrophils ..................................................... 53
3.4.1 Incubation of isolated human neutrophils on Ti surfaces ................................... 53
3.4.2 Preparation of opsonised Staphylococcus aureus (Ops Sa)................................ 56
3.5 Determination of released metal concentration ......................................................... 57
3.6 Electrochemical tests ................................................................................................. 58
3.6.1 General procedures ............................................................................................. 58
3.6.2 Potentiodynamic polarisation curves .................................................................. 59
3.6.2.1 Measurements in HCl ..................................................................................... 59
3.6.2.2 Effect of pH and LPS on Ti corrosion ............................................................ 60
3.6.2.3 Effect of H2O2 on Ti corrosion ....................................................................... 60
3.6.2.4 Effect of the combination of H2O2 and albumin on Ti corrosion ................... 61
3.6.3 Potentiostatic measurements............................................................................... 61
3.6.3.1 Measurements in HCl ..................................................................................... 61
3.6.3.2 Effect of pH and LPS on Ti corrosion ............................................................ 62
3.6.3.3 Effect of H2O2 on surface morphology of Ti6Al4V ....................................... 62
3.6.3.4 Effect of the combination of H2O2 and albumin on Ti corrosion ................... 63
3.6.4 Long-time (24 h) open circuit potential (OCP) measurement ............................ 63
3.6.4.1 Effect of combination of H2O2 and albumin on Ti corrosion ......................... 63
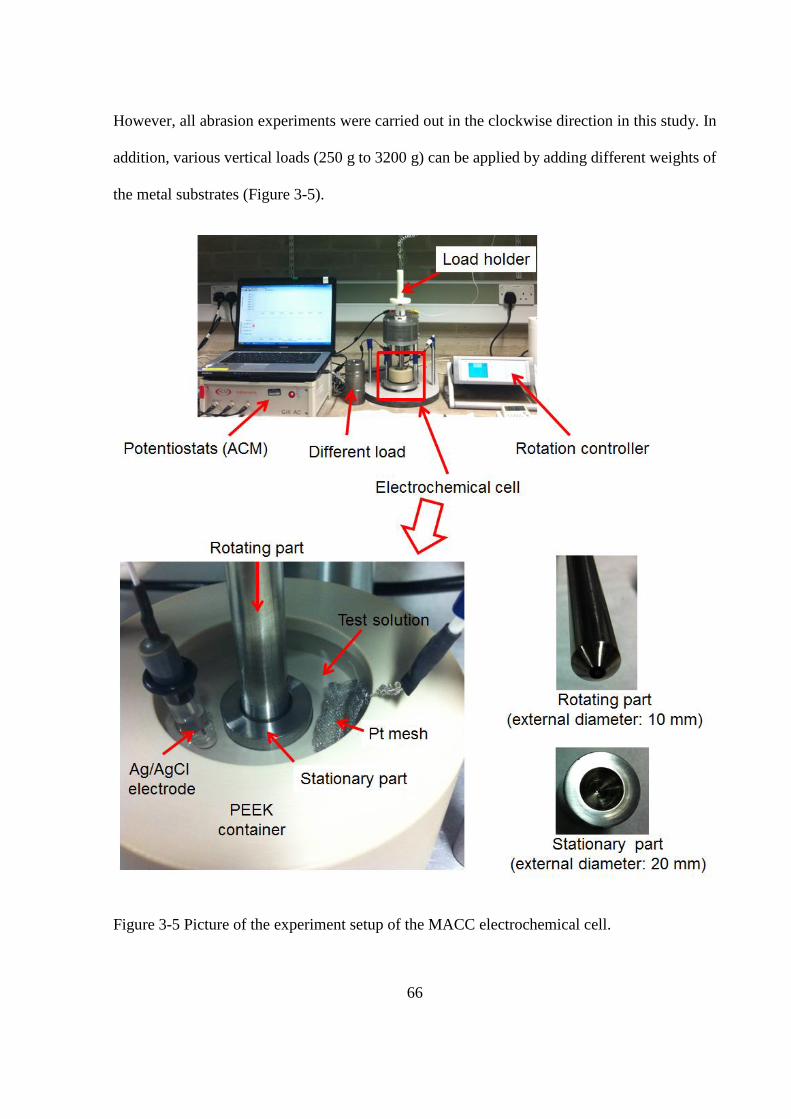
3.7 Mechanically-assisted crevice corrosion (MACC) .................................................... 64
3.7.1 Development of an MACC electrochemical cell ................................................ 64
3.7.2 General procedures ............................................................................................. 68
3.7.3 Effect of the crevice geometry............................................................................ 69
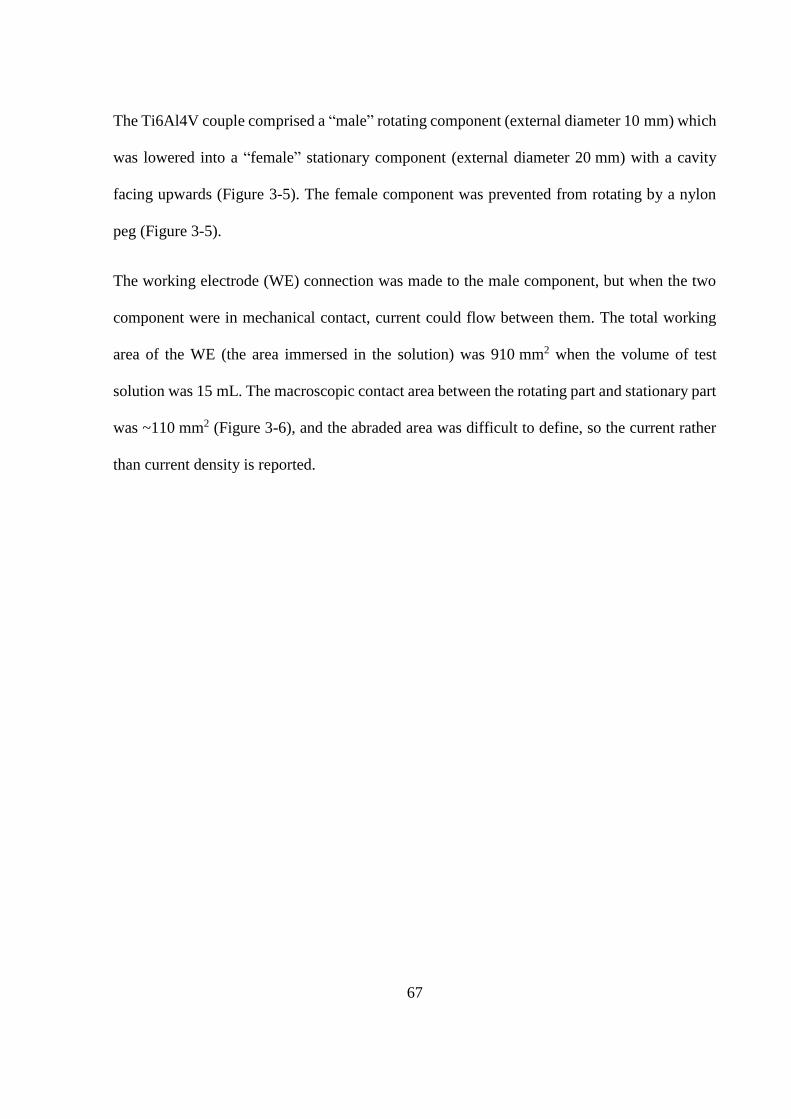
3.7.4 Surface morphology of abrasion scars and abrasion debris ............................... 70
3.7.5 Effect of rotation speed on abrasion OCP .......................................................... 71
Page 9
3.7.6 Effect of rotation speed on abrasion current ....................................................... 71
3.8 Surface characterisation ............................................................................................. 71
3.8.1 SEM .................................................................................................................... 71
3.8.2 EDX .................................................................................................................... 72
3.8.3 AFM ................................................................................................................... 72
4 EFFECT OF PH AND LIPOPOLYSACCHARIDE (LPS) ON TI
CORROSION1..................................................................................................... 73
4.1 Introduction ................................................................................................................ 73
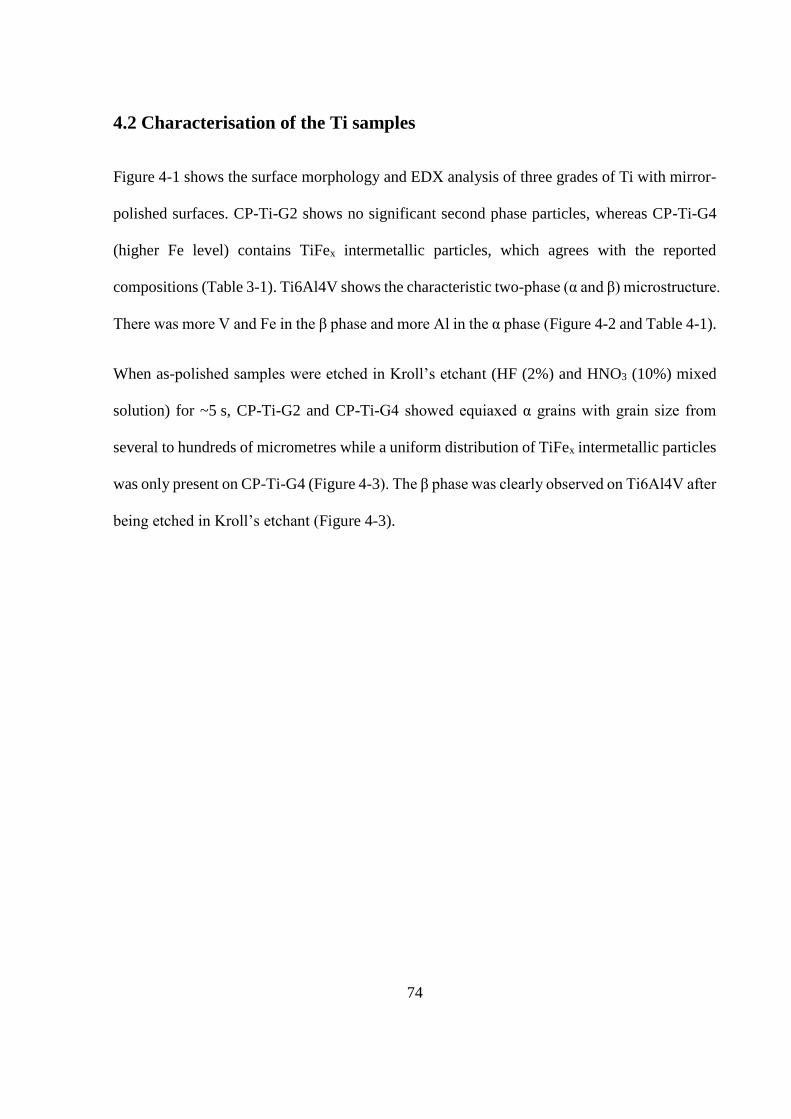
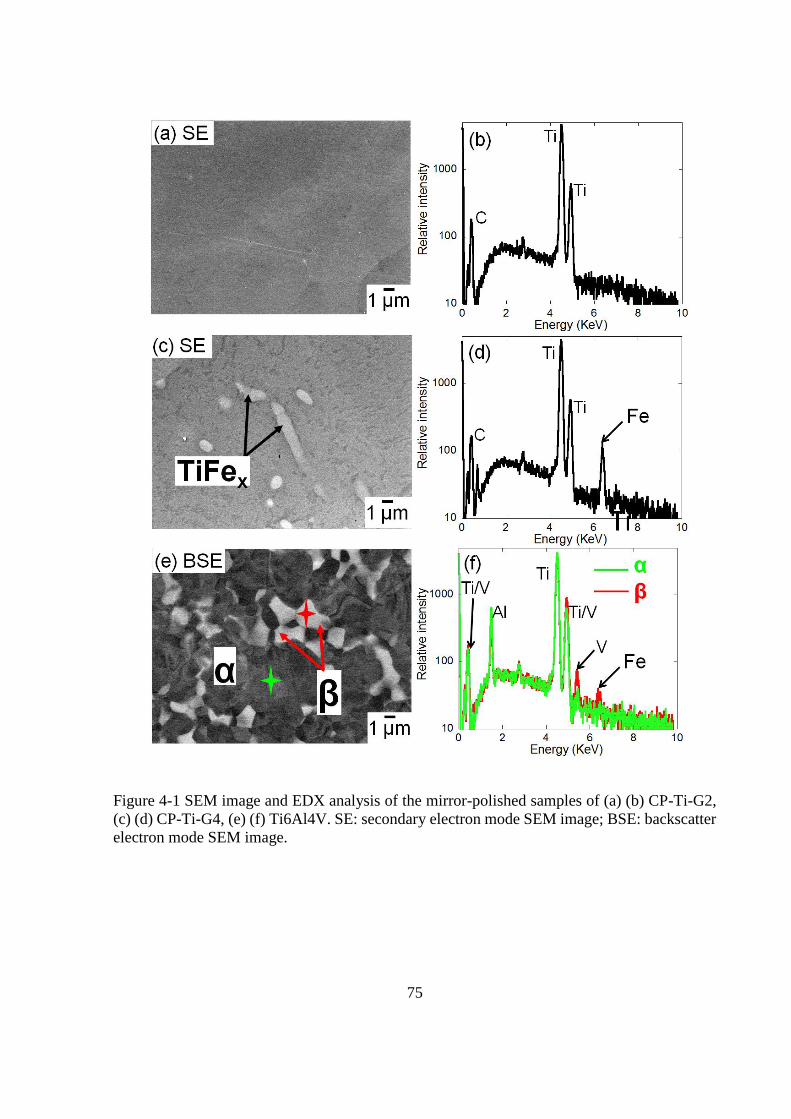
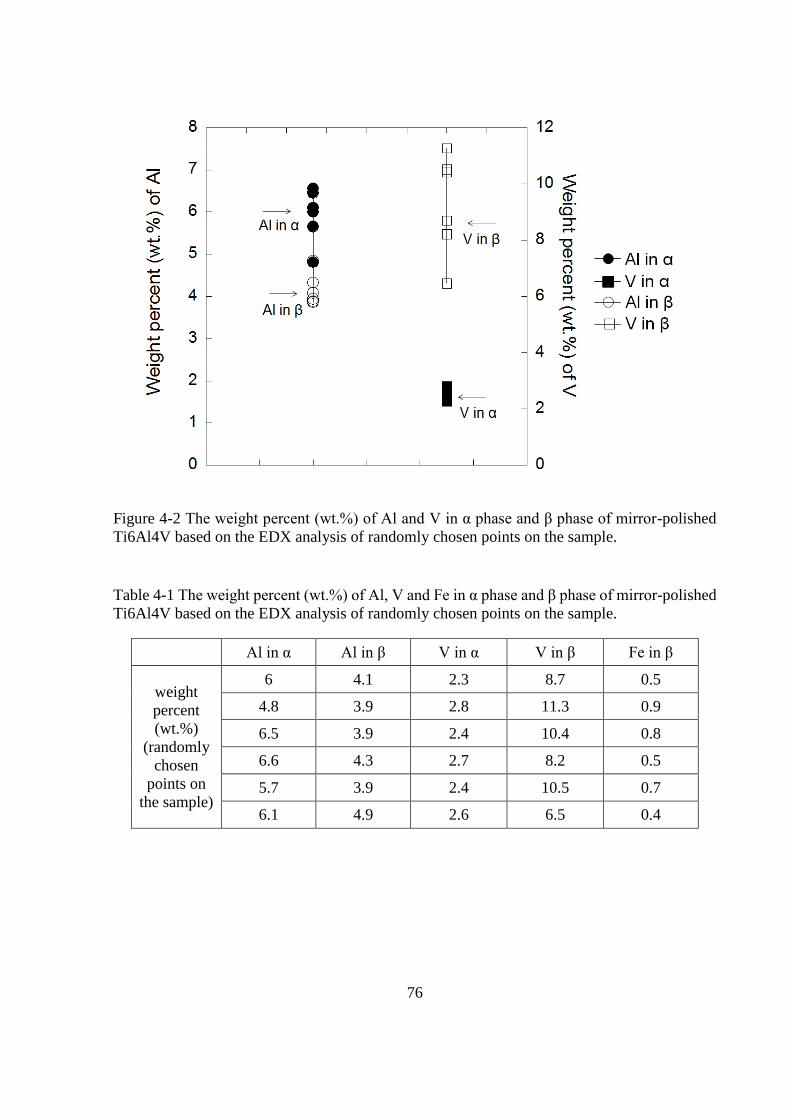
4.2 Characterisation of the Ti samples ............................................................................. 74
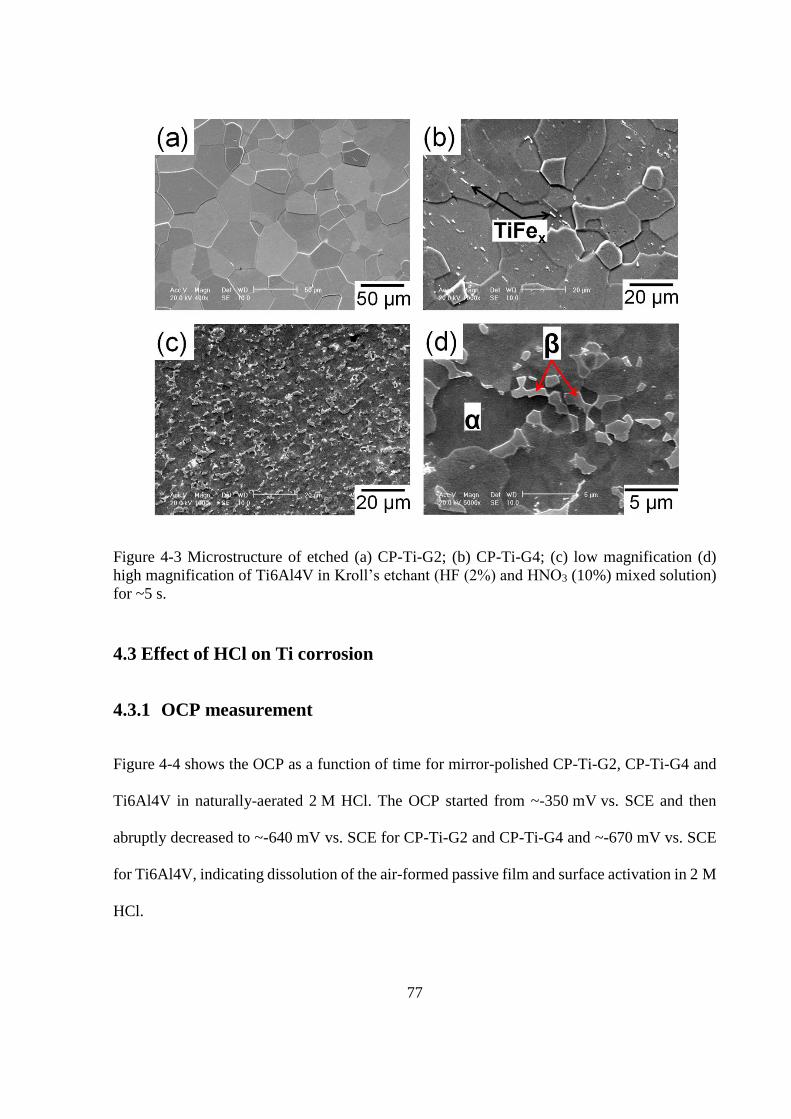
4.3 Effect of HCl on Ti corrosion .................................................................................... 77
4.3.1 OCP measurement .............................................................................................. 77
4.3.2 Anodic polarisation ............................................................................................ 78
4.3.3 Temperature dependence of corrosion behaviour of Ti6Al4V ........................... 79
4.3.4 Surface morphology of Ti6Al4V after potentiostatic tests ................................. 82
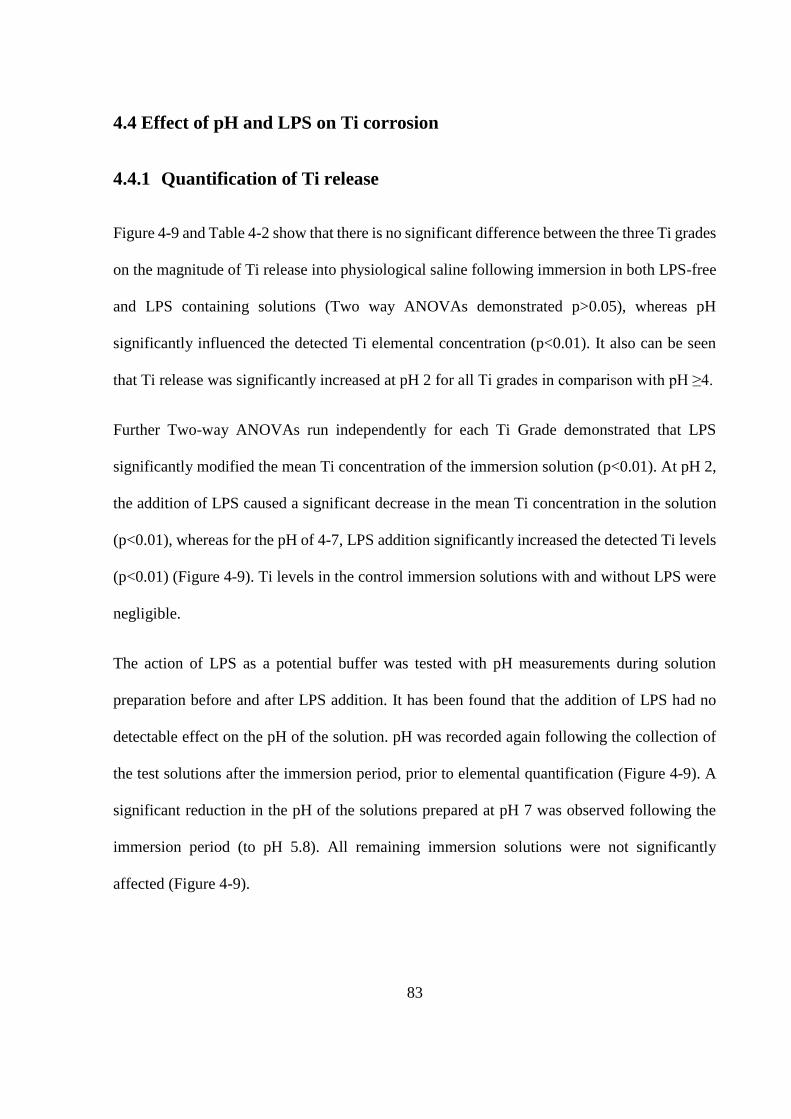
4.4 Effect of pH and LPS on Ti corrosion ....................................................................... 83
4.4.1 Quantification of Ti release ................................................................................ 83
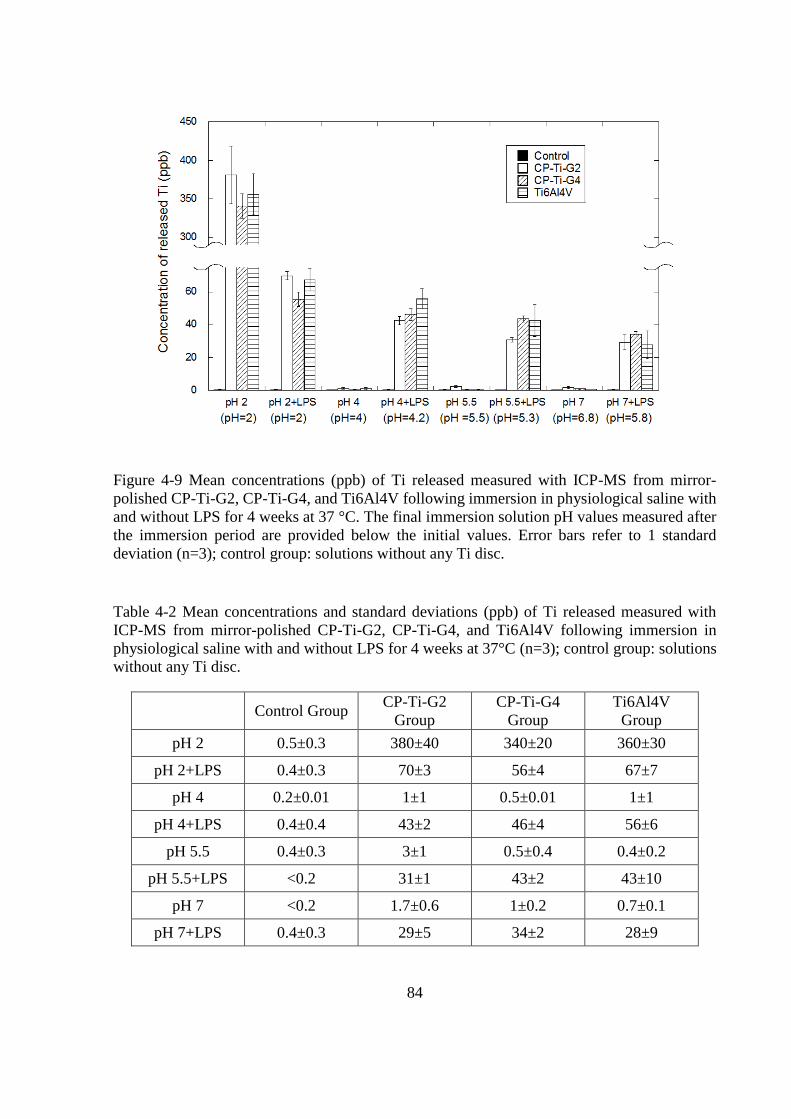
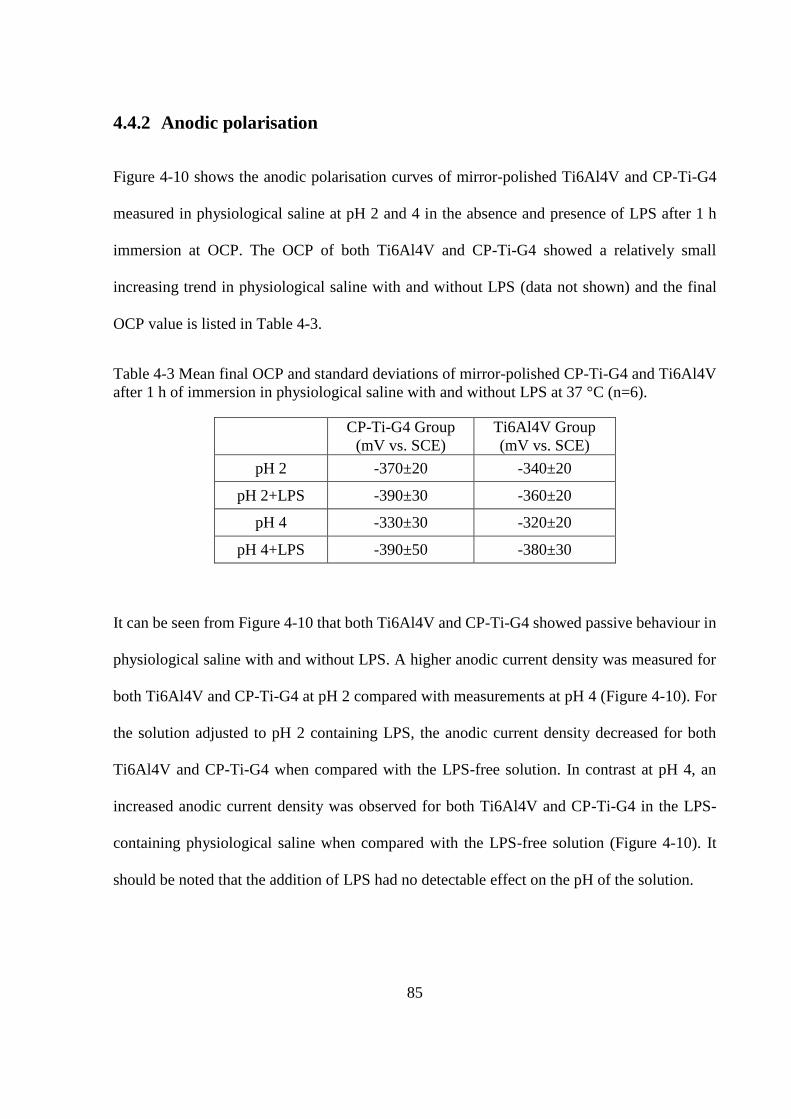
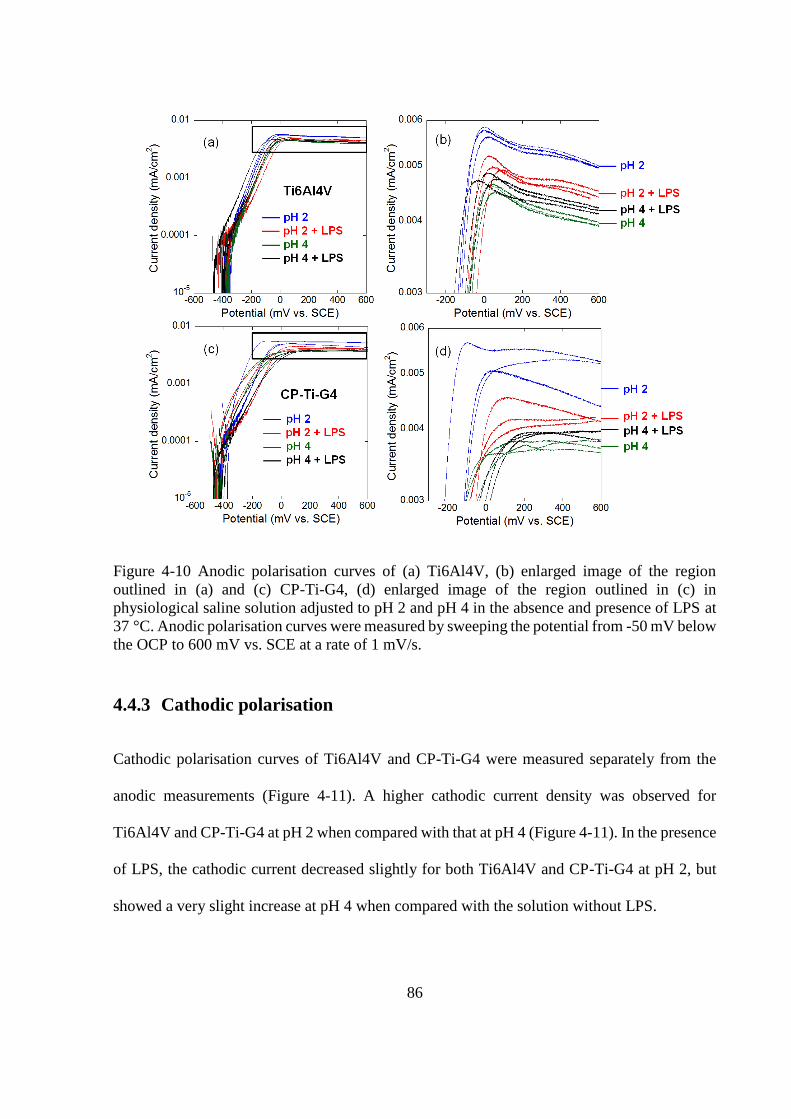
4.4.2 Anodic polarisation ............................................................................................ 85
4.4.3 Cathodic polarisation .......................................................................................... 86
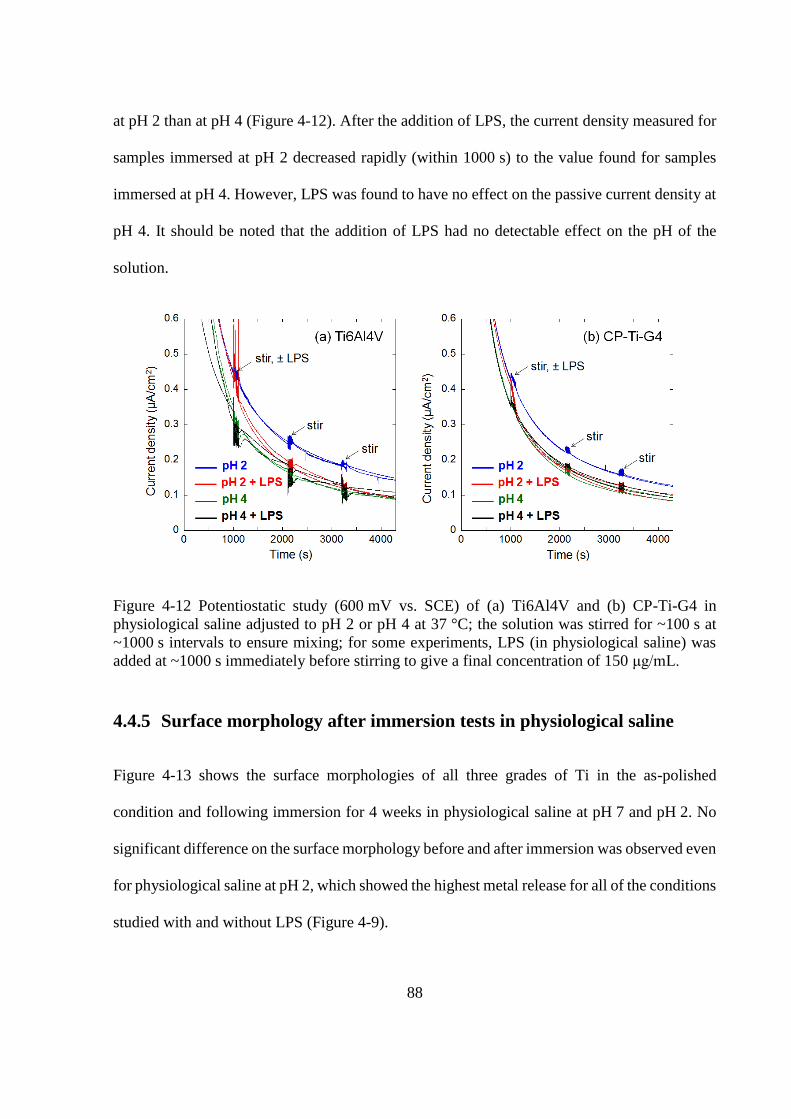
4.4.4 Potentiostatic study ............................................................................................. 87
4.4.5 Surface morphology after immersion tests in physiological saline .................... 88
4.5 Discussion .................................................................................................................. 89
4.5.1 Effect of HCl on Ti corrosion ............................................................................. 89
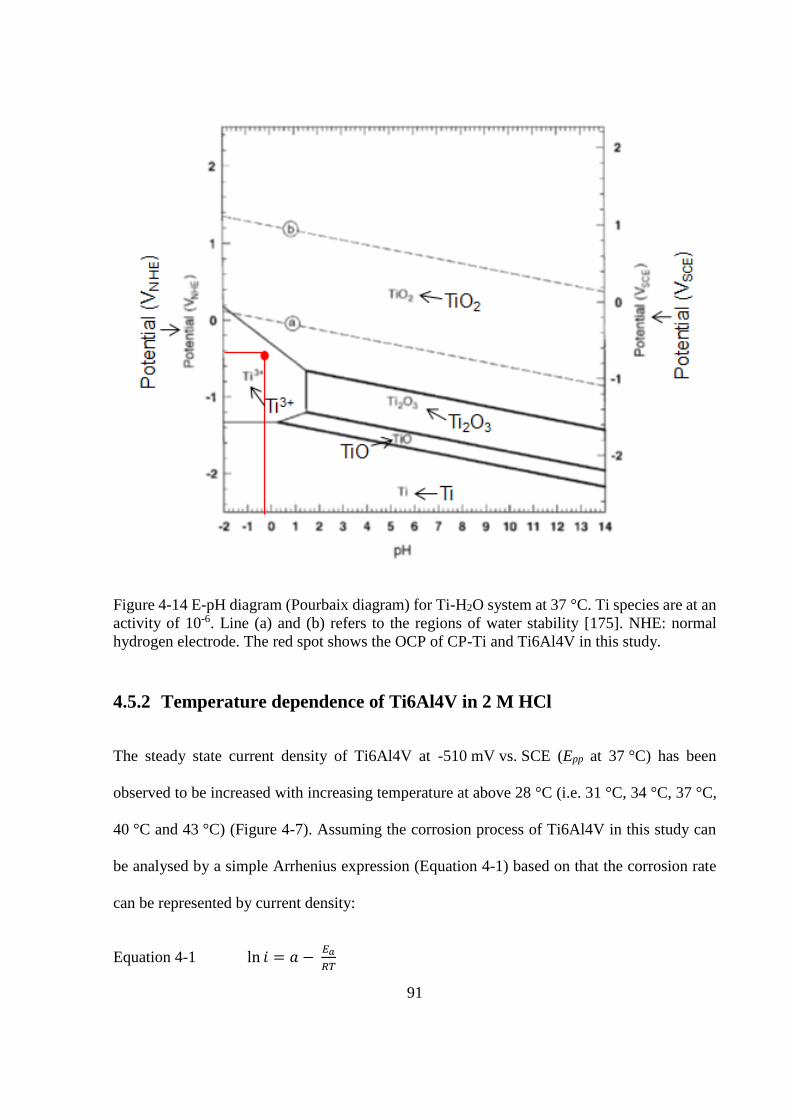
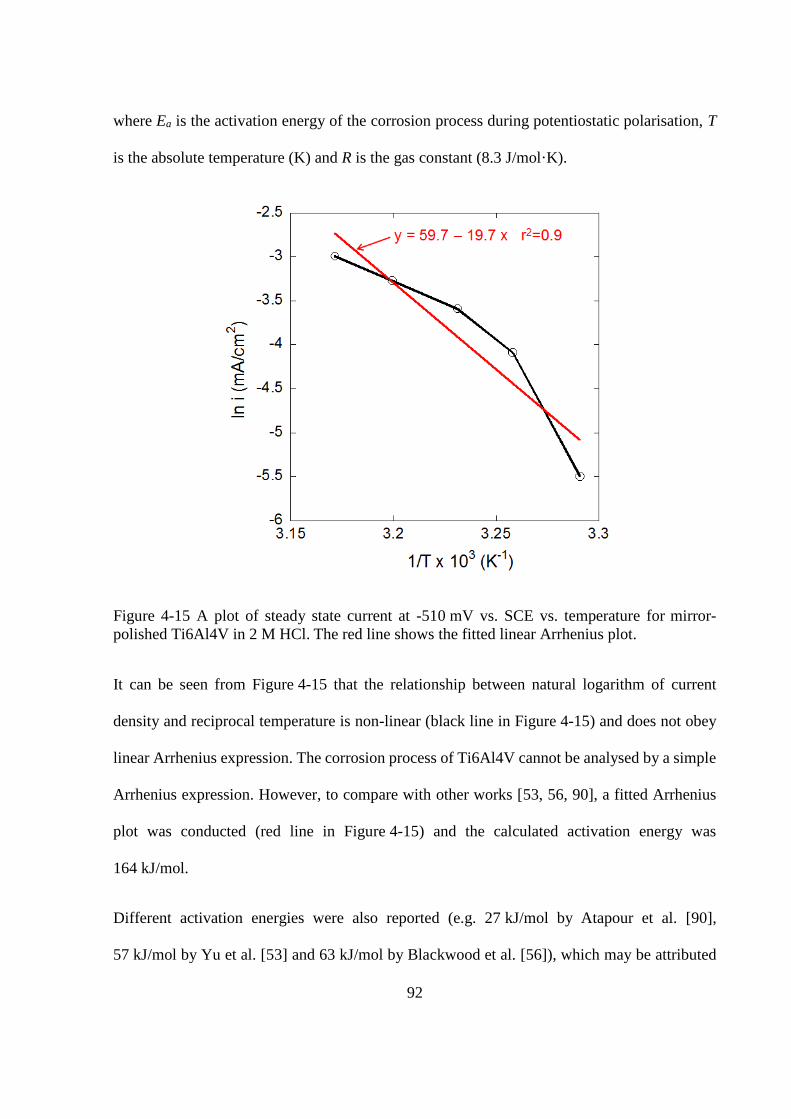
4.5.2 Temperature dependence of Ti6Al4V in 2 M HCl ............................................. 91
4.5.3 Surface morphology of Ti6Al4V after potentiostatic test in 2M HCl ................ 93
4.5.4 Effect of pH and LPS on Ti corrosion ................................................................ 94
4.6 Conclusions ................................................................................................................ 97
Page 10
5 EFFECT OF H2O2 AND ALBUMIN ON TI CORROSION ....................... 98
5.1 Introduction ................................................................................................................ 98
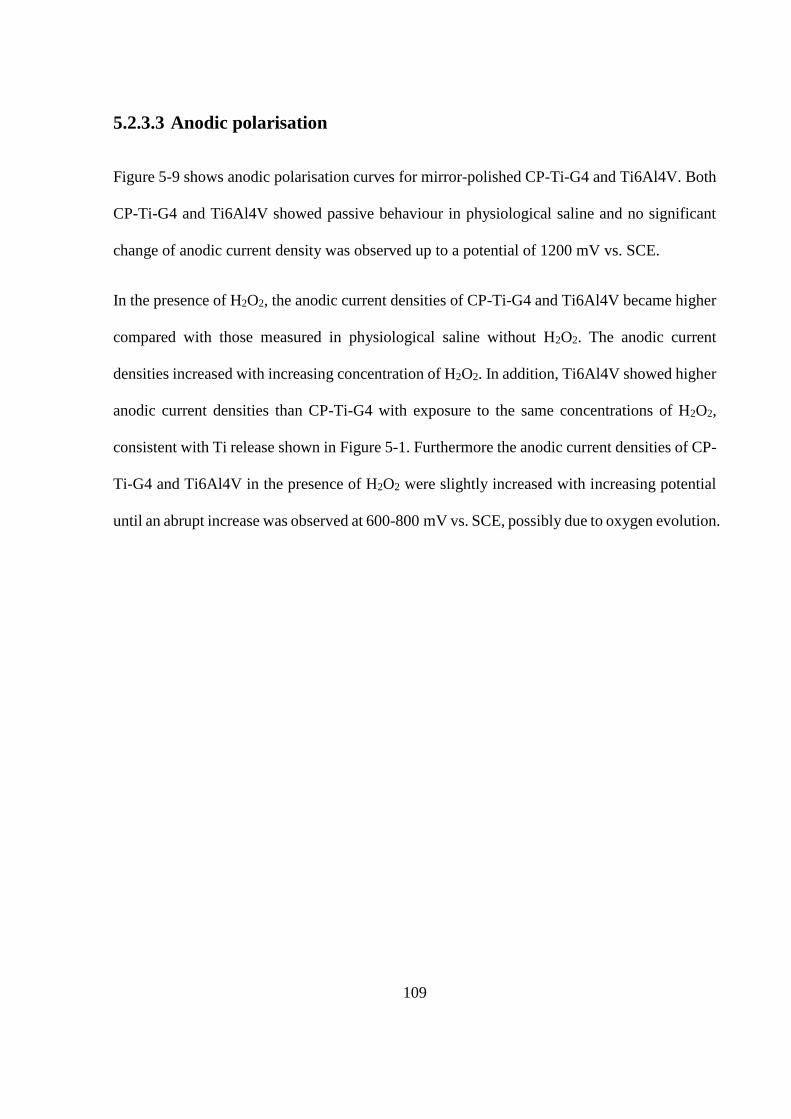
5.2 Effect of H2O2 on Ti corrosion .................................................................................. 98
5.2.1 Solution analysis ................................................................................................. 98
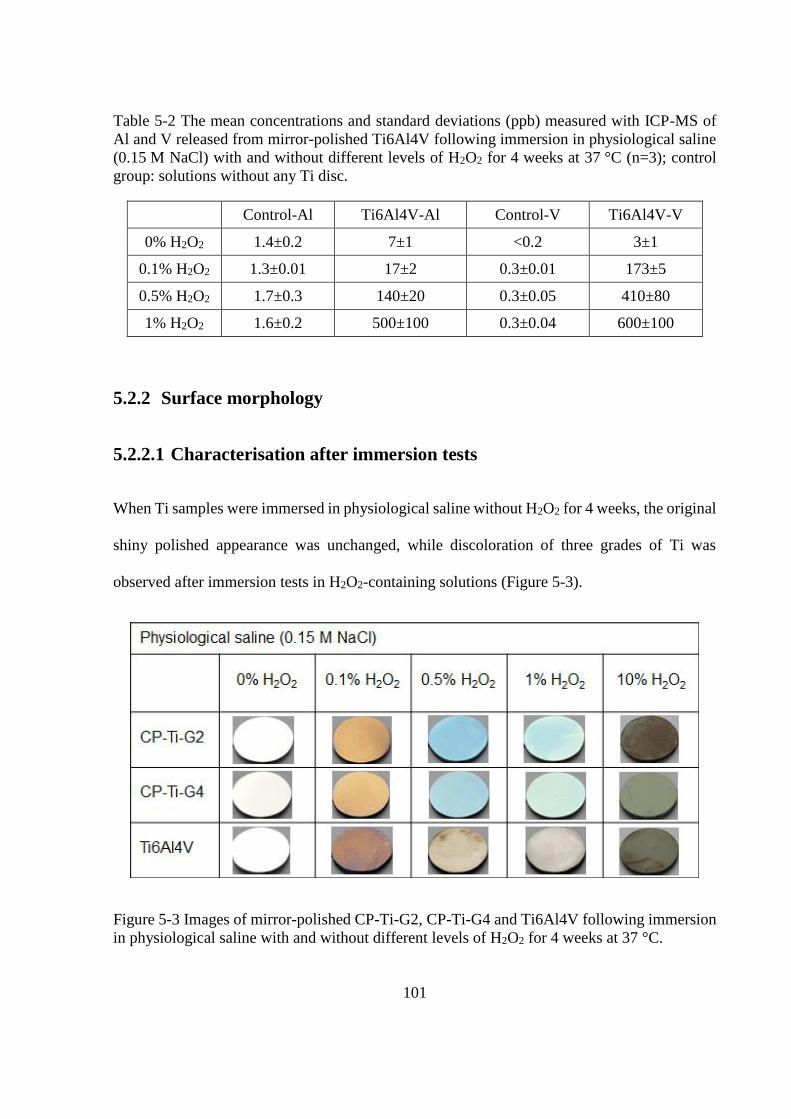
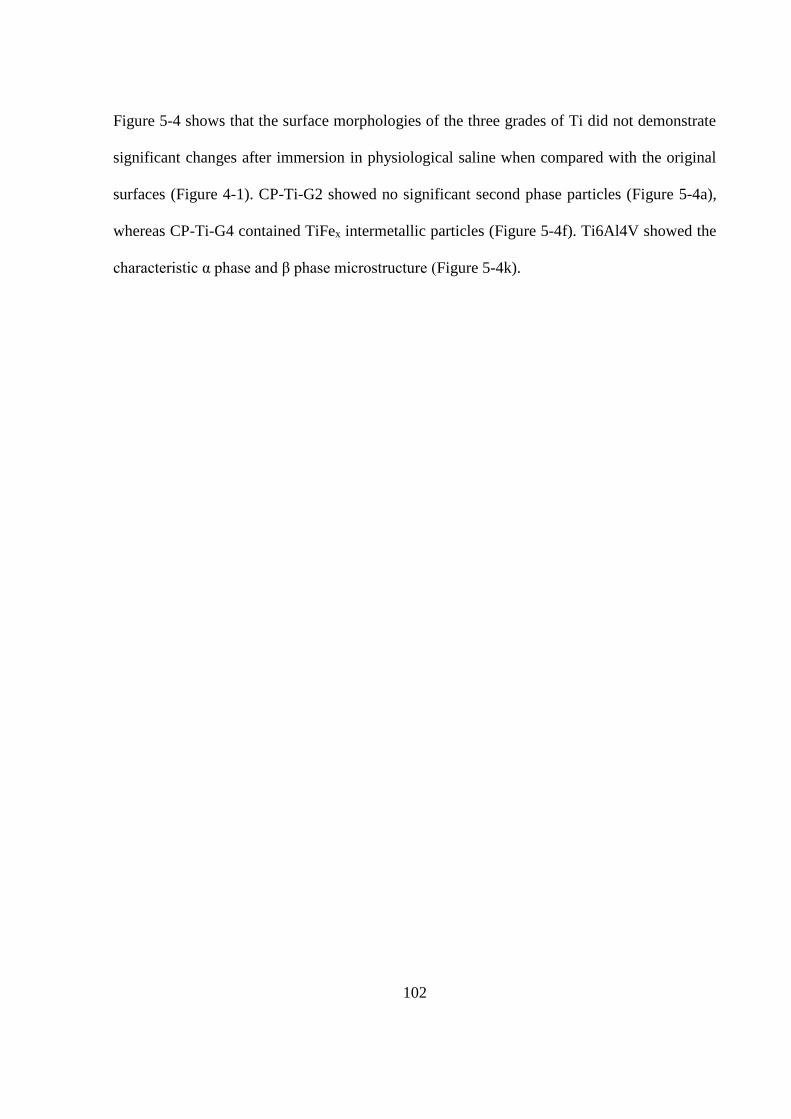
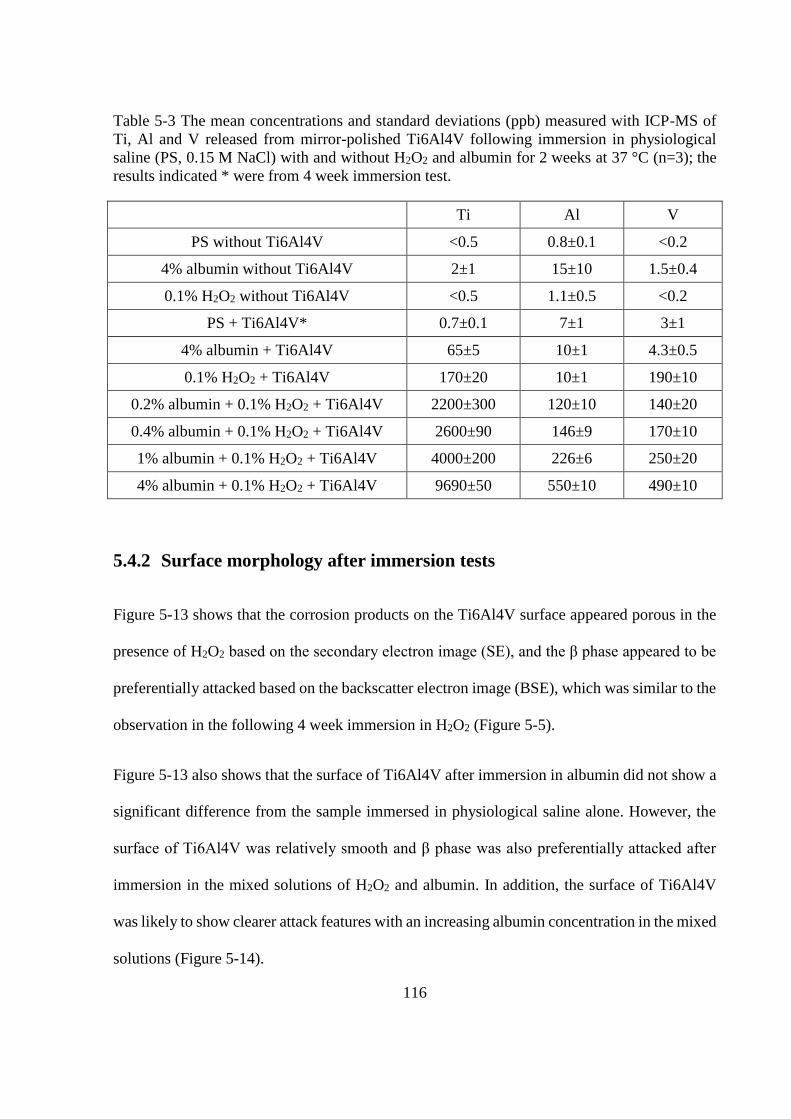
5.2.2 Surface morphology ......................................................................................... 101
5.2.2.1 Characterisation after immersion tests .......................................................... 101
5.2.2.2 Characterisation after potentiostatic tests ..................................................... 105
5.2.3 Electrochemical tests ........................................................................................ 106
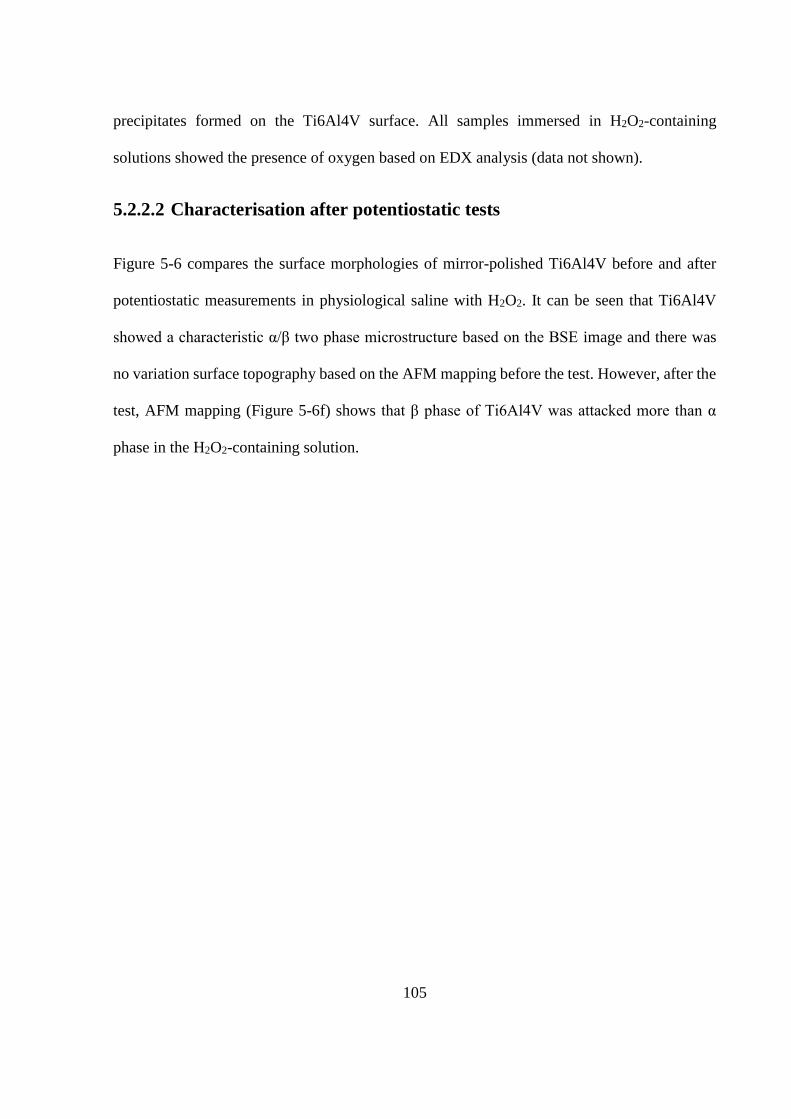
5.2.3.1 OCP behaviour .............................................................................................. 106
5.2.3.2 Cathodic polarisation .................................................................................... 108
5.2.3.3 Anodic polarisation ....................................................................................... 109
5.3 Effect of albumin on corrosion of Ti6Al4V ............................................................ 111
5.3.1 Electrochemical tests ........................................................................................ 111
5.3.1.1 OCP behaviour .............................................................................................. 111
5.3.1.2 Anodic and cathodic polarisation.................................................................. 112
5.4 Effect of the combination of H2O2 and albumin on corrosion of Ti6Al4V ............. 114
5.4.1 Solution analysis ............................................................................................... 114
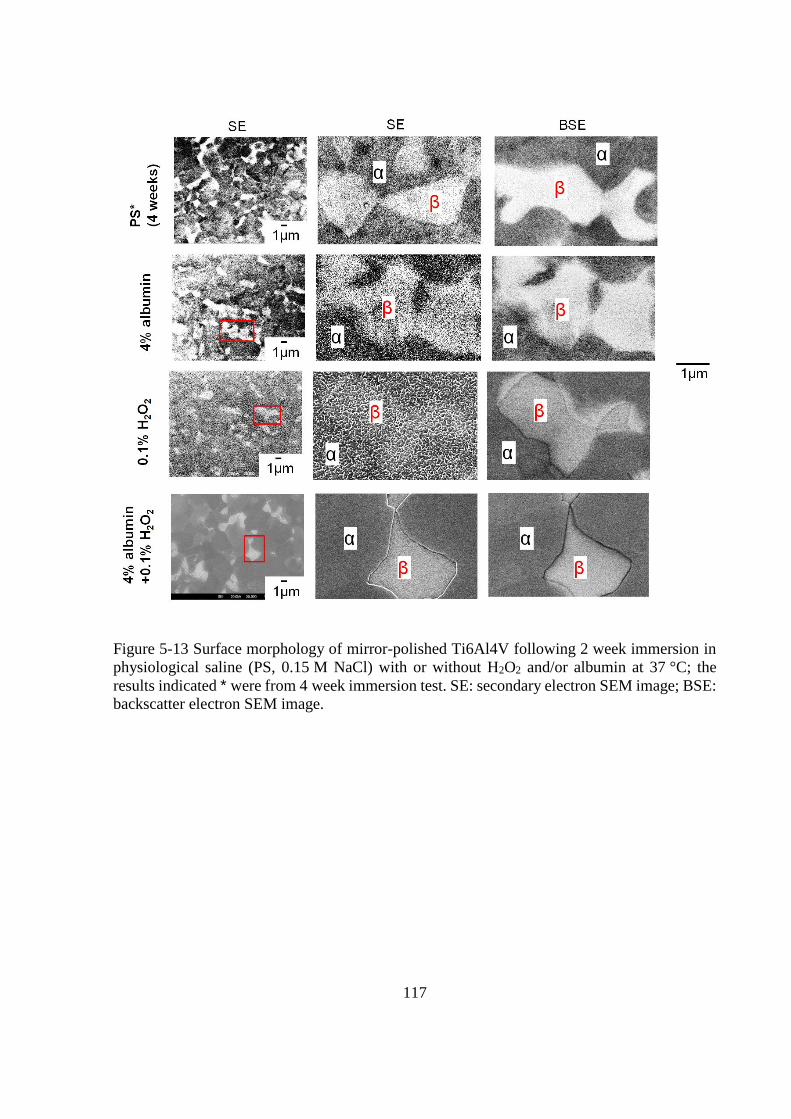
5.4.2 Surface morphology after immersion tests ....................................................... 116
5.4.3 Electrochemical tests ........................................................................................ 119
5.4.3.1 OCP behaviour .............................................................................................. 119
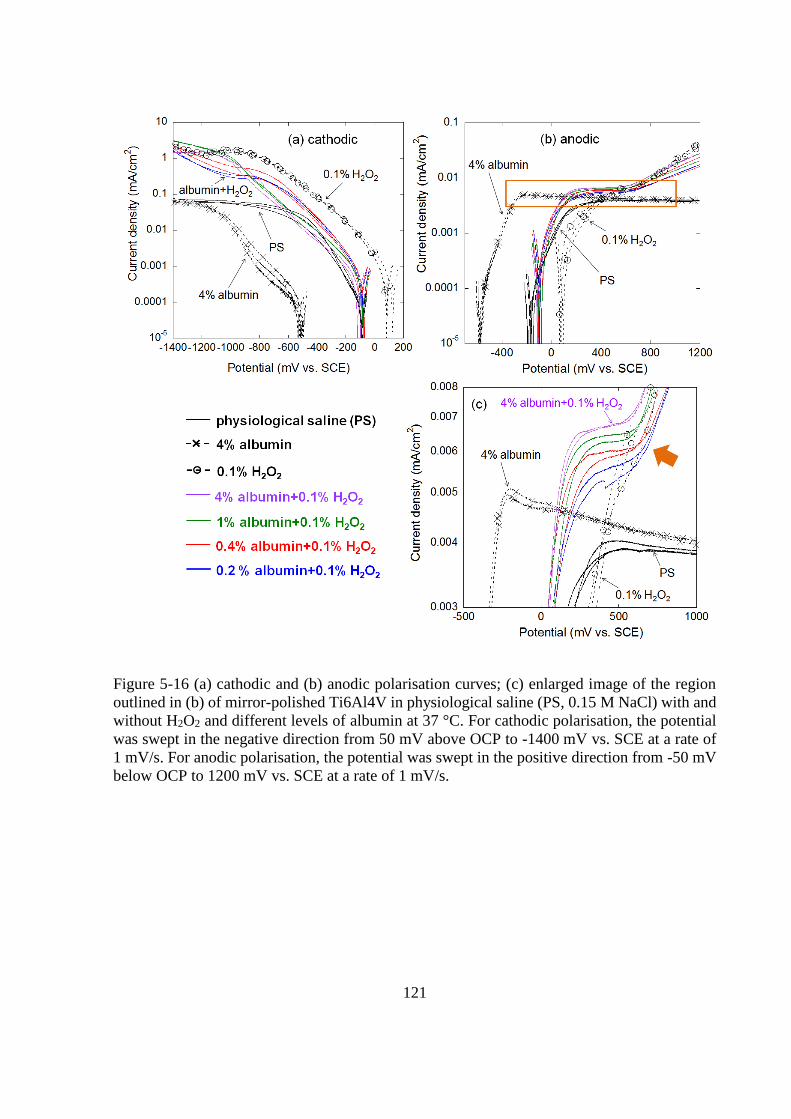
5.4.3.2 Anodic and cathodic polarisation.................................................................. 120
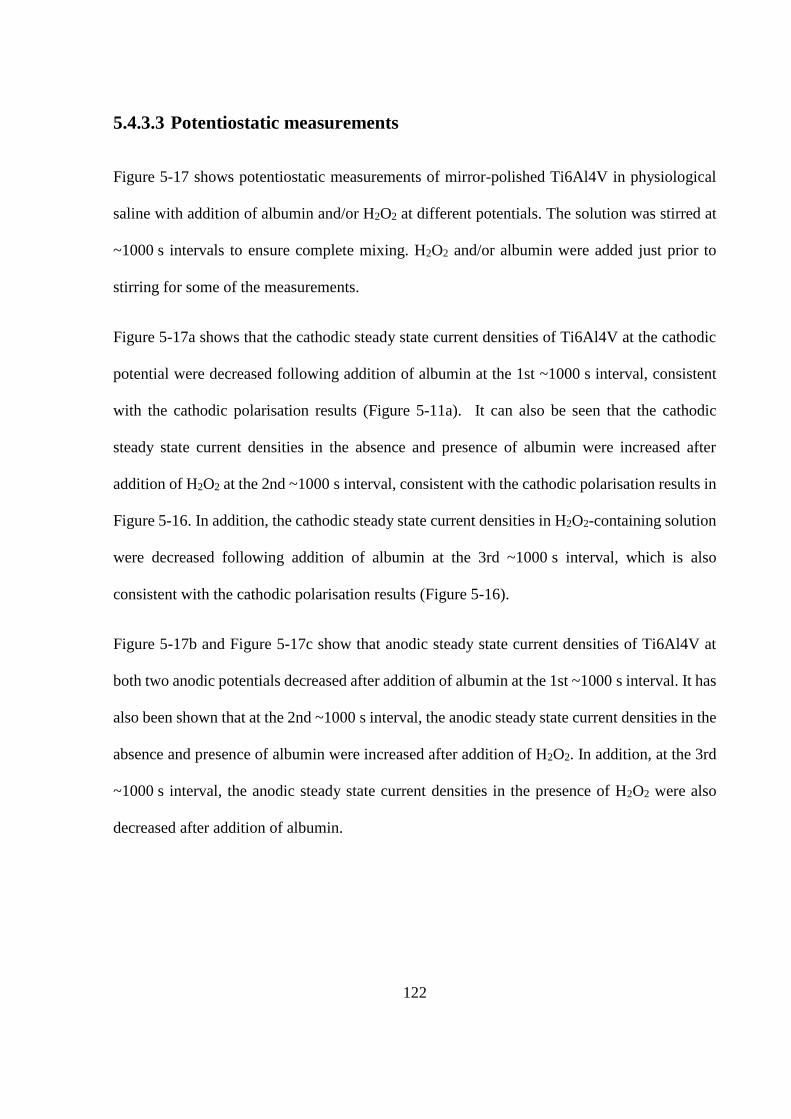
5.4.3.3 Potentiostatic measurements ......................................................................... 122
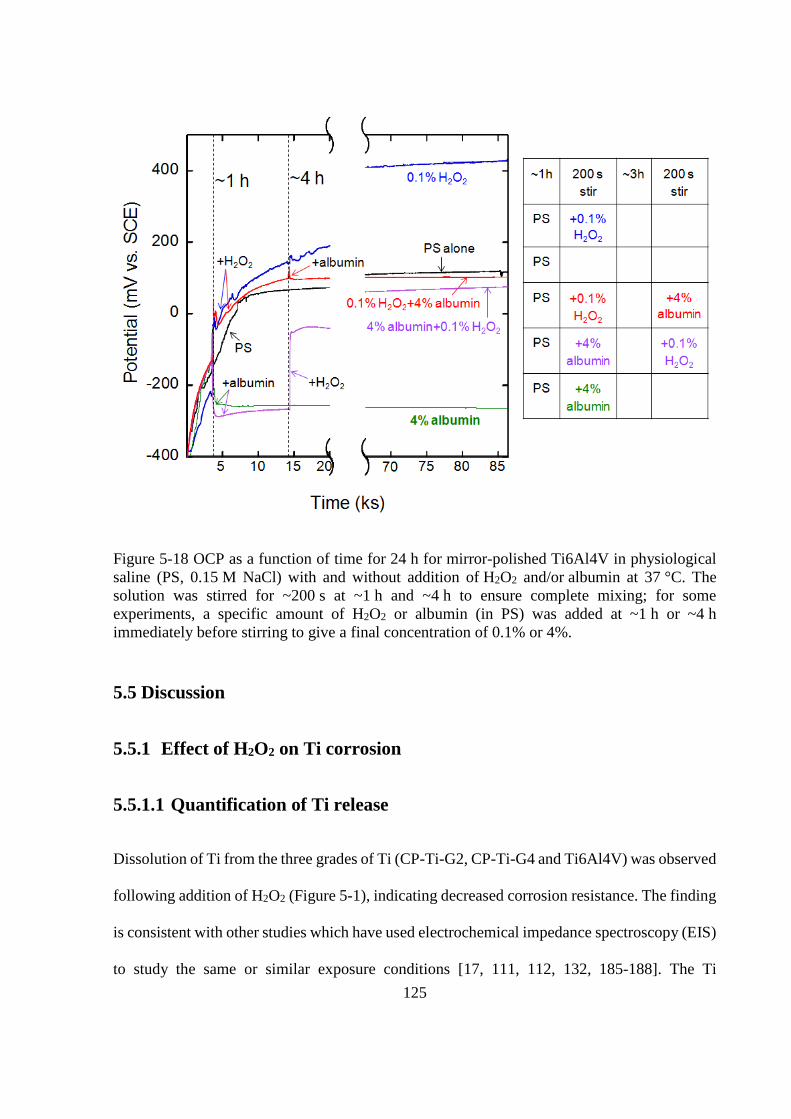
5.4.4 Long-time (24 h) OCP behaviour ..................................................................... 124
5.5 Discussion ................................................................................................................ 125
5.5.1 Effect of H2O2 on Ti corrosion ......................................................................... 125
Page 11
5.5.1.1 Quantification of Ti release .......................................................................... 125
5.5.1.2 Electrochemistry of Ti corrosion .................................................................. 126
5.5.2 Effect of albumin on corrosion of Ti6Al4V ..................................................... 127
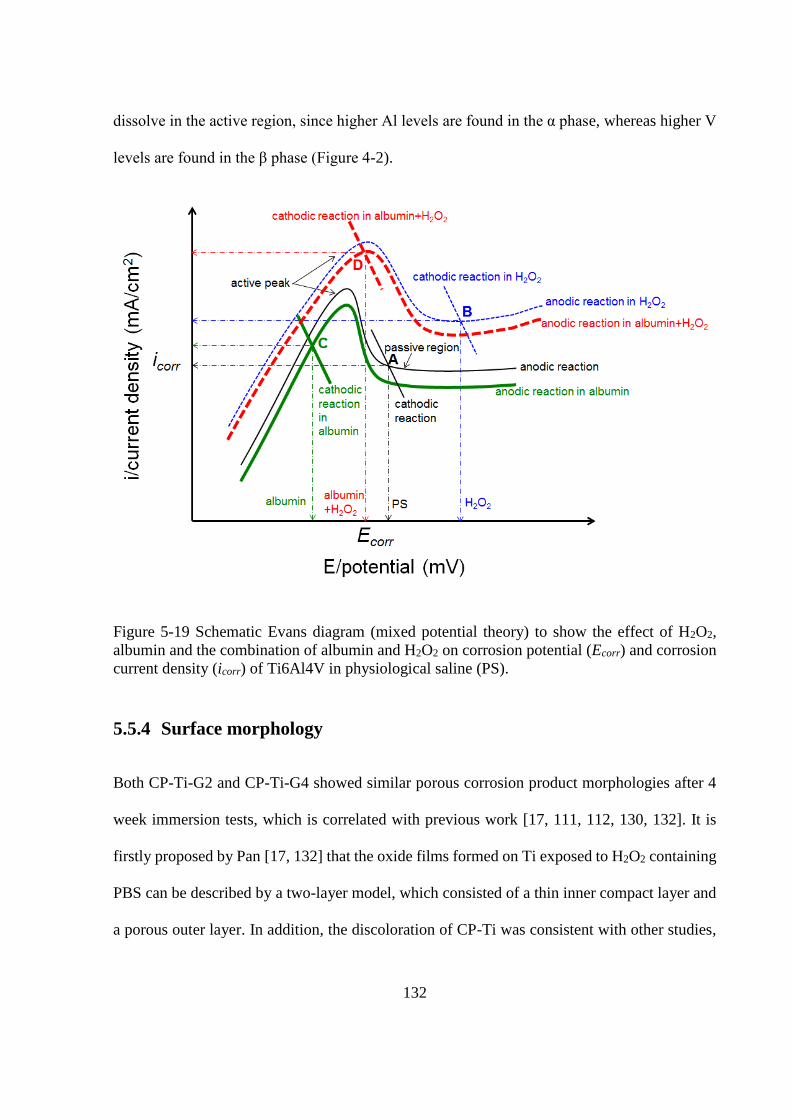
5.5.3 Effect of the combination of albumin and H2O2 on corrosion of Ti6Al4V ...... 129
5.5.4 Surface morphology ......................................................................................... 132
5.6 Conclusions .............................................................................................................. 134
6 CELLULAR EFFECTS ON TI CORROSION .......................................... 136
6.1 Introduction .............................................................................................................. 136
6.2 Effect of S. sanguinis on Ti corrosion in artificial saliva ........................................ 137
6.2.1 Surface morphologies of Ti samples ................................................................ 137
6.2.2 Quantification of Ti release in artificial saliva ................................................. 139
6.3 Discussion - effect of S. sanguinis on Ti corrosion ................................................. 141
6.4 Effect of neutrophils on Ti corrosion ....................................................................... 145
6.4.1 Surface morphology ......................................................................................... 145
6.4.2 Quantification of Ti release .............................................................................. 147
6.5 Discussion - effect of neutrophils on Ti corrosion .................................................. 150
6.6 Conclusions .............................................................................................................. 153
7 MECHANICALLY-ASSISTED CREVICE CORROSION OF TI ........... 154
7.1 Introduction .............................................................................................................. 154
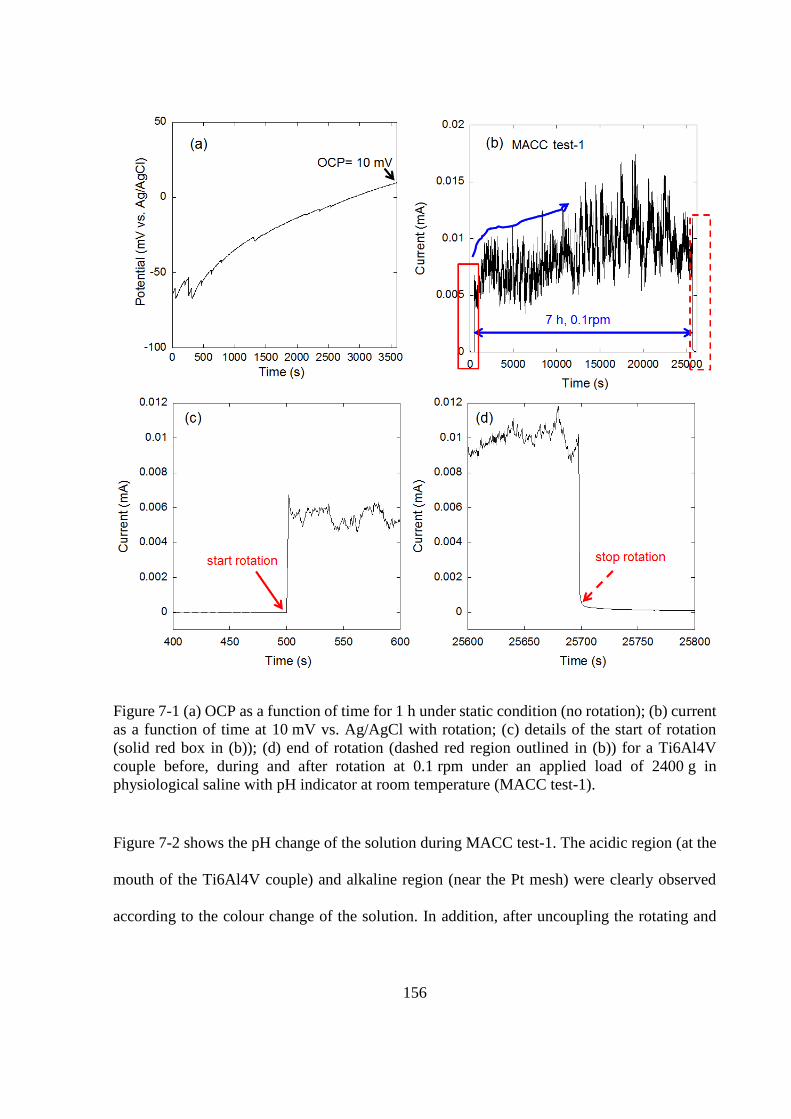
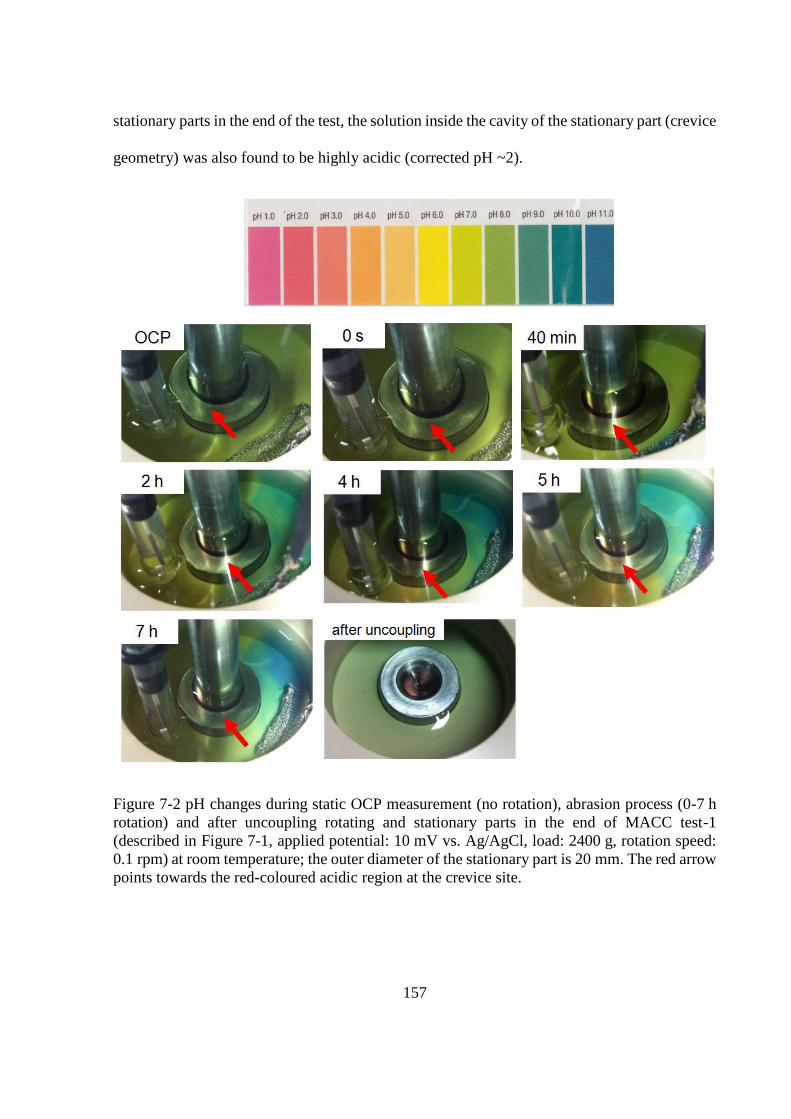
7.2 Results ...................................................................................................................... 155
7.2.1 MACC apparatus with designed crevice geometry .......................................... 155
7.2.2 Surface morphology ......................................................................................... 160
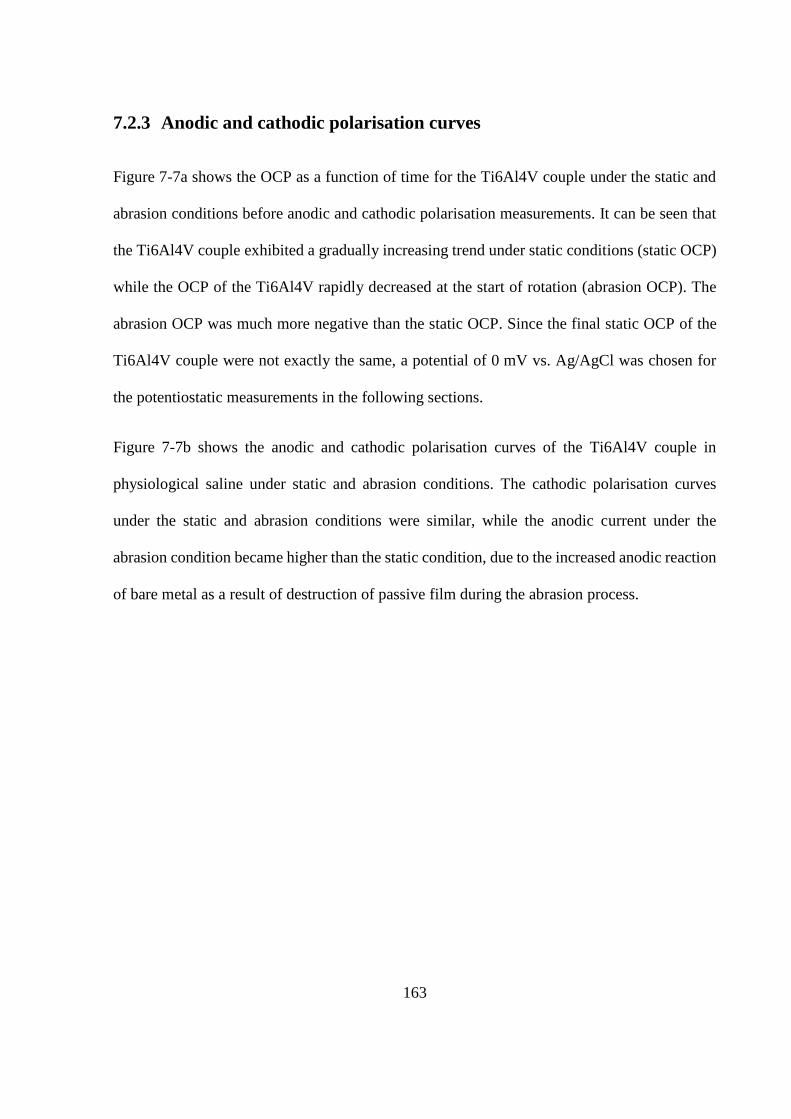
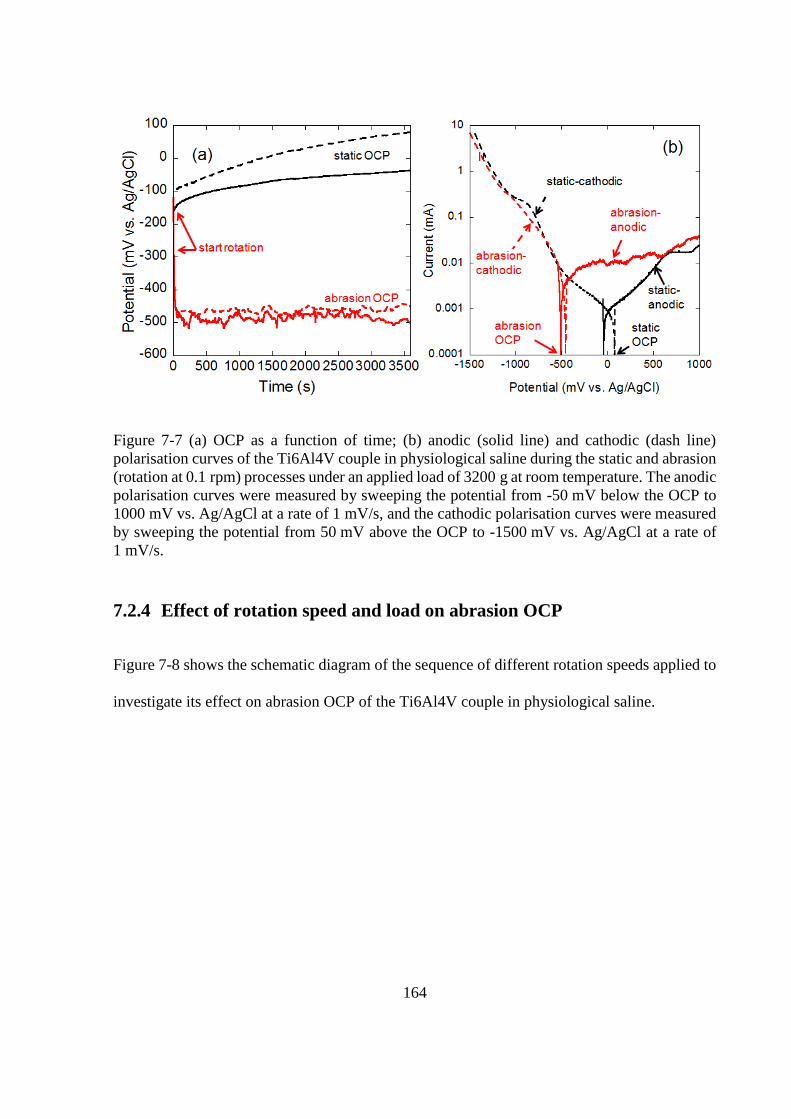
7.2.3 Anodic and cathodic polarisation curves .......................................................... 163
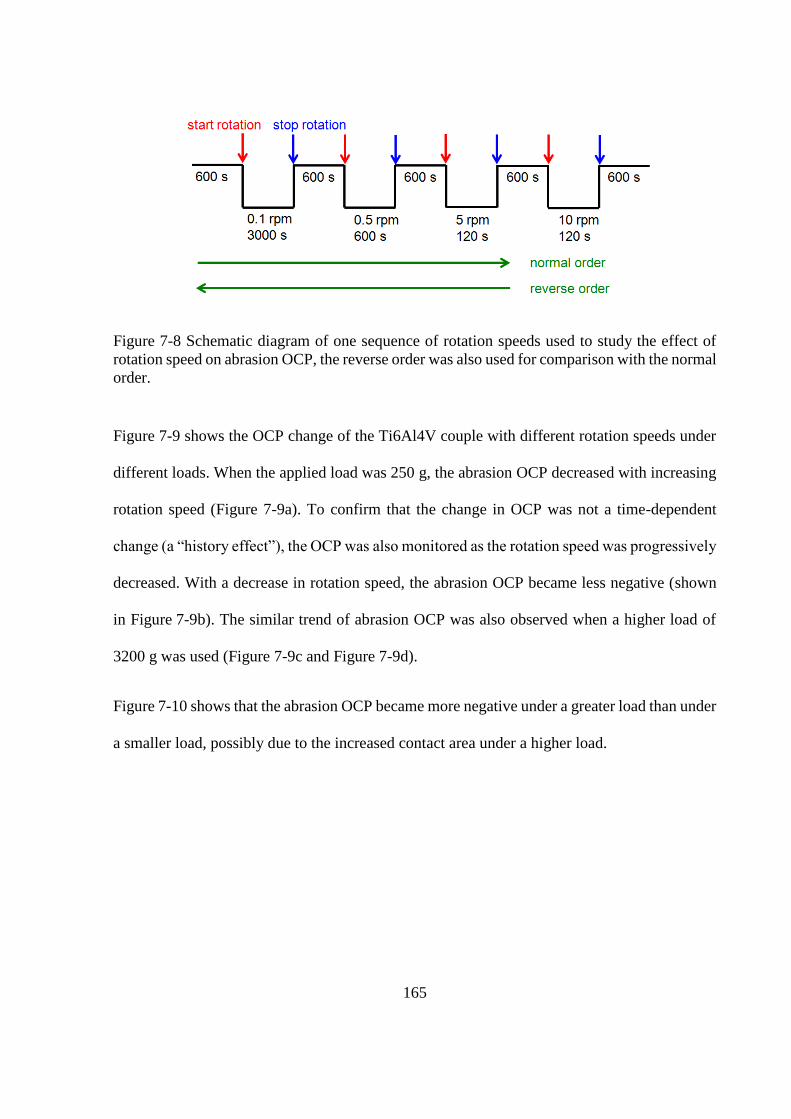
7.2.4 Effect of rotation speed and load on abrasion OCP ......................................... 164
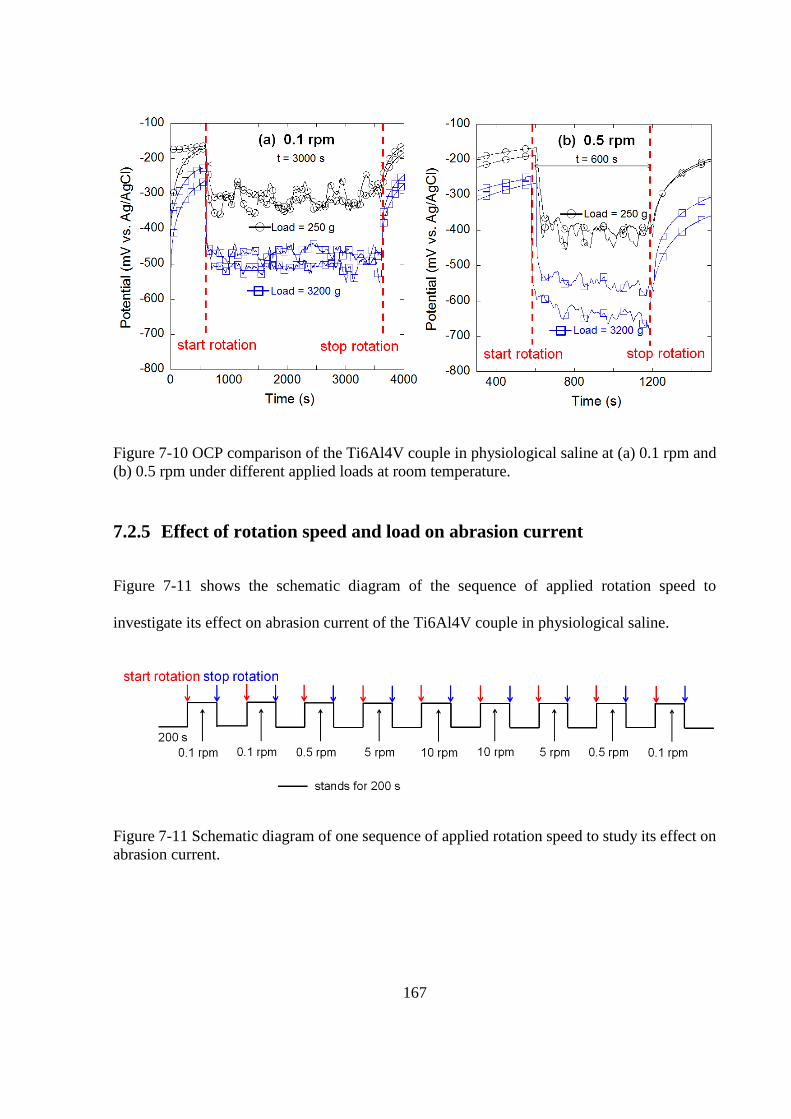
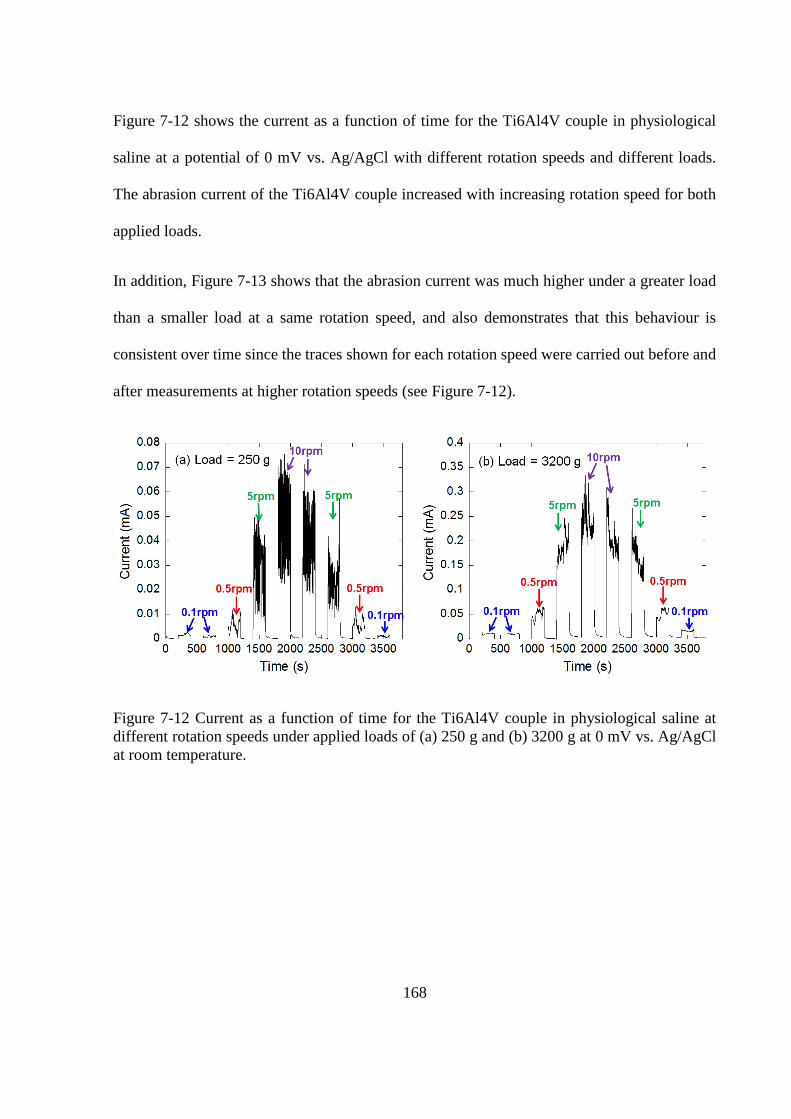
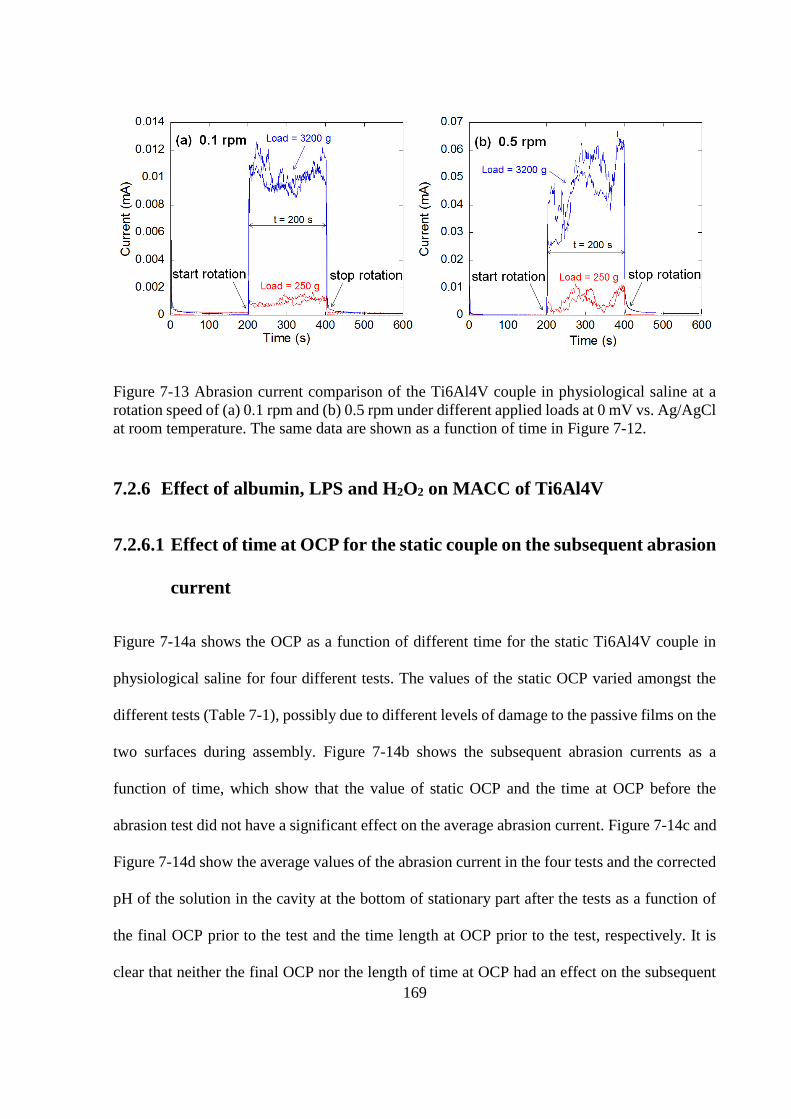
7.2.5 Effect of rotation speed and load on abrasion current ...................................... 167
Page 12
7.2.6 Effect of albumin, LPS and H2O2 on MACC of Ti6Al4V ............................... 169
7.2.6.1 Effect of time at OCP for the static couple on the subsequent abrasion current
……………………………………………………………………………...169
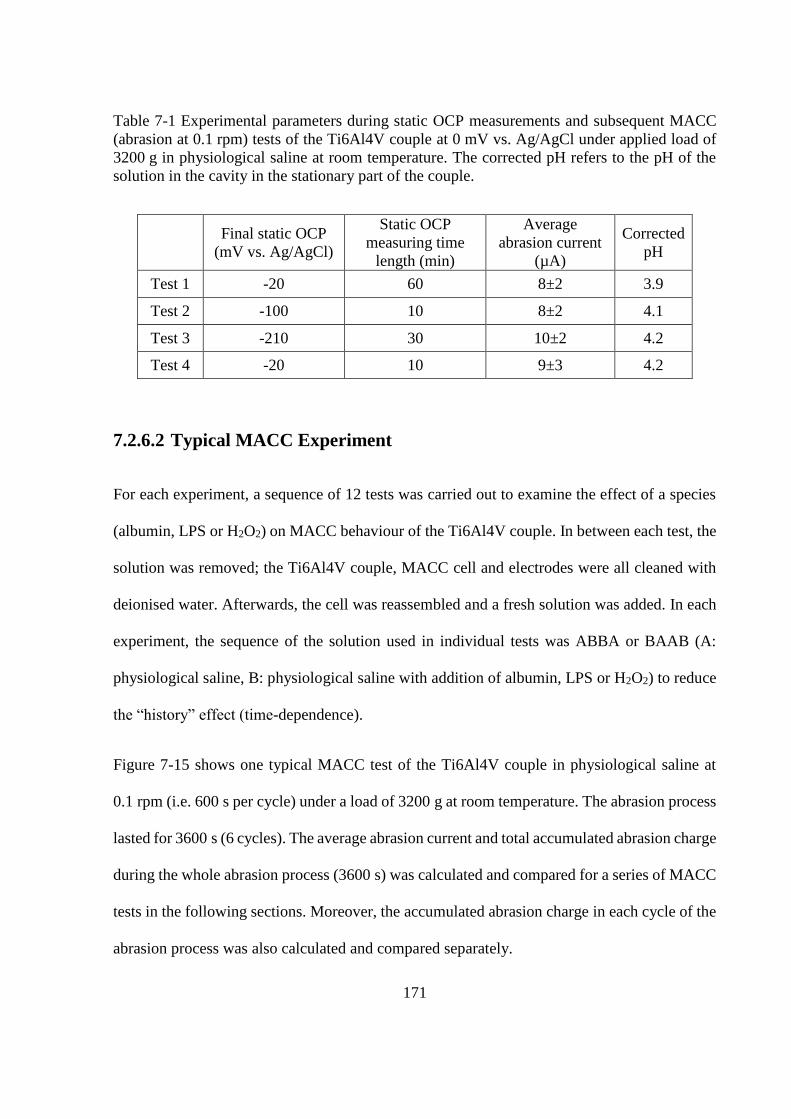
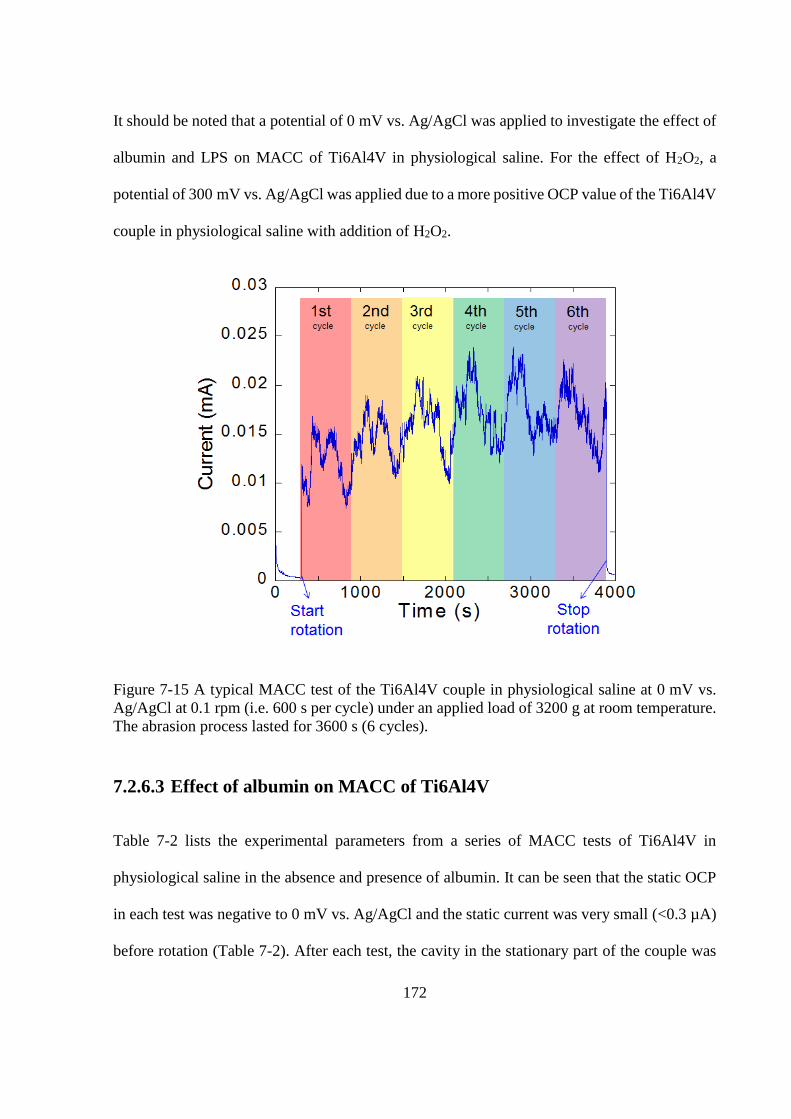
7.2.6.2 Typical MACC Experiment .......................................................................... 171
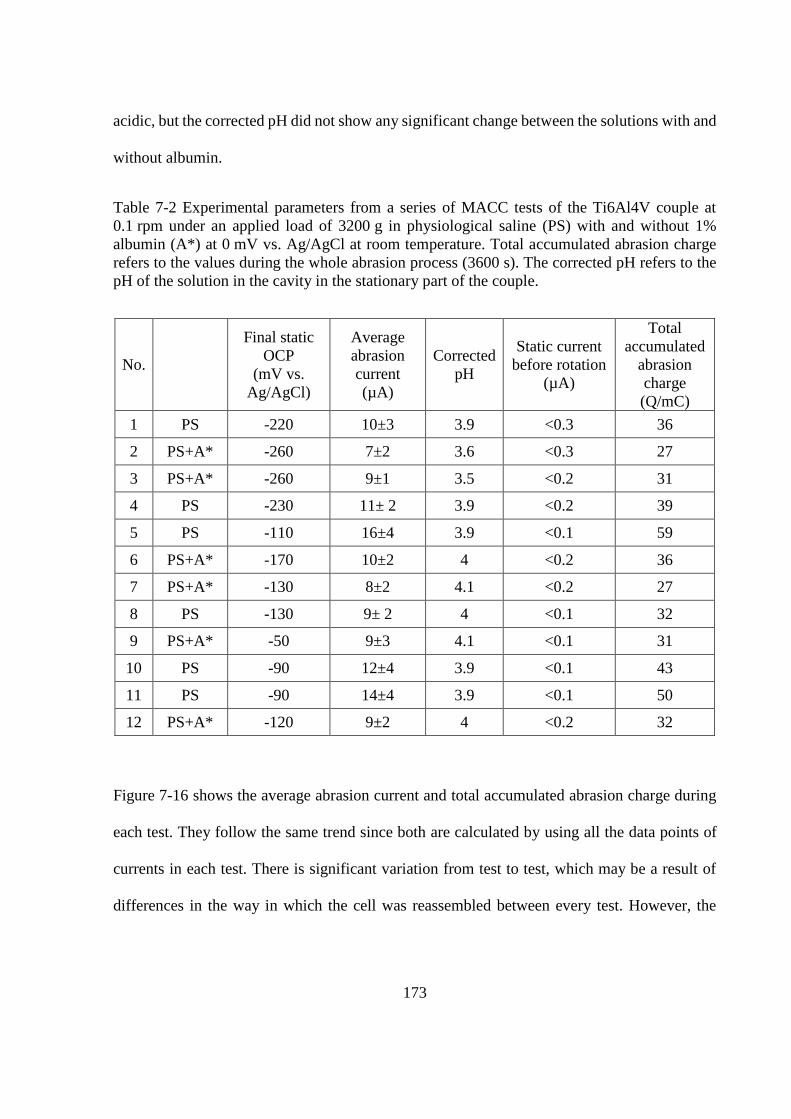
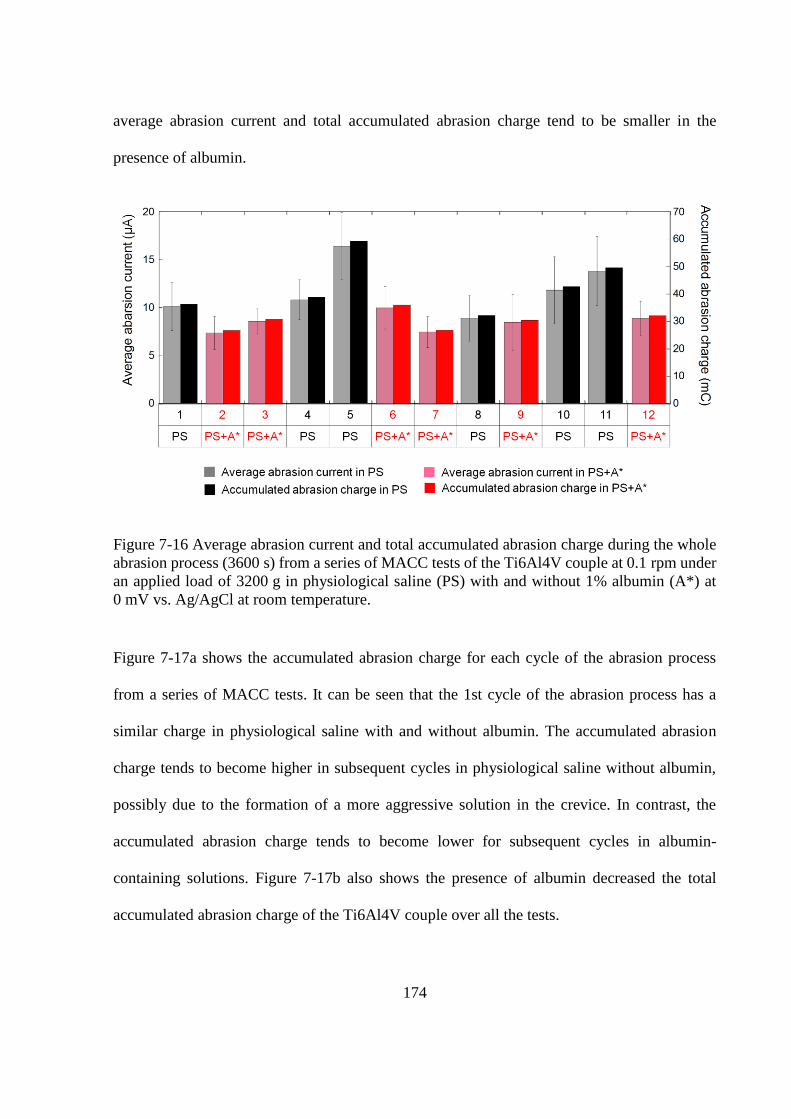
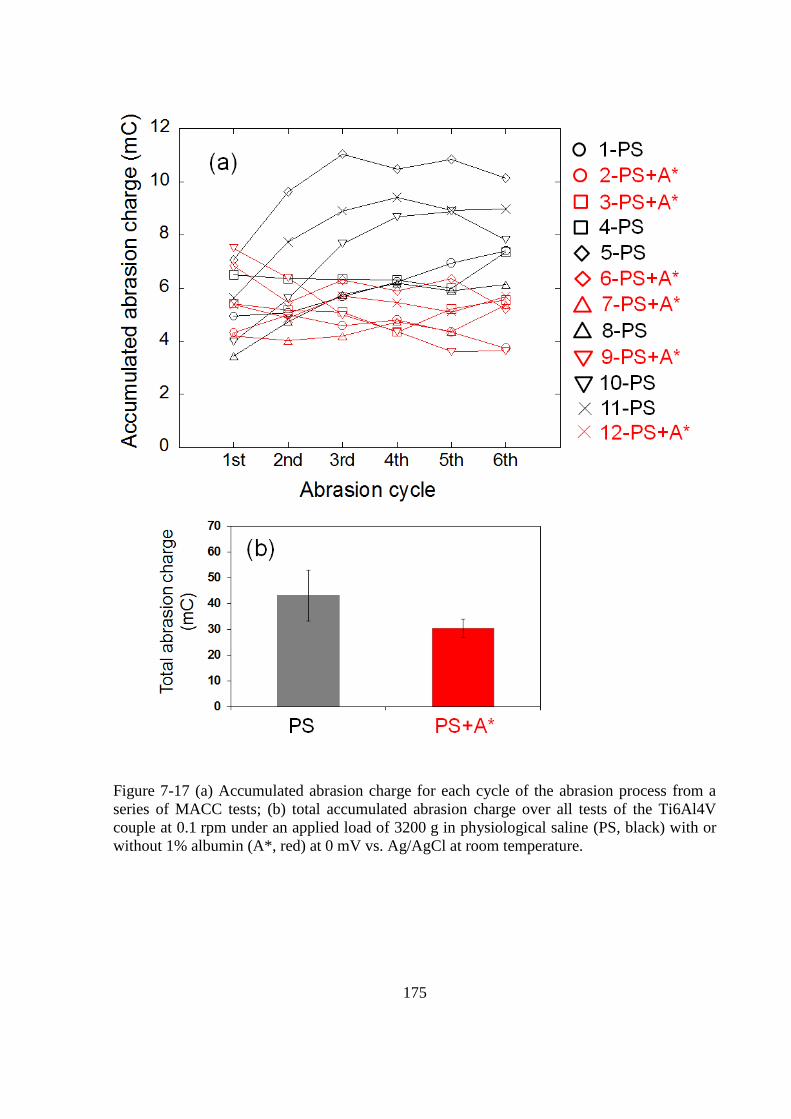
7.2.6.3 Effect of albumin on MACC of Ti6Al4V ..................................................... 172
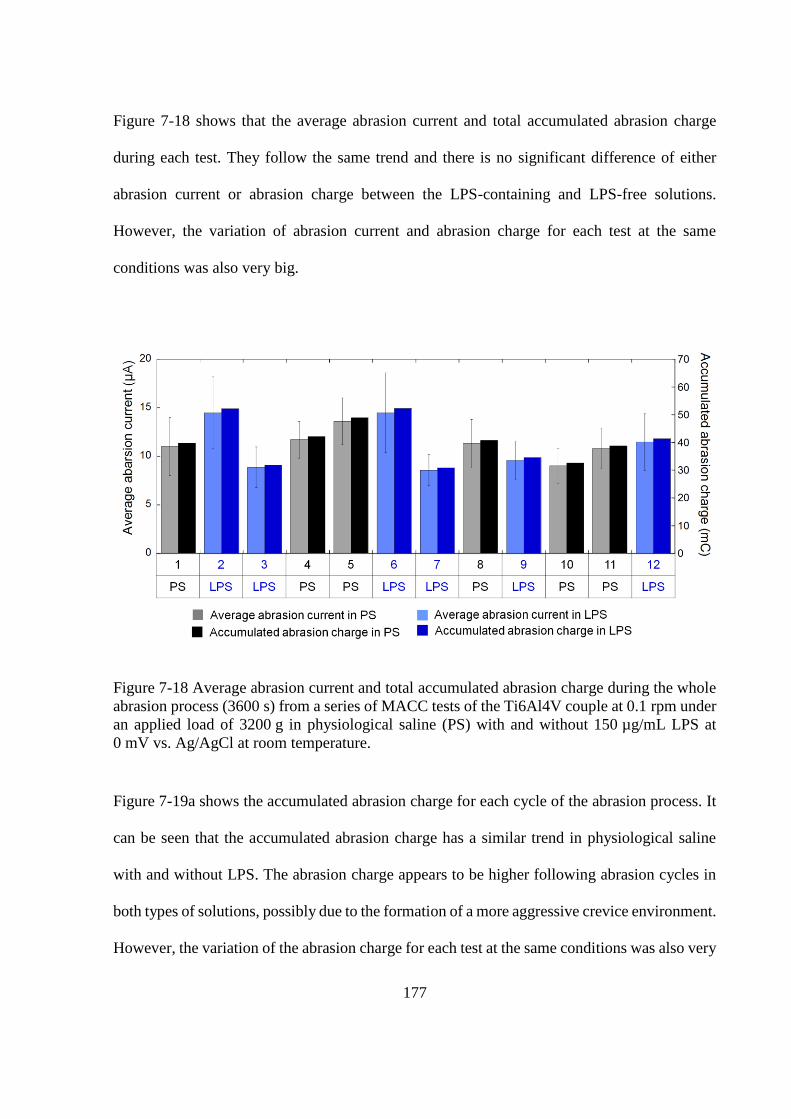
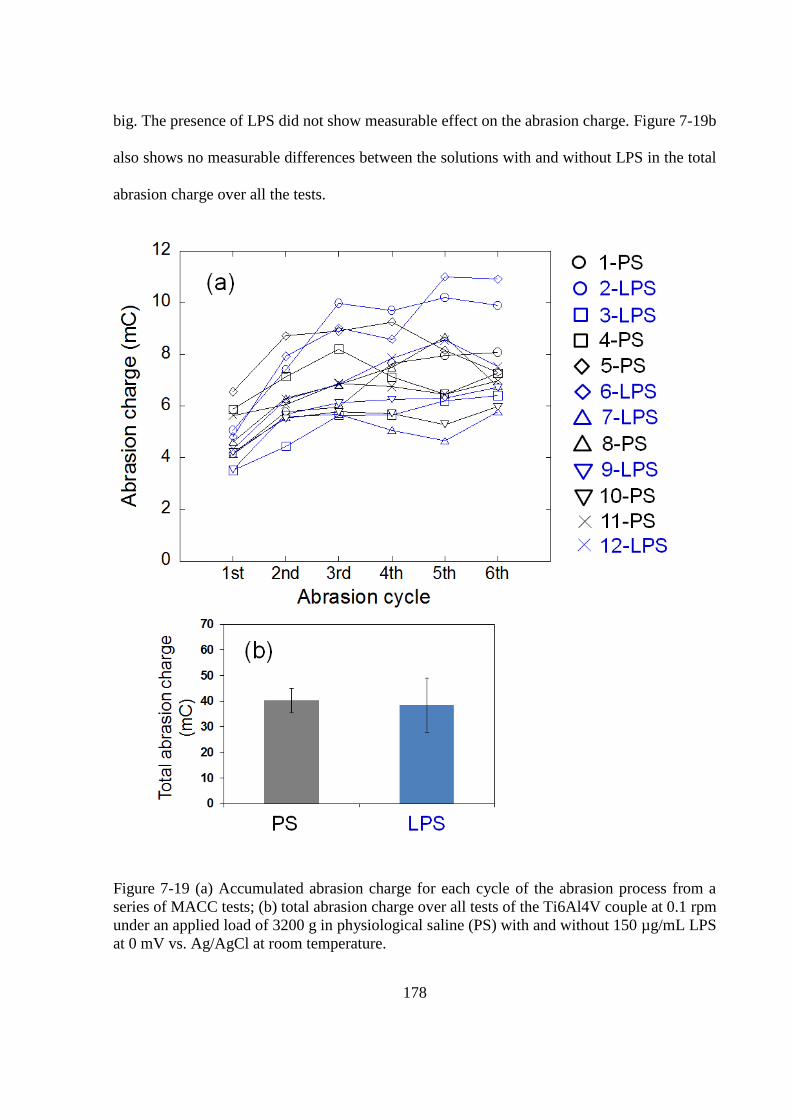
7.2.6.4 Effect of LPS on MACC of Ti6Al4V ........................................................... 176
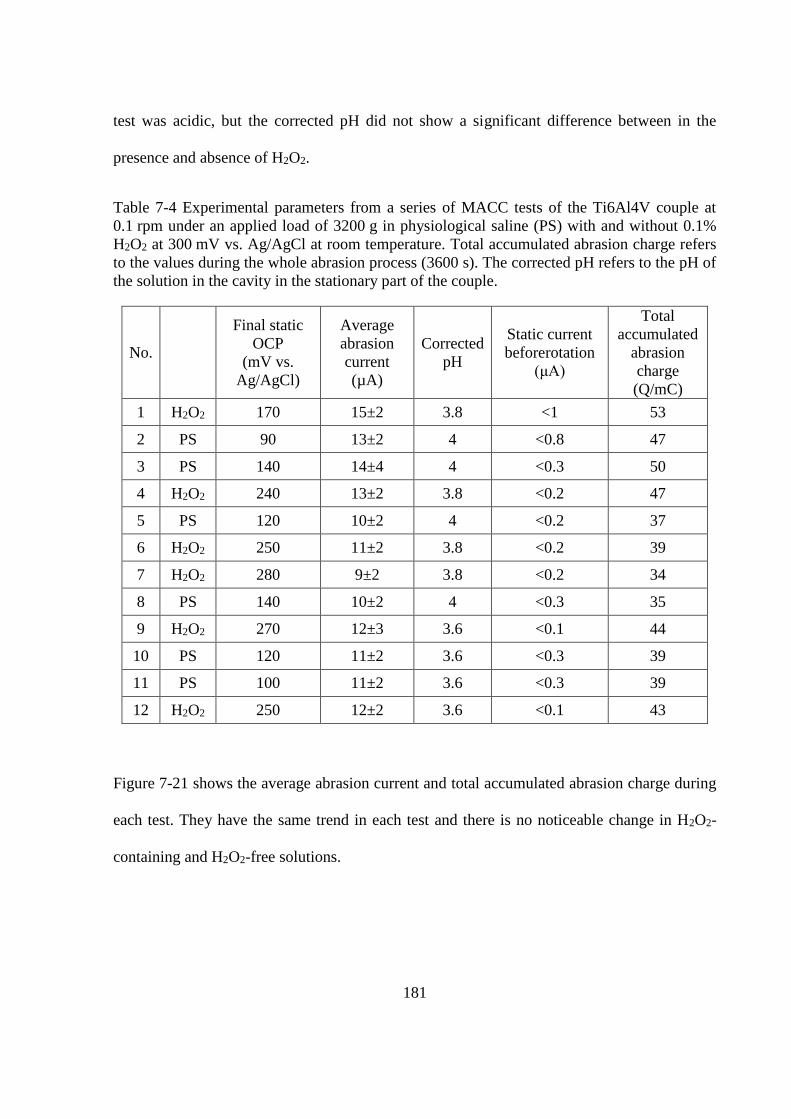
7.2.6.5 Effect of H2O2 on MACC of Ti6Al4V ......................................................... 179
7.3 Discussion ................................................................................................................ 184
7.3.1 MACC apparatus .............................................................................................. 184
7.3.2 Abrasion scars and debris ................................................................................. 186
7.3.3 Effect of rotation speed and load on MACC of Ti6Al4V ................................ 188
7.3.4 Effect of albumin, LPS and H2O2 on abrasion charge ...................................... 188
7.3.4.1 Effect of albumin on abrasion charge ........................................................... 188
7.3.4.2 Effect of LPS and H2O2 on abrasion charge ................................................. 190
7.4 Conclusions .............................................................................................................. 190
8 GENERAL DISCUSSION AND FUTURE WORK .................................. 192
8.1 General discussion ................................................................................................... 192
8.1.1 Introduction ...................................................................................................... 192
8.1.2 Effect of bacteria and bacterial products on Ti corrosion ................................ 192
8.1.3 Effect on inflammation cells and chemical species on Ti corrosion ................ 194
8.1.4 Effect of presence of albumin and H2O2 on Ti corrosion ................................. 195
8.1.5 MACC .............................................................................................................. 196
8.2 Future work .............................................................................................................. 197
8.2.1 Effect of combination of albumin and H2O2 on Ti corrosion ........................... 197
8.2.2 Effect of cells on Ti corrosion .......................................................................... 198
8.2.3 Further studies on MACC ................................................................................ 198
Page 13
8.2.4 Summary: the need for improved simulation of the peri-implant environment for
future corrosion tests ....................................................................................................... 199
9 CONCLUSIONS ......................................................................................... 201
10 REFERENCES ........................................................................................... 203
Page 14
LIST OF SYMBOLS AND DEFINITIONS
Symbol Definition
CP-Ti Commercially pure Ti
CP-Ti-G2 Commercial purity ASTM Grade 2 Ti
CP-Ti-G4 Commercial purity ASTM Grade 4 Ti
Ti6Al4V ASTM Grade 5 Ti
Ti6Al4V-ELI ASTM Ti Grade 23, ELI: Extra low interstitial
BAHA Bone-anchored hearing aids
MACC Mechanically-assisted crevice corrosion
ICP-MS Inductively coupled plasma mass spectrometry
SLA Sandblasted-acid-etched
G2P Mirror-polished CP-Ti-G2
G4P Mirror-polished CP-Ti-G4
G5P Mirror-polished Ti6Al4V
G2S Sandblasted-acid-etched CP-Ti-G2
G4S Sandblasted-acid-etched CP-Ti-G4
G5S Sandblasted-acid-etched Ti6Al4V
E Potential
Epp Primary passivation potential
icrit Critical anodic current density
ipass Passive current density
Ecorr Corrosion potential
icorr Corrosion current
OCP Open circuit potential
CE Counter electrode
RE Reference electrode
WE Working electrode
ACM Potentiostat (ACM Instruments, UK)
SCE Saturated calomel electrode
NHE Normal hydrogen electrode
EIS Electrochemical impedance spectroscopy
Page 15
Rp Polarisation resistance
Ea Activation energy
T Absolute temperature
R Gas constant
LPS Lipopolysaccharide
PS Physiological saline
PBS Phosphate buffered saline
S. sanguinis Streptococcus sanguinis
S. mutans Streptococcus mutans
S. mitis Streptococcus mitis
Neutrophils Polymorphous nuclear leukocytes (neutrophils)
Tris-buffer Tris-buffered saline
Ops Sa Opsonised Staphylococcus aureus
TSB Tryptone soya broth
ROS Reactive oxygen species
H2O2 Hydrogen peroxide
O2- Superoxide
HOCl Hypochlorous acid
SEM Scanning electron microscopy
SE Secondary electron SEM image
BSE Backscatter electron SEM image
EDX Energy dispersive X-ray spectroscopy
AFM Atomic force microscopy
Page 16
1
1 INTRODUCTION
Ti and Ti alloys are routinely used for biomedical applications such as dental implants, bone
anchorage of extra-oral prostheses, bone fixation systems and orthopaedic devices. Ti and its
alloys are employed because of their perceived biocompatibility, suitable mechanical properties
and corrosion resistance [1]. The favourable cellular responses to Ti that are reported are
conferred by the presence on the Ti surface of a thin passive oxide film which provides chemical
stability [1-3]. It has been established in in vitro experiments that Ti and its biomedical alloys
are highly resistant to pitting corrosion and crevice corrosion at temperatures below 65 °C [4-
6]. Therefore corrosion of Ti leading to the release of particles and ions into surrounding tissues
is rarely considered by surgeons and patients as a likely event.
However, corrosion-related failures of implanted Ti devices and prostheses have been regularly
reported within the medical literature e.g. [7-9]. Using mass spectrometry, investigators have
shown that Ti levels can be significantly elevated in compartments remote from the implant site
such as in the serum of patients with indwelling Ti fixation devices [10-13]. The presence of Ti
particles/debris in a form of Ti metallic, TiO2 as rutile and TiO2 as anatase have been found in
peri-implant soft tissues retrieved from patients [14-16]. Macroscopic wear/tribocorrosion
processes may be the underlying cause, however, there is increasing evidence to suggest that
Ti implants are deteriorating in physiological environments in the absence of any significant
tribiological process [7, 8, 14].
The physiological environment into which a Ti implant is placed varies with site and with the
device application, but is always a complex system containing various inorganic and organic
components such as ions, amino acids and proteins and living cells. The specific composition
Page 17
2
of this environment can also change in either health or disease due to physiological processes
such as peri-implant inflammation [14] or as a direct consequence of the deterioration of the
implant itself [7].
It has been previously reported that products of normal cellular metabolism such as hydrogen
peroxide (H2O2) [17] or bacterial products such as lipopolysaccharide (LPS) [18], both of which
are important species associated with the inflammation in peri-implant sites can influence the
corrosion resistance of Ti implants. The current body of evidence however contains results
which are inconsistent or incomplete and typically consider factors which may affect corrosion
individually. For example proteins readily adsorb on in vivo surfaces of Ti implants, which may
modify the corrosion behaviour of the substrate and the interaction of a further chemical species
with the Ti surface. Albumin is an abundant protein found in blood and the extracellular
environment and its influence on the corrosion behaviour of metallic implants (including Ti)
has been reported [19-24]. However there remains disagreement amongst investigators as to
whether the presence of albumin enhances or inhibits corrosion of Ti alloys [20, 25-28].
Although clarification of the influence of adsorbed proteins on Ti corrosion is important, it is
also necessary to study the combination effect of such species with other biomolecules which
are abundant in the peri-implant environment and may subsequently promote or prevent Ti
corrosion.
It has been suggested that the human cells and bacteria that can form a surface biofilm may
have an influence on corrosion properties of biomedical implants [29-32]. However, the
mechanisms underlying the cellular effects on the corrosion resistance of Ti alloys in the body
are poorly characterised and require further investigation.
Page 18
3
In addition to biologically-mediated release of Ti from implants, mechanically-assisted crevice
corrosion (MACC) has been proposed to contribute to the accumulation of Ti products in peri-
implant tissues in situations where the implant is not subjected to macroscopic wear [7, 14, 33].
To date most laboratory efforts have focussed on studying tribocorrosion or “fretting corrosion”
with small scale motion [34-36], which fails to generate the typical features proposed to be
associated with MACC of implanted devices. MACC of metallic implants has not been studied
extensively, and to date there is no report of apparatus which could be considered to fully
simulate the specific conditions that occur during MACC, with the exception of measurements
made on assembled implants using real orthopaedic components [37, 38]. However, none of
the work to date has considered the effect of biologically-relevant species such as albumin, LPS
and H2O2 on the crevice chemistry.
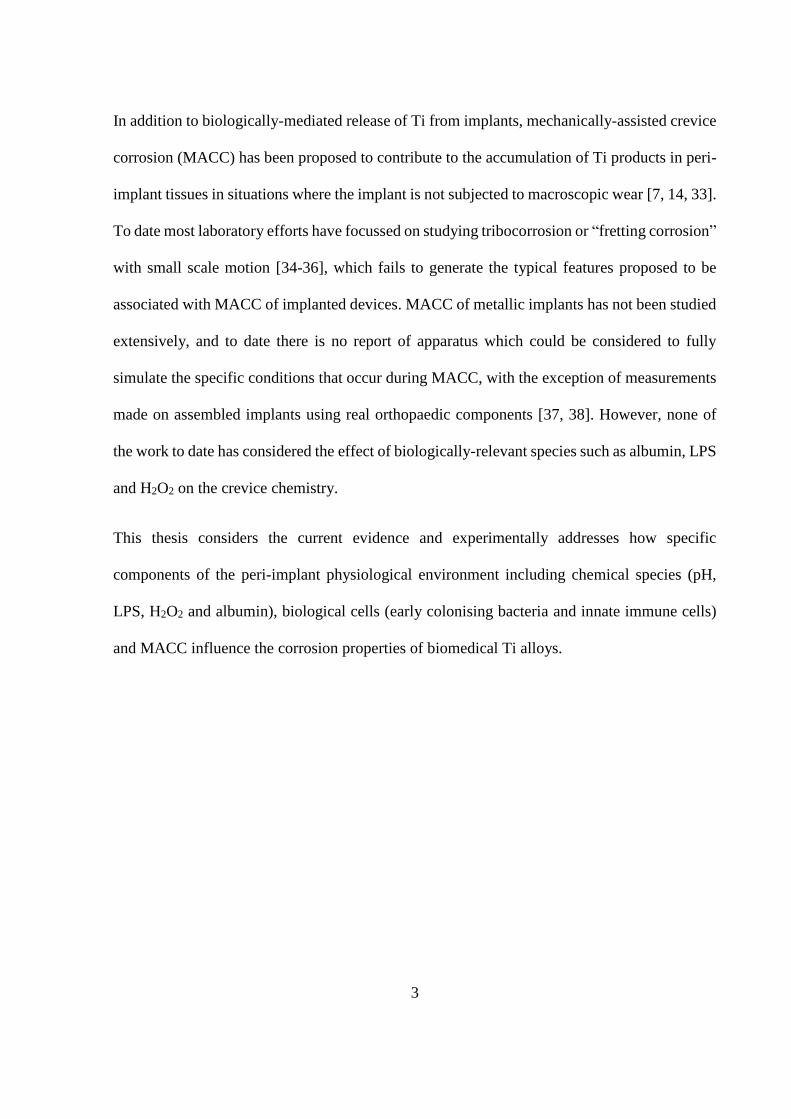
This thesis considers the current evidence and experimentally addresses how specific
components of the peri-implant physiological environment including chemical species (pH,
LPS, H2O2 and albumin), biological cells (early colonising bacteria and innate immune cells)
and MACC influence the corrosion properties of biomedical Ti alloys.
Page 19
4
2 LITERATURE REVIEW
2.1 Ti and its alloys
2.1.1 Biomedical applications
Ti and its alloys are among the most important metals in the biomedical field. Ti alloys have
good mechanical properties, including low elastic modulus, low density and high tensile
strength, yielding an excellent strength-to-weight ratio [1, 2]. Ti alloys also show outstanding
chemical properties such as good corrosion resistance and thermal stability [1]. In addition, Ti
can osseointegrate with living bone after implantation [39]. Therefore, Ti and its alloys have
been routinely used in the manufacture of biomedical implants since the 1950s [3]. It is reported
that over 1000 tonnes of Ti are used as biomedical devices every year and in modern dentistry
the use of Ti implants has revolutionised patient care resulting in a global market value for these
interventions at over $4.5 billion [14].
ASTM International recognises 31 grades of Ti and Ti alloys, of which 23 are classified as
biomedical materials [3]. There are several kinds of components fabricated from Ti that are
used in biomedical devices for various applications in the human body as shown in Figure 2-1 [1,
31]. Ti is used biomedically as parts of joint replacements in the hip and knee; as fixation
devices such as bone screws and plates and as anchorage devices to retain artificial teeth or
facial prostheses. Ti alloys can also serve as artificial heart valves or artificial vascular stents [1,
31]. Of the available biomedical Ti substrates, commercially pure Ti (CP-Ti) and Ti6Al4V are
the most commonly used [40].
Page 20
5
Figure 2-1 Examples of Ti use as biomedical devices-adapted from previous work [1, 31].
Page 21
6
2.1.2 CP-Ti and Ti6Al4V
2.1.2.1 Mechanical properties
CP-Ti is classified by ASTM as Grade 1-4, and is mostly used for cranial anchorage devices
and dental implants for which relatively low tensile strength is required. Ti6Al4V alloy is
classified by ASTM as Grade 5 and is used in orthopaedic components which are subjected to
large external loads, because of its high tensile strength of 860 MPa (Table 2-1) [40].
Table 2-1 Mechanical properties of CP-Ti and Ti6Al4V [2, 40].
Yield
Strength
(MPa)
Ultimate
Tensile Strength
(MPa)
Elongation
(%)
Elastic
Modulus
(GPa)
CP-Ti Grade 1 170 240 24 103-107
CP-Ti Grade 2 275 345 20 103-107
CP-Ti Grade 3 380 450 18 103-107
CP-Ti Grade 4 483 550 15 103-107
Ti6Al4V (Grade 5) 795 860 10 117-120
Bone - 150-400 - 10-40
2.1.2.2 Microstructure
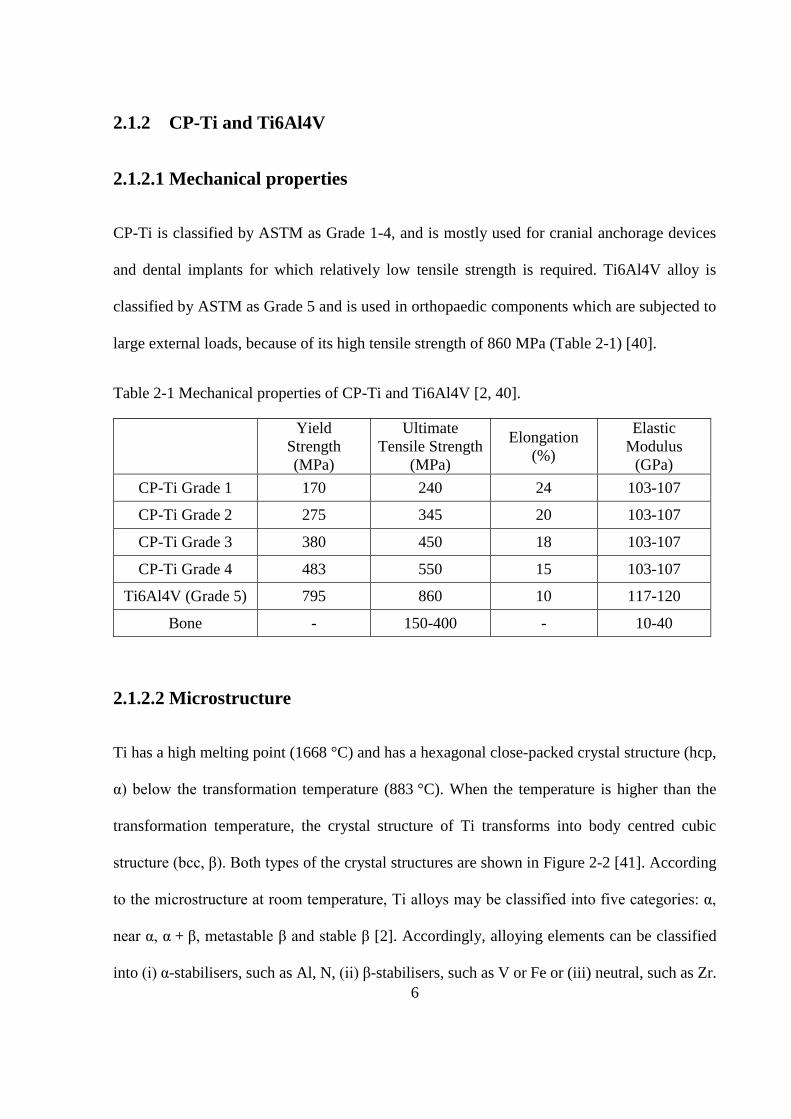
Ti has a high melting point (1668 °C) and has a hexagonal close-packed crystal structure (hcp,
α) below the transformation temperature (883 °C). When the temperature is higher than the
transformation temperature, the crystal structure of Ti transforms into body centred cubic
structure (bcc, β). Both types of the crystal structures are shown in Figure 2-2 [41]. According
to the microstructure at room temperature, Ti alloys may be classified into five categories: α,
near α, α + β, metastable β and stable β [2]. Accordingly, alloying elements can be classified
into (i) α-stabilisers, such as Al, N, (ii) β-stabilisers, such as V or Fe or (iii) neutral, such as Zr.
Page 22
7
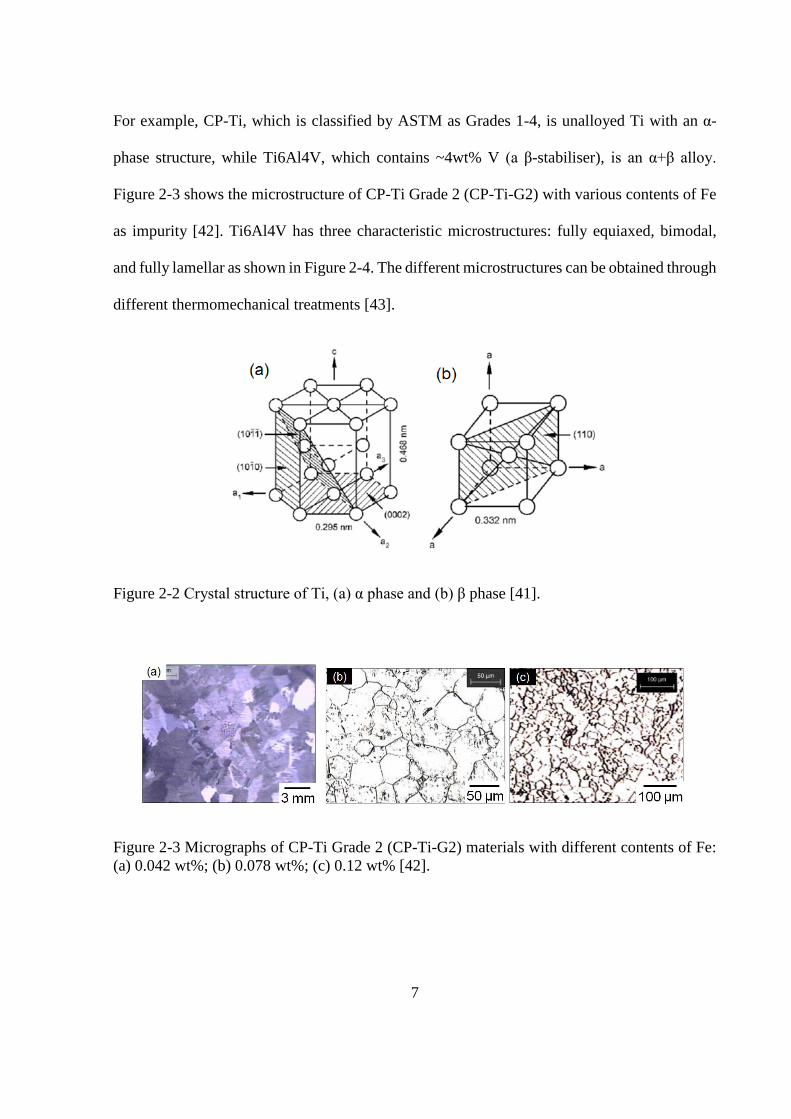
For example, CP-Ti, which is classified by ASTM as Grades 1-4, is unalloyed Ti with an α-
phase structure, while Ti6Al4V, which contains ~4wt% V (a β-stabiliser), is an α+β alloy.
Figure 2-3 shows the microstructure of CP-Ti Grade 2 (CP-Ti-G2) with various contents of Fe
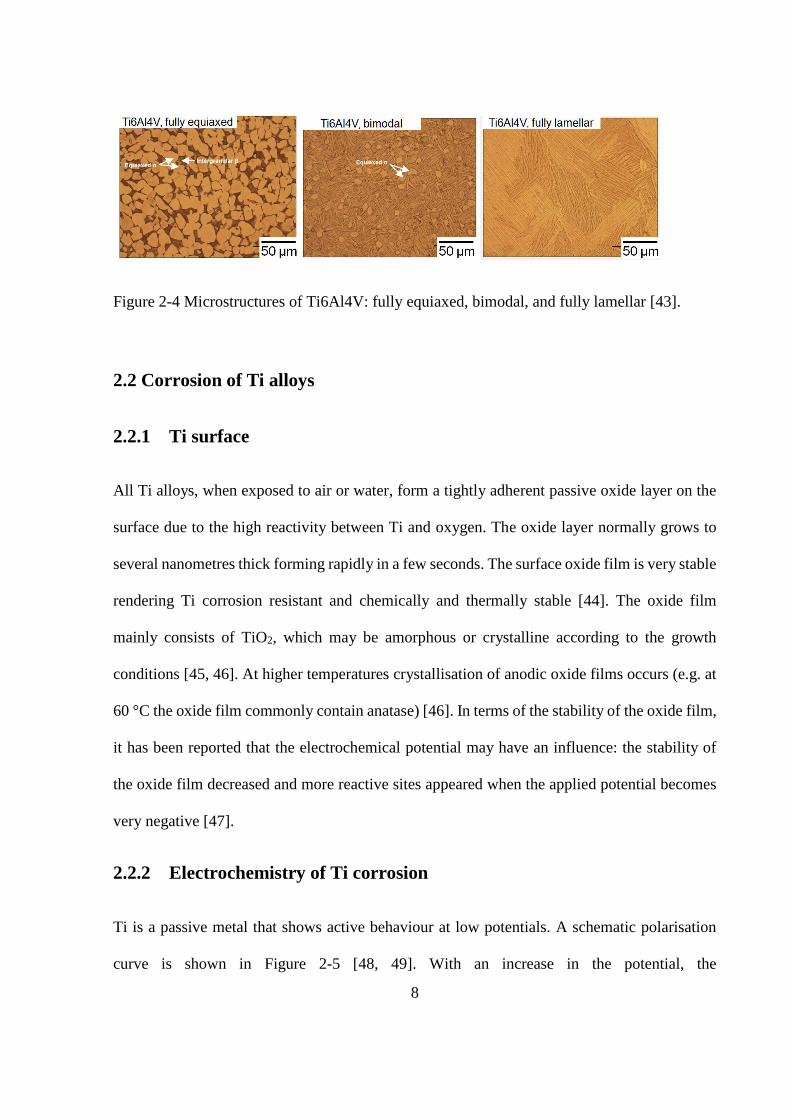
as impurity [42]. Ti6Al4V has three characteristic microstructures: fully equiaxed, bimodal,
and fully lamellar as shown in Figure 2-4. The different microstructures can be obtained through
different thermomechanical treatments [43].
Figure 2-2 Crystal structure of Ti, (a) α phase and (b) β phase [41].
Figure 2-3 Micrographs of CP-Ti Grade 2 (CP-Ti-G2) materials with different contents of Fe:
(a) 0.042 wt%; (b) 0.078 wt%; (c) 0.12 wt% [42].
Page 23
8
Figure 2-4 Microstructures of Ti6Al4V: fully equiaxed, bimodal, and fully lamellar [43].
2.2 Corrosion of Ti alloys
2.2.1 Ti surface
All Ti alloys, when exposed to air or water, form a tightly adherent passive oxide layer on the
surface due to the high reactivity between Ti and oxygen. The oxide layer normally grows to
several nanometres thick forming rapidly in a few seconds. The surface oxide film is very stable
rendering Ti corrosion resistant and chemically and thermally stable [44]. The oxide film
mainly consists of TiO2, which may be amorphous or crystalline according to the growth
conditions [45, 46]. At higher temperatures crystallisation of anodic oxide films occurs (e.g. at
60 °C the oxide film commonly contain anatase) [46]. In terms of the stability of the oxide film,
it has been reported that the electrochemical potential may have an influence: the stability of
the oxide film decreased and more reactive sites appeared when the applied potential becomes
very negative [47].
2.2.2 Electrochemistry of Ti corrosion
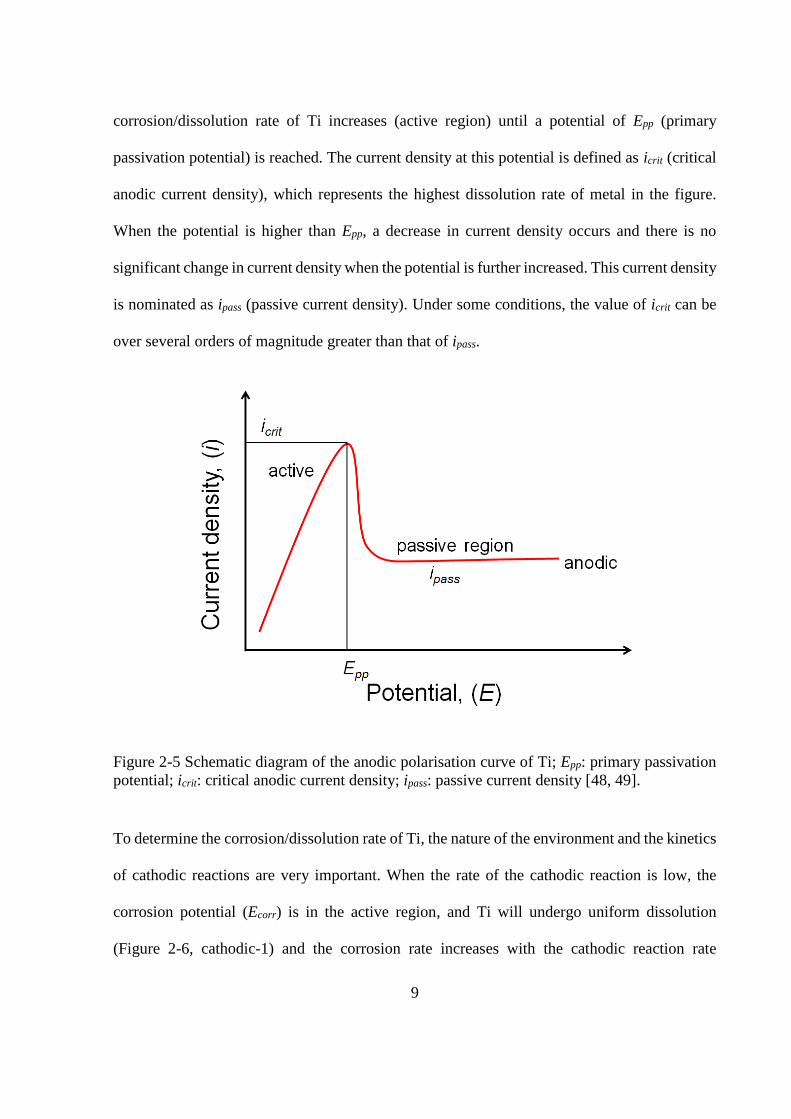
Ti is a passive metal that shows active behaviour at low potentials. A schematic polarisation
curve is shown in Figure 2-5 [48, 49]. With an increase in the potential, the
Page 24
9
corrosion/dissolution rate of Ti increases (active region) until a potential of Epp (primary
passivation potential) is reached. The current density at this potential is defined as icrit (critical
anodic current density), which represents the highest dissolution rate of metal in the figure.
When the potential is higher than Epp, a decrease in current density occurs and there is no
significant change in current density when the potential is further increased. This current density
is nominated as ipass (passive current density). Under some conditions, the value of icrit can be
over several orders of magnitude greater than that of ipass.
Figure 2-5 Schematic diagram of the anodic polarisation curve of Ti; Epp: primary passivation
potential; icrit: critical anodic current density; ipass: passive current density [48, 49].
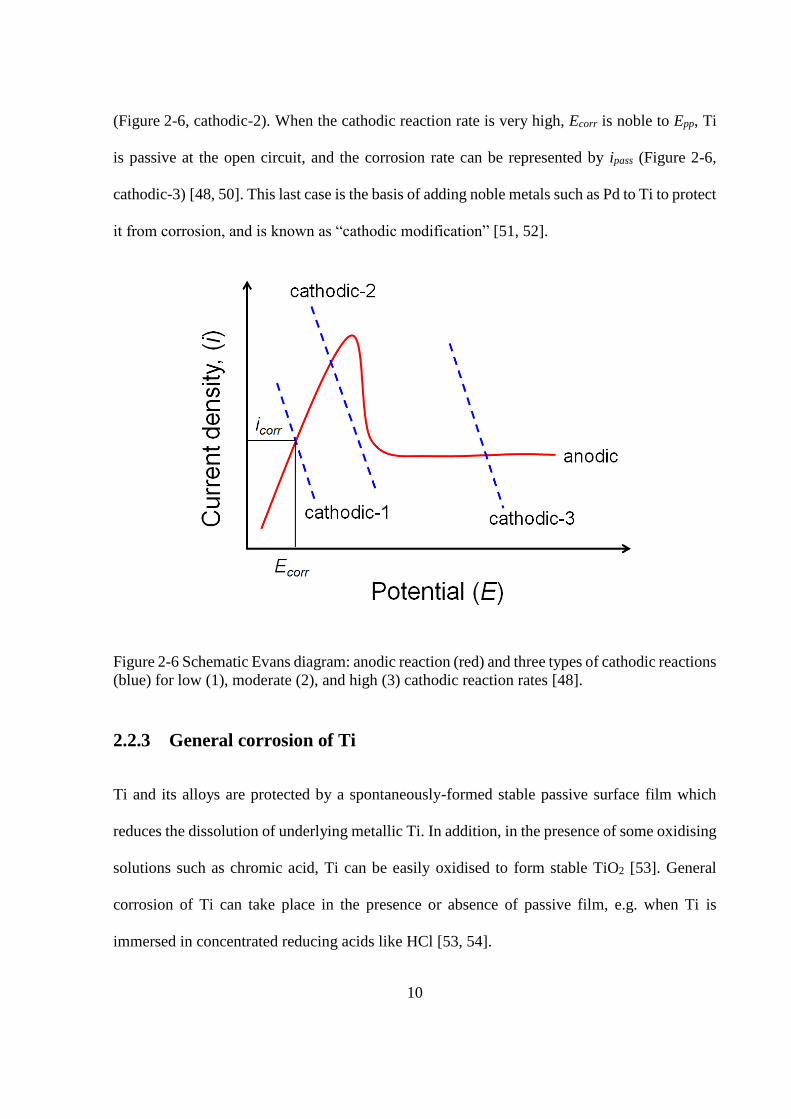
To determine the corrosion/dissolution rate of Ti, the nature of the environment and the kinetics
of cathodic reactions are very important. When the rate of the cathodic reaction is low, the
corrosion potential (Ecorr) is in the active region, and Ti will undergo uniform dissolution
(Figure 2-6, cathodic-1) and the corrosion rate increases with the cathodic reaction rate
Page 25
10
(Figure 2-6, cathodic-2). When the cathodic reaction rate is very high, Ecorr is noble to Epp, Ti
is passive at the open circuit, and the corrosion rate can be represented by ipass (Figure 2-6,
cathodic-3) [48, 50]. This last case is the basis of adding noble metals such as Pd to Ti to protect
it from corrosion, and is known as “cathodic modification” [51, 52].
Figure 2-6 Schematic Evans diagram: anodic reaction (red) and three types of cathodic reactions
(blue) for low (1), moderate (2), and high (3) cathodic reaction rates [48].
2.2.3 General corrosion of Ti
Ti and its alloys are protected by a spontaneously-formed stable passive surface film which
reduces the dissolution of underlying metallic Ti. In addition, in the presence of some oxidising
solutions such as chromic acid, Ti can be easily oxidised to form stable TiO2 [53]. General
corrosion of Ti can take place in the presence or absence of passive film, e.g. when Ti is
immersed in concentrated reducing acids like HCl [53, 54].
Page 26
11
When Ti is in the active region as shown in Figure 2-5 (e.g. immersed in concentrated HCl),
homogeneous dissolution of the passive film and the underlying Ti metal can take place. The
dissolution of the Ti oxide film has been proposed to occur via direct chemical dissolution or
electrochemical dissolution [55, 56]. By direct chemical dissolution, TiO2 is dissolved to
cations (Ti4+) in the form of TiO2+ or Ti(OH)3+ (Equation 2-1) [56]. In terms of the
electrochemical pathway, it was proposed by Dyer and Leach [55] that the reduction reaction
of Ti4+ in TiO2 and oxidation reaction of Ti substrate can form Ti3+ in the form of TiOOH or
TiOOH·H2O at the open circuit (Equation 2-2), followed by chemical dissolution of TiOOH or
TiOOH·H2O to Ti3+ (Equation 2-3) [53, 55].
Equation 2-1 TiO2 + H2O + H+ Ti(OH)3+
Equation 2-2 Ti + 3TiO2 + 6H2O 4TiOOH·H2O
Equation 2-3 TiOOH·H2O + 3H+ Ti3+ + 3H2O
When Ti is in the passive region shown in Figure 2-5 (i.e. Ecorr is above Epp), the passive film
on Ti surface is thermodynamically stable across a wide range of potentials and pH [57]. The
solubility of the passive film is dependent upon the solutions and the corrosion rate can be
represented by the passive current (ipass) [48, 50].
2.2.4 Pitting corrosion of Ti
When Ti alloys are protected by a passive oxide film they can still become vulnerable to
localised corrosion at specific sites on the surface. A common form of localised corrosion is
pitting corrosion, in which small cavities are created on the surface, however there are relatively
few papers on pitting corrosion of Ti alloys. In early studies the effect of different factors such
Page 27
12
as halide type, concentration, and temperature on the pitting corrosion were investigated [58].
It is reported that Ti is highly resistant to pitting corrosion in Cl- containing solutions [6]. The
pitting potential of Ti is very high ~8 V [59, 60] and for a freely corroding Ti electrode this
potential is hard to reach, especially in the body where the relevant potential is <1 V [61].
Recently, Burstein et al. [62, 63] reported observations of pit nucleation events but not
propagation in Ringer’s solution (0.65% NaCl and low concentrations of other salts such as
KCl, NaHCO3 and CaCl2) which was proposed to be physiologically representative.
2.2.5 Crevice corrosion of Ti
Crevice corrosion is an important type of localised corrosion for Ti. It occurs where a crevice-
former presses against the metal surface as illustrated in Figure 2-7 [64]. The crevice-former
serves as a ready-made initiation site. Inside a restricted crevice, dissolved O2 would be used
up quickly. If the environment is neutral or alkaline, O2 is reduced as described in Equation 2-4
and if under acidic conditions the reaction occurs as described in Equation 2-5. The metal inside
the crevice becomes the anode whilst the part outside the crevice is the cathode. Ti ions
accumulate in the crevice and undergo a hydrolysis reaction (Equation 2-6, Equation 2-7, and
Equation 2-8 [4]). Accordingly more H+ ions are produced and the crevice becomes more acidic.
Because of electro-neutrality, Cl- ions are drawn into the crevice which makes the solution more
aggressive and favours dissolution of Ti metal over repassivation. This aggressive chemistry
with a high level of acidity and high chloride concentration is critical for the propagation of
localised corrosion.
Equation 2-4 O2 + 2H2O + 4e- 4OH-
Equation 2-5 O2 + 4H+ + 4e- 2H2O
Page 28
13
Equation 2-6 Ti Ti4+ + 4e-
Equation 2-7 Ti4+ + 2H2O [Ti(OH)2]2+ + 2H+
Equation 2-8 Ti4+ + 4H2O Ti(OH)4 + 4H+
Figure 2-7 Schematic illustration of crevice corrosion in the presence of Cl- [64].
Many researchers have studied the influence of alloy composition, temperature and surface
modification on crevice corrosion of Ti [4, 5, 42]. However it is reported that crevice corrosion
on Ti is not likely to occur in static neutral chloride-containing solutions when the temperature
is below 65 °C [4], which suggests that crevice corrosion should not occur in the human body
(37 °C). Further studies have confirmed that CP-Ti and Ti6Al4V are very resistant to crevice
corrosion in physiological saline (0.9% NaCl) or Hank’s solution (0.8% NaCl and low
concentrations of other salts such as KCl, NaHCO3 and MgCl2) at 37 °C [65, 66].
2.2.6 Mechanically-assisted crevice corrosion (MACC)
Although crevice corrosion of Ti alloys is not predicted to occur in physiological environments,
severe corrosion of Ti implants has been observed on devices implanted in the human body
Page 29
14
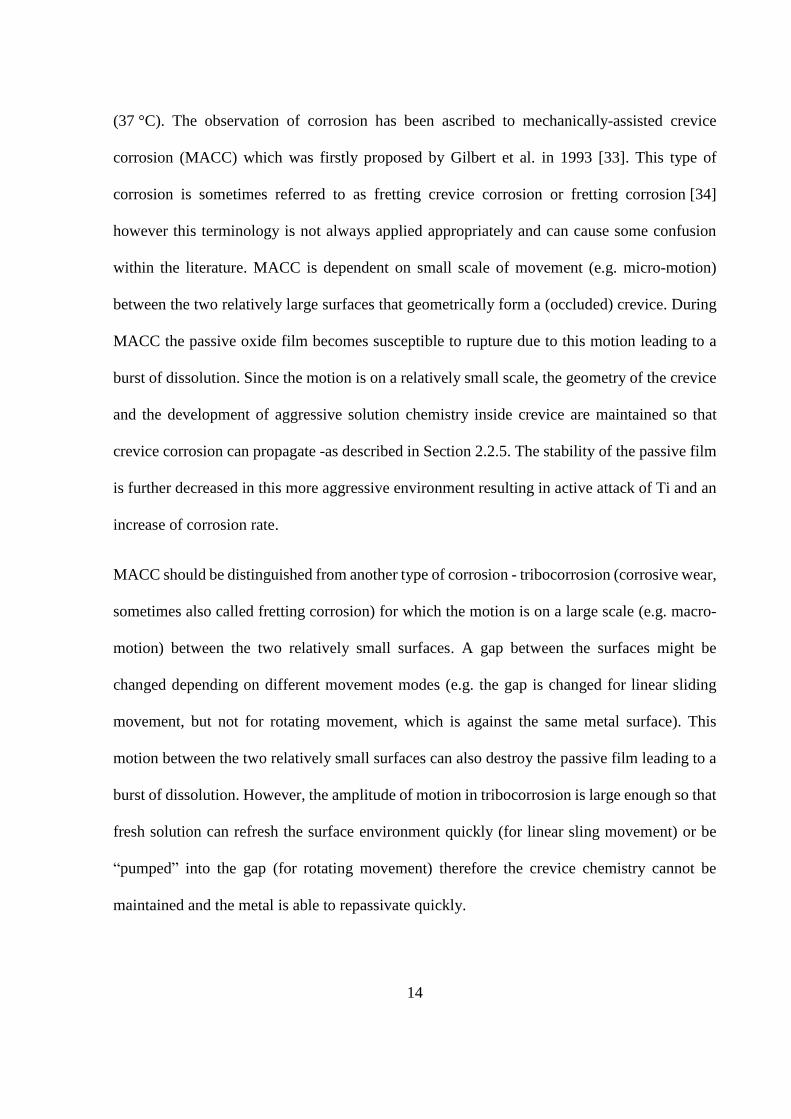
(37 °C). The observation of corrosion has been ascribed to mechanically-assisted crevice
corrosion (MACC) which was firstly proposed by Gilbert et al. in 1993 [33]. This type of
corrosion is sometimes referred to as fretting crevice corrosion or fretting corrosion [34]
however this terminology is not always applied appropriately and can cause some confusion
within the literature. MACC is dependent on small scale of movement (e.g. micro-motion)
between the two relatively large surfaces that geometrically form a (occluded) crevice. During
MACC the passive oxide film becomes susceptible to rupture due to this motion leading to a
burst of dissolution. Since the motion is on a relatively small scale, the geometry of the crevice
and the development of aggressive solution chemistry inside crevice are maintained so that
crevice corrosion can propagate -as described in Section 2.2.5. The stability of the passive film
is further decreased in this more aggressive environment resulting in active attack of Ti and an
increase of corrosion rate.
MACC should be distinguished from another type of corrosion - tribocorrosion (corrosive wear,
sometimes also called fretting corrosion) for which the motion is on a large scale (e.g. macro-
motion) between the two relatively small surfaces. A gap between the surfaces might be
changed depending on different movement modes (e.g. the gap is changed for linear sliding
movement, but not for rotating movement, which is against the same metal surface). This
motion between the two relatively small surfaces can also destroy the passive film leading to a
burst of dissolution. However, the amplitude of motion in tribocorrosion is large enough so that
fresh solution can refresh the surface environment quickly (for linear sling movement) or be
“pumped” into the gap (for rotating movement) therefore the crevice chemistry cannot be
maintained and the metal is able to repassivate quickly.
Page 30
15
It should be noted that the reports of simulation of “fretting corrosion” which employ small
amplitude movements between two surfaces with relatively small contact areas are not
necessarily simulating MACC, because the contact area is of an insufficient size to be able to
develop effective crevice chemistry. The crevice between small contact surfaces is readily
refreshed by the bulk solution and the aggressive crevice chemistry cannot be maintained.
2.3 Characterisation of Ti corrosion in the body
2.3.1 Introduction
Ti and its alloys are generally corrosion resistant due to the presence of a stable passive oxide
film on the surface. However, significantly elevated Ti levels have been detected in humans or
animals that have Ti implants [10-12, 67-69]. In addition to the detection of metal ions, Ti
particles/debris including Ti metal, TiO2 as anatase and rutile have been found in analysis of
peri-implant tissues and more distant tissues retrieved from patients [14, 15, 70-73]. Corrosion
features and/or abrasion scars have also been clearly observed on areas of some Ti implants and
their generation has been attributed to MACC [7, 8, 33, 74-78]. The consequences of released
Ti corrosion products interacting with the host tissues include adverse biological outcomes such
as allergic and inflammatory reactions which can manifest as pain and ultimately failure of the
integration of the Ti implant itself [7, 8, 14].
2.3.2 Metal ion release
Many in vivo studies have demonstrated Ti ion release or high Ti levels in the serum of patients
with Ti implants [67-69]. Elevated Ti levels have also been found in the organs far from the
implant sites (e.g. spleen, liver, kidney) in patients implanted with Ti6Al4V hip or knee
Page 31
16
prostheses [10] or in animals whose limbs have been implanted with CP-Ti wire [12].
Macroscopic tribological processes leading to the generation of wear debris may account for
high concentrations of Ti local to the implant. However, systemically distributed Ti and
increased Ti levels in tissues next to implants where there are no obvious wear processes have
been observed, which indicate that corrosion of Ti implants does occur in vivo [11]. It has also
been demonstrated that greater Ti release has been found in patients with peri-implantitis
(where inflammation is present) than that in patients without peri-implant disease [71]. This
observation is significant as many species and biomolecules generated locally in inflammation
potentially have the capacity to influence Ti corrosion.
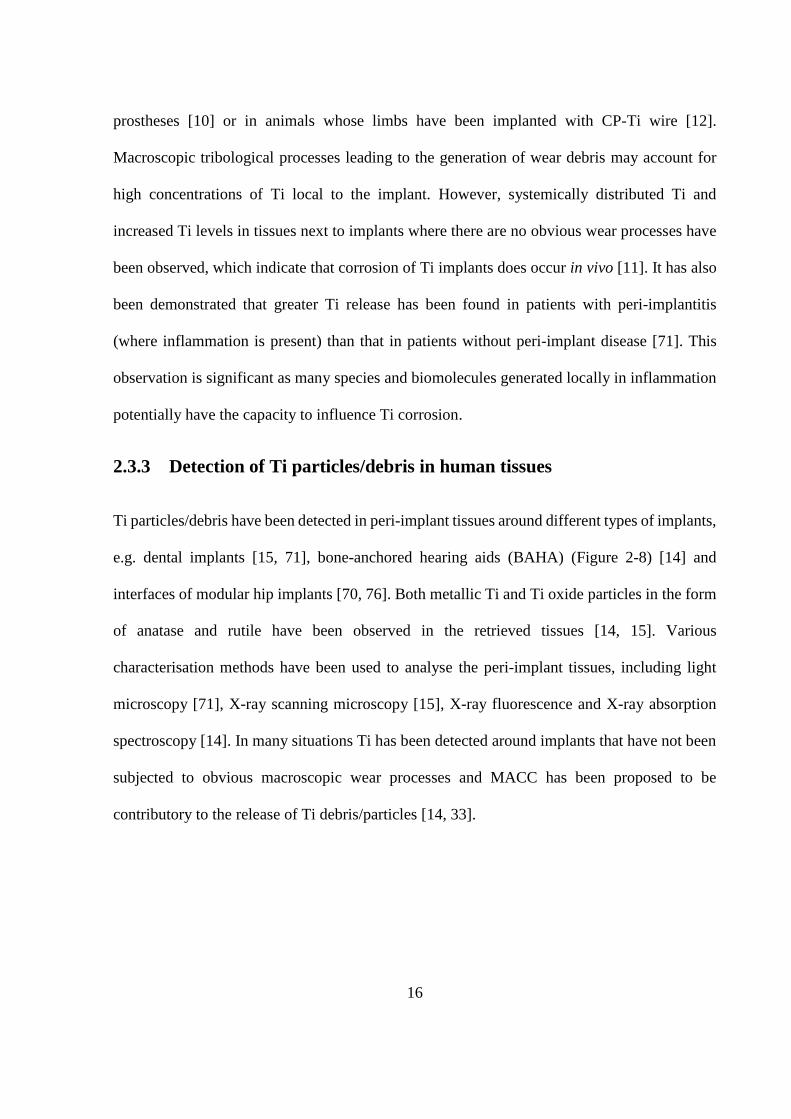
2.3.3 Detection of Ti particles/debris in human tissues
Ti particles/debris have been detected in peri-implant tissues around different types of implants,
e.g. dental implants [15, 71], bone-anchored hearing aids (BAHA) (Figure 2-8) [14] and
interfaces of modular hip implants [70, 76]. Both metallic Ti and Ti oxide particles in the form
of anatase and rutile have been observed in the retrieved tissues [14, 15]. Various
characterisation methods have been used to analyse the peri-implant tissues, including light
microscopy [71], X-ray scanning microscopy [15], X-ray fluorescence and X-ray absorption
spectroscopy [14]. In many situations Ti has been detected around implants that have not been
subjected to obvious macroscopic wear processes and MACC has been proposed to be
contributory to the release of Ti debris/particles [14, 33].
Page 32
17
Figure 2-8 An X-ray fluorescence map (5300 μm×2000 μm) of Ti distributed in peri-implant
soft tissue taken from around a CP-Ti BAHA fixture which is not subjected to obvious wear
[14]. Scale refers to fluorescence intensity in arbitrary units.
2.3.4 Mechanically-assisted crevice corrosion (MACC) of Ti implants
2.3.4.1 Corrosion features of Ti femoral stem of orthopaedic implants
Evidence of corrosion of the intramedullary Ti stem component of total hip replacements has
been reported by a number of clinical investigators [7, 8, 79]. In one report it was observed that
the normal polished surface of a Ti6Al4V cemented stem became modified after 78 months
implantation with the surface covered by thick white layers (Figure 2-9a) [8]. The part of the
femoral stem most affected was the distal end which would be at the “base” of the potential
crevice formed between bone/cement and the Ti implant. Another case with obvious corrosion
features and visible debris on the surface of a cemented Ti hip stem was also reported after 3
years of service (Figure 2-9b). It was identified that although the Ti stem was still well-fixed in
bone the patient suffered severe pain. On removal of the Ti implant it was found that the mean
pH of the body fluid around the distal tip was as low as 2.5, indicating a highly acidic peri-
implant environment had formed (Figure 2-9c) [7].
Page 33
18
Figure 2-9 Images showing distal corrosion features of retrieved Ti6Al4V femoral stem (a) after
mean 78 months implantation [8]; (b) after over 3 years of service [7]; (c) pH 2.5 of body fluid
around at the distal end (the red arrow was added to point towards the highly acidic observation)
[7].
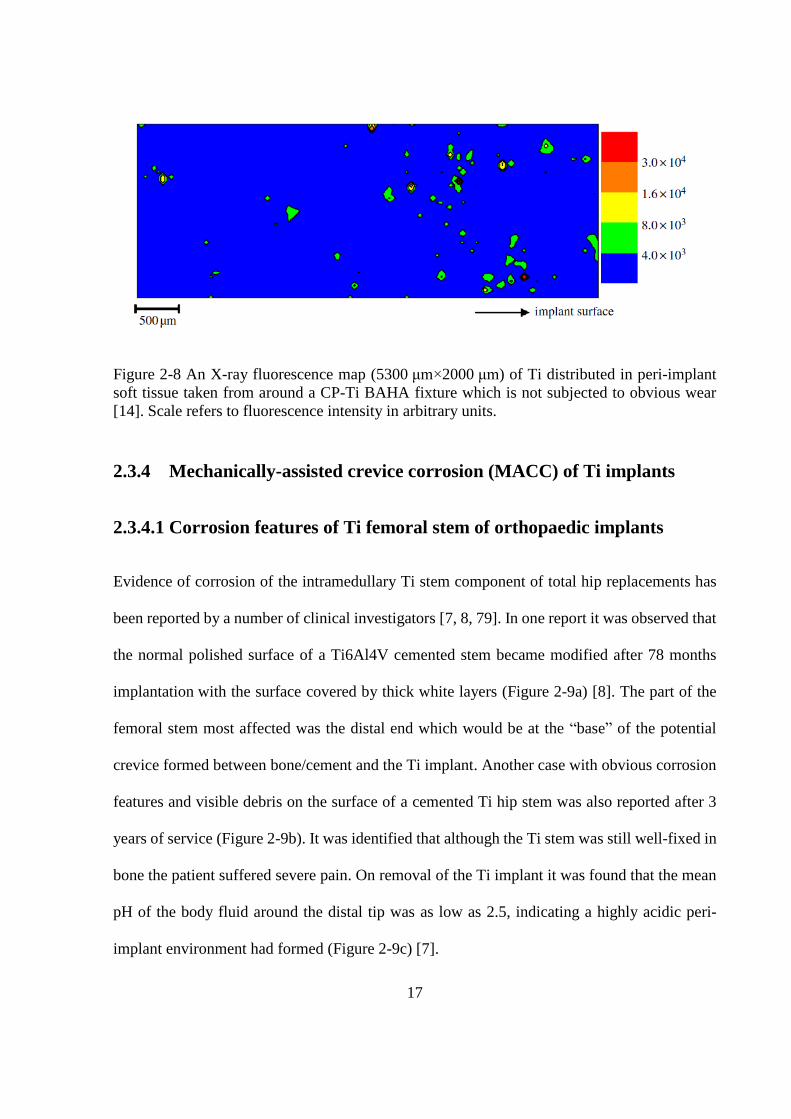
Ti femoral stems and similar fixation devices such as intramedullary nails are routinely fixed
into bone with or without a cement (usually PMMA). During human gait and cyclic stressing,
the displacement between bone/bone cement and the femoral stem is on a small scale
(<300 µm [80]). MACC is more likely to take place at the distal end of the femoral stem
(Figure 2-10) and acidification of the peri-implant fluid environment would result in implant
surface degradation. In addition a series of biological responses to both the corrosion products
and the local acidification would be initiated, which would ultimately lead to a decreased
lifetime of the device itself.
Page 34
19
Figure 2-10 Schematic image of the presence of MACC (highlighted in red) at a total hip
implant with cement (the image was adapted from [81])
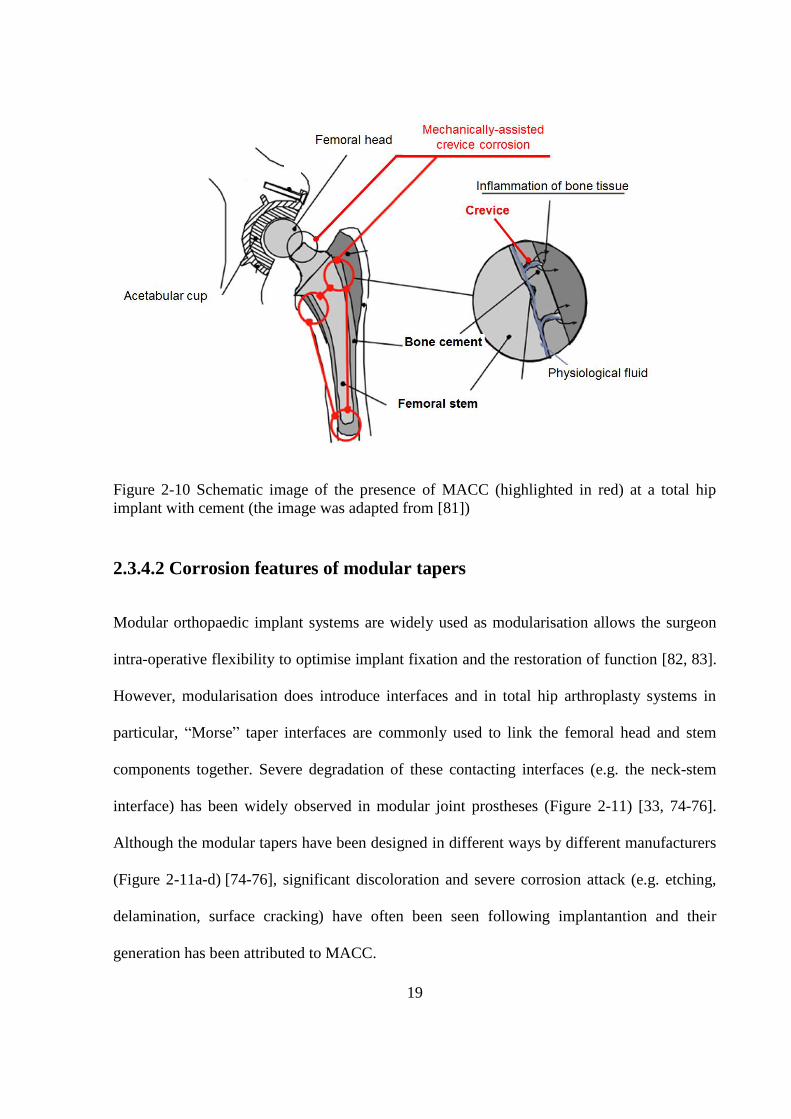
2.3.4.2 Corrosion features of modular tapers
Modular orthopaedic implant systems are widely used as modularisation allows the surgeon
intra-operative flexibility to optimise implant fixation and the restoration of function [82, 83].
However, modularisation does introduce interfaces and in total hip arthroplasty systems in
particular, “Morse” taper interfaces are commonly used to link the femoral head and stem
components together. Severe degradation of these contacting interfaces (e.g. the neck-stem
interface) has been widely observed in modular joint prostheses (Figure 2-11) [33, 74-76].
Although the modular tapers have been designed in different ways by different manufacturers
(Figure 2-11a-d) [74-76], significant discoloration and severe corrosion attack (e.g. etching,
delamination, surface cracking) have often been seen following implantantion and their
generation has been attributed to MACC.
Page 35
20
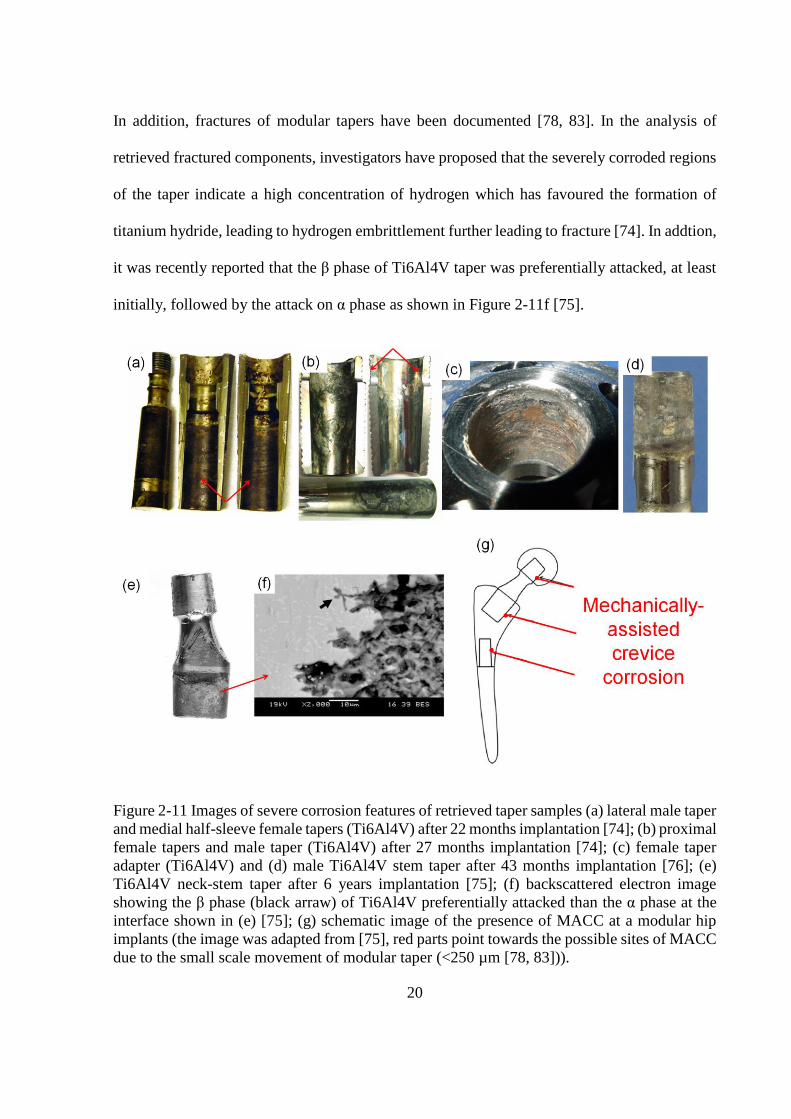
In addition, fractures of modular tapers have been documented [78, 83]. In the analysis of
retrieved fractured components, investigators have proposed that the severely corroded regions
of the taper indicate a high concentration of hydrogen which has favoured the formation of
titanium hydride, leading to hydrogen embrittlement further leading to fracture [74]. In addtion,
it was recently reported that the β phase of Ti6Al4V taper was preferentially attacked, at least
initially, followed by the attack on α phase as shown in Figure 2-11f [75].
Figure 2-11 Images of severe corrosion features of retrieved taper samples (a) lateral male taper
and medial half-sleeve female tapers (Ti6Al4V) after 22 months implantation [74]; (b) proximal
female tapers and male taper (Ti6Al4V) after 27 months implantation [74]; (c) female taper
adapter (Ti6Al4V) and (d) male Ti6Al4V stem taper after 43 months implantation [76]; (e)
Ti6Al4V neck-stem taper after 6 years implantation [75]; (f) backscattered electron image
showing the β phase (black arraw) of Ti6Al4V preferentially attacked than the α phase at the
interface shown in (e) [75]; (g) schematic image of the presence of MACC at a modular hip
implants (the image was adapted from [75], red parts point towards the possible sites of MACC
due to the small scale movement of modular taper (<250 µm [78, 83])).
Page 36
21
MACC may take place in all Ti devices implanted in human body because of the presence of
peri-prosthetic crevices formed between the device and the adjacent tissues (usually bone) when
the metal ions cannot escape through tissue. In addition in modular prostheses, including joint
replacements, bone fixation systems and dental implants, crevices can form between
components in association with micro-motion make these systems particularly susceptible to
MACC [14, 33]. For example MACC of dental implants could potentially take place at the
interface between the implant and bone, between the implant and a connected abutment
(fabricated from a variety of substrates including metal alloys and ceramics) and between the
abutment and the superstructure (e.g. crowns) - in all cases driven by low amplitude micro-
motion associated with functional loading (chewing).
2.3.5 Effects on human tissues
The biological consequences of released Ti corrosion products are now receiving considerable
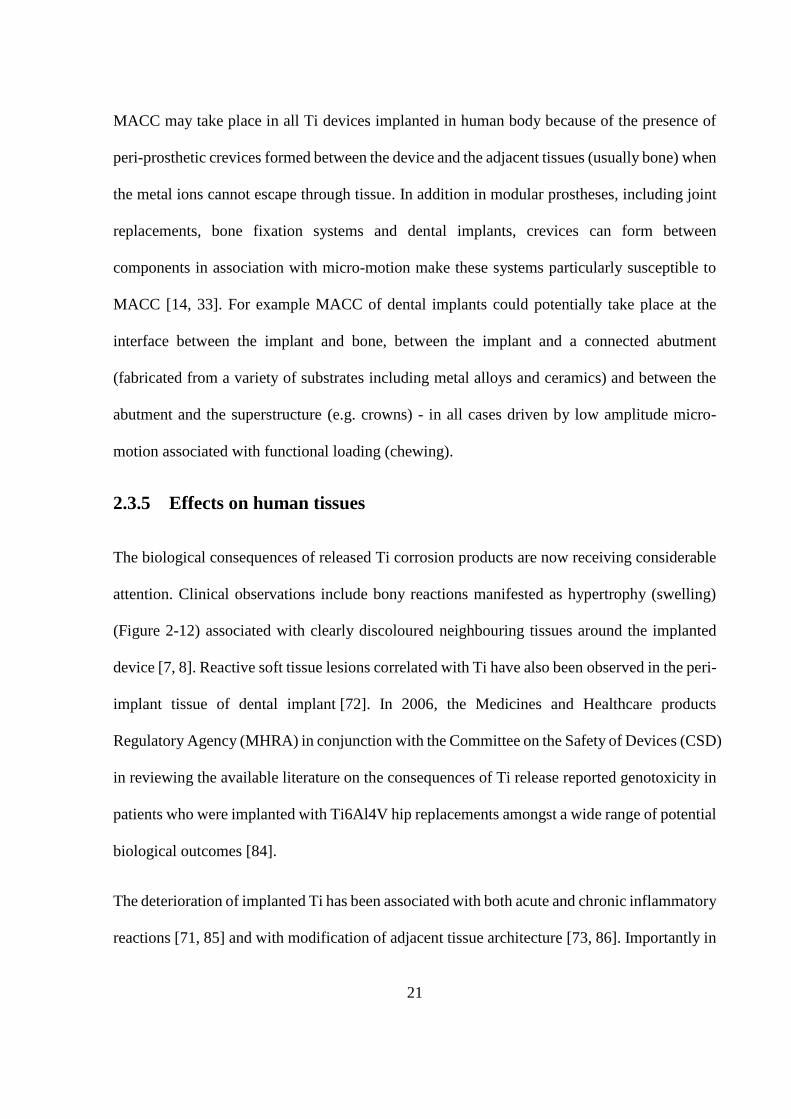
attention. Clinical observations include bony reactions manifested as hypertrophy (swelling)
(Figure 2-12) associated with clearly discoloured neighbouring tissues around the implanted
device [7, 8]. Reactive soft tissue lesions correlated with Ti have also been observed in the peri-
implant tissue of dental implant [72]. In 2006, the Medicines and Healthcare products
Regulatory Agency (MHRA) in conjunction with the Committee on the Safety of Devices (CSD)
in reviewing the available literature on the consequences of Ti release reported genotoxicity in
patients who were implanted with Ti6Al4V hip replacements amongst a wide range of potential
biological outcomes [84].
The deterioration of implanted Ti has been associated with both acute and chronic inflammatory
reactions [71, 85] and with modification of adjacent tissue architecture [73, 86]. Importantly in
Page 37
22
sites where there is associated peri-implant inflammation there is an inflammatory cell infiltrate
(including macrophages and neutrophils) in the zone adjacent to the implants [71, 87]. This is
significant as the relationship between tissues and Ti corrosion is interactive. The degradation
of Ti implants has a significant impact on human tissue and cells, however the cellular response
may also play a role in corrosion of the metallic implant itself (discussed in details in
Section 2.4.6).
Figure 2-12 Radiographs of Ti total hip replacement (a) after two days’ implantation and (b)
after two year’s implantation, showing a bony hypertrophy (swelling) of femur around distal
hip stem [7]
2.4 Corrosion of Ti alloys in vitro studies
2.4.1 Introduction
Biomedical implants are exposed to complex physiological environments after implantation,
which contain various substances including inorganic species, organic species (e.g. proteins,
Page 38
23
organic acids) as well as living eukaryotic cells and/or bacteria. The corrosion behaviour of
implanted Ti is well known to be influenced by alloy types [88, 89] and the alloy
microstructures [43, 90], but much less is known about the impact of the peri-implant
environment.
The presence or absence of different physiological species in simulated physiological
environments has been reported to influence corrosion behaviour of Ti alloys, such as pH [89,
91, 92], certain inorganic species (e.g. H2O2 or fluoride ions [17, 93, 94]), organic species (e.g.
lipopolysaccharide (LPS) [18], serum [95, 96] and proteins such as albumin [25-28, 97].
However, limited work has been carried out relating to the biological effects of prokaryotic
cells (bacteria) [29, 98, 99] and human cells [30, 32, 100] on the corrosion of Ti alloys.
2.4.2 Effect of environment acidity on corrosion of Ti alloys
2.4.2.1 Introduction
Physiological fluids are buffered solutions and the pH usually remains around 7. However, in
the presence of inflammation around the implants and/or in conditions associated with MACC,
the environment can be changed resulting in local acidification. It has also been demonstrated
clinically that the pH of the fluid around corroded Ti stem can be as low as 2.5 (Figure 2-9) [7].
In a dental context, acidogenic bacteria are principal components of the biofilm which forms
on Ti dental implants. The bacteria can produce acid (e.g. lactic acid), resulting in a local pH
change to below 4.5 [29, 91, 93, 101]. The pH of the oral environment may also change from 2
to 11 because of consumed foods or beverages. It is clear that acidic environments can be
generated in the body which is a hazard for metallic implants. It is therefore necessary to
evaluate the effect of local acidification on Ti implant degradation.
Page 39
24
2.4.2.2 Effect of pH on corrosion of Ti alloys
To investigate the effect of pH on Ti corrosion, solution analysis or electrochemical methods
have been used. By measuring the concentration of released Ti in the solution, a Ti release rate
in the range of 0-0.3 µgcm-2d-1 has been reported under acidic conditions (lactic acid, acetate
acid in combination with chloride) at 37 °C [89, 94]. The concentration of released Ti decreased
with increasing pH and was significantly reduced at pH 4 and above [89, 91].
For studies using electrochemical methods, it was found that CP-Ti, Ti6Al4V and Ti13Nb13Zr
were spontaneously passivated in acidic artificial saliva (pH 3) [102] or acidic Ringer’s solution
(pH 5.5) [103]. Increased ion exchange and corrosion rates were reported in acidic
environments and no significant difference was found for CP-Ti and Ti6Al4V [102, 103].
2.4.2.3 Effect of HCl on corrosion of Ti alloys
It has been found that both the concentration of acid and the temperature have influence on the
stability of the protective oxide film [53, 54, 56, 104]. An abrupt negative shift of the OCP of
CP-Ti-G2 (indicating an activation behaviour) was observed in deaerated ≥1 M HCl while it
did not show any activation behaviour in deaerated 0.1 M HCl at 37 °C (Figure 2-13a) [53]. In
addition, the time before activation has been found to vary with temperatures in concentrated
HCl (Figure 2-13b) [53]. According to Kelly’s observation [104], the condition for a stable
active state is pH <2.3 in 1 M Cl- at 30 °C. Blackwood et al. [56] believes that uniform
dissolution of oxide film rather than localised attack leads to breakdown of the passive film on
the Ti surface. After activation, the dissolution of Ti is in an active steady state (active
dissolution) [104].
Page 40
25
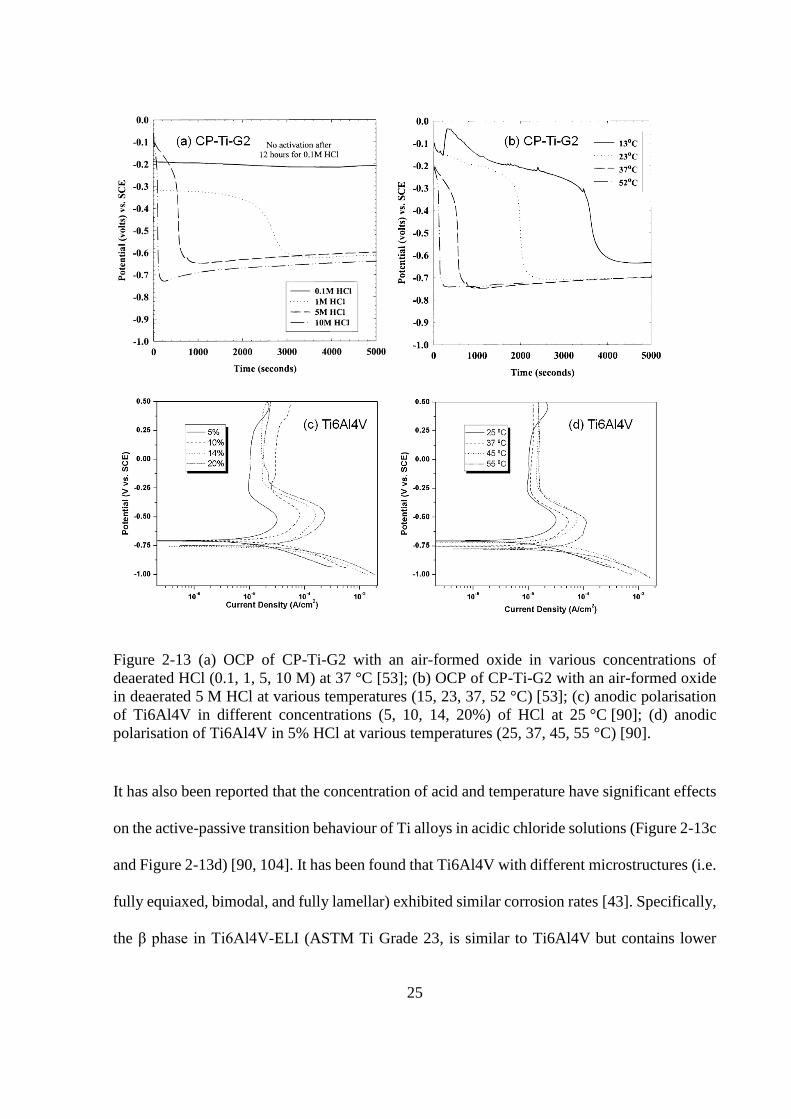
Figure 2-13 (a) OCP of CP-Ti-G2 with an air-formed oxide in various concentrations of
deaerated HCl (0.1, 1, 5, 10 M) at 37 °C [53]; (b) OCP of CP-Ti-G2 with an air-formed oxide
in deaerated 5 M HCl at various temperatures (15, 23, 37, 52 °C) [53]; (c) anodic polarisation
of Ti6Al4V in different concentrations (5, 10, 14, 20%) of HCl at 25 °C [90]; (d) anodic
polarisation of Ti6Al4V in 5% HCl at various temperatures (25, 37, 45, 55 °C) [90].
It has also been reported that the concentration of acid and temperature have significant effects
on the active-passive transition behaviour of Ti alloys in acidic chloride solutions (Figure 2-13c
and Figure 2-13d) [90, 104]. It has been found that Ti6Al4V with different microstructures (i.e.
fully equiaxed, bimodal, and fully lamellar) exhibited similar corrosion rates [43]. Specifically,
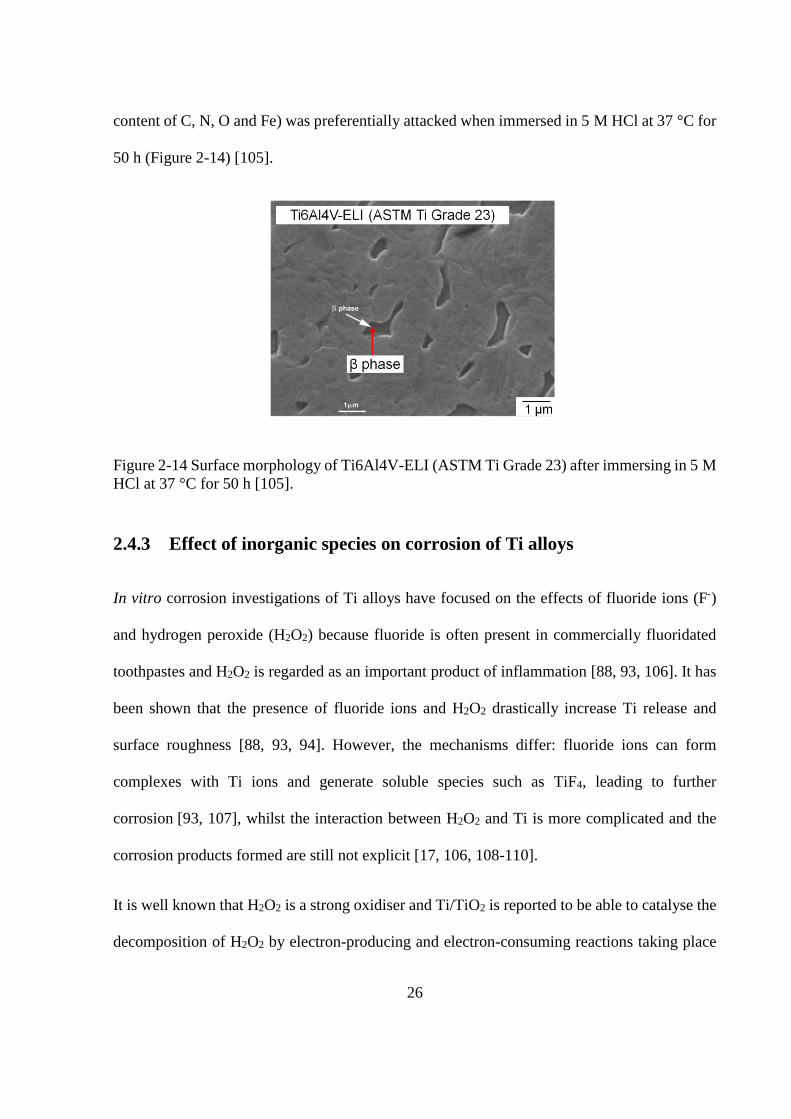
the β phase in Ti6Al4V-ELI (ASTM Ti Grade 23, is similar to Ti6Al4V but contains lower
Page 41
26
content of C, N, O and Fe) was preferentially attacked when immersed in 5 M HCl at 37 °C for
50 h (Figure 2-14) [105].
Figure 2-14 Surface morphology of Ti6Al4V-ELI (ASTM Ti Grade 23) after immersing in 5 M
HCl at 37 °C for 50 h [105].
2.4.3 Effect of inorganic species on corrosion of Ti alloys
In vitro corrosion investigations of Ti alloys have focused on the effects of fluoride ions (F-)
and hydrogen peroxide (H2O2) because fluoride is often present in commercially fluoridated
toothpastes and H2O2 is regarded as an important product of inflammation [88, 93, 106]. It has
been shown that the presence of fluoride ions and H2O2 drastically increase Ti release and
surface roughness [88, 93, 94]. However, the mechanisms differ: fluoride ions can form
complexes with Ti ions and generate soluble species such as TiF4, leading to further
corrosion [93, 107], whilst the interaction between H2O2 and Ti is more complicated and the
corrosion products formed are still not explicit [17, 106, 108-110].
It is well known that H2O2 is a strong oxidiser and Ti/TiO2 is reported to be able to catalyse the
decomposition of H2O2 by electron-producing and electron-consuming reactions taking place
Page 42
27
simultaneously (Equation 2-9, Equation 2-10 and Equation 2-11) [17, 106]. Tengvall et al. [106]
believes that the decomposition of H2O2, the oxidation/corrosion of Ti and the formation of Ti-
H2O2 complex can take place concurrently when Ti is incubated in H2O2 solutions. In addition,
it has been reported that H2O2 acts as both oxidising and reducing agents under certain
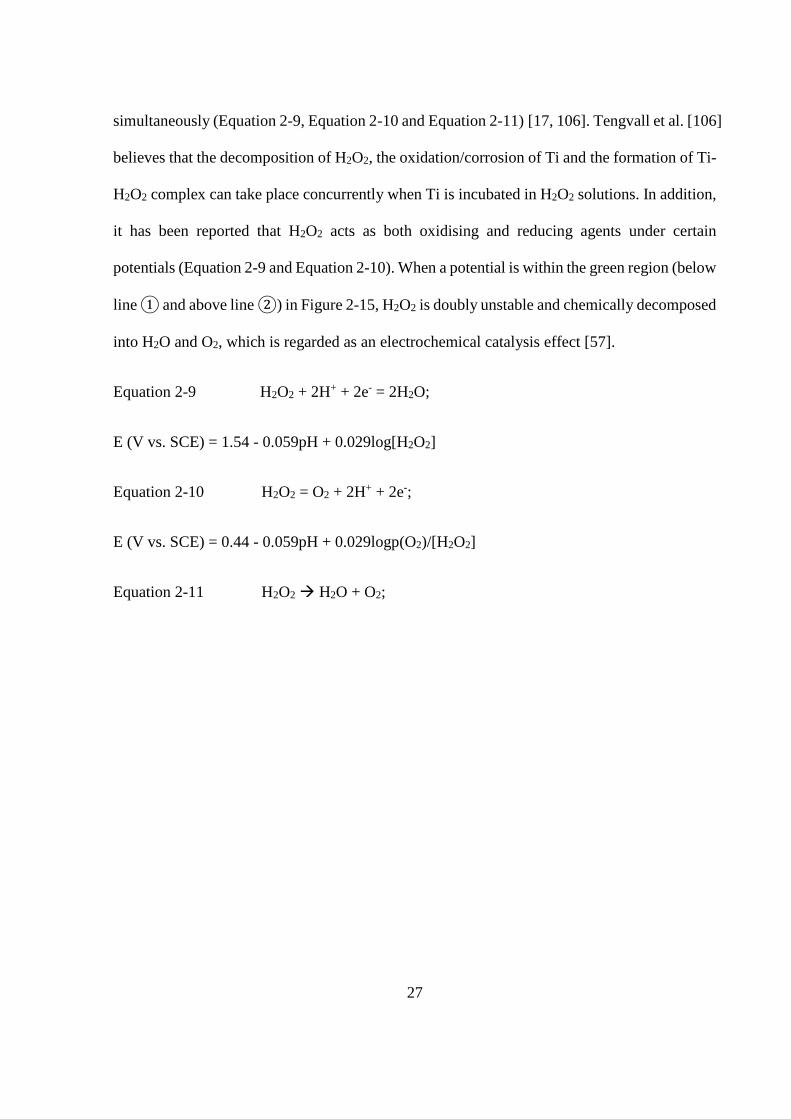
potentials (Equation 2-9 and Equation 2-10). When a potential is within the green region (below
line ① and above line ②) in Figure 2-15, H2O2 is doubly unstable and chemically decomposed
into H2O and O2, which is regarded as an electrochemical catalysis effect [57].
Equation 2-9 H2O2 + 2H+ + 2e- = 2H2O;
E (V vs. SCE) = 1.54 - 0.059pH + 0.029log[H2O2]
Equation 2-10 H2O2 = O2 + 2H+ + 2e-;
E (V vs. SCE) = 0.44 - 0.059pH + 0.029logp(O2)/[H2O2]
Equation 2-11 H2O2 H2O + O2;
Page 43
28
Figure 2-15 E-pH (Pourbaix) diagram for H2O/H2O2 system at room temperature adapted
from [57].
Figure 2-16 (a) and (b) proposed structures of Ti(IV)-H2O2 complex [108].
Both the Ti-H2O2 complex and different oxides have been reported to form on the Ti surface
following immersion in H2O2 solutions. The proposed structures of the strongly hydrated
Ti(IV)-H2O2 complex, (i.e. TiOOH(H2O)n) are shown in Figure 2-16 [108].
Mohanchandra et al. [109] confirmed the presence of TiO on a Ni-Ti surface when treated with
30% H2O2. In contrast, Pan et al. [17] found that the composition of the oxide film on CP-Ti
surface after being immersed in H2O2 solutions was mainly TiO2 without any trace TiO or Ti2O3.
Page 44
29
Whilst Assis and Costa [110] reported that Ti2O3 and TiO2 were detected on the surface of
Ti13Nb13Zr after 125 days immersion in Hank’s solution in the presence of H2O2.
Studies of the surface morphologies of Ti alloys after being immersed in H2O2 solution have
shown both surface roughening [111, 112] and unchanged surface morphology [88]. In terms
of Ti6Al4V, Noguchi et al. [88] reported discoloration of Ti6Al4V but no change of surface
morphology was observed when immersed in H2O2. However, Gilbert et al. [113, 114] reported
selective dissolution of the β phase of Ti6Al4V after electrochemical treatment in H2O2
solutions (Figure 2-17). Besides, a clear porous structure of corrosion product on CP-Ti surface
was observed by SEM after immersion in H2O2 [111, 112]. It has also been found that the
surface roughness of CP-Ti became increased by AFM after immersion in the presence of
H2O2 [93].
Figure 2-17 Selective dissolution of the β phase of Ti6Al4V after electrochemical treatment
with H2O2 [113, 114]. (The red arrow was added to point towards the β phase).
Page 45
30
2.4.4 Effect of organic species on corrosion of Ti alloys
2.4.4.1 Introduction
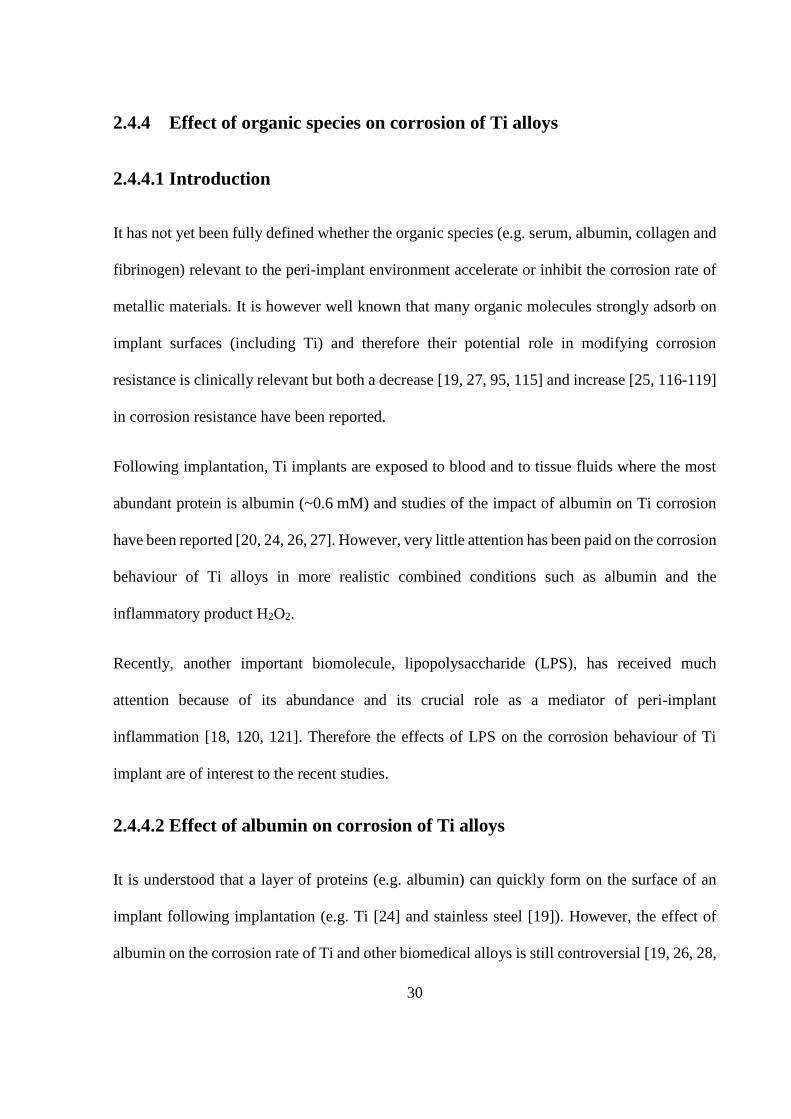
It has not yet been fully defined whether the organic species (e.g. serum, albumin, collagen and
fibrinogen) relevant to the peri-implant environment accelerate or inhibit the corrosion rate of
metallic materials. It is however well known that many organic molecules strongly adsorb on
implant surfaces (including Ti) and therefore their potential role in modifying corrosion
resistance is clinically relevant but both a decrease [19, 27, 95, 115] and increase [25, 116-119]
in corrosion resistance have been reported.
Following implantation, Ti implants are exposed to blood and to tissue fluids where the most
abundant protein is albumin (~0.6 mM) and studies of the impact of albumin on Ti corrosion
have been reported [20, 24, 26, 27]. However, very little attention has been paid on the corrosion
behaviour of Ti alloys in more realistic combined conditions such as albumin and the
inflammatory product H2O2.
Recently, another important biomolecule, lipopolysaccharide (LPS), has received much
attention because of its abundance and its crucial role as a mediator of peri-implant
inflammation [18, 120, 121]. Therefore the effects of LPS on the corrosion behaviour of Ti
implant are of interest to the recent studies.
2.4.4.2 Effect of albumin on corrosion of Ti alloys
It is understood that a layer of proteins (e.g. albumin) can quickly form on the surface of an
implant following implantation (e.g. Ti [24] and stainless steel [19]). However, the effect of
albumin on the corrosion rate of Ti and other biomedical alloys is still controversial [19, 26, 28,
Page 46
31
122, 123]. The presence of albumin can lead to the decreased corrosion rate of CP-Ti [116],
Ti6Al4V [25, 117], stainless steel and CoCrMo [26, 28], the increased corrosion rate of
Ti6Al4V [27], stainless steel [19, 115] and CoCrMo [124, 125] and no change on corrosion
resistance of CP-Ti [20, 126], Ti6Al4V [122, 123]. It is however agreed that the addition of
albumin decreases the cathodic current of Ti alloys indicating that albumin serves as a cathodic
inhibitor [20, 116, 122].
In addition, the concentration of albumin has been shown to influence the corrosion behaviour
of metallic implants (e.g. Ti6Al4V [28], CoCrMo [127] and Nb [22]). Karimi et al. [26, 28]
reported that the presence of albumin decreased the stability of the passive film on the surface
of Ti6Al4V in the concentration range of 0.02-0.2% in phosphate buffered saline (PBS, 0.8%
NaCl and low concentration of other salts such as KCl, KH2PO4 and Na2HPO4), whilst it
enhanced the stability at the concentration of 0.4%. However, Huang and Lee [123] reported
that the presence of albumin in the range of 0.01-0.5% had no influence on the corrosion
resistance of Ti6Al4V in artificial saliva. These conflicting results demonstrate that the
influence of albumin on Ti alloys is still in debate.
2.4.4.3 Combination effect of albumin and H2O2
There have been extensive investigations into the influence of organic species (e.g. albumin in
Section 2.4.4.2) or inorganic species (F-, H2O2 in Section 2.4.3) on the corrosion behaviour of
Ti alloys, but much fewer studies have reported the influence of the combination of multiple
species.
It has been reported that the addition of albumin in F--containing solutions significantly
increased corrosion resistance and decreased icorr and ipass, which protected Ti6Al4V from
Page 47
32
attack of F- [118, 123]. A similar protecting effect of albumin on CP-Ti and TiZr alloys was
also reported [128].
In terms of albumin and H2O2, it has been observed that increased adsorption of albumin
occurred on a H2O2 treated Ti surface [129, 130]. However, to our knowledge, the combination
effect of H2O2 and albumin on the corrosion of Ti alloys has not yet been reported. Padilla and
Bronson [25] mentioned the possible effect of H2O2 and albumin since H2O2 was regarded as
an intermediate species in oxygen reduction, however, there was no direct investigation on the
synergistic effect of the two species.
2.4.4.4 Effect of LPS on corrosion of Ti alloys
Significant levels of adherent LPS have been found to be present on Ti implant surfaces [131]
and as LPS is a constituent of the cell wall of Gram-negative bacteria, any implant with a
biofilm is likely to be associated with elevated LPS in the immediate environment. However,
the influence of LPS on Ti corrosion behaviour has received little attention and the findings
that have been reported to date are inconclusive [18]. By using electrochemical impedance
spectroscopy (EIS) and cyclic polarisation methods, it has been reported that the corrosion of
CP-Ti-G2 was increased in LPS-containing solution [18]. However, in the reported EIS results,
the polarisation resistance (Rp) of Ti in the presence of LPS was increased when compared with
that in the absence of LPS, indicating a lower corrosion rate [132]. Therefore the results appear
to be inconsistent. The influence of LPS on the corrosion behaviour of Ti alloys needs to be
clarified.
Page 48
33
2.4.5 Effect of prokaryotic cells (bacteria) on corrosion of Ti alloys
Biomedical implanted devices that penetrate skin or the oral mucosa will be associated with
surface biofilms [133, 134]. The bacteria in the oral environment readily accumulate on teeth
and adhere onto Ti dental implants, resulting in the formation of highly complex biofilms often
described as “plaque” [135]. The presence of a surface biofilm may in certain cases induce peri-
implant infection and/or lead to a peri-implant inflammatory response. This can take place early
and/or late following the implantation process [136].
For dental implants, there are two common types of surface finishes. One is a highly polished
surface and the other is rough surface usually obtained by a sandblasted (large grit)-acid-etched
(SLA) surface treatment. The highly polished surface is used as the top part of the dental implant
to inhibit the adhesion of bacteria. However, the surface of the bottom part is generally
roughened SLA surface in order to promote osseointegration after bony implantation [137-139].
Most studies on cellular interactions with Ti implant surfaces have focused on either the effect
on osseointegration and/or bacteria adhesion [135, 137-139] with much less attention paid to
the biological effects of bacteria on corrosion properties of Ti dental implant [93, 140].
It has been recently reported that Ti is susceptible to corrosion in the presence of Actinomyces
naeslundii [98] or Streptococcus mutans (S. mutans) [29, 141] by comparing the corrosion
resistance before and after exposure to the bacterial culture. In addition to comparing corrosion
resistance, Streptococcus sanguinis (S. sanguinis) and Lactobacillus salivarius were reported
to induce deterioration of the mechanical properties of the Ti implant [99] and the presence of
Streptococcus mitis (S. mitis) was found to lead to increased surface roughness of CP-Ti [93].
Page 49
34
Human oral flora is polymicrobial. Actinomyces naeslundii is able to co-aggregate with oral
streptococci (including S. mitis, S. sanguinis, and S. mutans), which were encountered in dental
plaque, caries or related to periodontal diseases [98, 142]. The influence of S. sanguinis may be
a particular interest. S. sanguinis is a Gram-positive bacterium and usually serves as an early
coloniser which facilitates adhesion of later species onto the surface of the biomaterial during
formation of dental plaque [142]. It has been shown that S. sanguinis is both acidogenic and
when cultured in aerobic environment it produces millimolar levels of H2O2 [143-145], which
may lead to degradation of the Ti implant.
2.4.6 Effect of human cells (leukocytes) on corrosion of Ti alloys
Studies on a variety of cell types found in the peri-implant environment (fibroblasts, osteoclasts
and macrophages) have demonstrated that cellular interactions with surfaces can cause changes
in corrosion properties of certain metallic implants including CP-Ti [30, 146-148], Ti6Al4V
[100, 149], stainless steel [147, 150] and CoCrMo [151].
It has been demonstrated that the pH values around the surfaces of CP-Ti decreased in the
presence of fibroblasts, which play an important role in wound healing process [146, 147]. It
has also been reported that the human osteoclast (bone resorption cells) could take up Ti ions
when cultured on Ti foil [148]. As shown in Figure 2-18, the presence of cells on an implant
surface is believed to retard diffusion of dissolved oxygen and ions and suppress the cathodic
reaction. Meanwhile, metal ions can be accumulated and hydrolysed at the interface, resulting
in a very localised pH reduction and destabilisation of the surface passive film [31].
Page 50
35
Figure 2-18 Influence of the presence of adhered cells on the corrosion of metallic
biomaterials [31].
Studies into the cellular effects on Ti corrosion often produce conflicting findings. It has been
reported that Ti release from CP-Ti surfaces was accelerated in the presence of rat macrophages
(an innate immune cell) [30], however other investigators have reported that the stability of the
oxide layer on Ti6Al4V surface was enhanced and the corrosion rate was reduced in the
presence of the mouse macrophage cell line [100, 149].
In vivo, following implantation or during inflammation both polymorphous nuclear leukocytes
(neutrophils) and macrophages migrate into the peri-implant environment. Although there has
been considerable focus on macrophages, it is neutrophils that are the first to arrive and in larger
numbers (54-65%) than macrophages [152]. Neutrophils are short lived (2-4 days) and are
formed from stem cells in the bone marrow and migrate from the circulation to the site of injury
or infection led by the release of signalling molecules at the damaged site. Neutrophils play a
critical role in dental peri-implant inflammation and have a number of microbiocidal killing
mechanisms [153, 154]. Importantly neutrophils can generate reactive oxygen species (ROS),
Page 51
36
including superoxide (O2-), hypochlorous acid (HOCl), H2O2 and chloramines [153, 155, 156],
which may be implicated in the degradation of the Ti implant. To date, most studies have
focused on the effect of corrosion products like TiO2 on the function and morphology of
neutrophils [152, 157, 158], but there has been little attention paid on the role of these cells
playing in the initial generation of these products.
2.4.7 In vitro studies on mechanically-assisted crevice corrosion (MACC)
2.4.7.1 Introduction
Mechanical disruption of passive films on Ti alloys can influence corrosion process and lead to
degradation of implants in vivo. Due to the inferior wear resistance, Ti alloys are normally not
used for the articulating surfaces of the femoral head/acetabular cup [159]. In a very few cases
Ti6Al4V has been used in the acetabular cup to support a polymer liner [160]. Ti alloys are
more widely used for hip stems and the modular tapers, which are susceptible to MACC.
However, most laboratory investigations have focused on tribocorrosion [36, 121, 161, 162] or
“fretting corrosion” with small scale movement [34, 35, 82] whilst very few studies have
focused on MACC [37, 38].
2.4.7.2 Experimental methods: apparatus
Devices with ball-on-disc, disc-on-block (or ball-on-pin), and pin-on-disc geometries are
commonly used to study tribocorrosion or “fretting corrosion” of the bearing interfaces between
Ti alloys and the counterbodies. The most commonly used counterbodies are Al2O3 spheres
with different diameters, however, some investigators have employed 30CrNiMo8 steel [163],
Page 52
37
Ti6Al4V [34], or CoCrMo [34] counterbodies against Ti alloys. Table 2-2 contains a summary
about previously reported testing apparatus.
Table 2-2 Summary of apparatus used for tribocorrosion, “fretting corrosion” and MACC. The
contact area diameter was calculated by Hertzian contact stress calculator [164] except that
*shows the contact area and **shows the diameter of pin part.
Type Reference Geometry Contact area
diameter
Movement
mode
Amplitude
of
vibration
Tribo-
corrosion
Type 1
(Figure
2-19a)
Komotori
[165]
ball-on-disc
fresh contact
~0.02 mm
reciprocating
linear 10 mm
Dimah [166] ball-on-disc fresh contact
~0.1 mm
circumferential
sliding 19 mm
Runa [36] ball-on-disc fresh contact
~0.07 mm N/A 2 mm
Licausi [162] ball-on-disc fresh contact
~0.1 mm
circumferential
sliding -
Tribo-
corrosion
Type 2
(Figure
2-19b)
Mathew [121,
161] ball-on-pin
same contact
~0.27 mm
rotation
(28 mm
diameter)
-
Cvijovic-
Alagic [163] disc-on-block
same contact
~0.37 mm
rotation
(35 mm
diameter)
-
Lomholt [160] disc-on-block N/A rotation N/A
Abrasion
(Figure
2-20)
Contu [167] tube-on-disc same contact
~0.2* rotation 0
“Fretting
corrosion”
(Figure
2-21)
Barril [35, 168,
169] ball-on-disc ~150 µm
reciprocating
linear 180 µm
Hiromoto
[122] ball-on-disc ~230 µm
reciprocating
linear 100 µm
Baxmann [82] ball-on-disc ~650 µm reciprocating
linear 10-50 µm
Vieira [170] ball-on-disc ~90 µm reciprocating
linear 200 µm
Swaminathan
and Gilbert
[34, 171]
pin-on-disc 350-800 µm** reciprocating
linear 50 µm
MACC
(Figure
2-22)
Goldberg and
Gilbert [37,
38]
assembling
manufactured
modular taper
~400 mm2* cyclic loading
(Figure 2-22)
<250 µm
[78, 83]
Page 53
38
Figure 2-19 shows two types of tribocorrosion tests. The device can be a commercialised
tribometer or similar apparatus with adjustment. The geometry in tribocorrosion type 1
(Figure 2-19a) is normally ball-on-disc and the contact area is relatively small (Table 2-2).
Importantly, the contact area is always fresh due to linear sliding or circumferential sliding
movement. Crevice geometry and crevice chemistry that would be observed during MACC
cannot be developed.
The geometries with ball-on-pin or disc-on-block are more commonly used in tribocorrosion
type 2 setups (Figure 2-19b). A ball or disc with a relatively large diameter is rotated against
the metal (pin or block) surface. The abrasion area on the metal surface is always located in the
same region (Table 2-2). However, the solution in the environment of the abrasion area is
readily refreshed by the bulk solution during this motion and the metal substrate tends to
repassivate quickly.
Page 54
39
Figure 2-19 (a) An example of tribocorrosion using similar commercialized tribometer with
ball-on-disc geometry and with 10 mm linear sliding replacement [165]; (b) an apparatus with
ball-on-pin [121] (or disc-on-block [163]) geometry with rotating ball (or disc) on metallic pin
(or block). The geometry was highlighted in red.
Page 55
40
Figure 2-20 shows an apparatus with a small diameter rotating Al2O3 tube (inner diameter
0.24 mm and outer diameter 0.52 mm) on a metallic disc [167]. During rotation, there was no
abrasion area (~0.2 mm2) contacting with the bulk solution. However, as long as the mechanical
stress stopped, the metal substrate was repassivated and the crevice cannot be maintained.
Figure 2-20 Abrasion setup with alumina tube on Ti surface with rotating periodical
movement [167].
Page 56
41
The “fretting corrosion” apparatus normally has a ball/pin-on-disc geometry and a horizontal
periodical micro-motion (<200 µm) [34, 35, 82, 170]. Figure 2-21 shows two examples of
devices with linear displacement generated by moving an Al2O3 ball or Ti6Al4V pad (with a
spherical head at the tip) against the Ti6Al4V surface [35, 82]. During the “fretting corrosion”
process the majority of the small contact area (Table 2-2) is readily flushed by bulk solution
(Table 2-2). The geometry of crevice and the development of an aggressive solution chemistry
inside crevice cannot be maintained. Although Swaminathan and Gilbert [34] reported the
possibility of crevice corrosion in their designed “fretting corrosion” apparatus, there was no
direct evidence except for a slight increase in recovery time after long time fretting under high
loads.
Figure 2-21 “Fretting corrosion” devices with ball-on-disc geometry and small amplitude of
motion (<200 µm) between the two bearing surfaces [35]. Fretting pad in (a) consisted of a
spherical head at the tip (radius of 16 mm) [82].
Page 57
42
Figure 2-22 shows an apparatus using typical manufactured implants to investigate MACC of
head-neck taper by Goldberg and Gilbert [37, 38]. It has been found that the OCP became
decreased and current became increased during long-term cyclic loading. In addition, the pH in
the gap between head and neck was also decreased by 0-3 units [37]. It was also observed that
the magnitudes of OCP change and current change were smaller after long-term cyclic loading
when compared with the change prior to the long-term cyclic loading [38]. It can be concluded
that currently there is no specific laboratory apparatus focusing on simulating MACC.
Figure 2-22 Schematic diagram of fretting crevice corrosion of head-neck taper by Goldberg
and Gilbert [38].
2.4.7.3 Effect of mechanical parameters
It has been reported that mechanical factors including load, amplitude of movement and
frequency/speed influence tribocorrosion or “fretting corrosion” of Ti alloys. It has been
observed that stick, slip or partial slip fretting regimes can be achieved by applying different
loads and different amplitudes of movement in the “fretting corrosion” apparatus [34, 168].
Decreased OCP or increased anodic current (potentiostatic measurement) during the abrasion
Page 58
43
process in tribocorrosion or “fretting corrosion” have been observed, due to the mechanical
rupture of passive film and exposure of the bare metal to the surrounding solution [162, 170].
In addition, the OCP under the abrasion condition was reported to decrease with increasing
loads [38, 167] or abrasion speed [165], while the abrasion current increased with increasing
load [122] or abrasion frequency [165, 169, 171], probably because of more effective rupture
of the passive film. However, Swaminathan and Gilbert [34] found that the abrasion current
was increased first and then decreased with increasing load during their “fretting corrosion”
experiments. They explained that sticking condition might appear under much higher loads,
which resulted in less effective displacement between two contacting surfaces. Therefore,
different phenomenon may be observed by using different apparatus.
2.4.7.4 Effect of chemical species
An increase, a decrease and no change of albumin on abrasion current of Ti alloys have been
reported, possibly due to the different experimental conditions (e.g. type of apparatus or applied
potential) [36, 122, 166]. For example, during “fretting corrosion”, it has been reported that the
abrasion current of Ti6Al4V did not significantly change in the solution with or without
albumin [122]. However, it was also observed that during tribocorrosion the presence of
albumin slightly decreased the abrasion current of Ti6Al4V at a low potential but it increased
the abrasion current at a high potential [36]. In addition, it has been reported that the presence
of albumin decreased the wear accelerated corrosion of Ti6Al4V-ELI during
tribocorrosion [166].
Very little attention has been paid to the effect of LPS and H2O2 on the tribocorrosion or
“fretting corrosion” of Ti alloys. One paper reported that the presence of LPS induced higher
Page 59
44
weight loss of CP-Ti and Ti6Al4V after tribocorrosion test [121]. The presence of H2O2 was
reported to increase weight loss and Ti release from a manual assembly containing a Ti6Al4V
plate and Ti6Al4V screw [172].
In summary, the effects of albumin, LPS and H2O2 on tribocorrosion or “fretting corrosion”
behaviour of Ti alloys still not fully understood, and further investigations are necessary. To
our knowledge, there is no report about their effect on MACC of Ti alloys.
2.5 Summary and aims
The aim of this project is to investigate how the simulated physiological environment including
chemical species (pH, LPS, H2O2 and albumin), biological cells (bacteria and neutrophils) and
MACC can influence the corrosion properties of Ti alloys.
The presence of bacteria has been observed in the peri-implant environment and can induce
peri-implant infection and inflammation. An important Gram-negative bacterial product, LPS,
has also been found to adhere to Ti surfaces and also serves as an important mediator of peri-
implant inflammation. However, the effects of bacteria and bacterial products on the corrosion
resistance of Ti are poorly understood. In addition, the role of the neutrophils the most abundant
immune cells during the peri-implant inflammation on corrosion behaviour of Ti alloys has not
been considered previously. The aim of this part of the study is to determine the effects of
bacteria bacterial products and neutrophils on Ti corrosion.
The effect of albumin on the corrosion of biomedical implant alloys is still debated and the
effect of H2O2 on Ti corrosion has also been the subject of considerable attention. However, the
combination of albumin and H2O2 has not been considered although this is a better
approximation of the peri-implant environment under inflammatory conditions. The aim of this
Page 60
45
part of the study is to determine the combined effect of albumin and H2O2 on corrosion
behaviour of Ti alloys.
MACC has been previously been reported as a key degradation mechanism of Ti implants, but
relatively little investigation has focused on electrochemical aspects of MACC of Ti alloys
under realistic conditions where an aggressive solution develops in the crevice between the two
components. The aim was to develop and fabricate a MACC simulation apparatus to investigate
the effect of the chemical species (albumin, LPS, and H2O2) on MACC of Ti alloys.
Page 61
46
3 MATERIALS AND METHODS
3.1 Ti sample preparation
3.1.1 Mirror-polished surface
Commercial purity ASTM Grade 2 Ti (lower Fe content, CP-Ti-G2), commercial purity ASTM
Grade 4 Ti (higher Fe content, CP-Ti-G4) and ASTM Grade 5 Ti (Ti6Al4V) were commercially
sourced (Titanium Products Ltd, Solihull, UK) and the compositional analysis was acquired
(Table 3-1). Nominally identical disc-shaped specimens of CP-Ti-G2 and CP-Ti-G4 (14 mm
diameter and 1 mm thickness) were machined by the supplier (Titanium Products Ltd, Solihull,
UK). The surfaces were subsequently ground to a consistent finish using sequential grades of
SiC abrasive paper from P400, through P800, P1200, P2400 to P4000 grit with deionised water
as a lubricant. Ti6Al4V disc-shaped specimens (14 mm diameter and 1.2 mm thickness) were
prepared using abrasive cloths MD-Piano (Struers, Rotherham, UK) with deionised water as a
lubricant, followed by MD-Largo with a 9 µm diamond suspension as a lubricant. Finally all
three grades of Ti were polished with a MD-Chem polishing cloth (Struers, Rotherham, UK)
using 0.04 µm OP-S Colloidal Silica suspension (Struers, Rotherham, UK) to produce a mirror
finish on both sides. All samples were thoroughly cleaned in acetone, ethanol, and deionised
water sequentially using ultrasonic agitation for 10 min at each stage. Specimens were finally
dried in an air stream before further experiments.
Page 62
47
Table 3-1 The composition of CP-Ti-G2, CP-Ti-G4 (Manufactures compositional certificate,
wt%) and Ti6Al4V (ASTM standard F1108-97A, wt%).
Substrate N C H Fe O Residual Al V Ti
CP-Ti-G2 <0.01 0.01 0.002 0.03 0.11 <0.1 Bal.
CP-Ti-G4 0.006 0.007 0.002 0.22 0.30 <0.1 Bal.
Ti6Al4V max.
0.05
max.
0.08
max.
0.015
max.
0.3
max.
0.2 5.5-6.8 3.5-4.5 Bal.
3.1.2 Sandblasted-acid-etched (SLA) surface
A SLA surface was obtained by sandblasting both sides of all three grades of Ti discs (CP-Ti-
G2, CP-Ti-G4 and Ti6Al4V, all of which had been previously ground to a P400 finish with SiC
abrasive paper) with 250 µm corundum particles (Korox®, BEGO) (SANDIMAT, Local
exhaust ventilation, Allianz Engineering Inspection Service Ltd, Italy), and then cleaning in
deionised water using ultrasonic agitation for 15 min. The samples were then etched in the
combination solutions of 37% HCl and 98% H2SO4 (1:1) at 80 °C for ~4 min and then washed
in deionised water. All samples were thoroughly cleaned in acetone, ethanol, and deionised
water sequentially using ultrasonic agitation for 10 min at each stage. Specimens were finally
dried in an air stream before further experiments. It can be seen that the home-produced SLA
surfaces of three grades of Ti are consistent with the commercial dental implant SLA surface
finish (Figure 3-1).
Page 63
48
Figure 3-1 SEM images of SLA surface finish of (a-b) a commercial CP-Ti dental implant
(Straumann® SP Ø4.1 RN SLA, Institute Straumann AG) and home-produced (c-d) CP-Ti-G2;
(e-f) CP-Ti-G4; and (g-h) Ti6Al4V.
Page 64
49
3.2 Immersion tests
3.2.1 Effect of pH and lipopolysaccharide (LPS) on Ti corrosion
Physiological saline (0.9% NaCl, w/v (i.e. 0.9 g NaCl in 100 mL solution)) (ASTM F1801-
97(2009)e1) was used as an immersion solution for metal release measurements. The use of
more complex physiological solutions containing phosphates was avoided to reduce the risk of
polyatomic interferences occurring in inductively coupled plasma mass spectrometry (ICP-MS)
measurements of solutions containing Ti [173]. Each solution was modified according to two
experimental factors, pH (at 4 levels) and LPS (with or without the addition of LPS). The pH
value was measured with a calibrated Ø40 pH meter (Beckman Instruments, California, USA)
and subsequently modified to pH 7, 5.5, 4 or 2 by adding lactic acid (Sigma-Aldrich, Dorset,
UK) or NaOH (Sigma-Aldrich, UK). To investigate the effect of LPS, a further series of test
solutions at each pH were prepared containing 150 µg/mL of LPS (Escherichia coli LPS
055:B5, Sigma-Aldrich) with the pH re-measured immediately after LPS addition. To minimise
contamination with elements of interest for subsequent mass spectrometry measurements,
ultrapure water (Gibco®, life technologies™, Paisley, UK) and mass spectrometry grade
reagents were used.
All prepared mirror-polished Ti samples were immersed in 2 mL of test solution in a 30 mL
universal tube (transparent polystyrene with conical bottom) which was sealed to prevent
evaporation. For each experimental condition, three samples of each Ti grade (CP-Ti-G2, CP-
Ti-G4, and Ti6Al4V) were immersed in separate containers and incubated at 37 °C. The
samples were consistently positioned so that the periphery of each disc made multiple point
contacts with the radius of the container but allowed the majority of the surface area to be
Page 65
50
exposed to the immersion solutions. Samples were gently agitated on an A500 orbital mixer
(Denley, UK) for 1 hour per day. For each sample, the test solution was retrieved and replaced
with fresh solution after 7 days. The pH of the prepared test solutions were measured
immediately before use on each occasion. Following 4 weeks of immersion, the retrieved
solutions for each sample were pooled together to form a total of 8 mL which was then used for
ICP-MS measurements. The exposed surface area of Ti6Al4V samples was ~2% greater (due
to the thicker discs) than CP-Ti-G2 and CP-Ti-G4 samples, but this was not taken into account
in the interpretation of the ICP-MS data as the difference was significantly smaller than the
typical variation in the results.
3.2.2 Effect of H2O2 on Ti corrosion
H2O2 (30% w/v (i.e. 30 g H2O2 in 100 mL solution), BDH, England, UK) was added into
physiological saline (0.9% NaCl, pH 6.7-7, 0.15 M) to create the immersion solutions with four
concentrations of H2O2: 0.1% (0.03 M), 0.5% (0.15 M), 1% (0.3 M) and 10% (3 M). Due to the
decomposition of H2O2, all the prepared H2O2-containing solutions and the original H2O2 were
stored at 4 °C in dark environment and used within 1 month. The experimental procedures for
immersion testing and ICP-MS measurements are described in Section 3.2.1.
3.2.3 Effect of H2O2 in combination with albumin on Ti corrosion
To investigate the effect of the combination of H2O2 and albumin on Ti6Al4V corrosion, four
concentrations of bovine serum albumin (≥ 98% (agarose gel electrophoresis) lyophilised
powder, Sigma-Aldrich, Dorset, UK), i.e., 0.2% (0.03 mM), 0.4% (0.06 mM), 1% (0.15 mM),
4% (0.6 mM), were added into the previously prepared 0.1% H2O2 in physiological saline. The
storage method for the prepared solutions was the same as described in Section 3.2.2.
Page 66
51
The experimental procedures for immersion testing were otherwise the same as described in
Section 3.2.1 except for the immersion period. The test solution for each sample was retrieved
and replaced with fresh solution after 7 days. Following 2 weeks of immersion, the retrieved
solutions were pooled together to form a total of 4 mL for ICP-MS measurements.
3.3 Culture of Streptococcus sanguinis (S. sanguinis) on Ti surfaces
The prepared mirror-polished and SLA samples (including CP-Ti-G2, CP-Ti-G4 and Ti6Al4V)
were autoclaved for 30 min at 120 °C 24 hours prior to use. S. sanguinis were pre-incubated on
horse blood agar (SR0050B, Oxoid) overnight in an anaerobic chamber with environmental
conditions of 10% CO2, 10% hydrogen and 80% nitrogen as the balance (Don Whitley
Scientific, Molecular Atmosphere Controlled System, CAL-3200, Shipley UK). Following pre-
incubation, S. sanguinis was transferred into 10 mL of autoclaved artificial saliva (composition
identified in Table 3-2) [174] and then cultured in an aerobic incubator overnight at 37 °C (NB-
205, N-BIOTEK, Inc., Korea) with agitation at 100 rpm. 100 μL of the bacterial suspension
(average ~4×10⁵ CFU/mL) was then added into 5 mL of artificial saliva into which a Ti disc-
shaped sample had been pre-immersed. Three Ti samples were used for each condition. The Ti
discs submerged in the inoculated artificial saliva were subsequently incubated aerobically at
37 °C.
In order to maintain bacterial viability over the prolonged immersion time (30 days), the
immersion culture-media was retrieved and replaced with 5 mL of fresh artificial saliva every
3 days. At each renewal of the culture-media a further 100 μL of bacterial inoculum (average
~4×10⁵ CFU/mL) was introduced. Over 30 days the culture was replaced on nine occasions.
The retrieved culture-medium was centrifuged at 4000 rpm for 10 min at 4 °C to obtain
Page 67
52
bacterial pellets (~0.1 mL) and a separated supernatant. The supernatant collected on day 3, day
12, day 21, and day 30 were stored at 4 °C for elemental concentration measurements. After 30
days, the 10 retrieved bacterial pellets were lysed in 100 μL 69% nitric acid (BDH, UK) and
then pooled. Subsequently the pooled solutions were diluted to a 2% concentration of nitric acid
using ultrapure water and then stored at 4 °C before ICP-MS measurements.
Mirror-polished and SLA treated Ti control samples were also immersed in artificial saliva
without bacteria. The test-samples were immersed in 5 mL of artificial saliva and incubated for
4 weeks. For each sample, the test culture-medium was retrieved and replaced with new
solutions after 7 days. Following 4 weeks of immersion, the retrieved solutions for each sample
were pooled together for ICP-MS measurements.
To visualise the formation of a S. sanguinis biofilm on the Ti surfaces after 30 days of
incubation, the retrieved Ti samples were fixed with 2.5% glutaraldehyde (EM grade, Agar
Scientific, UK) in 0.1 M sodium cacodylate for 1 hour. Dehydration and cell conservation prior
to electron microscopy imaging were performed by immersing the Ti discs serially into from
30%, 40%, 50%, 60%, 70%, 80%, 90%, 95% (twice), 100% (twice) ethanol for at least 10 min
at each stage of the gradient. Final drying was achieved using a critical pointer dryer.
Page 68
53
Table 3-2 The composition of artificial saliva [174].
Substance Concentration Supplier
NaCl 0.35 g/L Sigma-Aldrich, UK
KCl 0.2 g/L BDH, UK
CaCl2 0.2 g/L BDH, UK
Lab lemco powder 1 g/L Oxoid Limited, UK
Yeast extract 2 g/L Oxoid Limited, UK
Mucin 2.5 g/L Sigma-Aldrich, UK
Peptone 5 g/L Fluka, US
Sterile filtered urea 40% (1.25 ml per 1L) Sigma-Aldrich, UK
Ultrapure water N/A Gibco®, life
technologies™, UK
3.4 Incubation of Ti with isolated human neutrophils
3.4.1 Incubation of isolated human neutrophils on Ti surfaces
Peripheral blood neutrophils were isolated from the whole blood of healthy volunteers and the
detailed procedures followed those originally described in reference [16]. Briefly, ~6 mL of
whole blood was collected into a lithium heparin coated tube using standard venepuncture
techniques. The whole blood was then transferred onto a Percoll® gradient (by layering 8 mL
of 1.079 Percoll® density over 8 mL 1.098 of Percoll® density, GE Heathcare,
Buckinghamshire, UK) (Table 3-3) and centrifuged (8 min at 150 rcf and then 10 min at
1200 rcf) to separate the cellular contents into different layers. The top plasma layer and
lymphocyte layer were carefully discarded by using a plastic pipette. The target neutrophil layer
located below these two and at the top of the red blood cell layer was then transferred to a
50 mL centrifuge tube which contained 15 mL of prepared lysis buffer (Table 3-4) and was
then incubated at room temperature for 5 min to lyse any contaminant red blood cells
Page 69
54
(erythrocytes). A concentrated neutrophil pellet was subsequently obtained by further
centrifuging (6 min at 500 rcf) and discarding the supernatant. The pellet was further cleaned
in lysis buffer once, in phosphate buffered saline (PBS, 7.75 g/L NaCl (Sigma-Aldrich, UK),
0.2 g/L KH2PO4 (Sigma-Aldrich, UK) and 1.5 g/L K2HPO4 (Sigma-Aldrich, UK)) twice, and
then finally in 0.25 mM of Tris-buffered saline (Tris-buffer, 1 mM MgCl2 (BDH, UK), 1.5 mM
CaCl2 (BDH, UK) and 1 mM glucose (Sigma-Aldrich, UK)) three times with centrifugation for
6 min at 500 rcf at each stage.
The number of isolated neutrophils was counted by using a light microscope (LeitzLaborlux S,
Germany) and a haemocytometer (Neubauer, Reichart, Germany). The viability of neutrophils
(10 μL) was determined using Trypan Blue exclusion (Sigma-Aldrich, UK) and was
typically >98%. The neutrophils were used by re-suspending into Tris-buffer to obtain a
concentration of 2.5×10⁶ cells/mL for the in vitro neutrophil incubation assays.
Table 3-3 The composition of Percoll® densities [16]
Density (g/mL) 1.079 1.098
Percoll® 19.708 mL 24.823 mL
Deionised water 11.792 mL 6.677 mL
1.5 M NaCl 3.5 mL 3.5 mL
Table 3-4 The composition of lysis butter [16]
Substance Concentration Supplier
NH4Cl 8.3 g/L Sigma-Aldrich, UK
KHCO3 1 g/L Sigma-Aldrich, UK
C10H14N2Na2O8·2H2O 0.04 g/L Sigma-Aldrich, UK
Bovine serum albumin 2.5 g/L Sigma-Aldrich, UK
Sterile deionised water N/A Versol, Somerset, UK
Page 70
55
0.5 mL of the neutrophil suspension was added into 24 well cell culture plates, in which mirror-
polished Ti discs of three grades (CP-Ti-G2, CP-Ti-G4 and Ti6Al4V) had been placed. The
experimental groups were designated as Cell-Control (with no Ti discs), CP-Ti-G2-Cell, CP-
Ti-G4-Cell and Ti6Al4V-Cell. All samples were incubated in 5% CO2 at 37 °C for 8 h. Half of
the samples from each group were stimulated by the addition of 12.5 μL of opsonised
Staphylococcus aureus (Ops Sa, the preparation of Ops Sa shown in Section 3.4.2) and
designated as Ops Sa-Control, CP-Ti-G2-Ops Sa, CP-Ti-G4-Ops Sa and Ti6Al4V-Ops Sa.
Tris-buffer solution without neutrophils was also added into the cell culture plates with mirror-
polished Ti discs as the blank control groups. After 8 h incubation, the Tris-buffer solutions or
neutrophil suspensions were pooled together for each control group and each experimental
group. It should be noted that the sample measured by ICP-MS for each test of each group was
created by pooling together 24 identical experimental repeat samples generated under the same
conditions to achieve the required volume for the ICP-MS measurements (Figure 3-2). For each
ICP-MS test, neutrophils were isolated from 4 or 5 individuals (due to different numbers of
neutrophils in different people) to obtain enough cells to be distributed among the experiment
groups (n=24 per group, 8 groups in total) (see Figure 3-2). Three ICP-MS tests were carried
out for each group. It is worth noting that neutrophils were sourced from 12 different volunteers
for all experiments (see Figure 3-2). All the collected solutions in each test were lysed by adding
300 µL 69% nitric acid for 3 days, and were refrigerated at 4 °C prior to elemental
concentration measurement.
To characterise the neutrophils on Ti discs, samples previously incubated with neutrophils for
8 h were fixed with 2.5% glutaraldehyde in PBS for 1 h. Cell dehydration and subsequent
procedures were the same as described in Section 3.3.
Page 71
56
Figure 3-2 The experimental procedures for ICP-MS tests for all the experimental and control
groups in the absence or presence of un-stimulated (Cell group) or stimulated neutrophils by
Ops Sa (Ops Sa group). For each test, neutrophils were isolated from 4 or 5 individuals (due to
different numbers of neutrophils in different people) to obtain enough cells to be distributed
among the experiment groups (solid circles with different colours representing different
neutrophils sources). The sample was created by pooling together 24 experimental repeat
samples (each circle stands for one sample, also meaning different ICP-MS test has different
neutrophils). In the absence of neutrophils, samples in blank control groups (including CP-Ti-
G2, CP-Ti-G4 and Ti6Al4V) were also obtained by pooling 24 identical samples.
3.4.2 Preparation of opsonised Staphylococcus aureus (Ops Sa)
To prepare Ops Sa, sterile tryptone soya broth (TSB) was inoculated by transferring
Staphylococcus aureus (Sa) grown on a Mannitol salt agar (ThermoFisher Scientific, Oxford,
UK) plate using a flame sterilised loop to TSB. The bacteria were then cultured overnight in an
anaerobic chamber comprised of 10% CO2, 10% hydrogen and 80% nitrogen at 37 °C. The
bacterial suspension was centrifuged (5 min at 3800 rcf) to obtain a pellet, which was re-
suspended in PBS. The procedure was repeated three times before the bacterial pellet was
Page 72
57
finally re-suspended in 3% formaldehyde (P6148, Sigma-Aldrich, UK) in PBS and incubated
for 1 h at room temperature. The bacteria were again centrifuged and re-suspended in PBS three
times. The concentration of bacteria was then estimated according to spectrophotometry
measurement to obtain a concentration of 1×10⁹ bacteria per mL. The bacteria suspension was
heat-killed at 80 °C for 20 min. After this, 33 μL Vigam liquid (5 mg/mL IgG, Bio Products
Laboratory, Hertfordshire, UK) per mL of bacteria suspension was added into the bacteria
suspension, which was incubated overnight at room temperature to allow opsonisation. The
final bacteria suspension was obtained by being centrifuged and re-suspended in PBS twice and
stored at -80 °C. Bacterial numbers were estimated according to spectrophotometry
measurement to achieve a concentration of 6×10⁸ bacteria/mL.
3.5 Determination of released metal concentration
The retrieved and pooled solutions for ICP-MS test in Section 3.2.1, Section 3.2.2 and Section
3.2.3 were syringe-filtered (Acrodisc® 32 mm syringe filter with 0.45 µm Supor® membrane,
Pall Newquay, UK) and refrigerated at 4 °C prior to measurement of elemental concentration.
Elemental Ti, Al and V concentrations in the immersion solutions were quantified using ICP-
MS (University of Birmingham, Agilent 7500ce ICP-MS, Agilent Technologies, UK) where
the detectable limits for Ti, Al and V were 0.2 ppb.
The supernatant, the bacterial pellet samples and the control samples in Section 3.3 or the
pooled culture-media from the neutrophil incubation group in Section 3.4 were also syringe-
filtered and refrigerated at 4 °C prior to ICP-MS measurement (Agilent 7500ce ICP-MS or
Agilent 7700x ICP-MS (measurements commercially sourced with Butterworth Laboratories,
Company registration No. 1185121, Teddington, UK)) where the detectable limit for Ti was
Page 73
58
0.2 ppb for Agilent 7500ce ICP-MS and 1 ppb for Agilent 7700x ICP-MS (the values reported
below 1 ppb are just for information to indicate below detectable limit).
For the effect of pH and LPS on Ti release, initially two-way Analyses of Variance (ANOVA)
were used to identify significant differences between ICP-MS measurements (α =0.05) where
the factors were Ti grade (at 3 levels) and pH (at 4 levels) with tests run independently for
samples with and without LPS. Subsequently, further two-way ANOVAs were conducted for
each Ti grade where the factors were LPS (at 2 levels) and pH (at 4 levels). Post-hoc Tukey
tests (α =0.05) were used to identify significant differences between individual groups.
3.6 Electrochemical tests
3.6.1 General procedures
A standard three-electrode cell with reference electrode, counter electrode and working
electrode is shown in Figure 3-3. The counter electrode (CE) was a Pt mesh (working area
~4 cm2) and the reference electrode (RE) was a commercial saturated calomel electrode (SCE).
The potential was controlled with a potentiostat (ACM Instruments, UK). Ti discs were
mounted in VARI-SET cold mounting acrylic (MetPrep Ltd, UK) and used as working
electrode (WE, working area 1.5 cm2). The electrode was polished to a mirror surface using
identical sample preparation methods as detailed previously in Section 3.1.1. To obtain a good
reproducibility, the time between polishing and electrochemical measurements was controlled
using the following procedures throughout. After final polishing with an MD-Chem polish cloth,
the samples were immediately cleaned with deionised water (Millipore, 18 M), then dried in
an air stream and left in open air for 5 min before immersing in test solutions (which were
defined as freshly polished samples). Due to the preparatory procedures of setting up the
Page 74
59
electrochemical cell, there was a 5 min gap between the initial immersion of the sample and
acquisition of the first measurement.
The electrochemical cell was immersed in a water bath (Bennett Scientific Limited, Nickel
Electro LTD, England, UK) with high temperature stability (±1 C). The temperature was
monitored with a thermocouple (YC-727UD date logger thermometer, Taiwan) connected to
the computer (Figure 3-3).
Figure 3-3 The experiment setup of the electrochemical cell; RE: reference electrode, CE:
counter electrode, WE: working electrode. ACM: Potentiostat (ACM Instruments, UK).
3.6.2 Potentiodynamic polarisation curves
3.6.2.1 Measurements in HCl
Freshly polished CP-Ti-G2, CP-Ti-G4 and Ti6Al4V electrodes were immersed in 2 M HCl at
37 °C. The open circuit potential (OCP) was measured for 1 h and then anodic polarisation
curves were measured by sweeping the potential from -50 mV below the OCP to 0 mV vs. SCE
Page 75
60
at a rate of 1 mV/s. The anodic polarisation curves were measured three times for each condition,
using a freshly polished sample and fresh solution in each case.
3.6.2.2 Effect of pH and LPS on Ti corrosion
Anodic and cathodic polarisation curves were measured separately. Freshly polished CP-Ti-G4
and Ti6Al4V electrodes were immersed in physiological saline solutions (0.9% NaCl, which
was adjusted to either pH 2 or pH 4 with lactic acid, with or without the addition of LPS) at
37 °C. OCP was measured for 1 h. Anodic polarisation curves were measured by sweeping the
potential from -50 mV below the OCP to 600 mV vs. SCE while cathodic polarisation curves
were obtained by sweeping the potential from 50 mV above OCP to -900 mV vs. SCE at a rate
of 1 mV/s. The polarisation curves were measured three times for each condition, using a
freshly polished sample and fresh solution in each case.
3.6.2.3 Effect of H2O2 on Ti corrosion
To investigate the effect of H2O2, anodic polarisation curves of freshly polished CP-Ti-G4 and
Ti6Al4V were measured in physiological saline (0.9% NaCl, pH 6.7-7, 0.15 M) with and
without different levels of H2O2 (0.1%, 1% and 10%). The experimental procedures were the
same as described in Section 3.6.2.2 except that anodic polarisation curves were measured by
sweeping the potential from -50 mV below the OCP to 1200 mV (instead of 600 mV) vs. SCE
while cathodic polarisation curves were obtained by sweeping the potential from 50 mV above
OCP to -1400 mV (instead of -900 mV) vs. SCE.
Page 76
61
3.6.2.4 Effect of the combination of H2O2 and albumin on Ti corrosion
To investigate the effect of the combination of H2O2 and albumin on the corrosion behaviour
of Ti6Al4V, the anodic and cathodic polarisation curves of freshly polished Ti6Al4V were
measured in four concentrations of albumin (0.2%, 0.4%, 1%, and 4%) with and without 0.1%
H2O2 in physiological saline. The experimental procedures were the same as described in
Section 3.6.2.3 except that the polarisation curves for Ti6Al4V in the mixed solutions of
albumin and H2O2 were measured twice for each condition, using a freshly polished sample and
fresh solution in each case.
3.6.3 Potentiostatic measurements
3.6.3.1 Measurements in HCl
The corrosion behaviour of Ti6Al4V in the presence of 2 M HCl was studied by potentiostatic
measurements at various temperatures (28 °C, 31 °C, 34 °C, 37 °C, 40 °C, and 43 °C). The
temperature was controlled by water bath and the temperature was recorded by a thermocouple,
which was immersed in the solution (Figure 3-3). Freshly polished Ti6Al4V was immersed in
2 M HCl. OCP was measured for 30 min and then -510 mV vs. SCE was applied for 3 h.
In addition, the surface morphology of Ti6Al4V was compared using SEM before and after
potentiostatic measurements on the same sample at 37 °C. Briefly, to easily locate a same region
for comparison, one region of the mirror-polished sample was identified by a hardness mark
(Vickers hardness test, load: 300 g, MVK-H1 hardness testing machine, Akashi Corporation
Sagami Plant, Mitutoyo, Zama Kanagawa, Japan), which was characterised by SEM. The
carbon layer on the surface from SEM was removed by quickly (~10 s) polishing the sample
Page 77
62
on an MD-Chem polish cloth with OP-S Colloidal Silica suspension, so that it would not affect
the electrochemical experiments.
3.6.3.2 Effect of pH and LPS on Ti corrosion
Potentiostatic studies were performed to investigate the effect of the addition of LPS on the
passive current density of CP-Ti-G4 and Ti6Al4V at pH 2 and pH 4. Freshly polished CP-Ti-
G4 or Ti6Al4V discs were immersed in physiological saline which had been adjusted to pH 2
or pH 4, and a potential of 600 mV vs. SCE was applied. After 1000 s, LPS was added to obtain
a concentration of 150 µg/mL in the immersion solution. Following the LPS addition, the
solution was stirred continuously for 100 s. To investigate the effects of agitation of the
immersion solution on the passive current, the immersion solution was stirred again for 100 s
following 1000 s intervals on two separate occasions. The experiment was repeated twice for
each Ti grade and each pH condition, using a fresh polished sample and solution in each case.
Control experiments were conducted using an identical method with the exception of LPS
addition.
3.6.3.3 Effect of H2O2 on surface morphology of Ti6Al4V
The surface morphology of Ti6Al4V was compared using both SEM and AFM before and after
the potentiostatic measurement in the presence of H2O2. Mirror-polished Ti6Al4V was
immersed in 10% H2O2 in physiological saline at 37 °C. OCP was measured for 1 h and then a
potential of 600 mV vs. SCE was applied for 30 min. The methods for identifying the same
region of the sample and removing the carbon layer from SEM are the same as the procedures
described in Section 3.6.3.1.
Page 78
63
3.6.3.4 Effect of the combination of H2O2 and albumin on Ti corrosion
Potentiostatic measurements were performed to investigate the effect of addition of albumin
and H2O2 on the anodic and cathodic steady state currents for Ti6Al4V in physiological saline.
Table 3-5 shows the detailed experimental procedures. The experiment was repeated twice for
each condition using a freshly polished sample and fresh solution in each case.
Table 3-5 Experimental procedures for potentiostatic measurements of Ti6Al4V at different
applied potentials (-800 mV, 400 mV, 800 mV vs. SCE) in physiological saline (PS) with
different sequences for H2O2 and/or albumin addition at 37 °C. The solution was stirred for
~100 s at ~1000 s intervals to ensure complete mixing; for some experiments, a specific amount
of H2O2 or albumin (in PS) was added at ~1000 s intervals immediately before stirring to give
a final concentration of 0.1% or 1%.
1st
~1000 s
100 s
stir
2nd
~1000 s
100 s
stir
3rd
~1000 s
100 s
stir 1000 s
PS +1% albumin +0.1% H2O2
PS +0.1% H2O2 +1% albumin
PS +0.1% H2O2
3.6.4 Long-time (24 h) open circuit potential (OCP) measurement
3.6.4.1 Effect of combination of H2O2 and albumin on Ti corrosion
The OCP of mirror-polished Ti6Al4V in physiological saline with and without addition of H2O2
and/or albumin were all monitored for 24 h at 37 °C. Table 3-6 shows the detailed experimental
procedures. The experiment was repeated twice for each condition using a freshly polished
sample and fresh solution in each case.
Page 79
64
Table 3-6 Experimental procedure for 24 h OCP measurement of mirror-polished Ti6Al4V in
physiological saline (PS) with different sequences for H2O2 and/or albumin addition at 37 °C.
The solution was stirred for ~200 s at ~1 h and ~4 h to ensure complete mixing; for some
experiments, a specific amount of H2O2 or albumin (in PS) was added at ~1 h or ~4 h
immediately before stirring to give a final concentration of 0.1% or 4%.
3.7 Mechanically-assisted crevice corrosion (MACC)
3.7.1 Development of an MACC electrochemical cell
An MACC apparatus was designed (Figure 3-4), manufactured and developed in the current
study. It comprised a standard three-electrode cell with RE, CE and WE (Figure 3-5) and was
controlled with a potentiostat. The CE was a Pt mesh and the RE was an Ag/AgCl electrode.
All potentials in the context of MACC are quoted against this reference scale.
Time
~1 h
200 s
stir
Time
~3 h
200 s
stir
Time
~20 h
PS +0.1% H2O2
PS
PS +0.1% H2O2 +4% albumin
PS +4% albumin +0.1% H2O2
PS +4% albumin
Page 80
65
Figure 3-4 Schematic diagram of the designed MACC apparatus. The dimensions of the vertical
section have been shown. The vertical loads (250 g to 3200 g) can be adjusted by adding
different weights of the metal substrates. The vertical section was controlled by a rotation
controller, which made the section rotate clockwise or anti-clockwise in a rotating speed of 0.1-
10 rpm in a step of 0.1 rpm.
Figure 3-4 shows the vertical section of MACC apparatus with dimensions. The rotation of the
device was controlled by a step-motor with a good control of the speed (Powermax II®, Model:
M22NRXB-LNN-NS-OO, Pacific scientific, USA). The rotation speed can be varied from 0.1
to 10 rpm in a step of 0.1 rpm. The direction of the rotation can be clockwise and anti-clockwise.
Page 81
66
However, all abrasion experiments were carried out in the clockwise direction in this study. In
addition, various vertical loads (250 g to 3200 g) can be applied by adding different weights of
the metal substrates (Figure 3-5).
Figure 3-5 Picture of the experiment setup of the MACC electrochemical cell.
Page 82
67
The Ti6Al4V couple comprised a “male” rotating component (external diameter 10 mm) which
was lowered into a “female” stationary component (external diameter 20 mm) with a cavity
facing upwards (Figure 3-5). The female component was prevented from rotating by a nylon
peg (Figure 3-5).
The working electrode (WE) connection was made to the male component, but when the two
component were in mechanical contact, current could flow between them. The total working
area of the WE (the area immersed in the solution) was 910 mm2 when the volume of test
solution was 15 mL. The macroscopic contact area between the rotating part and stationary part
was ~110 mm2 (Figure 3-6), and the abraded area was difficult to define, so the current rather
than current density is reported.
Page 83
68
Figure 3-6 Schematic diagram of the vertical section of the MACC couple and the crevice
geometry. Nylon peg is used to prevent the stationary part from rotating.
3.7.2 General procedures
The two components of the Ti6Al4V couple, including the Ti6Al4V rotating part and Ti6Al4V
stationary part, had an as-machined surface finish. The two components were re-used for all of
the tests. The contact surfaces were just cleaned with deionised water (no other treatment)
before each test. Generally, the Ti6Al4V couple was separately immersed in the physiological
saline (0.9% NaCl, pH 6.7-7, 0.15 M) for 300 s. Then the two parts were connected by applying
vertical loads and OCP was measured concurrently. Afterwards, potentiostatic or
potentiodynamic measurements were conducted in different tests.
Page 84
69
There were both solutions and black debris found in the cavity in the stationary part of the
couple. Due to the small volume of the solution (~0.02 mL) in the cavity, the pH was corrected
by measuring the pH of the diluted solution (by adding 2-3 mL physiological saline (pH 6.7-
7)), and adjusting the value to take account of the dilution.
3.7.3 Effect of the crevice geometry
The crevice geometry of the MACC apparatus was manifested in physiological saline with pH
indicator (MACC test-1, Figure 3-7). After static OCP (no rotation) measurement, a potential
was applied and according current was monitored. Photos have been taken to show the pH
change of the solution during the static and abrasion processes. Before uncoupling the two parts,
the solution was collected in a container by a syringe. After uncoupling, the collected solution
was added to the cavity in the stationary part and PEEK container for comparison (Figure 3-7).
The crevice geometry was also manifested in physiological saline with pH indicator at free
corrosion condition. OCP variation was monitored under static and abrasion conditions. Photos
have also been taken to show pH change of the solution.
Page 85
70
Figure 3-7 Pictures of the Ti6Al4V couples (MACC test-1) immersed in the physiological
saline (pH 6.7-7) with pH indicator. The solution was collected in a container as shown in the
figure before uncoupling, and then added again into the cavity of the stationary part and PEEK
container after uncoupling for pH comparison.
3.7.4 Surface morphology of abrasion scars and abrasion debris
The morphology of the stationary part has been characterised by optical microscope and SEM
after MACC-test 1. To investigate the surface morphology of the black debris, another MACC
test (MACC test-2) was conducted in physiological saline without pH indicator. After the
MACC test-2, black debris in the cavity of the stationary part were collected carefully with a
syringe and cleaned with deionised water. One droplet of the debris solution was put onto a
carbon or copper tape and left to dry overnight, and then it was characterised with SEM.
Page 86
71
3.7.5 Effect of rotation speed on abrasion OCP
To investigate the effect of rotation speed on abrasion OCP of the Ti6Al4V couple in
physiological saline, different rotation speeds were applied sequentially with 600 s interval
between each two speeds. The Ti6Al4V couple was cleaned with deionised water (no other
treatment) before the application of each sequence of rotation speeds. The tests were measured
twice for each condition, using a fresh solution in each case.
3.7.6 Effect of rotation speed on abrasion current
The static OCP of the Ti6Al4V couple was measured for 600 s before a potential of 0 mV vs.
Ag/AgCl was applied. Different rotation speeds were applied sequentially with 200 s intervals
between every period of revolution. The tests were measured twice for each condition, using a
fresh solution in each occasion.
3.8 Surface characterisation
3.8.1 SEM
Ti surfaces before and after immersion or electrochemical tests were characterised by scanning
electron microscopy (SEM), which was undertaken on Philip XL-30 (Electron source: LaB6,
Fei, Nederlands) or JEOL 7000 (Japan Electron Optics Laboratory Co., Ltd. accelerating
voltage is 20 kV, beam current is ~70 μA). Both secondary electron mode (SE) and backscatter
electron mode (BSE) were used.
Page 87
72
3.8.2 EDX
The elemental composition of Ti surfaces before and after immersion or electrochemical tests
was analysed by energy dispersive X-ray spectroscopy (EDX detector model: 7558 for JEOL
7000 and 6650 for Philip XL-30; collecting window: ATW 2; acquisition time: 60 s;
quantification method: standardless; Oxford Instrument, UK).
3.8.3 AFM
The surface change of Ti6Al4V was characterised by atomic force microscopy (AFM, Mode:
contact mode; Material of tip: silicon; Digital Instruments, Veeco Metrology Group; Model No.:
MMAFMLN; Serial No.: 1871EX; California, USA) before and after potentiostatic
measurement in 10% H2O2 at 37 °C.
Page 88
73
4 EFFECT OF PH AND LIPOPOLYSACCHARIDE (LPS) ON TI
CORROSION1
4.1 Introduction
The aim of the work described in this chapter was to investigate the effect of pH and
lipopolysaccharide (LPS), a constituent of the cell walls of Gram-negative bacteria and
important mediator of peri-implant inflammation, on the corrosion behaviour of Ti alloys. The
corrosion of Ti alloys in 2 M HCl, a very aggressive environment that simulates the crevice
chemistry of mechanically-assisted crevice corrosion (MACC), was also investigated. Firstly,
the three grades of Ti (CP-Ti-G2, CP-Ti-G4 and Ti6Al4V) used in this study were characterised
using SEM and EDX. Then the preliminary investigations of Ti in 2 M HCl were conducted by
using electrochemical tests, including potentiodynamic polarisation and potentiostatic
measurements. In addition, the corrosion of three grades of Ti in physiological saline with
different pH in the absence and presence of LPS was investigated by measuring Ti released in
immersion tests and using SEM to characterise surface morphology at the end of tests.
1 The contents of this chapter are based on the paper by F. Yu, O. Addison, S. J. Baker,
A. J. Davenport. Lipopolysaccharide inhibits or accelerates biomedical titanium corrosion
depending on environmental acidity. International Journal of Oral Science (2015), 1-8.
Page 89
74
4.2 Characterisation of the Ti samples
Figure 4-1 shows the surface morphology and EDX analysis of three grades of Ti with mirror-
polished surfaces. CP-Ti-G2 shows no significant second phase particles, whereas CP-Ti-G4
(higher Fe level) contains TiFex intermetallic particles, which agrees with the reported
compositions (Table 3-1). Ti6Al4V shows the characteristic two-phase (α and β) microstructure.
There was more V and Fe in the β phase and more Al in the α phase (Figure 4-2 and Table 4-1).
When as-polished samples were etched in Kroll’s etchant (HF (2%) and HNO3 (10%) mixed
solution) for ~5 s, CP-Ti-G2 and CP-Ti-G4 showed equiaxed α grains with grain size from
several to hundreds of micrometres while a uniform distribution of TiFex intermetallic particles
was only present on CP-Ti-G4 (Figure 4-3). The β phase was clearly observed on Ti6Al4V after
being etched in Kroll’s etchant (Figure 4-3).
Page 90
75
Figure 4-1 SEM image and EDX analysis of the mirror-polished samples of (a) (b) CP-Ti-G2,
(c) (d) CP-Ti-G4, (e) (f) Ti6Al4V. SE: secondary electron mode SEM image; BSE: backscatter
electron mode SEM image.
Page 91
76
Figure 4-2 The weight percent (wt.%) of Al and V in α phase and β phase of mirror-polished
Ti6Al4V based on the EDX analysis of randomly chosen points on the sample.
Table 4-1 The weight percent (wt.%) of Al, V and Fe in α phase and β phase of mirror-polished
Ti6Al4V based on the EDX analysis of randomly chosen points on the sample.
Al in α Al in β V in α V in β Fe in β
weight
percent
(wt.%)
(randomly
chosen
points on
the sample)
6 4.1 2.3 8.7 0.5
4.8 3.9 2.8 11.3 0.9
6.5 3.9 2.4 10.4 0.8
6.6 4.3 2.7 8.2 0.5
5.7 3.9 2.4 10.5 0.7
6.1 4.9 2.6 6.5 0.4
Page 92
77
Figure 4-3 Microstructure of etched (a) CP-Ti-G2; (b) CP-Ti-G4; (c) low magnification (d)
high magnification of Ti6Al4V in Kroll’s etchant (HF (2%) and HNO3 (10%) mixed solution)
for ~5 s.
4.3 Effect of HCl on Ti corrosion
4.3.1 OCP measurement
Figure 4-4 shows the OCP as a function of time for mirror-polished CP-Ti-G2, CP-Ti-G4 and
Ti6Al4V in naturally-aerated 2 M HCl. The OCP started from ~-350 mV vs. SCE and then
abruptly decreased to ~-640 mV vs. SCE for CP-Ti-G2 and CP-Ti-G4 and ~-670 mV vs. SCE
for Ti6Al4V, indicating dissolution of the air-formed passive film and surface activation in 2 M
HCl.
Page 93
78
Figure 4-4 OCP as a function of time for mirror-polished CP-Ti-G2, CP-Ti-G4 and Ti6Al4V in
2 M HCl at 37 °C.
4.3.2 Anodic polarisation
Figure 4-5 shows that three grades of Ti (CP-Ti-G2, CP-Ti-G4 and Ti6Al4V) exhibited obvious
active peaks during anodic polarisation. The critical anodic current densities (icrit) were similar
among the three grades of Ti, while passive current density (ipass) of Ti6Al4V exhibited a
slightly higher value when compared with CP-Ti-G2 and CP-Ti-G4 (Figure 4-5). The primary
passivation potential (Epp) of the three grades of Ti is ~-510 mV vs. SCE.
Page 94
79
Figure 4-5 Anodic polarisation curves of mirror-polished CP-Ti-G2, CP-Ti-G4 and Ti6Al4V in
2 M HCl at 37 °C (icrit: critical anodic current density; ipass: passive current density; Epp: primary
passivation potential).
4.3.3 Temperature dependence of corrosion behaviour of Ti6Al4V
Figure 4-6 shows potentiostatic measurements of mirror-polished Ti6Al4V in 2 M HCl at
different temperatures. Figure 4-7 shows that the steady state current density of Ti6Al4V was
sensitive to temperature. It can be seen from Figure 4-7a that the corrosion process at 28 °C is
slightly different from the others at above 28 °C since the current density of Ti6Al4V was
gradually decreased within the measured time until ~4000 s (before reaching a relative steady
state). Figure 4-7b shows that the steady state current density of Ti6Al4V was increased with
increasing temperature at above 28 °C (i.e. 31 °C, 34 °C, 37 °C, 40 °C and 43 °C).
Page 95
80
Figure 4-6 Potentiostatic measurements of mirror-polished Ti6Al4V in 2 M HCl at -510 mV vs.
SCE for 3 h at different temperatures.
Page 96
81
Figure 4-7 (a) Potentiostatic measurements of mirror-polished Ti6Al4V at -510 mV vs. SCE in
2 M HCl at different temperatures and (b) the relationship between the anodic steady state
current density and temperature (the values were chosen from 4000 s to 10800 s). Error bars
refer to 1 standard deviation.
Page 97
82
4.3.4 Surface morphology of Ti6Al4V after potentiostatic tests
Figure 4-8 compares the surface morphologies of mirror-polished Ti6Al4V before and after
potentiostatic test at -510 mV vs. SCE (Epp at 37 °C) in 2 M HCl. It can be seen that Ti6Al4V
shows a characteristic α/β two phase microstructure based on the BSE image and there is no
sign of corrosion on the SE image before the test. However, the α phase of Ti6Al4V was found
to be attacked more than the β phase after the test.
Figure 4-8 SEM image of mirror-polished Ti6Al4V (a) (b) before and (c) (d) after potentiostatic
test in 2 M HCl at -510 mV vs. SCE for 30 min at 37 °C. SE: secondary electron mode SEM
image; BSE: back scattered electron mode SEM image.
Page 98
83
4.4 Effect of pH and LPS on Ti corrosion
4.4.1 Quantification of Ti release
Figure 4-9 and Table 4-2 show that there is no significant difference between the three Ti grades
on the magnitude of Ti release into physiological saline following immersion in both LPS-free
and LPS containing solutions (Two way ANOVAs demonstrated p>0.05), whereas pH
significantly influenced the detected Ti elemental concentration (p<0.01). It also can be seen
that Ti release was significantly increased at pH 2 for all Ti grades in comparison with pH ≥4.
Further Two-way ANOVAs run independently for each Ti Grade demonstrated that LPS
significantly modified the mean Ti concentration of the immersion solution (p<0.01). At pH 2,
the addition of LPS caused a significant decrease in the mean Ti concentration in the solution
(p<0.01), whereas for the pH of 4-7, LPS addition significantly increased the detected Ti levels
(p<0.01) (Figure 4-9). Ti levels in the control immersion solutions with and without LPS were
negligible.
The action of LPS as a potential buffer was tested with pH measurements during solution
preparation before and after LPS addition. It has been found that the addition of LPS had no
detectable effect on the pH of the solution. pH was recorded again following the collection of
the test solutions after the immersion period, prior to elemental quantification (Figure 4-9). A
significant reduction in the pH of the solutions prepared at pH 7 was observed following the
immersion period (to pH 5.8). All remaining immersion solutions were not significantly
affected (Figure 4-9).
Page 99
84
Figure 4-9 Mean concentrations (ppb) of Ti released measured with ICP-MS from mirror-
polished CP-Ti-G2, CP-Ti-G4, and Ti6Al4V following immersion in physiological saline with
and without LPS for 4 weeks at 37 °C. The final immersion solution pH values measured after
the immersion period are provided below the initial values. Error bars refer to 1 standard
deviation (n=3); control group: solutions without any Ti disc.
Table 4-2 Mean concentrations and standard deviations (ppb) of Ti released measured with
ICP-MS from mirror-polished CP-Ti-G2, CP-Ti-G4, and Ti6Al4V following immersion in
physiological saline with and without LPS for 4 weeks at 37°C (n=3); control group: solutions
without any Ti disc.
Control Group CP-Ti-G2
Group
CP-Ti-G4
Group
Ti6Al4V
Group
pH 2 0.5±0.3 380±40 340±20 360±30
pH 2+LPS 0.4±0.3 70±3 56±4 67±7
pH 4 0.2±0.01 1±1 0.5±0.01 1±1
pH 4+LPS 0.4±0.4 43±2 46±4 56±6
pH 5.5 0.4±0.3 3±1 0.5±0.4 0.4±0.2
pH 5.5+LPS <0.2 31±1 43±2 43±10
pH 7 <0.2 1.7±0.6 1±0.2 0.7±0.1
pH 7+LPS 0.4±0.3 29±5 34±2 28±9
Page 100
85
4.4.2 Anodic polarisation
Figure 4-10 shows the anodic polarisation curves of mirror-polished Ti6Al4V and CP-Ti-G4
measured in physiological saline at pH 2 and 4 in the absence and presence of LPS after 1 h
immersion at OCP. The OCP of both Ti6Al4V and CP-Ti-G4 showed a relatively small
increasing trend in physiological saline with and without LPS (data not shown) and the final
OCP value is listed in Table 4-3.
Table 4-3 Mean final OCP and standard deviations of mirror-polished CP-Ti-G4 and Ti6Al4V
after 1 h of immersion in physiological saline with and without LPS at 37 °C (n=6).
CP-Ti-G4 Group
(mV vs. SCE)
Ti6Al4V Group
(mV vs. SCE)
pH 2 -370±20 -340±20
pH 2+LPS -390±30 -360±20
pH 4 -330±30 -320±20
pH 4+LPS -390±50 -380±30
It can be seen from Figure 4-10 that both Ti6Al4V and CP-Ti-G4 showed passive behaviour in
physiological saline with and without LPS. A higher anodic current density was measured for
both Ti6Al4V and CP-Ti-G4 at pH 2 compared with measurements at pH 4 (Figure 4-10). For
the solution adjusted to pH 2 containing LPS, the anodic current density decreased for both
Ti6Al4V and CP-Ti-G4 when compared with the LPS-free solution. In contrast at pH 4, an
increased anodic current density was observed for both Ti6Al4V and CP-Ti-G4 in the LPS-
containing physiological saline when compared with the LPS-free solution (Figure 4-10). It
should be noted that the addition of LPS had no detectable effect on the pH of the solution.
Page 101
86
Figure 4-10 Anodic polarisation curves of (a) Ti6Al4V, (b) enlarged image of the region
outlined in (a) and (c) CP-Ti-G4, (d) enlarged image of the region outlined in (c) in
physiological saline solution adjusted to pH 2 and pH 4 in the absence and presence of LPS at
37 °C. Anodic polarisation curves were measured by sweeping the potential from -50 mV below
the OCP to 600 mV vs. SCE at a rate of 1 mV/s.
4.4.3 Cathodic polarisation
Cathodic polarisation curves of Ti6Al4V and CP-Ti-G4 were measured separately from the
anodic measurements (Figure 4-11). A higher cathodic current density was observed for
Ti6Al4V and CP-Ti-G4 at pH 2 when compared with that at pH 4 (Figure 4-11). In the presence
of LPS, the cathodic current decreased slightly for both Ti6Al4V and CP-Ti-G4 at pH 2, but
showed a very slight increase at pH 4 when compared with the solution without LPS.
Page 102
87
Figure 4-11 Cathodic polarisation curves of (a) Ti6Al4V, (b) enlarged image of the region
outlined in (a) and (c) CP-Ti-G4, (d) enlarged image of the region outlined in (c) in
physiological saline solution adjusted to pH 2 and pH 4 in the absence and presence of LPS at
37 °C. Cathodic polarisation curves were obtained by sweeping the potential from 50 mV above
OCP to -900 mV vs. SCE at a rate of 1 mV/s.
4.4.4 Potentiostatic study
Figure 4-12 shows potentiostatic measurements of mirror-polished Ti6Al4V and CP-Ti-G4 in
physiological saline at a pH 2 and 4 with and without the addition of LPS. The potential was
maintained at 600 mV vs. SCE, which is in the passive region. The solution was stirred at
intervals to ensure complete mixing. LPS was added just prior to stirring at ~1000 s for some
of the measurements. It is clear that the passive current density of both grades of Ti was greater
Page 103
88
at pH 2 than at pH 4 (Figure 4-12). After the addition of LPS, the current density measured for
samples immersed at pH 2 decreased rapidly (within 1000 s) to the value found for samples
immersed at pH 4. However, LPS was found to have no effect on the passive current density at
pH 4. It should be noted that the addition of LPS had no detectable effect on the pH of the
solution.
Figure 4-12 Potentiostatic study (600 mV vs. SCE) of (a) Ti6Al4V and (b) CP-Ti-G4 in
physiological saline adjusted to pH 2 or pH 4 at 37 °C; the solution was stirred for ~100 s at
~1000 s intervals to ensure mixing; for some experiments, LPS (in physiological saline) was
added at ~1000 s immediately before stirring to give a final concentration of 150 μg/mL.
4.4.5 Surface morphology after immersion tests in physiological saline
Figure 4-13 shows the surface morphologies of all three grades of Ti in the as-polished
condition and following immersion for 4 weeks in physiological saline at pH 7 and pH 2. No
significant difference on the surface morphology before and after immersion was observed even
for physiological saline at pH 2, which showed the highest metal release for all of the conditions
studied with and without LPS (Figure 4-9).
Page 104
89
Figure 4-13 SEM images of mirror-polished surfaces of Ti and its alloy: CP-Ti-G2, CP-Ti-G4
and Ti6Al4V before and after immersion for 4 weeks at 37 °C in physiological saline (PS)
adjusted to pH 7 or pH 2. SE: secondary electron mode SEM image, BSE: backscatter electron
mode SEM image.
4.5 Discussion
4.5.1 Effect of HCl on Ti corrosion
The current study demonstrated that three grades of Ti were activated in naturally-aerated 2 M
HCl, which agrees with other studies, i.e. Ti6Al4V in naturally-aerated 1.5 M HCl [43] and CP-
Ti in deaerated 1-10 M HCl [53]. It has also been reported that there was no activation of CP-
Ti at pH 1 (0.1 M HCl) after 12 h immersion at open circuit [53].
Page 105
90
The E-pH diagram (Pourbaix diagram) at 37 °C (Figure 4-14) provides preliminary information
about the thermodynamically stable state of Ti3+ within a wide range of potentials at
pH <1.5 [175]. In the presence of 2 M HCl (pH -0.3), OCP of three grades of Ti were between
-640 mV and -670 mV vs. SCE (Figure 4-4) (the SCE scale was converted to NHE by adding
240 mV [48]), in which Ti3+ is the thermodynamically stable state, and therefore chemical
dissolution of Ti oxide passive film occurred at the first stage before surface activated, resulting
in abrupt drop in OCP. The dropped OCP values of three grades of Ti also agree with other
studies [43, 53, 176].
In addition, a clear characteristic active-passive transition was exhibited during anodic
polarisation in 2 M HCl. Similar Epp and icrit have also been reported, i.e. Ti6Al4V in aerated
1.5 M HCl [43] and in deaerated 5% (1.3 M) HCl [90] at 37 °C. Higher icrit of CP-Ti was
reported in Yu and Scully’s studies [54, 175] since a high concentration of HCl was used (5 M
HCl).
Page 106
91
Figure 4-14 E-pH diagram (Pourbaix diagram) for Ti-H2O system at 37 °C. Ti species are at an
activity of 10-6. Line (a) and (b) refers to the regions of water stability [175]. NHE: normal
hydrogen electrode. The red spot shows the OCP of CP-Ti and Ti6Al4V in this study.
4.5.2 Temperature dependence of Ti6Al4V in 2 M HCl
The steady state current density of Ti6Al4V at -510 mV vs. SCE (Epp at 37 °C) has been
observed to be increased with increasing temperature at above 28 °C (i.e. 31 °C, 34 °C, 37 °C,
40 °C and 43 °C) (Figure 4-7). Assuming the corrosion process of Ti6Al4V in this study can
be analysed by a simple Arrhenius expression (Equation 4-1) based on that the corrosion rate
can be represented by current density:
Equation 4-1 ln 𝑖 = 𝑎 − 𝐸𝑎
𝑅𝑇
Page 107
92
where Ea is the activation energy of the corrosion process during potentiostatic polarisation, T
is the absolute temperature (K) and R is the gas constant (8.3 J/mol·K).
Figure 4-15 A plot of steady state current at -510 mV vs. SCE vs. temperature for mirror-
polished Ti6Al4V in 2 M HCl. The red line shows the fitted linear Arrhenius plot.
It can be seen from Figure 4-15 that the relationship between natural logarithm of current
density and reciprocal temperature is non-linear (black line in Figure 4-15) and does not obey
linear Arrhenius expression. The corrosion process of Ti6Al4V cannot be analysed by a simple
Arrhenius expression. However, to compare with other works [53, 56, 90], a fitted Arrhenius
plot was conducted (red line in Figure 4-15) and the calculated activation energy was
164 kJ/mol.
Different activation energies were also reported (e.g. 27 kJ/mol by Atapour et al. [90],
57 kJ/mol by Yu et al. [53] and 63 kJ/mol by Blackwood et al. [56]), which may be attributed
Page 108
93
to the different methods used. The activation energies reported by Yu et al. [53] and
Blackwood et al. [56] are related to the dissolution/corrosion of Ti oxide on CP-Ti in deaerated
5 M HCl or 3 M H2SO4 based on the surface activation time length during immersion at OCP,
while Atapour et al. [90] compared icorr of Ti6Al4V in deaerated 5% HCl (1.3 M) by using the
Tafel extrapolation method on potentiodynamic polarisation curves.
The corrosion process in this study is complicated and not controlled by a single mechanism.
As expected, active dissolution and possible passivation may co-exist since the applied potential
is the primary passivation potential (-510 mV vs. SCE). In addition, the applied potential was
not far from OCP (-670 mV vs. SCE), where cathodic reaction may also take place. Therefore,
the current corrosion process of Ti6Al4V is different from the previously reported processes [53,
56, 90], which may lead to different activation energies.
4.5.3 Surface morphology of Ti6Al4V after potentiostatic test in 2M HCl
The current study demonstrated that the α phase of Ti6Al4V was preferentially attacked relative
to the β phase in 2 M HCl at 37 °C after potentiostatic measurement at Epp (-510 mV vs. SCE).
This differs from Atapour’s finding [105] that the β phase of Ti6Al4V-ELI (similar to Ti6Al4V
but contains lower content of C, N, O and Fe) was preferentially attacked after exposure to 5 M
HCl at 37 °C for 50 h. However, there is no over potential in their study. In addition, it has been
reported that the preferential dissolution of α phase of Ti-15Mo (with α+β phases microstructure)
was observed at potentials in the active region in 40% H2SO4 at 80 °C [177]. The α phase of
Ti-15Mo-3Nb-3Al was also found to be preferentially attacked during anodic polarisation in
5 M HCl at 37 °C [175].
Page 109
94
For Ti6Al4V used in this study, there is more Al and less V in α phase, while there is more V
but less Al in β phase (Table 4-1 and Figure 4-2). Al is reported to have a detrimental influence
on the passivity and corrosion resistance of α phase Ti in 5 M HCl [175], while dissolution of
V coupled with conduction channels is also considered to be detrimental for the passive film in
Hank’s solution [178]. It is also suggested that both Al and V alloying component have bad
effect on Ti passivity in 40% H2SO4 [177]. Considering the condition in this study, both active
dissolution and possible passivation of Ti6Al4V would be expected. The detrimental effect of
Al may dominate over other factors, resulting in preferential attack of α phase.
It is noted that there is also some Fe content (Table 4-1) in the β phase of Ti6Al4V in this study.
Fe-containing β phase has been reported to possibly initiate hydride formation and proton
reduction in acidic environment [5, 179]. It is likely that the cathodically active hydride sites
on β phase co-exist with anodically active of α phase, which further result in preferential
dissolution of α phase.
4.5.4 Effect of pH and LPS on Ti corrosion
It can be seen from Figure 4-9 that higher Ti release at pH 2 was observed compared with pH
4-7, consistent with previous work showing the observation of distinctly reduced Ti release at
pH 4 and above [89, 93, 94]. However, the addition of LPS to the immersion solution
significantly modified this pattern of Ti release, promoting corrosion at pH ≥4 but inhibiting it
at pH 2, which has not been reported previously. It has been previously demonstrated that the
solubility of Ti oxide surface layer is largely independent of acidity at pH ≥4 [89] and therefore
the direct effect of LPS in lowering the solution pH is not considered to account for the
increased Ti release at pH ≥4. Despite the differences in microstructure and composition
Page 110
95
between the three grades of Ti studied, no differences in Ti release were observed in the
immersion conditions used and, accordingly, only CP-Ti-G4 and the alloy Ti6Al4V were
studied in electrochemical tests.
The increased solubility of the passive oxide film on Ti alloys in highly acidic conditions (pH 2)
was confirmed by anodic polarisation and potentiostatic measurements on CP-Ti-G4 and
Ti6Al4V samples. When physiological saline solution was maintained at pH 2, shifts towards
higher anodic currents, higher cathodic currents and higher passive currents were all observed
when compared with pH 4 (Figure 4-10, Figure 4-11 and Figure 4-12). Following addition of
LPS to the pH 2 solution, the anodic, cathodic and passive currents were all decreased (Figure
4-10, Figure 4-11 and Figure 4-12). In contrast, addition of LPS to the pH 4 solution increased
the anodic and cathodic currents when compared with an LPS-free environment (Figure 4-10
and Figure 4-11). There was no significant change for the passive current at pH 4 with and
without the addition of LPS for both Ti6Al4V and CP-Ti-G4 (Figure 4-12).
It is generally established that organic molecules can affect the corrosion behaviour of metals
mediated by adsorption onto the surfaces and/or chelation with the released dissolved ions [19,
20, 24, 25, 95, 96]. Studies on serum proteins interaction with Ti surfaces, using potential sweep
techniques, have established that surface adsorption processes are potential dependent [95].
Further electrochemical tests have demonstrated that serum proteins such as albumin and
fibrinogen can decrease the cathodic current, but also decrease or increase the anodic
current [19, 20, 24]. These findings have been used to support a proposal that mechanistically,
the protein has a covering and/or blocking effect [20].
LPS are large molecules that are found in part of the cell walls of Gram-negative bacteria and
comprise a lipid covalently bonded to a polysaccharide. LPS has been shown to have a high
Page 111
96
affinity for adsorption onto Ti surfaces [131], and in the current study it is likely that LPS will
rapidly adsorb onto the surface of the Ti samples following immersion. The observed decrease
in corrosion at pH 2 can be explained by the covering of potential reaction sites by the adsorbed
molecules, which may further block ion release during the corrosion process. LPS has been
shown to present different charges dependent on solution pH, and in the current study,
adsorption may have been promoted most at pH 2 and least at neutral conditions [180].
Furthermore, chain mobility, aggregation and the structure of LPS have been shown to be
influenced by the presence of metal cations and pH, and this may further act to modulate the
anticipated surface adsorption and/or the covering of reaction sites [181]. However, this
mechanism does not fully explain the promoted corrosion found in the presence of LPS at pH ≥4
for the long-term immersion tests. Although this has not been specifically demonstrated with
Ti, LPS is considered to readily complex with metal cations at its polysaccharide
component [182, 183]. It is possible that complexation of Ti ions on the surface of the passive
film may enhance dissolution. However, this effect is smaller than the suppression of
dissolution at pH 2. It should be noted that addition of LPS did not increase the passive current
density at pH 4 (expected if the passive film undergoes significant dissolution) in the short-term
potentiostatic tests. The decrease in cathodic reactivity on addition of LPS at pH 2 may again
be associated with adsorption of LPS on Ti [131]. However, the small increase in cathodic
reactivity on addition of LPS at pH 4 is more surprising. It is possible that complexation by
LPS may lead to a thinner passive oxide film, allowing easier electron transfer for the cathodic
reaction.
The environment of many Ti implants including dental implants and cranial anchorage devices
may contain LPS due to the presence of Gram-negative bacteria in the surface biofilm. LPS has
Page 112
97
been shown to have a strong affinity to Ti, and the current study demonstrates a significant
increase in Ti corrosion at the mildly acidic and neutral pH levels which are commonly
encountered in the peri-implant environment. However, the pH measured in sites of
mechanically-assisted crevice corrosion (between modular components and in crevices) may
be considerably lower approaching pH 2.5 [7]. Under these conditions, LPS may act to suppress
dissolution of Ti.
4.6 Conclusions
The effect of pH and LPS on corrosion behaviour of Ti alloys was investigated using solution
analysis, surface analysis and electrochemical tests, and it was determined whether LPS, an
important mediator of peri-implant inflammation, promotes or inhibits corrosion of three grades
of Ti. The effect of 2 M HCl was also studied by electrochemical tests.
1. Corrosion of Ti6Al4V in 2 M HCl is temperature dependent and the steady state current
density at -510 mV vs. SCE (the primary passivation potential at 37 °C) becomes higher with
increasing temperature.
2. The α phase of Ti6Al4V is preferentially dissolved relative to the β phase after
potentiostatic measurement at primary passivation potential (Epp) in 2 M HCl at 37 °C.
3. LPS increases corrosion of CP-Ti-G4 and Ti6Al4V in physiological saline at pH 4-7,
increasing the rate of both the anodic reaction and the cathodic reaction.
4. LPS inhibits corrosion of CP-Ti-G4 and Ti6Al4V at pH 2 in physiological saline solution,
decreasing both the anodic and cathodic reactions.
Page 113
98
5 EFFECT OF H2O2 AND ALBUMIN ON TI CORROSION
5.1 Introduction
The aim of the work described in this chapter is to investigate the corrosion behaviour of three
grades of Ti (CP-Ti-G2, CP-Ti-G4 and Ti6Al4V) in the presence of H2O2, which is an important
inflammation product in the peri-implant environment. The corrosion behaviour of Ti6Al4V
was also studied in the presence of albumin, which is an abundant protein found in blood and
extracellular environments. The influence of the combination of H2O2 and albumin on corrosion
of Ti6Al4V was also investigated. Solution analysis, surface analysis and electrochemical tests
were used to investigate the corrosion of Ti.
5.2 Effect of H2O2 on Ti corrosion
5.2.1 Solution analysis
Figure 5-1 shows that the concentrations of Ti released from all three grades of Ti were
increased in the presence of H2O2. Ti levels in the control (no Ti disc) solutions were negligible.
The amount of Ti released from the three Ti grades increased with the concentration of H2O2
(Table 5-1 and Figure 5-1). The concentration of Ti released from Ti6Al4V was ten to hundred
times higher than that from CP-Ti-G2 and CP-Ti-G4 for the same concentrations of H2O2, while
there was no significant difference between the Ti released from CP-Ti-G2 and CP-Ti-G4 for
all H2O2 concentrations.
Observation of the Ti samples following immersion identified yellow precipitates in the 10%
H2O2 solutions after 4 weeks immersion for all three grades of Ti, probably due to detachment
of the surface corrosion product (Ti-H2O2 complex [184]). Therefore, the released Ti
Page 114
99
concentrations from three grades of Ti were not measured in 10% H2O2 to avoid an inaccuracy
in reporting.
Figure 5-1 Mean concentrations (ppb) measured with ICP-MS of Ti released from mirror-
polished CP-Ti-G2, CP-Ti-G4 and Ti6Al4V following immersion in physiological saline
(0.15 M NaCl) with and without different levels of H2O2 for 4 weeks at 37 °C. Error bars refer
to 1 standard deviation (n=3); control group: solutions without any Ti disc.
Table 5-1 Mean concentrations and standard deviations (ppb) measured with ICP-MS of
elemental Ti released from mirror-polished CP-Ti-G2, CP-Ti-G4 and Ti6Al4V following
immersion in physiological saline (0.15 M NaCl) with and without different levels of H2O2 for
4 weeks at 37 °C (n=3); control group: solutions without any Ti disc.
Control group CP-Ti-G2 group CP-Ti-G4 group Ti6Al4Vgroup
0% H2O2 <0.2 1.7±0.6 1±0.2 0.7±0.1
0.1% H2O2 <0.2 20±2 21±0.7 270±20
0.5% H2O2 0.4±0.2 45±2 40±10 3900±600
1% H2O2 0.2±0.1 60±1 65±3 7000±1000
Page 115
100
Figure 5-2 and Table 5-2 show the concentrations of V and Al released from Ti6Al4V. It can
be seen that the amount of released V and Al increased with increasing concentration of H2O2
demonstrating a similar pattern to the Ti released from Ti6Al4V. There appeared to be increased
V release when compared with Al, especially following immersion in lower concentrations of
H2O2.
Figure 5-2 The mean concentrations (ppb) measured with ICP-MS of Ti, Al and V released
from mirror-polished Ti6Al4V following immersion in physiological saline (0.15 M NaCl)
with and without different levels of H2O2 for 4 weeks at 37 °C. Error bars refer to 1 standard
deviation (n=3).
Page 116
101
Table 5-2 The mean concentrations and standard deviations (ppb) measured with ICP-MS of
Al and V released from mirror-polished Ti6Al4V following immersion in physiological saline
(0.15 M NaCl) with and without different levels of H2O2 for 4 weeks at 37 °C (n=3); control
group: solutions without any Ti disc.
Control-Al Ti6Al4V-Al Control-V Ti6Al4V-V
0% H2O2 1.4±0.2 7±1 <0.2 3±1
0.1% H2O2 1.3±0.01 17±2 0.3±0.01 173±5
0.5% H2O2 1.7±0.3 140±20 0.3±0.05 410±80
1% H2O2 1.6±0.2 500±100 0.3±0.04 600±100
5.2.2 Surface morphology
5.2.2.1 Characterisation after immersion tests
When Ti samples were immersed in physiological saline without H2O2 for 4 weeks, the original
shiny polished appearance was unchanged, while discoloration of three grades of Ti was
observed after immersion tests in H2O2-containing solutions (Figure 5-3).
Figure 5-3 Images of mirror-polished CP-Ti-G2, CP-Ti-G4 and Ti6Al4V following immersion
in physiological saline with and without different levels of H2O2 for 4 weeks at 37 °C.
Page 117
102
Figure 5-4 shows that the surface morphologies of the three grades of Ti did not demonstrate
significant changes after immersion in physiological saline when compared with the original
surfaces (Figure 4-1). CP-Ti-G2 showed no significant second phase particles (Figure 5-4a),
whereas CP-Ti-G4 contained TiFex intermetallic particles (Figure 5-4f). Ti6Al4V showed the
characteristic α phase and β phase microstructure (Figure 5-4k).
Page 118
103
Figure 5-4 Surface morphologies of mirror-polished (a-e) CP-Ti-G2, (f-j) CP-Ti-G4 and (k-o)
Ti6Al4V following immersion in physiological saline (0.15 M NaCl) with and without
different levels of H2O2 for 4 weeks at 37 °C.
Page 119
104
Figure 5-5 Surface morphologies of mirror-polished Ti6Al4V following immersion in
physiological saline (0.15 M NaCl) with and without different levels of H2O2 for 4 weeks at
37 °C.
Clear changes in surface morphology were observed for the samples immersed in H2O2, as
shown in Figure 5-4 and Figure 5-5. It can be seen that the corrosion products on the surfaces
of CP-Ti-G2 and CP-Ti-G4 became much more porous following 4 weeks immersion in H2O2.
Specifically the β phase of Ti6Al4V was preferentially attacked, accompanying the surface
roughening in H2O2 solutions (Figure 5-5).
The most noticeable change in surface morphologies was observed following 4 weeks
immersion in the highest concentration of H2O2 (10%), and differences between Ti grades were
evident. Finer precipitates aggregated on the CP-Ti-G2 and CP-Ti-G4 surfaces whilst larger
Page 120
105
precipitates formed on the Ti6Al4V surface. All samples immersed in H2O2-containing
solutions showed the presence of oxygen based on EDX analysis (data not shown).
5.2.2.2 Characterisation after potentiostatic tests
Figure 5-6 compares the surface morphologies of mirror-polished Ti6Al4V before and after
potentiostatic measurements in physiological saline with H2O2. It can be seen that Ti6Al4V
showed a characteristic α/β two phase microstructure based on the BSE image and there was
no variation surface topography based on the AFM mapping before the test. However, after the
test, AFM mapping (Figure 5-6f) shows that β phase of Ti6Al4V was attacked more than α
phase in the H2O2-containing solution.
Page 121
106
Figure 5-6 Surface morphology/topography of (a-c) before and (d-f) after potentiostatic
measurement of mirror-polished Ti6Al4V in 10% H2O2-containing physiological saline
(0.15 M NaCl) at 600 mV vs. SCE for 30 min at 37 °C. BSE: backscatter electron SEM image.
5.2.3 Electrochemical tests
5.2.3.1 OCP behaviour
Figure 5-7 shows the OCP as a function of time for CP-Ti-G4 (Figure 5-7a) and Ti6Al4V
(Figure 5-7b). The OCP increased with time and the values were almost 300 mV higher in the
presence of H2O2. The OCP of Ti6Al4V was close to that of CP-Ti-G4 for the same
concentrations of H2O2.
Page 122
107
Figure 5-7 OCP as a function of time for mirror-polished (a) CP-Ti-G4 and (b) Ti6Al4V in
physiological saline (0.15 M NaCl) with and without different levels of H2O2 at 37 °C. The
average final OCP is shown.
Page 123
108
5.2.3.2 Cathodic polarisation
Figure 5-8 shows cathodic polarisation curves for mirror-polished CP-Ti-G4 and Ti6Al4V
measured in physiological saline with and without H2O2. A cathodic current plateau was
observed for CP-Ti-G4 and Ti6Al4V under very negative potentials (less than -1 V vs. SCE)
due to limited oxygen diffusion.
With the addition of H2O2, the cathodic current densities of both CP-Ti-G4 and Ti6Al4V were
increased due to the reduction reaction of H2O2. It can also be seen that the cathodic current
densities increased with increasing concentration of H2O2 and the cathodic current densities of
CP-Ti-G4 and Ti6Al4V exhibited similar values at the same concentrations of H2O2. In addition,
the value of OCP of Ti6Al4V and CP-Ti-G4 moved to more positive values in the presence of
H2O2, which is consistent with OCP measurements in Figure 5-7.
Figure 5-8 Cathodic polarisation curves of mirror-polished (a) CP-Ti-G4 and (b) Ti6Al4V in
physiological saline (0.15 M NaCl) with and without different levels of H2O2 at 37 °C. The
potential was swept in the negative direction from just 50 mV above OCP to -1400 mV vs. SCE
at a rate of 1 mV/s.
Page 124
109
5.2.3.3 Anodic polarisation
Figure 5-9 shows anodic polarisation curves for mirror-polished CP-Ti-G4 and Ti6Al4V. Both
CP-Ti-G4 and Ti6Al4V showed passive behaviour in physiological saline and no significant
change of anodic current density was observed up to a potential of 1200 mV vs. SCE.
In the presence of H2O2, the anodic current densities of CP-Ti-G4 and Ti6Al4V became higher
compared with those measured in physiological saline without H2O2. The anodic current
densities increased with increasing concentration of H2O2. In addition, Ti6Al4V showed higher
anodic current densities than CP-Ti-G4 with exposure to the same concentrations of H2O2,
consistent with Ti release shown in Figure 5-1. Furthermore the anodic current densities of CP-
Ti-G4 and Ti6Al4V in the presence of H2O2 were slightly increased with increasing potential
until an abrupt increase was observed at 600-800 mV vs. SCE, possibly due to oxygen evolution.
Page 125
110
Figure 5-9 Anodic polarisation curves of mirror-polished (a) CP-Ti-G4 and (b) Ti6Al4V in
physiological saline (0.15 M NaCl) with and without different levels of H2O2 at 37 °C. The
potential was swept in the positive direction from just -50 mV below OCP to 1200 mV vs. SCE
at a rate of 1 mV/s.
Page 126
111
5.3 Effect of albumin on corrosion of Ti6Al4V
5.3.1 Electrochemical tests
5.3.1.1 OCP behaviour
Figure 5-10 shows the OCP as a function of time for mirror-polished Ti6Al4V. The OCP
increased with time and was almost 300 mV lower in the presence of albumin. The OCP of
Ti6Al4V did not show significant differences in solutions containing different levels of albumin.
Figure 5-10 OCP as a function of time for mirror-polished Ti6Al4V in physiological saline
(0.15 M NaCl) with and without different levels of albumin at 37 °C.
Page 127
112
5.3.1.2 Anodic and cathodic polarisation
Figure 5-11 shows anodic and cathodic polarisation curves for mirror-polished Ti6Al4V. When
compared with the cathodic reaction in physiological saline, albumin addition significantly
inhibited the cathodic reaction. The decreased cathodic current densities did not show
significant differences in the solutions containing different levels of albumin. In addition, OCP
of Ti6Al4V moved to more negative values in the presence of albumin, which is consistent with
OCP measurements in Figure 5-10.
The anodic current density was observed to be higher in the presence of albumin. This is
possibly due to the suppressed cathodic reaction or an enhanced anodic reaction or a
combination of both. A particularly sharp active peak was found in 4% albumin (Figure 5-11c).
Page 128
113
Figure 5-11 (a) cathodic and (b) anodic polarisation curves; (c) enlarged image of the region
outlined in (b) of mirror-polished Ti6Al4V in physiological saline (0.15 M NaCl) in the
presence and absence of different levels of albumin at 37 °C. For cathodic polarisation, the
potential was swept in the negative direction from 50 mV above OCP to -1400 mV vs. SCE at
a rate of 1 mV/s. For anodic polarisation, the potential was swept in the positive direction from
-50 mV below OCP to 1200 mV vs. SCE at a rate of 1 mV/s.
Page 129
114
5.4 Effect of the combination of H2O2 and albumin on corrosion of Ti6Al4V
5.4.1 Solution analysis
Figure 5-12 shows the concentrations of Ti, Al and V released from mirror-polished Ti6Al4V
in the absence and presence of H2O2 and albumin. Ti, Al and V levels in the control (without a
Ti6Al4V disc) solutions were negligible, except for the Al level in the albumin control sample
(15±10 ppb) (Table 5-3) and it is possible that this was due to one contaminated sample. There
were three measurements and one sample showed high Al level (26 ppb, 8 ppb and 10 ppb).
A higher concentration of Ti measured in the immersion solution was observed from Ti6Al4V
in the presence of H2O2 when compared with H2O2-free solution. Similar to the 4 week
immersion tests in physiological saline with H2O2 (see Figure 5-2), the amount of released V
was greater than Al.
In the presence of albumin, a small increase in the measured Ti concentration (65±5 ppb) was
observed when compared with the (albumin-free) physiological saline control. Immersion in
mixed solutions of H2O2 and albumin resulted in a considerable increase in the release of Ti,
Al and V, which increased with the increasing concentration of albumin in the mixed solutions.
The concentration of Al measured in the mixed solutions was greater than that in the presence
of H2O2 without albumin.
Page 130
115
Figure 5-12 The mean concentrations and standard deviations (ppb) measured with ICP-MS of
Ti, Al and V released from mirror-polished Ti6Al4V following immersion in physiological
saline (PS, 0.15 M NaCl) with and without H2O2 and albumin for 2 weeks at 37 °C (n=3); the
results indicated * were from 4 week immersion test.
Page 131
116
Table 5-3 The mean concentrations and standard deviations (ppb) measured with ICP-MS of
Ti, Al and V released from mirror-polished Ti6Al4V following immersion in physiological
saline (PS, 0.15 M NaCl) with and without H2O2 and albumin for 2 weeks at 37 °C (n=3); the
results indicated * were from 4 week immersion test.
Ti Al V
PS without Ti6Al4V <0.5 0.8±0.1 <0.2
4% albumin without Ti6Al4V 2±1 15±10 1.5±0.4
0.1% H2O2 without Ti6Al4V <0.5 1.1±0.5 <0.2
PS + Ti6Al4V* 0.7±0.1 7±1 3±1
4% albumin + Ti6Al4V 65±5 10±1 4.3±0.5
0.1% H2O2 + Ti6Al4V 170±20 10±1 190±10
0.2% albumin + 0.1% H2O2 + Ti6Al4V 2200±300 120±10 140±20
0.4% albumin + 0.1% H2O2 + Ti6Al4V 2600±90 146±9 170±10
1% albumin + 0.1% H2O2 + Ti6Al4V 4000±200 226±6 250±20
4% albumin + 0.1% H2O2 + Ti6Al4V 9690±50 550±10 490±10
5.4.2 Surface morphology after immersion tests
Figure 5-13 shows that the corrosion products on the Ti6Al4V surface appeared porous in the
presence of H2O2 based on the secondary electron image (SE), and the β phase appeared to be
preferentially attacked based on the backscatter electron image (BSE), which was similar to the
observation in the following 4 week immersion in H2O2 (Figure 5-5).
Figure 5-13 also shows that the surface of Ti6Al4V after immersion in albumin did not show a
significant difference from the sample immersed in physiological saline alone. However, the
surface of Ti6Al4V was relatively smooth and β phase was also preferentially attacked after
immersion in the mixed solutions of H2O2 and albumin. In addition, the surface of Ti6Al4V
was likely to show clearer attack features with an increasing albumin concentration in the mixed
solutions (Figure 5-14).
Page 132
117
Figure 5-13 Surface morphology of mirror-polished Ti6Al4V following 2 week immersion in
physiological saline (PS, 0.15 M NaCl) with or without H2O2 and/or albumin at 37 °C; the
results indicated * were from 4 week immersion test. SE: secondary electron SEM image; BSE:
backscatter electron SEM image.
Page 133
118
Figure 5-14 Surface morphology of mirror-polished Ti6Al4V following 2 week immersion in
physiological saline (0.15 M NaCl) in the presence of H2O2 and different levels of albumin at
37 °C. SE: secondary electron SEM image; BSE: backscatter electron SEM image.
Page 134
119
5.4.3 Electrochemical tests
5.4.3.1 OCP behaviour
Figure 5-15 shows the OCP as a function of time for mirror-polished Ti6Al4V in the absence
and presence of H2O2 and albumin. The OCP was higher in the presence of H2O2 compared
with (H2O2-free) physiological saline, which was decreased after the addition of albumin. The
OCP was lower in the presence of albumin compared with (albumin-free) physiological saline,
which was increased after the addition of H2O2. The OCP of Ti6Al4V in the presence of mixed
solutions of H2O2 and albumin was close to that in physiological saline control. In addition, the
OCP was not found to depend on the concentration of albumin in the mixed solutions.
Figure 5-15 OCP as a function of time for mirror-polished Ti6Al4V in physiological saline
(0.15 M NaCl) with and without H2O2 and different levels of albumin at 37 °C.
Page 135
120
5.4.3.2 Anodic and cathodic polarisation
Figure 5-16 shows the anodic and cathodic polarisation curves for mirror-polished Ti6Al4V in
the absence and presence of H2O2 and albumin. It can be seen that the addition of albumin
decreased the cathodic current density in the presence of H2O2 alone, and the addition of H2O2
increased the cathodic current density in the presence of albumin alone.
For anodic polarisation curves (Figure 5-16b), Ti6Al4V exhibited higher anodic current
densities in mixed solutions of H2O2 and albumin compared with physiological saline, and this
appears to be mainly due to an enhanced anodic reaction. In addition, the anodic current
densities of Ti6Al4V in mixed solutions were increased with an increasing concentration of
albumin in the mixed solutions (Figure 5-16c), which is consistent with the metal release results
(Figure 5-12). The anodic current density of Ti6Al4V showed an abrupt increase in the presence
of mixed solutions at 600±80 mV vs. SCE, which was similar to that observed in H2O2 (see
Section 5.2.3.3) and is possibly due to oxygen evolution.
Page 136
121
Figure 5-16 (a) cathodic and (b) anodic polarisation curves; (c) enlarged image of the region
outlined in (b) of mirror-polished Ti6Al4V in physiological saline (PS, 0.15 M NaCl) with and
without H2O2 and different levels of albumin at 37 °C. For cathodic polarisation, the potential
was swept in the negative direction from 50 mV above OCP to -1400 mV vs. SCE at a rate of
1 mV/s. For anodic polarisation, the potential was swept in the positive direction from -50 mV
below OCP to 1200 mV vs. SCE at a rate of 1 mV/s.
Page 137
122
5.4.3.3 Potentiostatic measurements
Figure 5-17 shows potentiostatic measurements of mirror-polished Ti6Al4V in physiological
saline with addition of albumin and/or H2O2 at different potentials. The solution was stirred at
~1000 s intervals to ensure complete mixing. H2O2 and/or albumin were added just prior to
stirring for some of the measurements.
Figure 5-17a shows that the cathodic steady state current densities of Ti6Al4V at the cathodic
potential were decreased following addition of albumin at the 1st ~1000 s interval, consistent
with the cathodic polarisation results (Figure 5-11a). It can also be seen that the cathodic
steady state current densities in the absence and presence of albumin were increased after
addition of H2O2 at the 2nd ~1000 s interval, consistent with the cathodic polarisation results in
Figure 5-16. In addition, the cathodic steady state current densities in H2O2-containing solution
were decreased following addition of albumin at the 3rd ~1000 s interval, which is also
consistent with the cathodic polarisation results (Figure 5-16).
Figure 5-17b and Figure 5-17c show that anodic steady state current densities of Ti6Al4V at
both two anodic potentials decreased after addition of albumin at the 1st ~1000 s interval. It has
also been shown that at the 2nd ~1000 s interval, the anodic steady state current densities in the
absence and presence of albumin were increased after addition of H2O2. In addition, at the 3rd
~1000 s interval, the anodic steady state current densities in the presence of H2O2 were also
decreased after addition of albumin.
Page 138
123
Figure 5-17 Potentiostatic measurements of mirror-polished Ti6Al4V at (a) -800 mV; (b)
400 mV and (c) 800 mV vs. SCE in physiological saline (PS, 0.15 M NaCl) with addition of
H2O2 and/or albumin at 37°C. The solution was stirred for ~100 s at ~1000 s intervals to ensure
complete mixing; for some experiments, a specific amount of H2O2 or albumin (in PS) was
added at ~1000 s intervals immediately before stirring to give a final concentration of 0.1% or
1%.
Page 139
124
5.4.4 Long-time (24 h) OCP behaviour
Figure 5-18 shows the OCP as a function of time for 24 h for mirror-polished Ti6Al4V in
physiological saline with and without H2O2 and albumin. The solution was stirred at intervals
to ensure complete mixing. H2O2 or albumin was added just prior to stirring at ~1 h or ~4 h for
some of the measurements (see Figure 5-18).
At ~1 h following addition of H2O2, the OCP of Ti6Al4V shifted to a higher value when
compared with the OCP in physiological saline alone. At ~4 h when albumin was added into
the H2O2-containing solution, the OCP decreased and this was consistent with the 1 h OCP
measurement (Figure 5-15).
At ~1 h following addition of albumin, the OCP of Ti6Al4V decreased when compared with
the OCP measured in physiological saline alone. Subsequently at ~4 h when H2O2 was added
into the albumin-containing solution, the OCP of Ti6Al4V increased, which again was
consistent with the 1 h OCP measurement (Figure 5-15).
After 24 h exposure, Ti6Al4V exhibited the highest OCP value in H2O2 and the lowest in
albumin whilst the OCP in mixed solutions was close to that in physiological saline, which also
agreed with the previous observations (see Section 5.4.3.1).
Page 140
125
Figure 5-18 OCP as a function of time for 24 h for mirror-polished Ti6Al4V in physiological
saline (PS, 0.15 M NaCl) with and without addition of H2O2 and/or albumin at 37 °C. The
solution was stirred for ~200 s at ~1 h and ~4 h to ensure complete mixing; for some
experiments, a specific amount of H2O2 or albumin (in PS) was added at ~1 h or ~4 h
immediately before stirring to give a final concentration of 0.1% or 4%.
5.5 Discussion
5.5.1 Effect of H2O2 on Ti corrosion
5.5.1.1 Quantification of Ti release
Dissolution of Ti from the three grades of Ti (CP-Ti-G2, CP-Ti-G4 and Ti6Al4V) was observed
following addition of H2O2 (Figure 5-1), indicating decreased corrosion resistance. The finding
is consistent with other studies which have used electrochemical impedance spectroscopy (EIS)
to study the same or similar exposure conditions [17, 111, 112, 132, 185-188]. The Ti
Page 141
126
concentrations quantified in the control solutions (no Ti discs) were negligible. It was observed
that there was no significant difference on the concentration of Ti released from CP-Ti-G2 and
CP-Ti-G4 in the presence of H2O2. Therefore, only CP-Ti-G4 and Ti6Al4V were conducted in
the electrochemical tests.
5.5.1.2 Electrochemistry of Ti corrosion
It is well known that H2O2 is a strong oxidiser and has a high standard reduction potential
(E° = 1.54 V vs. SCE) [57]. Since all experiments were carried out under naturally-aerated
conditions, it is assumed that the cathodic reaction in physiological saline is oxygen reduction.
Whilst in the presence of H2O2 the cathodic reaction is likely to be dominated by the reduction
reaction of H2O2 (Equation 2-9), leading to a higher cathodic current density and also resulting
in a more positive OCP according to the basis of the Evans diagram (mixed potential
theory) [64].
It was observed that the anodic current densities were higher for CP-Ti-G4 and Ti6Al4V in the
presence of H2O2 due to the complexation interaction between Ti and H2O2 [106, 108, 184,
189]. In addition, a higher anodic current density was observed for both CP-Ti-G4 and Ti6Al4V
for a higher concentration of H2O2 and the magnitude of the increase was greater for Ti6Al4V
than CP-Ti-G4, suggesting inferior corrosion resistance of Ti6Al4V, which was consistent with
the Ti release results following immersion studies (Figure 5-1) and other studies [185, 187].
The anodic current density was slightly increased with increasing potential, and an abrupt
increase was observed at 600-800 mV vs. SCE possibly due to O2 evolution from H2O2
(Equation 2-10) or H2O (Equation 5-1). Based on the E-pH (Pourbaix) diagram of H2O/H2O2
system (Figure 2-15), oxidation reaction of H2O2 to form O2 can happen thermodynamically at
Page 142
127
a lower potential (0 mV vs. SCE) and O2 evolution from H2O is also thermodynamically
possible at potential >580 mV vs. SCE in neutral solutions (Equation 5-1) [175]. However, O2
evolution was not observed for CP-Ti-G4 and Ti6Al4V in physiological saline at the applied
potentials, which could be attributed to the stable and/or insulating passive film on the
surface [48, 175]. However, Fonseca and Barbosa [112] reported that the oxide film formed in
the presence of H2O2 showed higher ionic conductivities, which may lead to occurrence of O2
evolution reaction kinetically.
Equation 5-1 O2 + 4H+ + 4e- = 2H2O; E (V vs. SCE) = 0.99 - 0.059pH + 0.0015logp(O2)
5.5.2 Effect of albumin on corrosion of Ti6Al4V
It can be seen from Figure 5-11 that the presence of albumin significantly inhibited the cathodic
reaction of Ti6Al4V, resulting in lower OCP (Figure 5-10), which is consistent with other
studies on Ti alloys [20, 122]. It has also been shown that the cathodic steady state current was
decreased after addition of albumin (Figure 5-17). It has been established that albumin strongly
adsorbs on the surfaces of metals including Ti by chemisorption through amino group or
carboxylate group or through electrostatic interactions [19, 24, 190]. In the current study, it is
possible that albumin rapidly adsorbs onto the surface of Ti6Al4V following immersion and
covers the potential reaction sites or blocks the mass transportation for the cathodic reaction,
which results in a decrease in cathodic current and cathodic steady state current.
In terms of anodic polarisation, higher anodic current densities were observed in the presence
of albumin, possibly due to the suppressed cathodic reaction (stated above) or an enhanced
anodic reaction or even a combination of both. It is reported that albumin can form a complex
or chelate with the metal cations and promote anodic reaction (e.g. stainless steel [19]). A
Page 143
128
similar chelation effect was also proposed on CP-Ti to explain the insignificantly changed
corrosion resistance at open circuit since albumin decreased cathodic current [20]. However, in
the current study, the anodic steady state current densities were decreased following addition
of albumin (Figure 5-17), indicating that the anodic reaction was actually suppressed. Therefore,
the higher anodic current density is more likely to be due to the suppressed cathodic reaction.
It is possible that the cover/block effect by adsorption of albumin also inhibits the anodic
reaction of Ti6Al4V, resulting in lower anodic steady state current. A decreased anodic current
of CP-Ti in a high anodic region was also reported [20]. A lower passive current density of
Ti6Al4V-ELI in the presence of albumin during anodic polarisation was claimed by Padilla and
Bronson [25] using a rotating disc electrode, but there were no details about conducting the
anodic polarisation experiment.
A particularly sharp active peak was found in the presence of 4% albumin (Figure 5-11), which
has not been previously reported, possibly due to the different polarisation methods in previous
studies [26, 28, 122]. In the current study, anodic and cathodic polarisation tests were conducted
separately to reduce the effect of prior cathodic polarisation on anodic polarisation and vice
versa, while the polarisation from very negative cathodic potential (e.g. -1 V vs Ag/AgCl [122])
to a very positive anodic potential (e.g. 1.5 V vs Ag/AgCl [122]) was used in previous
studies [26, 28, 122]. The history of cathodic reaction may have an influence on anodic
behaviour of Ti6Al4V during the polarisation tests. However, the “whole region” polarisation
method (i.e., cathodic and anodic polarisations are carried out in one single potentiodynamic
test) is widely used in most studies, and the reported stability of Ti6Al4V is mainly based on
the change of anodic current, which may lead to inconsistent results in the literature [25, 28,
122].
Page 144
129
In addition, a small increase in Ti release from Ti6Al4V was observed in the presence of
albumin after the immersion test (Figure 5-12). However, the presence of albumin inhibited the
cathodic and anodic reaction in physiological saline. Karimi and Alfantazi [26] reported that
the anodic current density of Ti6Al4V decreased in PBS containing 0.2% and 0.4% albumin,
indicating the increased stability of passive film, but Karimi and Alfantazi [27] also reported in
a following study that more Ti release was found at the same conditions. However, there is no
clear explanation for the contradictory results. They believed that the phosphates leaching from
passive film on the Ti6Al4V surface increase Ti release rate in albumin solutions [27]. Similar
contradictory results can be found in Padilla and Bronson’s work [25] that the passive current
density of Ti6Al4V-ELI decreased in the presence of albumin but corrosion resistance (from
EIS) was also decreased at the same condition. In the current study, it is proposed that the lower
OCP brought about by the suppressed cathodic reaction may drive the dissolution of Ti6Al4V
into the active region, so the presence of albumin increased corrosion rate of Ti6Al4V at the
open circuit.
5.5.3 Effect of the combination of albumin and H2O2 on corrosion of
Ti6Al4V
It can be seen from Figure 5-16 and Figure 5-17 that the cathodic current density and cathodic
steady state current density were lower in the presence of both H2O2 and albumin when
compared with that in H2O2 alone, suggesting that the presence of albumin inhibited the
cathodic reaction of Ti6Al4V in H2O2-containing solutions. Higher anodic current densities
were observed in the presence of mixed solutions when compared with that in the presence of
H2O2 alone (Figure 5-16), which is more likely due to the suppressed cathodic reaction.
Potentiostatic studies showed that the anodic steady state current densities (Figure 5-17) in the
Page 145
130
presence of H2O2 were decreased after addition of albumin, indicating that the presence of
albumin suppressed anodic reaction of Ti6Al4V in H2O2-containing solutions.
It also can be seen from Figure 5-16 and Figure 5-17 that cathodic current density and cathodic
steady state current density of Ti6Al4V were higher in the presence of both H2O2 and albumin
when compared with that in albumin alone, suggesting that the presence of H2O2 promoted the
cathodic reaction of Ti6Al4V in albumin-containing solutions. Potentiostatic studies showed
that the anodic steady state current densities in the presence of albumin were increased after
addition of H2O2 (Figure 5-17), indicating that the presence of H2O2 promoted anodic reaction
in albumin-containing solutions. For anodic polarisation, an abrupt increase in anodic current
was observed in the mixed solution around potential 600±80 mV vs SCE, which is similar to
the observation in H2O2, possibly due to O2 evolution reaction (see Section 5.5.1.2).
Specifically, a considerably higher rate of metal release from Ti6Al4V was observed in the
presence of mixed solutions than that in either albumin or H2O2 alone after the immersion test
(Table 5-3 and Figure 5-12), which has not been reported previously. Although Padilla and
Bronson [25] mentioned the possible effect of H2O2 and albumin because H2O2 was regarded
as an intermediate species in oxygen reduction, there was no direct investigation about the
synergistic effect of H2O2 and albumin on corrosion of Ti alloys. In the current study, it is
proposed that the suppressed cathodic reaction by the addition of albumin taking the potential
of Ti6Al4V into the active region and considerably promotes corrosion.
Figure 5-19 shows a diagram that provides a hypothesis to explain the combined effect of
albumin and H2O2 in the current work.
Page 146
131
Firstly, Ti6Al4V is passivated in physiological saline as shown in Figure 5-19 (point A), which
is consistent with the negligible released Ti concentration (Figure 5-12) and the very low
passive anodic current (Figure 5-16). Ti6Al4V also showed a stable OCP value after 24 h
exposure in physiological saline (Figure 5-18).
Secondly, the presence of H2O2 promotes cathodic and anodic reaction in physiological saline,
resulting in higher Ecorr and higher icorr (point B in Figure 5-19). It was observed from 24 h OCP
measurements that OCP of Ti6Al4V was the highest in the presence of H2O2.
Thirdly, it has been observed that the presence of albumin inhibited cathodic reaction and
anodic reaction of Ti6Al4V in physiological saline. The inhibited cathodic reaction induced by
albumin results in a lower OCP, which may drive the dissolution of Ti6Al4V from the passive
region (point A in Figure 5-19) to the active region (point C in Figure 5-19) and promote
Ti6Al4V corrosion. Ecorr is decreased, and it showed the lowest value in albumin after 24 h
measurement (Figure 5-18), while icorr is increased in albumin-containing solution (Figure 5-12).
It has also been shown that the presence of albumin inhibited cathodic reaction and anodic
reaction of Ti6Al4V in H2O2-containing solutions. The inhibited cathodic reaction in the mixed
solutions resulted in a lower OCP when compared with that in the presence of H2O2 alone, at
which the anodic dissolution may lie in the active region (point D in Figure 5-19), resulting in
considerable dissolution of Ti6Al4V in mixed solutions. It was also observed that the OCP of
Ti6Al4V after 24 h exposure in mixed solutions was higher than that in albumin alone but lower
than that in H2O2 alone (Figure 5-18). Also, the concentration of released V was similar in
between the mixed solutions and H2O2 alone, but there were more released Al in the mixed
solutions after immersion test (Figure 5-12), which may suggest that both α phase and β phase
Page 147
132
dissolve in the active region, since higher Al levels are found in the α phase, whereas higher V
levels are found in the β phase (Figure 4-2).
Figure 5-19 Schematic Evans diagram (mixed potential theory) to show the effect of H2O2,
albumin and the combination of albumin and H2O2 on corrosion potential (Ecorr) and corrosion
current density (icorr) of Ti6Al4V in physiological saline (PS).
5.5.4 Surface morphology
Both CP-Ti-G2 and CP-Ti-G4 showed similar porous corrosion product morphologies after 4
week immersion tests, which is correlated with previous work [17, 111, 112, 130, 132]. It is
firstly proposed by Pan [17, 132] that the oxide films formed on Ti exposed to H2O2 containing
PBS can be described by a two-layer model, which consisted of a thin inner compact layer and
a porous outer layer. In addition, the discoloration of CP-Ti was consistent with other studies,
Page 148
133
possibly due to the difference on the thickness of the corrosion products formed in the presence
of H2O2 [17, 88, 191].
It was observed that the β phase of Ti6Al4V is preferentially attacked in the presence of H2O2
after potentiostatic tests (using SEM and AFM, see Figure 5-6), as well as after immersion tests
(using SEM, see Figure 5-5). This is also consistent with the metal release measurement in this
study, where V (predominately in the β phase) release was more than Al (predominately in the
α phase) release (Figure 5-2). The preferential attack of β phase is also consistent with previous
studies [113, 114]. In addition, the β phase attack with relatively smooth surface was observed
in the mixed solutions of albumin and H2O2 (Figure 5-13 and Figure 5-14). Since it is speculated
that the dissolution of Ti6Al4V at OCP is in the active region in the presence of mixed solution,
the porous corrosion products formed in the presence of H2O2 might dissolve and the
concentrations of released metal increase.
It may be worth mentioning that the preferential attack of β phase was recently reported in the
retrieved hip implant parts [75], which might be explained by the observation in the current
study in the presence of H2O2, since H2O2 is known as an important inflammatory product in
vivo. It is likely that the presence of H2O2 is at play in the peri-implant environment. Crystal
structures of α phase (hcp) and β phase (bcc) of Ti6Al4V are different, which may affect the
oxide film forming on the surface [75]. In addition, there are more V and less Al contents in the
β phase compared with the α phase, so more V-rich oxides may be present over β phase, which
can destroy the passivity of titanium by providing conduction channels [178] and lead to the
preferential corrosion.
Page 149
134
5.6 Conclusions
The effect of H2O2 which is an important inflammation product found in the peri-implant
environment was investigated on CP-Ti (CP-Ti-G2 and CP-Ti-G4) and Ti6Al4V using solution
analysis, surface analysis and electrochemical tests. The influence of albumin, the principle
protein component of blood and extracellular fluid, on the corrosion of Ti6Al4V was also
evaluated. The effect of the co-existence of albumin and H2O2, which will be a better biological
approximation of peri-implant environment under inflammatory conditions, was also
characterised.
1. The presence of H2O2 promotes corrosion of CP-Ti-G2, CP-Ti-G4 and Ti6Al4V, and the
amount of Ti release increases with an increasing concentration of H2O2 in physiological saline.
Ti6Al4V shows the greatest Ti release amongst the three grades of Ti studied. The
electrochemical measurements on CP-Ti-G4 and Ti6Al4V were consistent with the
quantification of Ti release following immersion studies.
2. The presence of albumin strongly inhibits the cathodic reaction and slightly inhibits the
anodic reaction of Ti6Al4V in physiological saline resulting in a lower OCP. During anodic
polarisation, a particularly sharp active peak is observed following addition of albumin (4%)
owing to suppression of the cathodic reaction. The presence of albumin causes a small increase
in Ti release from Ti6Al4V in the long-term immersion tests, which is attributed to decreased
OCP brought about by an inhibited cathodic reaction, leading to dissolution of Ti6Al4V in the
active region.
3. The cathodic reaction rate is higher in the presence of H2O2, which is decreased after the
addition of albumin. The suppression of the cathodic reaction results in a shift of OCP to a more
active region for anodic dissolution and leads to a considerably higher rate of metal release in
Page 150
135
immersion tests in the presence of both albumin and H2O2 when compared with that for either
albumin or H2O2 alone.
4. In the presence of H2O2 the corrosion products of three grades of Ti become more porous
and the β phase of Ti6Al4V is preferentially attacked. Preferential attack of β phase is also
found in albumin and H2O2 mixed solutions.
Page 151
136
6 CELLULAR EFFECTS ON TI CORROSION
6.1 Introduction
The aim of the work described in this chapter was to investigate the corrosion behaviour of Ti
alloys in the presence of microbes that have been shown to colonise implant surfaces. The
corrosion behaviour of Ti alloys was also studied in the presence of polymorphous nuclear
leukocytes (neutrophils) which are abundant immune cells present in the peri-implant tissues.
Corrosion in the presence of the oral microbe Streptococcus sanguinis (S. sanguinis), which is
an early coloniser of dental implants, was studied on three grades of Ti (CP-Ti-G2, CP-Ti-G4
and Ti6Al4V) which possessed two types of surface finish (either mirror-polished or
sandblasted-acid-etched (SLA) surfaces) that mimicked the surfaces of dental implants. The
corrosion behaviours of CP-Ti and Ti6Al4V were investigated by culturing S. sanguinis on Ti
surfaces in artificial saliva followed by measuring the concentration of released Ti and using
SEM to characterise the surface morphology. The methods for culturing bacteria are described
in Section 3.3. To study the influence of neutrophils on Ti corrosion, three grades of Ti with
mirror-polished surfaces were immersed in Tris-buffer and cultured with neutrophils which
were in an un-stimulated or stimulated (by exposure to opsonised Staphylococcus aureus (Ops
Sa)) state. The concentration of the released Ti was measured using ICP-MS and the Ti surfaces
imaged using SEM. The detailed procedures for isolating and culturing neutrophils on Ti alloys
are described in Section 3.4.
Page 152
137
6.2 Effect of S. sanguinis on Ti corrosion in artificial saliva
6.2.1 Surface morphologies of Ti samples
SEM imaging of the Ti samples prior to culturing with S. sanguinis demonstrated that the
mirror-polished CP-Ti-G2 (G2P) surfaces did not appear to exhibit second phase particles,
whereas the CP-Ti-G4 (higher Fe level) (G4P) surfaces contained TiFex intermetallic particles,
and Ti6Al4V (G5P) surfaces possessed the characteristic α/β two phase microstructure
(Figure 6-1). When compared with mirror-polished samples, the SLA surfaces appeared as a
fine network of peaks and depressions with an irregular spacing between peaks of 1-5 μm
(Figure 6-1). The SLA surfaces generated on CP-Ti-G2 (G2S) and on CP-Ti-G4 (G4S)
exhibited similar surfaces profiles whereas the SLA surfaces generated on Ti6Al4V (G5S) were
more irregular with shallower wider depressions and flatter peaks.
After incubating S. sanguinis in artificial saliva for 3 days the bacteria were observed to adhere
to both types of surfaces prepared on all three grades of Ti (Figure 6-2). For the mirror-polished
surfaces, the density of adhered S. sanguinis was typically heterogeneous, however all samples
imaged (n=3 per Ti grade) appeared to possess similar cell numbers. For the SLA surfaces,
S. sanguinis appeared to adhere predominantly inside the surface depressions where they were
potentially shielded from displacing shear forces (Figure 6-2d and Figure 6-2e).
Page 153
138
Figure 6-1 SEM images demonstrating the surface morphology of (a) mirror-polished CP-Ti-
G2 (G2P); (b) mirror-polished CP-Ti-G4 (G4P); (c) mirror-polished Ti6Al4V (G5P); (d) CP-
Ti-G2 with SLA treatment (G2S); (e) CP-Ti-G4 with SLA treatment (G4S); and (f) Ti6Al4V
with SLA treatment (G5S).
Figure 6-2 SEM images demonstrating the formation of a S. sanguinis biofilm on the surface
of (a) mirror-polished CP-Ti-G2 (G2P); (b) mirror-polished CP-Ti-G4 (G4P); (c) mirror-
polished Ti6Al4V (G5P); (d) CP-Ti-G2 with SLA treatment (G2S); (e) CP-Ti-G4 with SLA
treatment (G4S); and (f) Ti6Al4V with SLA treatment (G5S) following 3 days culture in
artificial saliva at 37 °C.
Page 154
139
6.2.2 Quantification of Ti release in artificial saliva
The concentrations of Ti released when S. sanguinis was cultured on Ti samples in artificial
saliva were measured using ICP-MS. The concentration of Ti in the artificial saliva culture
medium (supernatant) and the Ti concentration in the bacteria themselves (bacterial pellet) were
measured separately (Figure 6-3). Increased Ti concentrations were measured in the artificial
saliva for the SLA surface finish samples when compared with mirror-polished samples
following both the bacterial culture and the cell-free immersion. The Ti concentrations in the
supernatants from S. sanguinis bacterial cultures were highest on day 3 when compared with
subsequent measurements taken on day 12, day 21 and day 30 (Figure 6-4). The immersion
medium was retrieved and replaced with fresh medium and new bacterial inoculum every 3
days as detailed in Section 3.3. In terms of the concentration of released Ti from the SLA
samples, the highest concentration of Ti was associated with G2S, followed by G4S and G5S.
The differences could be potentially related to the variability in the SLA surface modification
for the three different Ti grades, leading to differences in the surface areas generated.
For all samples cultured with bacteria, the higher Ti concentrations were associated with
measurements on the bacterial pellets when compared with the supernatant. The relatively high
Ti concentration in the bacteria cultured with Ti compared with the control Ti-free bacteria
culture demonstrates uptake of Ti into the cells. Again the SLA samples of the three grades of
Ti showed increased Ti release when compared with the mirror-polished samples which is
likely to be due to minor variation in the Ti surface area exposed to the culture medium and
available for microbial colonisation.
Page 155
140
Figure 6-3 Plot of the concentration (ppb) of released Ti measured with ICP-MS from the Ti
samples in the absence and presence of S. sanguinis after 3 days incubation in artificial saliva
at 37 °C; n=3 for each condition with the exception of measurements indicated with *, for which
n=1. Error bars refer to 1 standard deviation. G2P: mirror-polished CP-Ti-G2; G4P: mirror-
polished CP-Ti-G4; G5P: mirror-polished Ti6Al4V; G2S: CP-Ti-G2 with SLA treatment; G4S:
CP-Ti-G4 with SLA treatment; and G5S: Ti6Al4V with SLA treatment.
Table 6-1 Mean concentration and standard deviation (ppb) of released Ti measured with ICP-
MS from the Ti samples in the absence and presence of S. sanguinis after 3 days incubation in
artificial saliva at 37 °C; n=3 for each condition with the exception of measurements indicated
with *, for which n=1. G2P: mirror-polished CP-Ti-G2; G4P: mirror-polished CP-Ti-G4; G5P:
mirror-polished Ti6Al4V; G2S: CP-Ti-G2 with SLA treatment; G4S: CP-Ti-G4 with SLA
treatment; and G5S: Ti6Al4V with SLA treatment.
Control group without
bacteria
Bacteria supernatant
group
Bacterial pellet
group
No Ti disc 8±0.5 5±0.4 44±2
G2P 10±0.7 5±1 69±4
G4P 9±0.6 5±1 58±2
G5P 10±2 5±0.5 66±2
G2S 17* 8±2 86±7
G4S 13* 7±1 72±5
G5S 10* 6±1 70±2
Page 156
141
Figure 6-4 Mean concentration (ppb) of released Ti measured with ICP-MS from the Ti samples
in bacteria supernatant at day 3 (D3), day 12 (D12), day 21 (D21) and day 30 (D30) during
S. sanguinis culture in artificial saliva at 37 °C. Error bars refer to 1 standard deviation (n=3).
Control: medium without any Ti disc. G2P: mirror-polished CP-Ti-G2; G4P: mirror-polished
CP-Ti-G4; G5P: mirror-polished Ti6Al4V; G2S: CP-Ti-G2 with SLA treatment; G4S: CP-Ti-
G4 with SLA treatment; and G5S: Ti6Al4V with SLA treatment.
6.3 Discussion - effect of S. sanguinis on Ti corrosion
S. sanguinis is a Gram-positive bacterium which is found in oral biofilms which can form on
Ti dental implant surfaces [135]. The influence of S. sanguinis on Ti corrosion was investigated
in this study by culturing the bacteria on prepared Ti surfaces. It was observed that an immature
biofilm of S. sanguinis formed easily on the samples with either surface finish and on all three
Ti grades (CP-Ti-G2, CP-Ti-G4 and Ti6Al4V) following 3 days of culture. It was observed that
there was high Ti level in bacterial pellets when cultured in the absence of any Ti disc, which
is likely due to the selective uptake of some components from artificial saliva culture-media,
because some Ti level has been observed in artificial saliva medium alone. However, the Ti
Page 157
142
concentrations in the bacteria cultured with Ti were all increased when compared with the
control Ti-free bacteria culture. Ti released from all Ti samples was increased following culture
with S. sanguinis when compared with the bacteria-free controls which indicates that the
microbes promoted Ti corrosion.
These findings can be compared with other studies where decreased corrosion resistance of Ti
has been reported following exposure of Ti surfaces to a number of different bacteria [29, 98,
141]. Investigators comparing the corrosion susceptibility of CP-Ti before and after bacteria
incubation with Streptococcus mutans and Actinomyces naeslundii have reported that the
bacteria cultured on Ti surfaces reduced the corrosion resistance [98, 141]. However, in two
studies, the biofilm had been removed from Ti surface (e.g. by ultrasonically cleaning [98])
before electrochemical tests [98, 141]. In another case, a Ti sample covered with biofilm was
used for electrochemical measurements whilst the test solution was different from the growth
medium for biofilm formation [29]. The state of the interface between biofilm and Ti surface is
likely to have changed and therefore interpretation of the data is complicated.
In addition, studies into the mechanical properties of Ti implants following exposure to
Lactobacillus salivarius and/or S. sanguinis have shown an associated deterioration of
mechanical properties [99]. It has also been reported that the surface roughness of Ti was
increased after culture with Streptococcus mitis [93]. However, in none of these studies was an
increase in Ti release demonstrated which is presumably due to the difficulty of making the
measurements. There is considerable variability in bacterial growth in vitro, and the use of long
incubation periods without media supplementation or exchange complicates accurate metal
release measurements. In this study a short culture time (3 days) was repeated consecutively for
10 episodes, with fresh culture medium and bacterial inoculum on each occasion, allowing
Page 158
143
greater standardisation of cell-numbers and cell viability for each sample throughout the study.
The short culture time also limited the concentration of Ti within the culture medium.
It is established that metabolic products of S. sanguinis include acids [143], and when cultured
in an aerobic environment millimolar levels of extracellular H2O2 are also produced [144, 145,
192]. Both acids and H2O2 may result in the degradation of Ti surfaces, and locally high
concentrations of such metabolic products may develop in micro-environments between the
bacterial cells and the Ti surface. Biofilms which were observed on the surfaces of the Ti
samples are associated with more established micro-environments, which are less influenced
by components from the culture medium. Therefore acid and H2O2 could both accumulate in
the micro-environment under the adherent bacteria (Figure 6-5). The observation that similar
Ti release was observed for all Ti grades suggests that the effect of acidity (no significant
differences among the Ti grades in Chapter 4) is the more important contributor to the observed
Ti release when compared with H2O2 (more Ti release from Ti6Al4V than CP-Ti following
exposure to H2O2 in Chapter 5).
Page 159
144
Figure 6-5 Schematic diagram demonstrating the possibility of the presence of micro/macro
crevice or gap between bacteria aggregates and Ti surfaces; both acid (H+) and H2O2 may
accumulate in the micro-environment under the adherent S. sanguinis.
It was observed that the highest Ti release in the supernatants from S. sanguinis bacterial
cultures was found on day 3 when compared with subsequent measurements on day 12, day 21
and day 30. This is likely to be due to a larger fresh surface area exposed to the culture medium
and bacteria aggregates on day 3 when compared with the following culture time since the Ti
samples were not changed during the whole immersion time.
It was also observed that there was greater Ti release from the SLA samples when compared
with a mirror-polished surface finish (Figure 6-3). Although not quantified in this study, it is
clear that the SLA samples which possessed a surface made up of a fine network of peaks and
depressions (Figure 6-1) had a larger surface area exposed to the culture medium. In addition,
more Ti was released from G2S, followed by G4S and then G5S. The hardness of Ti6Al4V is
higher than CP-Ti-G4 and CP-Ti-G2 [2] and therefore differences in deformation would be
expected to take place among the three Ti grades during the sandblasting process. Moreover,
Page 160
145
S. sanguinis was observed to adhere predominantly in the depressions of the net-like structure
of the SLA surface; however greater cell numbers were not determined (Figure 6-2d and
Figure 6-2e). Significantly higher bacterial adhesion has been reported on roughened surfaces
compared with that on the flat surfaces [137, 138]. Therefore more S. sanguinis cells were
expected on the SLA surfaces when compared with mirror-polished surfaces in this study,
which may increase the chance of developing micro-environments and result in more Ti release.
6.4 Effect of neutrophils on Ti corrosion
6.4.1 Surface morphology
Figure 6-6 shows SEM images of neutrophils in an un-stimulated or stimulated (by Ops Sa)
state on mirror-polished Ti surfaces. It was observed that neutrophils interacted with the
surfaces of all three Ti grades. In the absence and presence of microbial stimulation (Ops Sa),
neutrophils were observed to be similarly activated exhibiting membrane protrusions, evidence
of degranulation (visible “footprints” on the Ti surface which are attributed to deposits of
lysosome granule contents or cell lysis) and neutrophil extracellular traps (NETs) on all Ti
surfaces [16]. Figure 6-7 shows high magnification of “footprint” on Ti surface. It can be seen
that there was not an “attack” on Ti surface, rather a release of intracellular contents which
becomes adhered to the Ti surface.
Page 161
146
Figure 6-6 SEM images of un-stimulated neutrophils and neutrophils stimulated by Ops Sa on
three grades of Ti surfaces after 8 h incubation in Tris-buffer at 37 °C. NETs: neutrophil
extracellular traps.
Page 162
147
Figure 6-7 High magnification of “footprint” (due to degranulation or cell lysis) created by un-
stimulated neutrophils on CP-Ti-G2 surface after 8 h incubation in Tris-buffer at 37 °C.
6.4.2 Quantification of Ti release
Figure 6-8 and Table 6-2 show the concentrations of Ti released from three grades of Ti in the
absence and presence of neutrophils in an un-stimulated or stimulated state. It should be noted
that the sample measured with ICP-MS for each test under each condition was created by
pooling together 24 experimental repeat samples generated under the same conditions to
achieve the required sample volume for the ICP-MS measurements. For each test, neutrophils
were isolated from 4 or 5 individuals to obtain enough cells to be distributed among the 8 groups
(n=24, per group). The detailed experimental procedures are described in Section 3.4.1. The
concentrations of Ti released from CP-Ti-G2, CP-Ti-G4 and Ti6Al4V groups (control groups
without neutrophils) were negligible (Figure 6-8 and Table 6-2).
Increased Ti release from the three grades of Ti was observed in the presence of neutrophils. A
relatively higher Ti concentration was found in the control cell group (without Ti disc) in test 3
Page 163
148
which may be possibly due to previous exposure of one or more of the individual cell donors
to Ti. However, the increase in the amount of released Ti in test 3 remained larger when
compared with the other two tests relative to the baseline concentration of Ti in the control
sample. Natural variability in the concentration of Ti released between tests would be expected
as there is considerable variability in the reactivity of neutrophils obtained from different donors.
In addition, no significant difference was observed for the Ti release between the un-stimulated
neutrophils and neutrophils stimulated with Ops Sa. Ti level was also observed in the control
Ops Sa group, which could be due to low level exposure of the Sa culture to Ti or polyatomic
interferences because of the complexity of the samples.
Page 164
149
Figure 6-8 Concentration (ppb) of Ti released measured with ICP-MS from mirror-polished CP-Ti-G2, CP-Ti-G4, Ti6Al4V in the absence and
presence of neutrophils in an un-stimulated or stimulated (by Ops Sa) state after 8 h incubation in Tris-buffer at 37 °C. Cell-Control: Tris-
buffer+cell without any Ti disc. Ops Sa-Control: Tris-buffer+cell+Ops Sa without any Ti disc.
Page 165
150
Table 6-2 The concentration (ppb) of Ti released measured with ICP-MS from mirror-polished
CP-Ti-G2, CP-Ti-G4, Ti6Al4V in the absence and presence of neutrophils in an un-stimulated
or stimulated (by Ops Sa) state after 8 h incubation in Tris-buffer at 37 °C. The detection limit
is 1 ppb, the value less than 1 ppb is for information only. Cell-Control: Tris-buffer+cell without
any Ti disc. Ops Sa-Control: Tris-buffer+cell+Ops Sa without any Ti disc.
Condition Test 1 Test 2 Test 3
Tris-buffer <0.2 <0.2 <0.2
CP-Ti-G2 0.3 0.4 0.5
CP-Ti-G4 0.2 0.3 0.5
Ti6Al4V 0.5 0.5 0.5
Cell-Control 0.4 0.4 3.5
CP-Ti-G2-Cell 5.3 5.4 12
CP-Ti-G4-Cell 5 4.9 12
Ti6Al4V-Cell 5.1 4.7 11
Ops Sa -Control 3.8 2.2 5.6
CP-Ti-G2-Ops Sa 6 7.4 13
CP-Ti-G4-Ops Sa 6.1 6.3 13
Ti6Al4V-Ops Sa 5.9 6.7 13
6.5 Discussion - effect of neutrophils on Ti corrosion
Neutrophils migrate in large numbers into the tissues surrounding implants as the body’s first
line of defence against infection or injury [152, 153]. The neutrophil has a number of killing
mechanisms which include the release of antimicrobial proteins (degranulation) and the
generation of reactive oxygen species (ROS) through a process termed “respiratory burst” due
to its consumption of oxygen [154, 156, 193]. During “respiratory burst”, ROS species are
directly or indirectly produced, which include superoxide (O2-), hypochlorous acid (HOCl),
H2O2 and chloramines (Figure 6-9) [16, 155, 156]. It is established that bacteria, Ti ions and Ti
dioxide particles can stimulate ROS production from neutrophils which is then released into the
Page 166
151
immediate extracellular environment [16, 157, 158]. In this study, evidence of activated
neutrophils present on Ti surfaces included the “footprints” of degranulation and the formation
of NETs even when no deliberate stimulation with Ops Sa was performed (Figure 6-6).
Figure 6-9 Schematic representation of ROS release from neutrophils [16, 194].
Figure 6-8 shows that the presence of neutrophils resulted in increased Ti release from all three
grades of Ti. No significant effect of Ti grade on the magnitude of Ti release was observed. The
level of Ti in the neutrophils can be estimated if it is assumed that the released Ti is concentrated
within the neutrophils. The neutrophil is assumed to be a sphere with a diameter of 5 μm [152]
and the concentration of neutrophils used was 2.5×10⁶ cells/mL. Thus the volume of neutrophils
in the solution is 1.6×10⁻⁴ mL per mL, so the Ti level in the cellular volume varies between
30 and 60 ppm in this study.
ROS release by macrophages has been previously demonstrated to lead to the release of Ti
when cultured in the presence of a Ti surface [30], but has not been demonstrated in association
with neutrophils. The observed effect of neutrophils is important as neutrophils are the most
abundant immune cells in dental peri-implant sites and the findings confirm that ROS species
Page 167
152
produced are capable of destabilising the passive film on Ti surfaces leading to Ti dissolution.
Apart from H2O2 there is little literature regarding the interactions of ROS species with Ti.
However although not been specifically demonstrated on Ti, HOCl and chloramines have been
reported to induce copper or lead dissolution [195, 196]. Further systematic studies are required
to understand the potential effects of other ROS on Ti to identify which, if any, is more
important in inducing Ti dissolution.
Although increased ROS production has been observed in neutrophils in the presence of Ops Sa
when compared with un-stimulated cells [16], this study demonstrated that the addition of
Ops Sa did not lead to significantly greater Ti release (Figure 6-8). However, for the neutrophils
not exposed to Ops Sa, there was also evidence of stimulation, and it is well accepted that
neutrophils produce a resting level of extracellular ROS [16]. It is possible that the additional
ROS produced by the neutrophils stimulated with Ops Sa interacts directly with these bacteria
and is therefore consumed before it has a chance to encounter the Ti surface. As a result the
actual exposures of ROS species to the Ti surface may have been similar although this was not
demonstrated empirically.
Increased Ti release was observed in test 3 when compared with the other two tests (Figure 6-8).
It is known that the neutrophils of different people behave differently as a function of a variety
of factors including age [197]. Hence, in this study different peoples’ neutrophils may have
different activity and reactivity which is directly related to the magnitude and kinetics of ROS
release. This will directly influence the ROS exposure to the Ti sample, and the consistent
elevation of Ti concentration detected from all experimental groups in test 3 supports this
assumption that the neutrophils isolated for this measurement were more reactive.
Unfortunately, this individual variability is extremely difficult to predict and subsequently
Page 168
153
control. The study is also complicated by the knowledge that Ti released as a consequence of
corrosion can itself potentially stimulate further ROS release from neutrophils or prime
neutrophils to produce more ROS [16]. Stimulation of ROS production from neutrophils has
been demonstrated by metallic Ti particles and TiO2 particles in various sizes or
concentrations [152, 157, 158].
6.6 Conclusions
1. The effect of S. sanguinis on corrosion behaviour of three grades of Ti possessing two types
of surface finish (mirror-polished and sandblasted-acid-etched (SLA)) was investigated using
solution analysis and SEM. The presence of S. sanguinis leads to increased Ti release by
promoting Ti corrosion, especially for the SLA samples.
2. Neutrophils, which are the predominant immune cells in the peri-implant environment, were
incubated with Ti in vitro to investigate the influence on Ti degradation. The presence of
neutrophils leads to more Ti release but this effect may vary between different individuals.
Page 169
154
7 MECHANICALLY-ASSISTED CREVICE CORROSION OF TI
7.1 Introduction
The aim of the work described in this chapter is to design a novel mechanically-assisted crevice
corrosion (MACC) apparatus to simulate the interface between an implant and bone/bone
cement, or the taper interface of modular hip implant for in vitro investigation of MACC
behaviour of Ti alloys. Firstly, the MACC device was tested on a Ti6Al4V/Ti6Al4V couple in
physiological saline with pH indicator to investigate the chemistry of MACC. The surface
morphologies of abrasion scars and abrasion debris were also characterised by SEM. Secondly,
to understand the differences under the static and abrasion conditions, anodic and cathodic
polarisation curves of the Ti6Al4V couple were analysed. The influence of the mechanical
parameters including rotation speed and load in the abrasion status on MACC of Ti6Al4V was
studied in physiological saline. In addition, the preliminary study was also conducted to explore
the influence of albumin, LPS and H2O2 on MACC behaviour of Ti6Al4V using this apparatus.
The average abrasion current and accumulated abrasion charge of the Ti6Al4V couple during
abrasion process were compared in the absence and presence of albumin, LPS and H2O2.
Page 170
155
7.2 Results
7.2.1 MACC apparatus with designed crevice geometry
Figure 7-1a shows that the OCP of the Ti6Al4V couple exhibited a gradually increasing trend
when there was no motion between the two components (static condition) during 1 h immersion.
After this, a potential of 10 mV vs. Ag/AgCl was applied and the current was monitored
(Figure 7-1b, MACC test-1). The steady state current under the static condition (static current)
was very small (<0.1 µA) before rotation. Immediately after rotation started, the current rapidly
increased to ~6 µA (Figure 7-1c) due to the rupture/removal of passive film and exposure of
the underlying bare metal to the solution. The abrasion current slightly increased during the 7 h
abrasion process, possibly due to the development of a more aggressive environment in the
crevice. When the rotation was stopped, the current immediately decreased (Figure 7-1d)
because of repassivation of the metal.
Page 171
156
Figure 7-1 (a) OCP as a function of time for 1 h under static condition (no rotation); (b) current
as a function of time at 10 mV vs. Ag/AgCl with rotation; (c) details of the start of rotation
(solid red box in (b)); (d) end of rotation (dashed red region outlined in (b)) for a Ti6Al4V
couple before, during and after rotation at 0.1 rpm under an applied load of 2400 g in
physiological saline with pH indicator at room temperature (MACC test-1).
Figure 7-2 shows the pH change of the solution during MACC test-1. The acidic region (at the
mouth of the Ti6Al4V couple) and alkaline region (near the Pt mesh) were clearly observed
according to the colour change of the solution. In addition, after uncoupling the rotating and
Page 172
157
stationary parts in the end of the test, the solution inside the cavity of the stationary part (crevice
geometry) was also found to be highly acidic (corrected pH ~2).
Figure 7-2 pH changes during static OCP measurement (no rotation), abrasion process (0-7 h
rotation) and after uncoupling rotating and stationary parts in the end of MACC test-1
(described in Figure 7-1, applied potential: 10 mV vs. Ag/AgCl, load: 2400 g, rotation speed:
0.1 rpm) at room temperature; the outer diameter of the stationary part is 20 mm. The red arrow
points towards the red-coloured acidic region at the crevice site.
Page 173
158
Figure 7-3 shows the OCP as a function of time for the Ti6Al4V couple under static and
abrasion conditions. It can be seen that after the rotation started the OCP rapidly decreased to
~-450 mV vs. Ag/AgCl due to the removal of passive film and exposed bare metal surface to
the solution. The abrasion process lasted for 7 h. When the rotation was stopped the OCP
rapidly increased because of repassivation of the metal. It also can be seen that the pH of the
solution became a little alkaline after abrasion. The solution in the cavity of the stationary part
was found to be highly acidic (corrected pH ~2) after uncoupling the rotating and stationary
parts in the end of the OCP test (Figure 7-3).
Page 174
159
Figure 7-3 (a) OCP as a function of time for the Ti6Al4V couple and (b-d) pH change of
physiological saline during static and abrasion (rotation 0.1 rpm) conditions under an applied
load of 3200 g at room temperature; the outer diameter of the stationary part is 20 mm.
Page 175
160
7.2.2 Surface morphology
Figure 7-4 shows the stationary part of the Ti6Al4V couple before and after MACC test-1. It
can be seen that more abrasion scars appeared on the stationary part after the MACC test-1.
Some abrasion scars can be seen before the test, because the Ti6Al4V couple had previously
been used for preliminary experiments.
Figure 7-5 shows SEM images of the abrasion scars. Severe plastic deformation of the Ti6Al4V
surface with detached particles with different sizes and shapes was observed over the abrasion
area.
Figure 7-4 Optical images of the stationary part (a) before and (b) after MACC test-1 (described
in Figure 7-1, applied potential: 10 mV vs. Ag/AgCl, load: 2400 g, rotation speed: 0.1 rpm) in
physiological saline at room temperature.
Page 176
161
Figure 7-5 SEM images of (a) regions with few scars; (b-d) regions with clear abrasion scars
on the stationary part after MACC-test 1 (described in Figure 7-1, applied potential: 10 mV vs.
Ag/AgCl, load: 2400 g, rotation speed: 0.1 rpm) at room temperature.
To characterise the black debris collected from the cavity in the stationary part, another MACC
test (MACC test-2) was conducted in physiological saline without pH indicator. Similar to
MACC test-1, the OCP of the Ti6Al4V couple showed a gradually increasing trend under static
conditions during 1 h immersion (data not shown). After this, a potential of 40 mV vs. Ag/AgCl
(the final OCP) was applied and current was monitored (load: 3200 g, rotation speed: 0.1 rpm,
abrasion time: 7 h, data not shown).
Page 177
162
Figure 7-6 shows the morphology of the collected black debris after MACC test-2. The
fragments were variously shaped with sizes from several to hundreds of micrometres, which
are similar to the detached particles on the stationary part (Figure 7-5). The fragments were
mainly Ti6Al4V metallic particles (EDX in Figure 7-6c).
Figure 7-6 (a) A picture of the collected black debris; (b, d-k) SEM images and (c) EDX
spectrum of abrasion black debris after MACC test-2 in physiological saline without pH
indicator (applied potential: 40 mV vs. Ag/AgCl, load: 3200 g, rotation speed: 0.1 rpm) at room
temperature.
Page 178
163
7.2.3 Anodic and cathodic polarisation curves
Figure 7-7a shows the OCP as a function of time for the Ti6Al4V couple under the static and
abrasion conditions before anodic and cathodic polarisation measurements. It can be seen that
the Ti6Al4V couple exhibited a gradually increasing trend under static conditions (static OCP)
while the OCP of the Ti6Al4V rapidly decreased at the start of rotation (abrasion OCP). The
abrasion OCP was much more negative than the static OCP. Since the final static OCP of the
Ti6Al4V couple were not exactly the same, a potential of 0 mV vs. Ag/AgCl was chosen for
the potentiostatic measurements in the following sections.
Figure 7-7b shows the anodic and cathodic polarisation curves of the Ti6Al4V couple in
physiological saline under static and abrasion conditions. The cathodic polarisation curves
under the static and abrasion conditions were similar, while the anodic current under the
abrasion condition became higher than the static condition, due to the increased anodic reaction
of bare metal as a result of destruction of passive film during the abrasion process.
Page 179
164
Figure 7-7 (a) OCP as a function of time; (b) anodic (solid line) and cathodic (dash line)
polarisation curves of the Ti6Al4V couple in physiological saline during the static and abrasion
(rotation at 0.1 rpm) processes under an applied load of 3200 g at room temperature. The anodic
polarisation curves were measured by sweeping the potential from -50 mV below the OCP to
1000 mV vs. Ag/AgCl at a rate of 1 mV/s, and the cathodic polarisation curves were measured
by sweeping the potential from 50 mV above the OCP to -1500 mV vs. Ag/AgCl at a rate of
1 mV/s.
7.2.4 Effect of rotation speed and load on abrasion OCP
Figure 7-8 shows the schematic diagram of the sequence of different rotation speeds applied to
investigate its effect on abrasion OCP of the Ti6Al4V couple in physiological saline.
Page 180
165
Figure 7-8 Schematic diagram of one sequence of rotation speeds used to study the effect of
rotation speed on abrasion OCP, the reverse order was also used for comparison with the normal
order.
Figure 7-9 shows the OCP change of the Ti6Al4V couple with different rotation speeds under
different loads. When the applied load was 250 g, the abrasion OCP decreased with increasing
rotation speed (Figure 7-9a). To confirm that the change in OCP was not a time-dependent
change (a “history effect”), the OCP was also monitored as the rotation speed was progressively
decreased. With a decrease in rotation speed, the abrasion OCP became less negative (shown
in Figure 7-9b). The similar trend of abrasion OCP was also observed when a higher load of
3200 g was used (Figure 7-9c and Figure 7-9d).
Figure 7-10 shows that the abrasion OCP became more negative under a greater load than under
a smaller load, possibly due to the increased contact area under a higher load.
Page 181
166
Figure 7-9 OCP of the Ti6Al4V couple in physiological saline before, during and after rotation
at different speeds under applied loads (a-b) 250 g and (c-d) 3200 g at room temperature (the
sequence of the used rotation speeds is shown in Figure 7-8).
Page 182
167
Figure 7-10 OCP comparison of the Ti6Al4V couple in physiological saline at (a) 0.1 rpm and
(b) 0.5 rpm under different applied loads at room temperature.
7.2.5 Effect of rotation speed and load on abrasion current
Figure 7-11 shows the schematic diagram of the sequence of applied rotation speed to
investigate its effect on abrasion current of the Ti6Al4V couple in physiological saline.
Figure 7-11 Schematic diagram of one sequence of applied rotation speed to study its effect on
abrasion current.
Page 183
168
Figure 7-12 shows the current as a function of time for the Ti6Al4V couple in physiological
saline at a potential of 0 mV vs. Ag/AgCl with different rotation speeds and different loads.
The abrasion current of the Ti6Al4V couple increased with increasing rotation speed for both
applied loads.
In addition, Figure 7-13 shows that the abrasion current was much higher under a greater load
than a smaller load at a same rotation speed, and also demonstrates that this behaviour is
consistent over time since the traces shown for each rotation speed were carried out before and
after measurements at higher rotation speeds (see Figure 7-12).
Figure 7-12 Current as a function of time for the Ti6Al4V couple in physiological saline at
different rotation speeds under applied loads of (a) 250 g and (b) 3200 g at 0 mV vs. Ag/AgCl
at room temperature.
Page 184
169
Figure 7-13 Abrasion current comparison of the Ti6Al4V couple in physiological saline at a
rotation speed of (a) 0.1 rpm and (b) 0.5 rpm under different applied loads at 0 mV vs. Ag/AgCl
at room temperature. The same data are shown as a function of time in Figure 7-12.
7.2.6 Effect of albumin, LPS and H2O2 on MACC of Ti6Al4V
7.2.6.1 Effect of time at OCP for the static couple on the subsequent abrasion
current
Figure 7-14a shows the OCP as a function of different time for the static Ti6Al4V couple in
physiological saline for four different tests. The values of the static OCP varied amongst the
different tests (Table 7-1), possibly due to different levels of damage to the passive films on the
two surfaces during assembly. Figure 7-14b shows the subsequent abrasion currents as a
function of time, which show that the value of static OCP and the time at OCP before the
abrasion test did not have a significant effect on the average abrasion current. Figure 7-14c and
Figure 7-14d show the average values of the abrasion current in the four tests and the corrected
pH of the solution in the cavity at the bottom of stationary part after the tests as a function of
the final OCP prior to the test and the time length at OCP prior to the test, respectively. It is
clear that neither the final OCP nor the length of time at OCP had an effect on the subsequent
Page 185
170
abrasion currents or corrected pH, so the subsequent experiments were all carried out with
10 minutes of static OCP measurements prior to abrasion tests.
Figure 7-14 (a) Static OCP as a function of time prior to MACC (abrasion at 0.1 rpm) tests; (b)
current as a function of time at a potential of 0 mV vs. Ag/AgCl following OCP measurements;
(c) average abrasion current and corrected pH vs. final static OCP and (d) average abrasion
current and corrected pH vs. static OCP measuring time length of the Ti6Al4V couple in
physiological saline under an applied load of 3200 g at room temperature. Error bars refer to 1
standard deviation. The corrected pH refers to the pH of the solution in the cavity in the
stationary part of the couple.
Page 186
171
Table 7-1 Experimental parameters during static OCP measurements and subsequent MACC
(abrasion at 0.1 rpm) tests of the Ti6Al4V couple at 0 mV vs. Ag/AgCl under applied load of
3200 g in physiological saline at room temperature. The corrected pH refers to the pH of the
solution in the cavity in the stationary part of the couple.
7.2.6.2 Typical MACC Experiment
For each experiment, a sequence of 12 tests was carried out to examine the effect of a species
(albumin, LPS or H2O2) on MACC behaviour of the Ti6Al4V couple. In between each test, the
solution was removed; the Ti6Al4V couple, MACC cell and electrodes were all cleaned with
deionised water. Afterwards, the cell was reassembled and a fresh solution was added. In each
experiment, the sequence of the solution used in individual tests was ABBA or BAAB (A:
physiological saline, B: physiological saline with addition of albumin, LPS or H2O2) to reduce
the “history” effect (time-dependence).
Figure 7-15 shows one typical MACC test of the Ti6Al4V couple in physiological saline at
0.1 rpm (i.e. 600 s per cycle) under a load of 3200 g at room temperature. The abrasion process
lasted for 3600 s (6 cycles). The average abrasion current and total accumulated abrasion charge
during the whole abrasion process (3600 s) was calculated and compared for a series of MACC
tests in the following sections. Moreover, the accumulated abrasion charge in each cycle of the
abrasion process was also calculated and compared separately.
Final static OCP
(mV vs. Ag/AgCl)
Static OCP
measuring time
length (min)
Average
abrasion current
(µA)
Corrected
pH
Test 1 -20 60 8±2 3.9
Test 2 -100 10 8±2 4.1
Test 3 -210 30 10±2 4.2
Test 4 -20 10 9±3 4.2
Page 187
172
It should be noted that a potential of 0 mV vs. Ag/AgCl was applied to investigate the effect of
albumin and LPS on MACC of Ti6Al4V in physiological saline. For the effect of H2O2, a
potential of 300 mV vs. Ag/AgCl was applied due to a more positive OCP value of the Ti6Al4V
couple in physiological saline with addition of H2O2.
Figure 7-15 A typical MACC test of the Ti6Al4V couple in physiological saline at 0 mV vs.
Ag/AgCl at 0.1 rpm (i.e. 600 s per cycle) under an applied load of 3200 g at room temperature.
The abrasion process lasted for 3600 s (6 cycles).
7.2.6.3 Effect of albumin on MACC of Ti6Al4V
Table 7-2 lists the experimental parameters from a series of MACC tests of Ti6Al4V in
physiological saline in the absence and presence of albumin. It can be seen that the static OCP
in each test was negative to 0 mV vs. Ag/AgCl and the static current was very small (<0.3 µA)
before rotation (Table 7-2). After each test, the cavity in the stationary part of the couple was
Page 188
173
acidic, but the corrected pH did not show any significant change between the solutions with and
without albumin.
Table 7-2 Experimental parameters from a series of MACC tests of the Ti6Al4V couple at
0.1 rpm under an applied load of 3200 g in physiological saline (PS) with and without 1%
albumin (A*) at 0 mV vs. Ag/AgCl at room temperature. Total accumulated abrasion charge
refers to the values during the whole abrasion process (3600 s). The corrected pH refers to the
pH of the solution in the cavity in the stationary part of the couple.
Figure 7-16 shows the average abrasion current and total accumulated abrasion charge during
each test. They follow the same trend since both are calculated by using all the data points of
currents in each test. There is significant variation from test to test, which may be a result of
differences in the way in which the cell was reassembled between every test. However, the
No.
Final static
OCP
(mV vs.
Ag/AgCl)
Average
abrasion
current
(µA)
Corrected
pH
Static current
before rotation
(µA)
Total
accumulated
abrasion
charge
(Q/mC)
1 PS -220 10±3 3.9 <0.3 36
2 PS+A* -260 7±2 3.6 <0.3 27
3 PS+A* -260 9±1 3.5 <0.2 31
4 PS -230 11± 2 3.9 <0.2 39
5 PS -110 16±4 3.9 <0.1 59
6 PS+A* -170 10±2 4 <0.2 36
7 PS+A* -130 8±2 4.1 <0.2 27
8 PS -130 9± 2 4 <0.1 32
9 PS+A* -50 9±3 4.1 <0.1 31
10 PS -90 12±4 3.9 <0.1 43
11 PS -90 14±4 3.9 <0.1 50
12 PS+A* -120 9±2 4 <0.2 32
Page 189
174
average abrasion current and total accumulated abrasion charge tend to be smaller in the
presence of albumin.
Figure 7-16 Average abrasion current and total accumulated abrasion charge during the whole
abrasion process (3600 s) from a series of MACC tests of the Ti6Al4V couple at 0.1 rpm under
an applied load of 3200 g in physiological saline (PS) with and without 1% albumin (A*) at
0 mV vs. Ag/AgCl at room temperature.
Figure 7-17a shows the accumulated abrasion charge for each cycle of the abrasion process
from a series of MACC tests. It can be seen that the 1st cycle of the abrasion process has a
similar charge in physiological saline with and without albumin. The accumulated abrasion
charge tends to become higher in subsequent cycles in physiological saline without albumin,
possibly due to the formation of a more aggressive solution in the crevice. In contrast, the
accumulated abrasion charge tends to become lower for subsequent cycles in albumin-
containing solutions. Figure 7-17b also shows the presence of albumin decreased the total
accumulated abrasion charge of the Ti6Al4V couple over all the tests.
Page 190
175
Figure 7-17 (a) Accumulated abrasion charge for each cycle of the abrasion process from a
series of MACC tests; (b) total accumulated abrasion charge over all tests of the Ti6Al4V
couple at 0.1 rpm under an applied load of 3200 g in physiological saline (PS, black) with or
without 1% albumin (A*, red) at 0 mV vs. Ag/AgCl at room temperature.
Page 191
176
7.2.6.4 Effect of LPS on MACC of Ti6Al4V
Table 7-3 lists the experimental parameters from a series of MACC tests of the Ti6Al4V couple
in the absence and presence of LPS. The final static OCP in each test was less than 0 mV vs.
Ag/AgCl and the static current was also very small (<0.2 µA) before rotation (Table 7-3). The
solution in the cavity of the stationary part was also acidic but there was no significant
difference in corrected pH between the solutions with and without addition of LPS.
Table 7-3 Experimental parameters from a series of MACC tests of the Ti6Al4V couple at
0.1 rpm under an applied load of 3200 g in physiological saline (PS) with and without
150 µg/mL LPS at 0 mV vs. Ag/AgCl at room temperature. Total accumulated abrasion charge
refers to the values during the whole abrasion process (3600 s). The corrected pH refers to the
pH of the solution in the cavity in the stationary part of the couple.
No.
Final static
OCP
(mV vs.
Ag/AgCl)
Average
abrasion
current
(µA)
Corrected
pH
Static current
before rotation
(µA)
Total
accumulated
abrasion
charge
(Q/mC)
1 PS -30 11±3 4 <0.1 40
2 LPS -150 15±4 3.8 <0.2 52
3 LPS -130 9±2 4.2 <0.1 32
4 PS -120 12±2 3.8 <0.1 42
5 PS -50 14±2 4 <0.1 49
6 LPS -130 15±4 3.8 <0.1 52
7 LPS -110 9±2 4 <0.1 31
8 PS -180 11±3 4.1 <0.2 41
9 LPS -120 10±2 3.9 <0.1 35
10 PS -170 9±2 4.2 <0.2 33
11 PS -150 11±2 3.9 <0.2 39
12 LPS -140 12±3 3.8 <0.2 41
Page 192
177
Figure 7-18 shows that the average abrasion current and total accumulated abrasion charge
during each test. They follow the same trend and there is no significant difference of either
abrasion current or abrasion charge between the LPS-containing and LPS-free solutions.
However, the variation of abrasion current and abrasion charge for each test at the same
conditions was also very big.
Figure 7-18 Average abrasion current and total accumulated abrasion charge during the whole
abrasion process (3600 s) from a series of MACC tests of the Ti6Al4V couple at 0.1 rpm under
an applied load of 3200 g in physiological saline (PS) with and without 150 µg/mL LPS at
0 mV vs. Ag/AgCl at room temperature.
Figure 7-19a shows the accumulated abrasion charge for each cycle of the abrasion process. It
can be seen that the accumulated abrasion charge has a similar trend in physiological saline
with and without LPS. The abrasion charge appears to be higher following abrasion cycles in
both types of solutions, possibly due to the formation of a more aggressive crevice environment.
However, the variation of the abrasion charge for each test at the same conditions was also very
Page 193
178
big. The presence of LPS did not show measurable effect on the abrasion charge. Figure 7-19b
also shows no measurable differences between the solutions with and without LPS in the total
abrasion charge over all the tests.
Figure 7-19 (a) Accumulated abrasion charge for each cycle of the abrasion process from a
series of MACC tests; (b) total abrasion charge over all tests of the Ti6Al4V couple at 0.1 rpm
under an applied load of 3200 g in physiological saline (PS) with and without 150 µg/mL LPS
at 0 mV vs. Ag/AgCl at room temperature.
Page 194
179
7.2.6.5 Effect of H2O2 on MACC of Ti6Al4V
Figure 7-20 shows polarisation curves for the Ti6Al4V couple in physiological saline with and
without H2O2 in the presence and absence of rotation (abrasion at 0.1 rpm) following 10 min
OCP measurements. It can be seen that the static OCP, cathodic current and anodic current of
the Ti6Al4V couple under static conditions were all increased in the presence of H2O2, which
is consistent with the previous observations noted in Chapter 5. The abrasion OCP and cathodic
current under abrasion conditions were also increased after the addition of H2O2. However, the
anodic current did not show a significant change between the static condition and abrasion
condition. Due to the increased static OCP in the presence of H2O2, a potential of 300 mV vs.
Ag/AgCl was applied for the following tests.
Page 195
180
Figure 7-20 Anodic and cathodic polarisation curves of the Ti6Al4V couple in physiological
saline (PS) with and without 0.1% H2O2 under static and abrasion (0.1 rpm) conditions with an
applied load of 3200 g at room temperature. A potential of 300 mV vs. Ag/AgCl (shown as a
red arrow in the figure) was chosen for the subsequent experiments. The anodic polarisation
curves were measured by sweeping the potential from -50 mV below the OCP to 800 mV vs.
Ag/AgCl at a rate of 1 mV/s, and the cathodic polarisation curves were measured by sweeping
the potential from 50 mV above the OCP to -900 mV vs. Ag/AgCl at a rate of 1 mV/s.
Table 7-4 lists the experimental parameters from a series of MACC tests of Ti6Al4V in
physiological saline in the absence and presence of H2O2. The final static OCP in each test was
less than 300 mV vs. Ag/AgCl and the static current was small (<1 µA) before rotation
(Table 7-4). The solution in the cavity in the stationary part of the Ti6Al4V couple after each
Page 196
181
test was acidic, but the corrected pH did not show a significant difference between in the
presence and absence of H2O2.
Table 7-4 Experimental parameters from a series of MACC tests of the Ti6Al4V couple at
0.1 rpm under an applied load of 3200 g in physiological saline (PS) with and without 0.1%
H2O2 at 300 mV vs. Ag/AgCl at room temperature. Total accumulated abrasion charge refers
to the values during the whole abrasion process (3600 s). The corrected pH refers to the pH of
the solution in the cavity in the stationary part of the couple.
No.
Final static
OCP
(mV vs.
Ag/AgCl)
Average
abrasion
current
(µA)
Corrected
pH
Static current
beforerotation
(μA)
Total
accumulated
abrasion
charge
(Q/mC)
1 H2O2 170 15±2 3.8 <1 53
2 PS 90 13±2 4 <0.8 47
3 PS 140 14±4 4 <0.3 50
4 H2O2 240 13±2 3.8 <0.2 47
5 PS 120 10±2 4 <0.2 37
6 H2O2 250 11±2 3.8 <0.2 39
7 H2O2 280 9±2 3.8 <0.2 34
8 PS 140 10±2 4 <0.3 35
9 H2O2 270 12±3 3.6 <0.1 44
10 PS 120 11±2 3.6 <0.3 39
11 PS 100 11±2 3.6 <0.3 39
12 H2O2 250 12±2 3.6 <0.1 43
Figure 7-21 shows the average abrasion current and total accumulated abrasion charge during
each test. They have the same trend in each test and there is no noticeable change in H2O2-
containing and H2O2-free solutions.
Page 197
182
Figure 7-21 Average abrasion current and accumulated abrasion charge during the whole
abrasion process (3600 s) from a series of MACC tests of the Ti6Al4V couple at 0.1 rpm under
an applied load of 3200 g in physiological saline (PS) with and without 0.1% H2O2 at
300 mV vs. Ag/AgCl at room temperature.
Figure 7-22a shows the accumulated abrasion charge for each cycle of the abrasion process. It
can be seen that the abrasion process has a similar charge in the absence and presence of H2O2.
There is relatively small increase in the accumulated abrasion charge following abrasion cycles
in both types of solutions. The addition of H2O2 did not show measurable effect on the abrasion
charge. The variation of the accumulated abrasion charge for each test at the same condition
was also very big. Figure 7-22b shows no measurable differences between the solutions with
and without H2O2 in total abrasion charge over all the tests.
Page 198
183
Figure 7-22 (a) Accumulated abrasion charge for each cycle of the abrasion process from a
series of MACC tests; (b) total abrasion charge over all tests of the Ti6Al4V couple at 0.1 rpm
under an applied load of 3200 g in physiological saline (PS) with and without 0.1% H2O2 at
300 mV vs. Ag/AgCl at room temperature.
Page 199
184
7.3 Discussion
7.3.1 MACC apparatus
Mechanically-assisted crevice corrosion (MACC) plays a decisive role in implant degradation.
MACC may take place in any Ti biomedical implants in human body where two metal
components are in contact or where a metal component is in contact with another surface such
as bone or cement. It can take place at dental implants [15, 16], bone-anchored hearing aids
(BAHA) [14], hip stem [7, 8] and the modular implant interfaces [33, 74, 77], leading to Ti
release and degradation/failure of the implants. Severe degradation of contacting surfaces has
been widely observed in modular hip prostheses e.g. at the neck-stem interface [33, 75, 76]. For
example, severe corrosion was observed for hip implants at the junction between CoCrMo
heads and Ti6Al4V necks after only 2.5 months of implantation [33]. In addition, it has been
demonstrated that cemented Ti stems are also susceptible to MACC and the pH of body fluid
around corroded cemented Ti stems can reach a value as low as 2.5 [7]. The presence of an
occluded crevice between modular taper interfaces and stem and cement interfaces can induce
a significant change in the solution chemistry [7, 8, 33].
For modular tapers, there is little exchange between the solution in the crevice and the exterior
solution due to the small scale of movement (<250 µm [78, 83]) compared with the large contact
area (up to 600 mm2 [76]) of modular implants, which results in formation of a more aggressive
environment inside the crevice and active corrosion of the metal implant.
In the current study, the pH change of the solution was clearly observed during the abrasion
process of the Ti6Al4V couple in the MACC apparatus (Figure 7-2). The acidic region was
clearly observed near the Ti6Al4V couple and an alkaline region was located near the Pt mesh.
Page 200
185
In addition, after the abrasion process, the pH of solution in the cavity in the stationary part
(crevice geometry) was acidic (pH ~2-4 depending on the time length of abrasion). It has also
been shown that the solution in the cavity in the stationary part became highly acidic after
abrasion under freely corroding conditions (Figure 7-3), which agrees with the MACC study
that used manufactured implants [37]. They found the pH between the modular taper junctions
was decreased by 0-3 units after long-time cyclic loading tests.
During MACC tests, the mechanical process induces rupture of the passive oxide film on the
surface of the Ti6Al4V couple, leading to a burst of Ti dissolution and freshly-exposed bare
metal surface [33]. The anodic reaction is promoted under abrasion conditions compared with
the static conditions. Increased anodic reaction takes place when there are more Ti ions in the
crevice. Hydrolysis of the accumulated Ti ions can produce more H+ ions; Cl- ions are also
drawn into the crevice to maintain the charge balance, which results in forming a strong HCl
solution with a very low pH in the crevice. Therefore an acidic region is observed around the
Ti6Al4V couple. Outside the couple, the bulk solution is neutral and O2-rich. O2 reduction
reaction is expected to take place on the Pt mesh, producing OH- ions and leading to an alkaline
region.
Most research in this area has involved “fretting corrosion” apparatus with relatively small
contact areas (Table 2-2, e.g. 0.1-0.5 mm2 on pin-on-disc geometry in Swaminathan and
Gilbert’s study [34]) to investigate fretting behaviour of metal implants [34, 35, 82]. During
these “fretting corrosion” movements with the small scale amplitudes (Table 2-2, <200 µm),
part or majority of the abrasion areas can be exposed and may be readily flushed by bulk
solution and further repassivated. Meanwhile, the dissolved metal ions can also escape easily
and aggressive crevice chemistry cannot be developed. Although Swaminathan and Gilbert [34]
Page 201
186
reported the possibility of the presence of crevice corrosion in their “fretting corrosion” device,
there was no direct evidence apart from a slight increase in recovery time of metal couples after
long-time fretting under high loads.
The MACC device used in this work has an occluded crevice with a large contact area (110 mm2,
Figure 3-5). During the abrasion process, there was almost no abrasion area exposed to the bulk
solution and it was also difficult for the metal ions to escape, which facilitated the development
of the type of aggressive crevice chemistry that modular tapers may experience in vivo.
Although most “fretting corrosion” devices have small amplitudes (<200 µm [34, 35, 82]) that
are much closer to the movement of modular implants (<250 µm [78, 83]), they may not be
able to develop crevice chemistry that modular implants experience in vivo. 1 Hz (i.e. the
average frequency of human walking) is normally used in these “fretting corrosion” studies [34,
82, 168]. However, it is very difficult to control the precise reciprocating micro-movement for
the MACC apparatus in the current work. Therefore, a continuous rotational motion with a very
small rotation rate (<100 µm/s at 0.1 rpm) was applied in this MACC apparatus. The
mechanical process during rotation results in continuous removal of passive film and exposure
of bare metal surface, which further increases the amount of metal ions and results in forming
an aggressive environment. Therefore, the MACC test in the current work is an accelerated
experiment.
7.3.2 Abrasion scars and debris
Many in vivo studies have shown the existence of Ti particles/debris of different sizes in peri-
implant tissues around dental implants [15, 16, 71], BAHA [14], and modular tapers [77, 198].
For example, Ti particles in a range of 0.01 to 200 µm were found in the tissue around modular
Page 202
187
interfaces [77]. In the current study, it has been shown that both surface deformation and large
and fine abrasion particles were present over the abrasion area (Figure 7-5), as well as the black
debris with various shapes and sizes collected in the cavity at the bottom of the stationary part
(Figure 7-6).
During the abrasion process, contacting asperities are expected to experience severe plastic
deformation and bare Ti6Al4V metal surface can be exposed to the solution for oxidation.
Repeated deformation results in more oxidation of the metal surface [163]. The mechanical
force can lead to mixture of the bare metal and oxide and the formation of an initial deformed
layer on the surface. Depending on the extent of deformation and oxidation, some abrasion
regions might be entirely oxidised [34], leading to a deformed layer that can become brittle and
prone to form detached particles [169]. In the presence of mechanical force, the detached
metallic particles and oxides smear into the deformed layer (a third body), which contributes to
increased degradation [160, 170]. Some large detached particles may be crushed into fine
particles over the abrasion area. In addition, surface oxide may reduce the adhesive strength
between detached particles and the metal surface, facilitating their ejection from the abrasion
area into the surrounding environment [169]. Therefore both large flakes and fine debris were
observed in the crevice geometry of the stationary part.
The abrasion debris was easily collected from the cavity in the stationary part of the MACC
couple. The Ti particles/debris released into the human body which has been reported to induce
adverse cellular reactions e.g. pain, peri-inflammation even failure of the implants [7, 14, 71,
85]. Therefore, the collected abrasion debris after MACC tests in this study may be used to
investigate the potential effect on responses/functions of human cells through in vitro and/or
in vivo tests.
Page 203
188
7.3.3 Effect of rotation speed and load on MACC of Ti6Al4V
As expected, the OCP of the Ti6Al4V couple rapidly decreased upon the onset of rotation. With
an increase in the rotation speed and load, the abrasion OCP became more negative (Figure 7-9
and Figure 7-10). The current of the Ti6Al4V couple rapidly increased at the beginning of
abrasion and the abrasion current increased with increasing rotation speed and load (Figure 7-12
and Figure 7-13). The mechanical process removed the surface oxide film and the bare surface
was exposed to the solution for oxidation, which resulted in decreased OCP and increased
current.
With an increase in the rotation speed, i.e. increasing rotation frequency, more bare metal
surfaces per unit time were exposed to the corrosion environment, which resulted in higher
abrasion current and lower abrasion OCP [165, 169, 171]. With an increase in the load, the
pressure between the contact surfaces was increased resulting in more effective exposure of the
fresh bare metal surface to abrasion and yielding the observed increase in abrasion current and
decrease in OCP [96, 122].
7.3.4 Effect of albumin, LPS and H2O2 on abrasion charge
7.3.4.1 Effect of albumin on abrasion charge
It has been observed that the presence of albumin decreased the accumulated abrasion charge
of the Ti6Al4V couple in physiological saline (Figure 7-17). A similar inhibition effect of
albumin on average abrasion current or abrasion charge has been reported for Ti6Al4V-ELI
during an intermittent tribocorrosion test [166] and 316 stainless steel during “fretting corrosion”
test [81].
Page 204
189
However, in other tribocorrosion experiments on Ti6Al4V, albumin has been found to increase
average abrasion current at a high potential but decrease abrasion current at a low potential [36].
Whilst in “fretting corrosion” experiment on Ti6Al4V, the presence of albumin has been
reported to cause no change to the average abrasion current [122]. In both tribocorrosion and
“fretting corrosion” studies, a small contact area with an Al2O3 sphere (10 mm in diameter) on
Ti6Al4V disc was used (Table 2-2), where an effective crevice chemistry cannot be developed,
which is different from the current MACC study.
Protein is thought to affect abrasion current by acting as lubricant or by interfering with the
oxidation [166]. It is well established that albumin can strongly adsorb on Ti surfaces [24]. It
was found that the addition of albumin inhibited the anodic reaction under static conditions (in
Chapter 5). It is likely that the presence of albumin may also block the reaction sites on the
surface under abrasion conditions, decreasing abrasion current and the according accumulated
abrasion charge.
It has been reported that the presence of serum (containing albumin as the main protein) can
have an effective lubricating function during tribological tests on CoCrMo alloy [124, 199].
This lubricant layer may modify the mechanical stress, probably decreasing effective abrasion
area, resulting in decreased abrasion current [124, 199]. In the current study, the accumulated
abrasion charge of the Ti6Al4V couple was observed to be similar at the 1st cycle of the
abrasion process in physiological saline in the absence and presence of albumin. From the 2nd
cycle the accumulated abrasion charge tended to become noticeably lower in the albumin-
containing solutions (Figure 7-17). This suggests that the development of the protective effect
of albumin is not immediate, which may provide evidence for the gradual formation of a
protein-rich lubricating layer on the surface.
Page 205
190
7.3.4.2 Effect of LPS and H2O2 on abrasion charge
Average abrasion current and accumulated abrasion charge of the Ti6Al4V couple did not
change significantly after addition of LPS or H2O2. There is little previous work on the effect
of LPS or H2O2 on tribocorrosion or “fretting corrosion” of metallic implants [121, 172]. One
paper stated that the presence of LPS increased wear-corrosion weight loss and reduced the
corrosion resistance of CP-Ti and Ti6Al4V by comparing impedance before and after
tribocorrosion tests [121]. The presence of H2O2 was found to increase the weight loss and Ti
release from Ti6Al4V plates and screws [172]. However, none of these studies compared the
abrasion current or abrasion charge during abrasion process.
LPS was found to promote Ti dissolution at pH 4-7 after immersion test, possibly due to the
potential complex effect through its polysaccharide component [182, 183] (see Chapter 4). The
presence of H2O2 was also observed to promote Ti corrosion due to the Ti-H2O2 complex
reactions [184] (see Chapter 5). Therefore, the presence of LPS or H2O2 is expected to increase
abrasion current and accumulated abrasion charge. However, no measurable change on abrasion
charge was observed in the presence of LPS or H2O2, possibly suggesting that the complexation
effect is insignificant compared with the MACC process. In addition, the variations of the
abrasion current were very large, which may also result in the unmeasurable change in the
presence and absence of LPS or H2O2.
7.4 Conclusions
A new experimental device with a large contact-area crevice and a low frequency of movement
has been developed for the investigation of MACC of metallic implants. An experimental study
focused on MACC of the Ti6Al4V couple in physiological saline confirmed the evolution of
Page 206
191
chemistry and the presence of abrasion debris in the occluded crevice at a low rotation speed
by means of potentiostatic techniques. It also confirmed the importance of controlling
mechanical variables such as applied load and rotation speed as well as the presence of albumin,
LPS and H2O2 for the study of MACC behaviour.
1. This is the first time that a MACC apparatus has been specifically designed with a crevice
geometry with a large contact area and a continuous rotational motion with a very small rotation
rate (<100 µm/s at 0.1 rpm). Crevice corrosion with a clearly observed acidic environment was
found on a Ti6Al4V couple.
2. Both fine and large abrasion debris were observed on the Ti6Al4V couple surface and the
solutions in the crevice, which can be easily collected and may be used for in vitro and/or in
vivo toxicity tests.
3. With an increase in the rotation speed and load, abrasion OCP of the Ti6Al4V couple was
decreased while abrasion current at a potential of 0 mV vs. Ag/AgCl was increased.
4. The presence of albumin decreased the accumulated abrasion charge of the Ti6Al4V couple
while LPS did not show measurable change under a potential of 0 mV vs. Ag/AgCl in this
MACC apparatus. In addition, the presence of H2O2 did not induce measurable change on the
abrasion charge of the Ti6Al4V couple at 300 mV vs. Ag/AgCl.
Page 207
192
8 GENERAL DISCUSSION AND FUTURE WORK
8.1 General discussion
8.1.1 Introduction
The work presented in this thesis has focused on the role of important chemical species found
in the peri-implant environment (albumin, LPS and H2O2) and their effect on MACC, which is
an important mechanism of failure of Ti implants in the body. The presence of LPS in the peri-
implant environment is likely to be a result of bacterial colonisation, since LPS is a component
of Gram-negative bacterial cell walls and surface biofilms are found in many types of
biomedical implanted devices [133]. The effect of viable bacteria on Ti release (using
S. sanguinis as a model system) has also been studied. The presence of H2O2 is often a
consequence of inflammatory reactions caused by immune cells such as neutrophils. Thus Ti
release in the presence of neutrophils has also been investigated.
8.1.2 Effect of bacteria and bacterial products on Ti corrosion
The presence of bacteria is observed in many peri-implant environments [133, 134] and
associated peri-implant infection can ultimately lead to failure of Ti implants at early or late
stages following implantation [136]. An significant bacterial product LPS, which is an
important mediator of peri-implant inflammation, has also been demonstrated to be present on
Ti implant surfaces [131]. However, the effect of bacteria and bacterial products on Ti corrosion
has not been investigated extensively.
Ti dental implants are modular systems with the components that are integrated into the jaw
bones connecting to several other components that penetrate the oral mucosa to emerge into
Page 208
193
mouth and restore the form and functionality of a missing tooth. The parts of dental implants
that emerge from the gingiva (gum) are exposed to the oral environment and soft tissues which
form a pocket around them. The pocket which forms between the soft tissues of the gum and
the implant is of particular interest as there is a low flow of saliva, the composition is close to
tissue fluid and a bacterial biofilm is always present on adjacent Ti implant surface.
In this study it has been found that the presence of bacteria S. sanguinis, an early coloniser of
Ti surfaces in the oral cavity, increased Ti release. Furthermore, the presence of LPS which is
detected on Ti dental implant surfaces was found to promote Ti dissolution under slightly acidic
and neutral conditions (pH 4-7), which are the common environmental conditions in peri-
implant sites. These findings suggest that the presence of bacteria or bacterial products can
accelerate corrosion of Ti implants.
In addition, it was observed during MACC simulation that highly acidic conditions could be
generated (corrected pH ~2-4 depending on the abrasion time). Although bacterial viability in
such aggressive environments is itself unlikely, bacterial products such as LPS might be present
and diffuse into the crevice environment. LPS was however observed to decrease Ti release in
highly acidic environment (pH 2) during immersion tests and the significance is that under such
conditions LPS may actually protect Ti implants from very severe corrosion. However, there
was no measureable change in abrasion charge/abrasion current in the absence and presence of
LPS during MACC experiment, indicating that no inhibition effect of LPS was detectable. It
should, however, be noted that for the MACC tests the abrasion time was only 1 h (after which
the actual pH may not be as low as 2) whilst the immersion test lasted for 4 weeks (pH 2).
Page 209
194
8.1.3 Effect on inflammation cells and chemical species on Ti corrosion
When there is bacterial infection around the biomedical implants, an inflammatory response
occurs, involving activation of the innate and adaptive immune systems. In acute inflammation
innate immune cells, which include neutrophils and macrophages, are the first to migrate into
the infected or damage tissue. In inflammation associated with dental implants, neutrophils are
the most abundant immune cells found in the inflammatory lesions [71] and these cells have
the capacity to initiate a number of microbial killing mechanisms including the release of
chemical species [152, 153, 200], which may conceivably promote Ti corrosion. Despite a good
understanding of the potential corrosion-promoting chemical species that the host cells produce,
it is surprising that little attention has been paid on the role of neutrophils in Ti corrosion.
H2O2 has been regarded as an important inflammation product in the peri-implant environment
and is generated extracellular alongside species such as superoxide (O2-) and hypochlorous acid
(HOCl) during neutrophil oxidative burst [194]. The ICP-MS results following culturing of
neutrophils with the three grades of Ti suggest that neutrophils produce species that promote Ti
corrosion. Furthermore, there was little difference between the three grades of Ti studied. There
were, however, considerable differences between tests using neutrophils isolated from different
individuals and we know that such cells display variation which affects their physiology which
could explain the findings.
In this study, the presence of H2O2 when investigated in isolation has been observed to
significantly accelerate corrosion of Ti6Al4V when compared with CP-Ti. The observed lack
of difference between the three grades of Ti in the presence of neutrophils suggests the
mechanisms underpinning neutrophil-assisted Ti corrosion may be different from those
Page 210
195
mediated by H2O2, or may be due to the fact that the corrosion process was at very early stages
when induced in culture with the cells. It is important to note that whilst H2O2 is one of the key
species generated extracellularlly by neutrophils other ROS species could also be affecting Ti
corrosion. However the key alternative ROS species generated include O2- which has an
extremely short half-life extracellularly and HOCl which is a weak acid. Future studies should
include investigations to identify their respective effects on Ti corrosion.
Interestingly, it has been found that β phase of Ti6Al4V was preferentially attacked in the
presence of H2O2, which agrees with a recent report about preferential attack of β phase of a
retrieved modular taper [75]. This may suggest that corrosion of Ti in the presence of H2O2
in vivo is significant.
8.1.4 Effect of presence of albumin and H2O2 on Ti corrosion
The effect of albumin on the corrosion of biomedical implant alloys has been the subject of
considerable attention because albumin is the most abundant protein in the blood and in the
extracellular environment [23]. The effect of albumin on the corrosion rate of Ti and other
biomedical alloys is disputed within the literature [19, 20, 25, 122]. In the current study, the
addition of albumin has been found to significantly inhibit the cathodic reaction and also
slightly inhibit the anodic reaction in physiological saline while a small increase of Ti release
was observed in the presence of albumin at open circuit. It is proposed that the presence of
albumin decreases the cathodic reaction, which may drive dissolution of Ti6Al4V into the
active region, therefore promoting corrosion of Ti6Al4V.
A better approximation of the peri-implant environment under inflammatory conditions has
also been simulated by considering the effects of combinations of biomolecules on Ti corrosion.
Page 211
196
It has been found that there was a considerably higher rate of metal release from Ti6Al4V in
mixed solutions of albumin and H2O2 compared with albumin alone or H2O2 alone. Again it is
proposed that the presence of albumin decreases the cathodic reaction, taking the potential of
Ti6Al4V into the active region, where the higher rate of anodic dissolution in H2O2 leads to
significantly enhanced corrosion of Ti6Al4V.
8.1.5 MACC
MACC is now considered to be a particularly important corrosion mechanism for Ti implants
in human body. The MACC mechanism of biomedical Ti was firstly proposed by
Gilbert et al. [33] in 1993 to explain severe corrosion observed on modular Ti tapers.
Increasingly, investigators have reported the presence of significant quantities of corrosion
products in the tissues and fluids adjacent to implants that have been associated with no obvious
tribological processes, e.g. cemented Ti stems [7, 8], bone-anchored hearing aid (BAHA) [14]
and dental implants [15, 16] and these findings further support the presence of MACC of Ti
implants in the body.
However, the majority of in vitro research has focused on the tribocorrosion effects [36, 121].
Some investigators have studied “fretting corrosion” with small scale vibrational motion, but
such studies have employed a relatively small contact area [34, 35, 82]. However, none of them
has paid attention to the development of the effective crevice chemistry, which is the main
feature of MACC, with the exception of some work conducted on manufactured modular
tapers using real orthopaedic components [37, 38].
To obtain a better insight into MACC, a novel MACC apparatus has been designed and tested
on a Ti6Al4V couple in the current study. The chemistry of MACC was explored with the
Page 212
197
observation of pH change of the solutions. It has shown that highly acidic environment can be
formed in the crevice of a Ti6Al4V couple. In addition, it has been reported clinically that
patients implanted with cemented hip stems experienced severe pain although the stems were
well-fixed and without evidence of infection [7, 8, 79]. The pH of the retrieved stems was found
to be highly acidic, causing pain [7, 79]. The presence of peri-implant inflammation may
provide an explanation for the acidic peri-implant environment [8]. In addition, the current
study also clearly demonstrates the occurrence of low pH during MACC, which may be another
important explanation for the clinical observation.
Inconsistent and incomplete results have been reported about the effect of albumin [36, 122],
LPS [121] and H2O2 [172] on tribocorrosion or “fretting corrosion” of Ti alloys. More
importantly, none of their experimental setups contained effective crevice geometry or could
develop effective crevice chemistry. In this study, the effect of albumin, LPS and H2O2 have
been preliminarily studied in the MACC apparatus. It has been found that the presence of
albumin decreased the abrasion charge of the Ti6Al4V couple while there is no measurable
influence in the presence of both LPS and H2O2.
8.2 Future work
8.2.1 Effect of combination of albumin and H2O2 on Ti corrosion
A new hypothesis has been proposed to explain the considerably higher Ti release in the mixed
solution of albumin and H2O2 compared with albumin or H2O2 alone. To test this hypothesis,
more investigations are needed, e.g. further electrochemical tests including electrochemical
impedance spectroscopy (EIS) and potentiostatic measurements.
Page 213
198
8.2.2 Effect of cells on Ti corrosion
It has been found that the presence of neutrophils leads to increased Ti release, which is
detrimental for Ti biomedical implants and should draw people’s attention. Except for
investigation on the effect of H2O2 on Ti corrosion, other key alternative ROS species e.g. O2-
and HOCl on Ti corrosion have not been identified. Further work is needed.
8.2.3 Further studies on MACC
The new MACC apparatus has been designed and established in the current study. However, it
is essential to develop an updated apparatus in which the rotation motion can be reciprocating
with an amplitude of ~100 µm or less (i.e. controlling the frequency between clockwise and
anti-clockwise movements since the rotation rate is <100 µm/s at 0.1 rpm), which is more close
to the micro-movement of implants in vivo.
It has been observed that the variation of abrasion current was relatively large. This is not
surprising because the surface finish of the Ti6Al4V couple was limited to machining tolerances
during device manufacture which was not at a precision level. In addition, the Ti6Al4V couple
was re-used without surface treatment except for cleaning with deionised water. For the future
work, grinding or polishing procedures will be needed to obtain a controllable surface finish
and an even micro-gap between two components. It should however be noted that the machining
accuracy of biomedical components is also limited with micro-gaps between modular
components extensively reported in the literature [201].
It has been shown that the corrosion of Ti6Al4V in 2 M HCl was temperature dependent and
higher current was observed at higher temperature. It has also been observed that the crevice
chemistry of the Ti6Al4V couple became highly acidic and may be more aggressive during
Page 214
199
MACC. However, all MACC tests were conducted at room temperature in this study. More
severe MACC would be expected at body temperature (37 °C). Therefore, the effect of
temperature should be considered for the future experiment and the whole MACC apparatus
may be placed in a chamber, where temperature can be controlled.
A preliminary study on the effect of chemical species (albumin, LPS and H2O2) on MACC
compared the abrasion current and abrasion charge in the current study. However, this is not
sufficient. More detailed investigations will be needed, including analysis of the crevice
solution and characterisation of the abrasion debris. In terms of the analysis of crevice solution,
a corrected pH value was given in the current study due to the small volume of the solution in
the cavity in the stationary part of the couple. For future experiments, a pH electrode with a
micron-scale diameter can be helpful to obtain more accurate and reliable results. In addition,
to investigate the effect of abrasion debris on human cells will also contribute to the
understanding of the role of Ti corrosion products in vivo.
The MACC apparatus with the Ti6Al4V couple in the current study can easily be extended to
investigation on MACC of the Ti/cement couple and galvanic couple by making new couples
of other materials.
8.2.4 Summary: the need for improved simulation of the peri-implant
environment for future corrosion tests
Although the effects of H2O2, albumin and LPS have been studied in the literature, a better
approximation of the peri-implant environment should be simulated in vitro for the future
experiment to investigate the corrosion of Ti by combining the effects of such species.
Page 215
200
The current experimental condition of involving the use of both albumin and H2O2 is a good
case for the better approximation of peri-implant environment. No same or similar study has
been conducted previously. This can be extended to investigate corrosion of other Ti alloys and
other metallic implant materials, and this will also help explore different corrosion mechanisms
of biomedical implants.
Other combination effects of the three species should be considered for future experiment, e.g.
the combination of H2O2 and LPS and the combination of albumin, H2O2 and LPS, which are
better approximations of co-existence of peri-implant infection and inflammation.
In addition, MACC of Ti implants may also take place concurrently with biologically-mediated
effects. In the current work, the effect of albumin, LPS or H2O2 was investigated separately
without combination of any. Further MACC investigations in the presence of combination of a
series of factors (albumin and H2O2, LPS and H2O2 and all three species) will provide greater
insight into in vivo corrosion of Ti implants.
Page 216
201
9 CONCLUSIONS
The corrosion of three grades of Ti (CP-Ti-G2, CP-Ti-G4 and Ti6Al4V) has been investigated
under better simulated conditions of peri-implant environment.
1. The presence of S. sanguinis an early coloniser of Ti surfaces in the oral environment has
been found to promote Ti release from three grades of Ti. More corrosion was observed for
sandblasted-acid-etched surface than mirror-polished surface of three grades of Ti.
2. The presence of LPS, a component of Gram-negative bacterial cell walls, increases Ti
dissolution in slightly acidic and neutral conditions (pH 4-7) that are commonly encountered in
the peri-implant environment. Whilst LPS protects Ti from severe corrosion in a highly acidic
conditions (pH 2).
3. The presence of neutrophils, the most abundant acute immune cells in the peri-implant
environment, has been observed to enhance the corrosion of three grades of Ti. This effect is
likely to be varied with different individuals. In addition, corrosion of CP-Ti and Ti6Al4V did
not show significant difference in the presence of neutrophils.
4. The presence of H2O2, an important inflammation product in the peri-implant environment,
has been characterised on corrosion of Ti. The corrosion resistance of CP-Ti was found to be
higher than Ti6Al4V. Specifically, the β phase of Ti6Al4V was observed to be preferentially
attacked relative to the α phase.
5. The presence of albumin, an abundant protein in the blood and the extracellular
environment has been found to inhibit the cathodic and anodic reaction of Ti6Al4V in
physiological saline but promote corrosion of Ti6Al4V at open circuit.
Page 217
202
6. The presence of both albumin and H2O2, which is a better approximation of peri-implant
environment, has been identified to considerably promote corrosion of Ti6Al4V. A new
hypothesis has been proposed to interpret the significantly more corrosion of Ti6Al4V in the
combination of albumin and H2O2 compared with albumin or H2O2 alone.
7. A novel MACC apparatus has been designed and tested on a Ti6Al4V couple, which further
support and help better understand the mechanism of MACC of biomedical implants.
8. The presence of albumin, LPS and H2O2 on MACC of Ti6Al4V has been preliminarily
studied. The addition of albumin was found to decrease the abrasion charge at a potential of
0 V vs. Ag/AgCl during MACC. However, no measurable change was observed in the presence
of LPS at a potential of 0 V vs. Ag/AgCl or in the presence of H2O2 at a potential of
300 mV vs. Ag/AgCl.
Page 218
203
10 REFERENCES
1. Liu, X.Y., P.K. Chu, and C.X. Ding, Surface modification of titanium, titanium alloys,
and related materials for biomedical applications. Materials Science and Engineering,
R: Reports, 2004. 47(3-4): p. 49-121.
2. Long, M. and H.J. Rack, Titanium alloys in total joint replacement - a materials science
perspective. Biomaterials, 1998. 19(18): p. 1621-1639.
3. Brunette, M.D., P. Tengvall, M. Textor, and P. Thomsen, Titanium in medicine:
material science, surface science, engineering, biological reponses, and medical
applications. 2001, New York: Springer-Verlag Berlin Heidelberg.
4. He, X.H., J.J. Noel, and D.W. Shoesmith, Temperature dependence of crevice corrosion
initiation on titanium grade-2. Journal of the Electrochemical Society, 2002. 149(9): p.
B440-B449.
5. Yan, L., J.J. Noel, and D.W. Shoesmith, Hydrogen absorption into Grade-2 titanium
during crevice corrosion. Electrochimica Acta, 2011. 56(4): p. 1810-1822.
6. Virtanen, S. and C. Curty, Metastable and stable pitting corrosion of titanium in halide
solutions. Corrosion, 2004. 60(7): p. 643-649.
7. Hallam, P., F. Haddad, and J. Cobb, Pain in the well-fixed, aseptic titanium hip
replacement - The role of corrosion. Journal of Bone and Joint Surgery-British Volume,
2004. 86B(1): p. 27-30.
8. Thomas, S.R., D. Shukla, and P.D. Latham, Corrosion of cemented titanium femoral
stems. Journal of Bone and Joint Surgery-British Volume, 2004. 86B(7): p. 974-978.
9. Cadosch, D., E. Chan, O.P. Gautschi, and L. Filgueira, Metal is not inert: Role of metal
ions released by biocorrosion in aseptic loosening-Current concepts. Journal of
Biomedical Materials Research Part A, 2009. 91A(4): p. 1252-1262.
10. Sarmiento-Gonzalez, A., J.M. Marchante-Gayon, J.M. Tejerina-Lobo, J. Paz-Jimenez,
and A. Sanz-Medel, High-resolution ICP-MS determination of Ti, V, Cr, Co, Ni, and
Mo in human blood and urine of patients implanted with a hip or knee prosthesis.
Analytical and Bioanalytical Chemistry, 2008. 391(7): p. 2583-2589.
11. Sarmiento-Gonzalez, A., J.R. Encinar, J.M. Marchante-Gayon, and A. Sanz-Medel,
Titanium levels in the organs and blood of rats with a titanium implant, in the absence
of wear, as determined by double-focusing ICP-MS. Analytical and Bioanalytical
Chemistry, 2009. 393(1): p. 335-343.
Page 219
204
12. Rubio, J.C., M.C. Garcia-Alonso, C. Alonso, M.A. Alobera, C. Clemente, L. Munuera,
and M.L. Escudero, Determination of metallic traces in kidneys, livers, lungs and
spleens of rats with metallic implants after a long implantation time. Journal of Materials
Science. Materials in Medicine, 2008. 19(1): p. 369-75.
13. Nuevo-Ordonez, Y., M. Montes-Bayon, E. Blanco-Gonzalez, J. Paz-Aparicio, J. Dianez
Raimundez, J.M. Tejerina, M.A. Pena, and A. Sanz-Medel, Titanium release in serum
of patients with different bone fixation implants and its interaction with serum
biomolecules at physiological levels. Analytical and Bioanalytical Chemistry, 2011.
401(9): p. 2747-2754.
14. Addison, O., A.J. Davenport, R.J. Newport, S. Kalra, M. Monir, J.F.W. Mosselmans, D.
Proops, and R.A. Martin, Do 'passive' medical titanium surfaces deteriorate in service
in the absence of wear? Journal of the Royal Society Interface, 2012. 9(76): p. 3161-
3164.
15. Uo, M., K. Asakura, A. Yokoyama, M. Ishikawa, K. Tamura, Y. Totsuka, T. Akasaka,
and F. Watari, X-ray absorption fine structure (XAFS) analysis of titanium-implanted
soft tissue. Dental Materials Journal, 2007. 26(2): p. 268-273.
16. Kalra, S., PhD thesis: The distribution and pro-inflammatory impact of titanium debris
accumulation in the peri-implant environment. 2013, University of Birmingham.
Available from: http://etheses.bham.ac.uk/4759/5/Kalra14PhD.pdf. [Accessed 20
March 2015].
17. Pan, J., D. Thierry, and C. Leygraf, Hydrogen peroxide toward enhanced oxide growth
on titanium in PBS solution: Blue coloration and clinical relevance. Journal of
Biomedical Materials Research, 1996. 30(3): p. 393-402.
18. Barao, V.A., M.T. Mathew, W.G. Assuncao, J.C. Yuan, M.A. Wimmer, and C. Sukotjo,
The role of lipopolysaccharide on the electrochemical behavior of titanium. Journal of
Dental Research, 2011. 90(5): p. 613-618.
19. Omanovic, S. and S.G. Roscoe, Electrochemical studies of the adsorption behavior of
bovine serum albumin on stainless steel. Langmuir, 1999. 15(23): p. 8315-8321.
20. Cheng, X.L. and S.G. Roscoe, Corrosion behavior of titanium in the presence of calcium
phosphate and serum proteins. Biomaterials, 2005. 26(35): p. 7350-7356.
21. Wang, L.N., X.Q. Huang, A. Shinbine, and J.L. Luo, Influence of albumin on the
electrochemical behaviour of Zr in phosphate buffered saline solutions. Journal of
Materials Science-Materials in Medicine, 2013. 24(2): p. 295-305.
22. Wang, W., F. Mohammadi, and A. Alfantazi, Corrosion behaviour of niobium in
phosphate buffered saline solutions with different concentrations of bovine serum
albumin. Corrosion Science, 2012. 57: p. 11-21.
Page 220
205
23. Francis, G.L., Albumin and mammalian cell culture: implications for biotechnology
applications. Cytotechnology, 2010. 62(1): p. 1-16.
24. Jackson, D.R., S. Omanovic, and S.G. Roscoe, Electrochemical studies of the
adsorption behavior of serum proteins on titanium. Langmuir, 2000. 16(12): p. 5449-
5457.
25. Padilla, N. and A. Bronson, Electrochemical characterization of albumin protein on Ti-
6Al-4V alloy immersed in a simulated plasma solution. Journal of Biomedical Materials
Research Part A, 2007. 81A(3): p. 531-543.
26. Karimi, S. and A.M. Alfantazi, Electrochemical corrosion behavior of orthopedic
biomaterials in presence of human serum albumin. Journal of the Electrochemical
Society, 2013. 160(6): p. C206-C214.
27. Karimi, S. and A.M. Alfantazi, Ion release and surface oxide composition of AISI 316L,
Co-28Cr-6Mo, and Ti-6Al-4V alloys immersed in human serum albumin solutions.
Materials Science & Engineering C-Materials for Biological Applications, 2014. 40: p.
435-444.
28. Karimi, S., T. Nickchi, and A. Alfantazi, Effects of bovine serum albumin on the
corrosion behaviour of AISI 316L, Co-28Cr-6Mo, and Ti-6Al-4V alloys in phosphate
buffered saline solutions. Corrosion Science, 2011. 53(10): p. 3262-3272.
29. Souza, J.C.M., P. Ponthiaux, M. Henriques, R. Oliveira, W. Teughels, J.P. Celis, and
L.A. Rocha, Corrosion behaviour of titanium in the presence of Streptococcus mutans.
Journal of Dentistry, 2013. 41(6): p. 528-34.
30. Mu, Y., T. Kobayashi, M. Sumita, A. Yamamoto, and T. Hanawa, Metal ion release
from titanium with active oxygen species generated by rat macrophages in vitro. Journal
of Biomedical Materials Research, 2000. 49(2): p. 238-243.
31. Hiromoto, S., Corrosion of metallic biomaterials in cell culture environments. The
Electrochemical Society Interface, 2008: p. 41-44.
32. Hiromoto, S. and T. Hanawa, Corrosion of implant metals in the presence of cells.
Corrosion Reviews, 2006. 24(5-6): p. 323-351.
33. Gilbert, J.L., C.A. Buckley, and J.J. Jacobs, In vivo corrosion of modular hip-prosthesis
components in mixed and similar metal combinations - the effect of crevice, stress,
motion and alloy coupling. Journal of Biomedical Materials Research, 1993. 27(12): p.
1533-1544.
34. Swaminathan, V. and J.L. Gilbert, Fretting corrosion of CoCrMo and Ti6Al4V
interfaces. Biomaterials, 2012. 33(22): p. 5487-5503.
Page 221
206
35. Barril, S., N. Debaud, S. Mischler, and D. Landolt, A tribo-electrochemical apparatus
for in vitro investigation of fretting-corrosion of metallic implant materials. Wear, 2002.
252(9-10): p. 744-754.
36. Runa, M.J., M.T. Mathew, and L.A. Rocha, Tribocorrosion response of the Ti6Al4V
alloys commonly used in femoral stems. Tribology International, 2013. 68: p. 85-93.
37. Goldberg, J.R., C.A. Buckley, J.J. Jacobs, and J.L. Gilbert, Corrosion testing of modular
hip implants, in Modularity of Orthopedic Implants, D.E. Marlowe, J.E. Parr, and M.B.
Mayor, Editors., American Society for Testing and Materials Special Technical
Publication. STP 1301, Philadelphia, PA. March 1997. p. 157-176.
38. Goldberg, J.R. and J.L. Gilbert, In vitro corrosion testing of modular hip tapers. Journal
of Biomedical Materials Research Part B-Applied Biomaterials, 2003. 64B(2): p. 78-93.
39. Albrektsson, T., P.I. Branemark, H.A. Hansson, and J. Lindstrom, Osseointegrated
titanium implants - requirements for ensuring a long-lasting, direct bone-to-implant
anchorage in man. Acta Orthopaedica Scandinavica, 1981. 52(2): p. 155-170.
40. Elias, C.N., J.H.C. Lima, R. Valiev, and M.A. Meyers, Biomedical applications of
titanium and its alloys. Journal of the Minerals Metals and Materials Society, 2008.
60(3): p. 46-49.
41. Lutjering, G. and J.C. Williams, Titanium (2nd edition). 2007, New York: Springer-
Verlag Berlin Heidelberg.
42. He, X., J.J. Noel, and D.W. Shoesmith, Effects of iron content on microstructure and
crevice corrosion of Grade-2 titanium. Corrosion, 2004. 60(4): p. 378-386.
43. Atapour, M., A. Pilchak, G.S. Frankel, J.C. Williams, M.H. Fathi, and M. Shamanian,
Corrosion behavior of Ti6Al4V with different thermomechanical treatments and
microstructures. Corrosion, 2010. 66(6).
44. Hanawa, T., Metal ion release from metal implants. Materials Science and Engineering:
C, 2004. 24(6-8): p. 745-752.
45. Tun, Z., J.J. Noel, and D.W. Shoesmith, Electrochemical modification of the passive
oxide layer on a Ti film observed by in situ neutron reflectometry. Journal of the
Electrochemical Society, 1999. 146(3): p. 988-994.
46. Shibata, T. and Y.C. Zhu, Effect of film formation conditions on the structure and
composition of anodic oxide films on titanium. Corrosion Science, 1995. 37(2): p. 253-
270.
47. Zhu, R., C. Nowierski, Z. Ding, J.J. Noel, and D.W. Shoesmith, Insights into grain
structures and their reactivity on grade-2 Ti alloy surfaces by scanning electrochemical
microscopy. Chemistry of Materials, 2007. 19(10): p. 2533-2543.
Page 222
207
48. Kelly, R.G., J.R. Scully, D.W. Shoesmith, and R.G. Buchheit, Electrochemical
techniques in corrosion science and engineering. 2003, New York: Marcel Dekker Inc.
49. Revie, R.W., Uhlig's Corrosion Handbook (3rd Editon). 2011, New Jersey: John Wiley
& Sons Ltd.
50. Marcus, P. and J. Oudar, Corrosion mechanisms in theory and practice. 1995, New York:
Marcel Dekker, Inc.
51. Tomashov, N.D., R.M. Altovsky, and G.P. Chernova, Passivity and corrosion resistance
of titanium and its alloys. Journal of the Electrochemical Society, 1961. 108(2): p. 113-
119.
52. Stern, M. and H. Wissenberg, The influence of noble metal alloy additions on the
electrochemical and corrosion behavior of titanium. Journal of the Electrochemical
Society, 1959. 106(9): p. 759-764.
53. Yu, S.Y., C.W. Brodrick, M.P. Ryan, and J.R. Scully, Effects of Nb and Zr alloying
additions on the activation behavior of Ti in hydrochloric acid. Journal of the
Electrochemical Society, 1999. 146(12): p. 4429-4438.
54. Yu, S.Y., J.R. Scully, and C.M. Vitus, Influence of niobium and zirconium alloying
additions on the anodic dissolution behavior of activated titanium in HCl solutions.
Journal of the Electrochemical Society, 2001. 148(2): p. B68-B78.
55. Dyer, C.K. and J.S.L. Leach, Reversible reactions within anodic oxide films on titanium
electrodes. Electrochimica Acta, 1978. 23(12): p. 1387-1394.
56. Blackwood, D.J., L.M. Peter, and D.E. Williams, Stability and open circuit breakdown
of the passive oxide film on titanium. Electrochimica Acta, 1988. 33(8): p. 1143-1149.
57. Pourbaix, M., Atlas of electrochemical equilibria in aqueous solutions. 1974, Houston:
TX. NACE.
58. Casillas, N., S. Charlebois, W.H. Smyrl, and H.S. White, Pitting corrosion of titanium.
Journal of the Electrochemical Society, 1994. 141(3): p. 636-642.
59. Basame, S.B. and H.S. White, Pitting corrosion of titanium - the relationship between
fitting potential and competitive anion adsorption at the oxide film/electrolyte interface.
Journal of the Electrochemical Society, 2000. 147(4): p. 1376-1381.
60. Shoesmith, D.W., Assessing the corrosion performance of high-level nuclear waste
containers. Corrosion, 2006. 62(8): p. 703-722.
61. Virtanen, S., I. Milosev, E. Gomez-Barrena, R. Trebse, J. Salo, and Y.T. Konttinen,
Special modes of corrosion under physiological and simulated physiological conditions.
Acta Biomaterialia, 2008. 4(3): p. 468-476.
Page 223
208
62. Burstein, G.T., C. Liu, and R.M. Souto, The effect of temperature on the nucleation of
corrosion pits on titanium in Ringer's physiological solution. Biomaterials, 2005. 26(3):
p. 245-256.
63. Burstein, G.T. and C. Liu, Depassivation current transients measured between identical
twin microelectrodes in open circuit. Corrosion Science, 2008. 50(1): p. 2-7.
64. Davenport, A.J., Second Year Corrosion Lecture Notes. 2013, University of
Birmingham.
65. Cheng, F.T., K.H. Lo, and H.C. Man, An electrochemical study of the crevice corrosion
resistance of NiTi in Hanks' solution. Journal of Alloys and Compounds, 2007. 437(1-
2): p. 322-328.
66. Yaya, K., Y. Khelfaoui, B. Malki, and M. Kerkar, Numerical simulations study of the
localized corrosion resistance of AISI 316L stainless steel and pure titanium in a
simulated body fluid environment. Corrosion Science, 2011. 53(10): p. 3309-3314.
67. Jacobs, J.J., A.K. Skipor, L.M. Patteson, N.J. Hallab, W.G. Paprosky, J. Black, and J.O.
Galante, Metal release in patients who have has a primary total hip arthroplasty - A
prospective, controlled, longitudinal study. Journal of Bone and Joint Surgery-
American Volume, 1998. 80A(10): p. 1447-1458.
68. Kasai, Y., R. Iida, and A. Uchida, Metal concentrations in the serum and hair of patients
with titanium alloy spinal implants. Spine, 2003. 28(12): p. 1320-1326.
69. Boyer, P., J.-Y. Lazennec, J. Poupon, M.-A. Rousseau, P. Ravaud, and Y. Catonne,
Clinical and biological assessment of cemented titanium femoral stems: an 11-year
experience. International Orthopaedics, 2009. 33(5): p. 1209-1215.
70. Jacobs, J.J., J.L. Gilbert, and R.M. Urban, Current concepts review - corrosion of metal
orthopaedic implants. The journal of bone and joint surgery, 1998. 80(2): p. 268-282.
71. Olmedo, D.G., G. Nalli, S. Verdu, M.L. Paparella, and R.L. Cabrini, Exfoliative
cytology and titanium dental implants: a pilot study. Journal of Periodontology, 2013.
84(1): p. 78-83.
72. Olmedo, D.G., M.L. Paparella, D. Brandizzi, and R.L. Cabrini, Reactive lesions of peri-
implant mucosa associated with titanium dental implants: a report of 2 cases.
International Journal of Oral and Maxillofacial Surgery, 2010. 39(5): p. 503-507.
73. Olmedo, D.G., M.L. Paparella, M. Spielberg, D. Brandizzi, M.B. Guglielmotti, and R.L.
Cabrini, Oral mucosa tissue response to titanium cover screws. Journal of
Periodontology, 2012. 83(8): p. 973-980.
Page 224
209
74. Rodrigues, D.C., R.M. Urban, J.J. Jacobs, and J.L. Gilbert, In vivo severe corrosion and
hydrogen embrittlement of retrieved modular body titanium alloy hip implants. Journal
of Biomedical Materials Research Part B-Applied Biomaterials, 2009. 88B(1): p. 206-
219.
75. Gilbert, J.L., S. Mali, R.M. Urban, C.D. Silverton, and J.J. Jacobs, In vivo oxide-induced
stress corrosion cracking of Ti-6Al-4V in a neck-stem modular taper: Emergent
behavior in a new mechanism of in vivo corrosion. Journal of Biomedical Materials
Research Part B-Applied Biomaterials, 2012. 100B(2): p. 584-594.
76. Witt, F., B.H. Bosker, N.E. Bishop, H.B. Ettema, C.C.P.M. Verheyen, and M.M.
Morlock, The relation between titanium taper corrosion and cobalt-chromium bearing
wear in large-head metal-on-metal total hip prostheses: a retrieval study. The Journal of
bone and joint surgery. American volume, 2014. 96(18): p. e157-e157.
77. Urban, R.M., J.L. Gilbert, and J.J. Jacobs, Corrosion of modular titanium alloy stems in
cementless hip replacement, in Titanium, niobium, zirconium, and tantalum for medical
and surgical applications, L.D. Zardiackas, M.J. Kraay, and H.L. Freese., Editors.,
American Society for Testing and Materials International, STP 1471, Ann Arbor, MI,
Dec 2005. p. 215-224.
78. Grupp, T.M., T. Weik, W. Bloemer, and H.-P. Knaebel, Modular titanium alloy neck
adapter failures in hip replacement - failure mode analysis and influence of implant
material. BMC Musculoskeletal Disorders, 2010. 11:3.
79. Willert, H.G., L.G. Broback, G.H. Buchhorn, P.H. Jensen, G. Koster, I. Lang, P.
Ochsner, and R. Schenk, Crevice corrosion of cemented titanium alloy stems in total
hip replacements. Clinical Orthopaedics and Related Research, 1996(333): p. 51-75.
80. Jasty, M., W.J. Maloney, C.R. Bragdon, D.O. Oconnor, T. Haire, and W.H. Harris, The
initiation of failure in cemented femoral components of hip arthroplasties. Journal of
Bone and Joint Surgery-British Volume, 1991. 73(4): p. 551-558.
81. Geringer, J., J. Pellier, M.L. Taylor, and D.D. Macdonald, Electrochemical Impedance
Spectroscopy: Insights for fretting corrosion experiments. Tribology International, 2013.
68: p. 67-76.
82. Baxmann, M., S.Y. Jauch, C. Schilling, W. Bloemer, T.M. Grupp, and M.M. Morlock,
The influence of contact conditions and micromotions on the fretting behavior of
modular titanium alloy taper connections. Medical Engineering & Physics, 2013. 35(5):
p. 676-683.
83. Jauch, S.Y., G. Huber, K. Sellenschloh, H. Haschke, M. Baxmann, T.M. Grupp, and
M.M. Morlock, Micromotions at the taper interface between stem and neck adapter of
a bimodular hip prosthesis during activities of daily living. Journal of Orthopaedic
Research, 2013. 31(8): p. 1165-1171.
Page 225
210
84. COM/06/S1. 2006 Biological effects of metal wear debris generated from hip implants:
genotoxicity. Medicines and Healthcare products Regulatory Agency: London, UK.
Available from: http://cot.food.gov.uk/sites/default/files/cot/comsection06.pdf.
[Assessed 27 March 2015].
85. Katou, F., N. Andoh, K. Motegi, and H. Nagura, Immuno-inflammatory responses in
the tissue adjacent to titanium miniplates used in the treatment of mandibular fractures.
Journal of Cranio-Maxillofacial Surgery, 1996. 24(3): p. 155-162.
86. Flatebo, R.S., A.C. Johannessen, A.G. Gronningsaeter, O.E. Boe, N.R. Gjerdet, B.
Grung, and K.N. Leknes, Host response to titanium dental implant placement evaluated
in a human oral model. Journal of Periodontology, 2006. 77(7): p. 1201-1210.
87. Olmedo, D., M.M. Fernandez, M.B. Guglielmotti, and R.L. Cabrini, Macrophages
related to dental implant failure. Implant Dentistry, 2003. 12(1): p. 75-80.
88. Noguchi, T., S. Takemoto, M. Hattori, M. Yoshinari, E. Kawada, and Y. Oda,
Discoloration and dissolution of titanium and titanium alloys with immersion in
peroxide- or fluoride-containing solutions. Dental Materials Journal, 2008. 27(1): p.
117-123.
89. Okazaki, Y. and E. Gotoh, Comparison of metal release from various metallic
biomaterials in vitro. Biomaterials, 2005. 26(1): p. 11-21.
90. Atapour, M., M.H. Fathi, and M. Shamanian, Corrosion behavior of Ti6Al4V alloy
weldment in hydrochloric acid. Materials and Corrosion-Werkstoffe Und Korrosion,
2012. 63(2): p. 134-139.
91. Koike, M. and H. Fujii, The corrosion resistance of pure titanium in organic acids.
Biomaterials, 2001. 22(21): p. 2931-2936.
92. Koike, M. and H. Fujii, In vitro assessment of corrosive properties of titanium as a
biomaterial. Journal of Oral Rehabilitation, 2001. 28(6): p. 540-548.
93. Mabilleau, G., S. Bourdon, M.L. Joly-Guillou, R. Filmon, M.F. Basle, and D. Chappard,
Influence of fluoride, hydrogen peroxide and lactic acid on the corrosion resistance of
commercially pure titanium. Acta Biomaterialia, 2006. 2(1): p. 121-129.
94. Strietzel, R., A. Hosch, H. Kalbfleisch, and D. Buch, In vitro corrosion of titanium.
Biomaterials, 1998. 19(16): p. 1495-1499.
95. Contu, F., The cathodic behavior of titanium: Serum effect. J Biomed Mater Res Part B,
2012. 100B(2): p. 544-552.
96. Contu, F., B. Elsener, and H. Bohni, Serum effect on the electrochemical behaviour of
titanium, Ti6A14V and Ti6Al7Nb alloys in sulphuric acid and sodium hydroxide.
Corrosion Science, 2004. 46(9): p. 2241-2254.
Page 226
211
97. Williams, R.L., S.A. Brown, and K. Merritt, Electrochemical studies on the influence
of proteins on the corrosion of implant alloys. Biomaterials, 1988. 9(2): p. 181-186.
98. Zhang, S.M., J. Qiu, F. Tian, X.K. Guo, F.Q. Zhang, and Q.F. Huang, Corrosion
behavior of pure titanium in the presence of Actinomyces naeslundii. Journal of
Materials Science-Materials in Medicine, 2013. 24(5): p. 1229-1237.
99. Javier Gil, F., A. Rodriguez, E. Espinar, J. Maria Llamas, E. Padulles, and A. Juarez,
Effect of oral bacteria on the mechanical behavior of titanium dental implants.
International Journal of Oral and Maxillofacial Implants, 2012. 27(1): p. 64-68.
100. Lin, H.Y. and J.D. Bumgardner, In vitro biocorrosion of Ti-6Al-4V implant alloy by a
mouse macrophage cell line. Journal of Biomedical Materials Research Part A, 2004.
68A(4): p. 717-724.
101. Rodrigues, D.C., P. Valderrama, T.G. Wilson, Jr., K. Palmer, A. Thomas, S. Sridhar, A.
Adapalli, M. Burbano, and C. Wadhwani, Titanium corrosion mechanisms in the oral
environment: a retrieval study. Materials, 2013. 6(11): p. 5258-5274.
102. Barao, V.A.R., M.T. Mathew, W.G. Assuncao, J.C.-C. Yuan, M.A. Wimmer, and C.
Sukotjo, Stability of cp-Ti and Ti-6Al-4V alloy for dental implants as a function of
saliva pH - an electrochemical study. Clinical Oral Implants Research, 2012. 23(9): p.
1055-1062.
103. Souza, M.E.P., L. Lima, C.R.P. Lima, C.A.C. Zavaglia, and C.M.A. Freire, Effects of
pH on the electrochemical behaviour of titanium alloys for implant applications. Journal
of Materials Science-Materials in Medicine, 2009. 20(2): p. 549-552.
104. Kelly, E.J., Anodic dissolution and passivation of titanium in acidic media. 3. chloride
solutions. Journal of the Electrochemical Society, 1979. 126(12): p. 2064-2075.
105. Atapour, M., A.L. Pilchak, G.S. Frankel, and J.C. Williams, Corrosion behavior of beta
titanium alloys for biomedical applications. Materials Science & Engineering C, 2011.
31(5): p. 885-891.
106. Tengvall, P., I. Lundstrom, L. Sjoqvist, H. Elwing, and L.M. Bjursten, Titanium-
hydrogen peroxide interaction - model studies of the influence of the inflammatory
response on titanium implants. Biomaterials, 1989. 10(3): p. 166-175.
107. Hattori, M. and Y. Oda, EQCM analysis of titanium corrosion in peroxide- or fluoride-
containing solutions. The Bulletin of Tokyo Dental College, 2013. 54(3): p. 135-40.
108. Tengvall, P., L. Bertilsson, B. Liedberg, H. Elwing, and I. Lundstrom, Degradation of
dried ti-peroxy gels made from metallic titanium and hydrogen-peroxide. Journal of
Colloid and Interface Science, 1990. 139(2): p. 575-580.
Page 227
212
109. Mohanchandra, K.P., Y. Chun, S.V. Prikhodko, and G.P. Carman, TEM
characterization of super-hydrophilic Ni-Ti thin film. Materials Letters, 2011. 65(8): p.
1184-1187.
110. Assis, S.L.d. and I. Costa, The effect of hydrogen peroxide on the electrochemical
behaviour of Ti-13Nb-13Zr alloy in Hanks' solution. Materials Research, 2006. 9(4).
111. Fadl-Allah, S.A., R.M. El-Sherief, and W.A. Badawy, Electrochemical formation and
characterization of porous titania TiO2 films on Ti. Journal of Applied Electrochemistry,
2008. 38(10): p. 1459-1466.
112. Fonseca, C. and M.A. Barbosa, Corrosion behaviour of titanium in biofluids containing
H2O2 studied by electrochemical impedance spectroscopy. Corrosion Science, 2001.
43(3): p. 547-559.
113. Gilbert, J.L., Method of preparing biomedical surface. Patent #8,012,338, September 6,
2011.
114. Chandrasekaran, N., Z. Bai, and J.L. Gilbert, Titanium electrochemistry in the presence
of the inflammatory species H2O2. Translation society for biomaterials annual meeting,
2006.
115. Hedberg, Y. and I.O. Wallinder, Metal release and speciation of released chromium
from a biomedical CoCrMo alloy into simulated physiologically relevant solutions.
Journal of Biomedical Materials Research Part B-Applied Biomaterials, 2014. 102(4):
p. 693-699.
116. Mareci, D., R. Chelariu, D.-M. Gordin, G. Ungureanu, and T. Gloriant, Comparative
corrosion study of Ti-Ta alloys for dental applications. Acta Biomaterialia, 2009. 5(9):
p. 3625-3639.
117. Khan, M.A., R.L. Williams, and D.F. Williams, The corrosion behaviour of Ti-6Al-4V,
Ti-6Al-7Nb and Ti-13Nb-13Zr in protein solutions. Biomaterials, 1999. 20(7): p. 631-
637.
118. Huang, H.H., Effect of fluoride and albumin concentration on the corrosion behavior of
Ti-6Al-4V alloy. Biomaterials, 2003. 24(2): p. 275-282.
119. Contu, F., B. Elsener, and H. Bohni, Characterization of implant materials in fetal
bovine serum and sodium sulfate by electrochemical impedance spectroscopy. I.
Mechanically polished samples. Journal of Biomedical Materials Research, 2002. 62(3):
p. 412-421.
120. Faverani, L.P., W.G. Assuncao, P.S.P. de Carvalho, J.C.-C. Yuan, C. Sukotjo, M.T.
Mathew, and V.A. Barao, Effects of dextrose and lipopolysaccharide on the corrosion
behavior of a Ti6Al4V alloy with a smooth surface or treated with double-acid-etching.
PLoS One, 2014. 9(3).
Page 228
213
121. Mathew, M.T., V.A. Barao, J.C.-C. Yuan, W.G. Assuncao, C. Sukotjo, and M.A.
Wimmer, What is the role of lipopolysaccharide on the tribocorrosive behavior of
titanium? Journal of the Mechanical Behavior of Biomedical Materials, 2012. 8: p. 71-
85.
122. Hiromoto, S. and S. Mischler, The influence of proteins on the fretting-corrosion
behaviour of a Ti6Al4V alloy. Wear, 2006. 261(9): p. 1002-1011.
123. Huang, H.H. and T.H. Lee, Electrochemical impedance spectroscopy study of Ti-6Al-
4V alloy in artificial saliva with fluoride and/or bovine albumin. Dental Materials, 2005.
21(8): p. 749-755.
124. Yan, Y., A. Neville, D. Dowson, and S. Williams, Tribocorrosion in implants - assessing
high carbon and low carbon Co-Cr-Mo alloys by in situ electrochemical measurements.
Tribology International, 2006. 39(12): p. 1509-1517.
125. Valero Vidal, C., A. Olmo Juan, and A. Lgual Munoz, Adsorption of bovine serum
albumin on CoCrMo surface: Effect of temperature and protein concentration. Colloids
and Surfaces B-Biointerfaces, 2010. 80(1): p. 1-11.
126. Ban, S., J. Hasegawa, and S. Maruno, Electrochemical corrosion behavior of
hydroxyapatite glass titanium composite. Biomaterials, 1991. 12(2): p. 205-209.
127. Munoz, A.I. and S. Mischler, Interactive effects of albumin and phosphate ions on the
corrosion of CoCrMo implant alloy. Journal of the Electrochemical Society, 2007.
154(10): p. C562-C570.
128. Mareci, D., G. Bolat, R. Chelariu, D. Sutiman, and C. Munteanu, The estimation of
corrosion behaviour of ZrTi binary alloys for dental applications using electrochemical
techniques. Materials Chemistry and Physics, 2013. 141(1): p. 362-369.
129. Walivaara, B., I. Lundstrom, and P. Tengvall, An in vitro study of hydrogen peroxide-
treated titanium surfaces in contact with blood plasma and a simulated body fluid.
Clinical Materials, 1993. 12(3): p. 141-148.
130. Nagassa, M.E., A.E. Daw, W.G. Rowe, A. Carley, D.W. Thomas, and R. Moseley,
Optimisation of the hydrogen peroxide pre-treatment of titanium: surface
characterisation and protein adsorption. Clinical Oral Implants Research, 2008. 19(12):
p. 1317-1326.
131. Ragab, A.A., R. Van de Motter, S.A. Lavish, V.M. Goldberg, J.T. Ninomiya, C.R.
Carlin, and E.M. Greenfield, Measurement and removal of adherent endotoxin from
titanium particles and implant surfaces. Journal of Orthopaedic Research, 1999. 17(6):
p. 803-809.
Page 229
214
132. Pan, J., D. Thierry, and C. Leygraf, Electrochemical impedance spectroscopy study of
the passive oxide film on titanium for implant application. Electrochimica Acta, 1996.
41(7-8): p. 1143-1153.
133. The marshall protocol knowledge base: biofilm bacteria. Autoimmunity Research
Foundation 2014. [Online]. [Accessed 27 March 2015]. Available from:
http://mpkb.org/home/pathogenesis/microbiota/biofilm.
134. Monksfield, P., I.L.C. Chapple, J.B. Matthews, M.M. Grant, O. Addison, A.P. Reid,
D.W. Proops, and R.L. Sammons, Biofilm formation on bone-anchored hearing aids.
Journal of Laryngology and Otology, 2011. 125(11): p. 1125-1130.
135. Hauser-Gerspach, I., E.M. Kulik, R. Weiger, E.-M. Decker, C. Von Ohle, and J. Meyer,
Adhesion of Streptococcus sanguinis to dental implant and restorative materials in vitro.
Dental Materials Journal, 2007. 26(3): p. 361-366.
136. Paquette, D.W., N. Brodala, and R.C. Williams, Risk factors for endosseous dental
implant failure. Dental Clinics of North America, 2006. 50(3): p. 361-vi.
137. Rodriguez-Hernandez, A.G., A. Juarez, E. Engel, and F.J. Gil, Streptococcus sanguinis
adhesion on titanium rough surfaces: effect of shot-blasting particles. Journal of
Materials Science-Materials in Medicine, 2011. 22(8): p. 1913-1922.
138. Rodriguez-Hernandez, A.G., J.A. Munoz-Tabares, M. Godoy-Gallardo, A. Juarez, and
F.-J. Gil, S. sanguinis adhesion on rough titanium surfaces: effect of culture media.
Materials Science & Engineering C-Materials for Biological Applications, 2013. 33(2):
p. 714-720.
139. Le Guehennec, L., A. Soueidan, P. Layrolle, and Y. Amouriq, Surface treatments of
titanium dental implants for rapid osseointegration. Dental Materials, 2007. 23(7): p.
844-854.
140. da Rocha, S.S., A.C. Abreu Bernardi, A.C. Pizzolitto, G.L. Adabo, and E.L. Pizzolitto,
Streptococcus mutans attachment on a cast titanium surface. Materials Research-Ibero-
American Journal of Materials, 2009. 12(1): p. 41-44.
141. Fukushima, A., G. Mayanagi, K. Nakajo, K. Sasaki, and N. Takahashi,
Microbiologically induced corrosive properties of the titanium surface. Journal of
Dental Research, 2014. 93(5): p. 525-529.
142. Nobbs, A.H., R.J. Lamont, and H.F. Jenkinson, Streptococcus adherence and
colonization. Microbiology and Molecular Biology Reviews, 2009. 73(3): p. 407-450.
143. Desoet, J.J., F.A. Toors, and J. Degraaff, Acidogenesis by oral streptococci at different
pH values. Caries Research, 1989. 23(1): p. 14-17.
Page 230
215
144. Zheng, L., Z. Chen, A. Itzek, M. Ashby, and J. Kreth, Catabolite control protein a
controls hydrogen peroxide production and cell death in Streptococcus sanguinis.
Journal of Bacteriology, 2011. 193(2): p. 516-526.
145. Ryan, C.S. and I. Kleinberg, Bacteria in human mouths involved in the production and
utilization of hydrogen-peroxide. Archives of Oral Biology, 1995. 40(8): p. 753-763.
146. Hiromoto, S., K. Noda, and T. Hanawa, Electrochemical properties of an interface
between titanium and fibroblasts L929. Electrochimica Acta, 2002. 48(4): p. 387-396.
147. Hiromoto, S. and T. Hanawa, pH near cells on stainless steel and titanium.
Electrochemical and Solid State Letters, 2004. 7(3): p. B9-B11.
148. Cadosch, D., M.S. Al-Mushaiqri, O.P. Gautschi, J. Meagher, H.-P. Simmen, and L.
Filgueira, Biocorrosion and uptake of titanium by human osteoclasts. J Biomed Mater
Res Part A, 2010. 95A(4): p. 1004-1010.
149. Lin, H.Y. and J.D. Bumgardner, Changes in surface composition of the Ti-6Al-4V
implant alloy by cultured macrophage cells. Applied Surface Science, 2004. 225(1-4):
p. 21-28.
150. Hiromoto, S. and T. Hanawa, Electrochemical properties of 316L stainless steel with
culturing L929 fibroblasts. Journal of the Royal Society Interface, 2006. 3(9): p. 495-
505.
151. Lin, H.Y. and J.D. Bumgardner, Changes in the surface oxide composition of Co-Cr-
Mo implant alloy by macrophage cells and their released reactive chemical species.
Biomaterials, 2004. 25(7-8): p. 1233-1238.
152. Kumazawa, R., F. Watari, N. Takashi, Y. Tanimura, M. Uo, and Y. Totsuka, Effects of
Ti ions and particles on neutrophil function and morphology. Biomaterials, 2002. 23(17):
p. 3757-3764.
153. Brinkmann, V., U. Reichard, C. Goosmann, B. Fauler, Y. Uhlemann, D.S. Weiss, Y.
Weinrauch, and A. Zychlinsky, Neutrophil extracellular traps kill bacteria. Science,
2004. 303(5663): p. 1532-1535.
154. Wright, H.L., R.J. Moots, R.C. Bucknall, and S.W. Edwards, Neutrophil function in
inflammation and inflammatory diseases. Rheumatology, 2010. 49(9): p. 1618-1631.
155. Test, S.T. and S.J. Weiss, Quantitative and temporal characterization of the extracellular
H2O2 pool generated by human neutrophils. Journal of Biological Chemistry, 1984.
259(1): p. 399-405.
156. Battino, M., P. Bullon, M. Wilson, and H. Newman, Oxidative injury and inflammatory
periodontal diseases: the challenge of antioxidants to free radicals and reactive oxygen
species. Critical Reviews in Oral Biology & Medicine, 1999. 10(4): p. 458-476.
Page 231
216
157. Goncalves, D.M., S. Chiasson, and D. Girard, Activation of human neutrophils by
titanium dioxide (TiO2) nanoparticles. Toxicology In Vitro, 2010. 24(3): p. 1002-1008.
158. Goncalves, D.M. and D. Girard, Titanium dioxide (TiO2) nanoparticles induce
neutrophil influx and local production of several pro-inflammatory mediators in vivo.
International Immunopharmacology, 2011. 11(8): p. 1109-1115.
159. Mattei, L., F. Di Puccio, B. Piccigallo, and E. Ciulli, Lubrication and wear modelling
of artificial hip joints: A review. Tribology International, 2011. 44(5): p. 532-549.
160. Lomholt, T.C., K. Pantleon, and M.A.J. Somers, In-vivo degradation mechanism of Ti-
6Al-4V hip joints. Materials Science & Engineering C-Materials for Biological
Applications, 2011. 31(2): p. 120-127.
161. Mathew, M.T., S. Abbey, N.J. Hallab, D.J. Hall, C. Sukotjo, and M.A. Wimmer,
Influence of pH on the tribocorrosion behavior of CpTi in the oral environment:
synergistic interactions of wear and corrosion. Journal of Biomedical Materials
Research Part B-Applied Biomaterials, 2012. 100B(6): p. 1662-1671.
162. Licausi, M.P., A. Igual Munoz, and V. Amigo Borras, Tribocorrosion mechanisms of
Ti6Al4V biomedical alloys in artificial saliva with different pHs. Journal of Physics D-
Applied Physics, 2013. 46(40).
163. Cvijovic-Alagic, I., Z. Cvijovic, S. Mitrovic, V. Panic, and M. Rakin, Wear and
corrosion behaviour of Ti-13Nb-13Zr and Ti-6Al-4V alloys in simulated physiological
solution. Corrosion Science, 2011. 53(2): p. 796-808.
164. Advanced mechanical engineering solutions: hertzian contact stress calculator. [Online].
Available from: http://www.amesweb.info/HertzianContact/HertzianContact.aspx.
[Accessed 27 March 2015].
165. Komotori, J., N. Hisamori, and Y. Ohmori, The corrosion/wear mechanisms of Ti-6Al-
4V alloy for different scratching rates. Wear, 2007. 263: p. 412-418.
166. Dimah, M.K., F. Devesa Albeza, V. Amigo Borras, and A. Igual Munoz, Study of the
biotribocorrosion behaviour of titanium biomedical alloys in simulated body fluids by
electrochemical techniques. Wear, 2012. 294: p. 409-418.
167. Contu, F., B. Elsener, and H. Bohni, A study of the potentials achieved during
mechanical abrasion and the repassivation rate of titanium and Ti6Al4V in inorganic
buffer solutions and bovine serum. Electrochimica Acta, 2004. 50(1): p. 33-41.
168. Barril, S., S. Mischler, and D. Landolt, Influence of fretting regimes on the
tribocorrosion behaviour of Ti6Al4V in 0.9wt.% sodium chloride solution. Wear, 2004.
256(9-10): p. 963-972.
Page 232
217
169. Barril, S., S. Mischler, and D. Landolt, Electrochemical effects on the fretting corrosion
behaviour of Ti6Al4V in 0.9% sodium chloride solution. Wear, 2005. 259(1-6): p. 282-
291.
170. Vieira, A.C., A.R. Ribeiro, L.A. Rocha, and J.P. Celis, Influence of pH and corrosion
inhibitors on the tribocorrosion of titanium in artificial saliva. Wear, 2006. 261(9): p.
994-1001.
171. Swaminathan, V. and J.L. Gilbert, Potential and frequency effects on fretting corrosion
of Ti6Al4V and CoCrMo surfaces. Journal of Biomedical Materials Research Part A,
2013. 101(9): p. 2602-2612.
172. Montague, A., K. Merritt, S. Brown, and J. Payer, Effects of Ca and H2O2 added to
RPMI on the fretting corrosion of Ti6Al4V. Journal of Biomedical Materials Research,
1996. 32(4): p. 519-526.
173. May, T.W. and R.H. Wiedmeyer, A table of polyatomic interferences in ICP-MS.
Atomic Spectroscopy, 1998. 19(5): p. 150-155.
174. Pratten, J., A.W. Smith, and M. Wilson, Response of single species biofilms and
microcosm dental plaques to pulsing with chlorhexidine. Journal of Antimicrobial
Chemotherapy, 1998. 42(4): p. 453-459.
175. Yu, S.Y. and J.R. Scully, Corrosion and passivity of Ti-13% Nb-13% Zr in comparison
to other biomedical implant alloys. Corrosion, 1997. 53(12): p. 965-976.
176. Atapour, M., A.L. Pilchak, M. Shamanian, and M.H. Fathi, Corrosion behavior of
Ti8Al1Mo1V alloy compared to Ti6A14V. Materials and Design, 2011. 32(3): p. 1692-
1696.
177. Tomashov, N.D., G.P. Chernova, Y.S. Ruscol, and G.A. Ayuyan, Passivation of alloys
on titanium bases. Electrochimica Acta, 1974. 19(4): p. 159-172.
178. Metikos-Hukovic, M., A. Kwokal, and J. Piljac, The influence of niobium and vanadium
on passivity of titanium-based implants in physiological solution. Biomaterials, 2003.
24(21): p. 3765-3775.
179. Yan, L., S. Ramamurthy, J.J. Noel, and D.W. Shoesmith, Hydrogen absorption into
alpha titanium in acidic solutions. Electrochimica Acta, 2006. 52(3): p. 1169-1181.
180. Schromm, A.B., K. Brandenburg, H. Loppnow, U. Zahringer, E.T. Rietschel, S.F.
Carroll, M.H.J. Koch, S. Kusumoto, and U. Seydel, The charge of endotoxin molecules
influences their conformation and IL-6-inducing capacity. Journal of Immunology,
1998. 161(10): p. 5464-5471.
Page 233
218
181. Garidel, P., M. Rappolt, A.B. Schromm, J. Howe, K. Lohner, J. Andra, M.H.J. Koch,
and K. Brandenburg, Divalent cations affect chain mobility and aggregate structure of
lipopolysaccharide from Salmonella minnesota reflected in a decrease of its biological
activity. Biochimica et Biophysica Acta: Protein Structure and Molecular Enzymology,
2005. 1715(2): p. 122-131.
182. Sourek, J., M. Tichy, and J. Levin, Effect of certain cations (Fe, Zn, Mg and Ca) on
bacterial endotoxins. Infection and Immunity, 1978. 21(2): p. 648-654.
183. Coughlin, R.T., S. Tonsager, and E.J. McGroarty, Quantitation of metal-cations bound
to membranes and extracted lipopolysaccharide of Escherichia-coli. Biochemistry, 1983.
22(8): p. 2002-2007.
184. Tengvall, P., H. Elwing, L. Sjoqvist, I. Lundstrom, and L.M. Bjursten, Interaction
between hydrogen-peroxide and titanium - a possible role in the biocompatibility of
titanium. Biomaterials, 1989. 10(2): p. 118-120.
185. Al-Mobarak, N.A., A.M. Al-Mayouf, and A.A. Al-Swayih, The effect of hydrogen
peroxide on the electrochemical behavior of Ti and some of its alloys for dental
applications. Materials Chemistry and Physics, 2006. 99(2-3): p. 333-340.
186. Zhang, B.B., B.L. Wang, Y.B. Wang, L. Li, Y.F. Zheng, and Y. Liu, Development of
Ti-Ag-Fe ternary titanium alloy for dental application. Journal of Biomedical Materials
Research Part B-Applied Biomaterials, 2012. 100B(1): p. 185-196.
187. Al-Mobarak, N.A., A.A. Al-Swayih, and F.A. Al-Rashoud, Corrosion Behavior of Ti-
6Al-7Nb Alloy in Biological Solution for Dentistry Applications. International Journal
of Electrochemical Science, 2011. 6(6): p. 2031-2042.
188. Pan, J., D. Thierry, and C. Leygraf, Electrochemical and xps studies of titanium for
biomaterial applications with respect to the effect of hydrogen-peroxide. Journal of
Biomedical Materials Research, 1994. 28(1): p. 113-122.
189. Tengvall, P., H. Elwing, and I. Lundstrom, Titanium gel made from metallic titanium
and hydrogen-peroxide. Journal of Colloid and Interface Science, 1989. 130(2): p. 405-
413.
190. Burgos-Asperilla, L., M.C. Garcia-Alonso, M.L. Escudero, and C. Alonso, Study of the
interaction of inorganic and organic compounds of cell culture medium with a Ti surface.
Acta Biomaterialia, 2010. 6(2): p. 652-661.
191. Takemoto, S., M. Hattori, M. Yoshinari, E. Kawada, and Y. Oda, Discoloration of
titanium alloy in acidic saline solutions with peroxide. Dental Materials Journal, 2013.
32(1): p. 19-24.
Page 234
219
192. Zheng, L.Y., A. Itzek, Z.Y. Chen, and J. Kreth, Oxygen dependent pyruvate oxidase
expression and production in Streptococcus sanguinis. International Journal of Oral
Science, 2011. 3(2): p. 82-89.
193. Babin, K., F. Antoine, D.M. Goncalves, and D. Girard, TiO2, CeO2 and ZnO
nanoparticles and modulation of the degranulation process in human neutrophils.
Toxicology Letters, 2013. 221(1): p. 57-63.
194. Robinson, J.M., Reactive oxygen species in phagocytic leukocytes. Histochemistry and
Cell Biology, 2008. 130(2): p. 281-297.
195. Hong, P.K.A. and Y.Y. MacAuley, Corrosion and leaching of copper tubing exposed to
chlorinated drinking water. Water Air and Soil Pollution, 1998. 108(3-4): p. 457-471.
196. Woszczynski, M., J. Bergese, and G.A. Gagnon, Comparison of Chlorine and
Chloramines on Lead Release from Copper Pipe Rigs. Journal of Environmental
Engineering, 2013. 139(8): p. 1099-1107.
197. Gautam, N., S.P. Chakraborty, P.K. Kundu, and S. Roy, Age associated changes in
antioxidant and antioxidative enzymes in human neutrophil of different aged people.
Asian Pacific Journal of Tropical Biomedicine, 2012: p. S423-S428.
198. Molloy, D.O., S. Munir, C.M. Jack, M.B. Cross, W.L. Walter, and W.K. Walter, Sr.,
Fretting and Corrosion in Modular-Neck Total Hip Arthroplasty Femoral Stems. Journal
of Bone and Joint Surgery-American Volume, 2014. 96A(6): p. 488-493.
199. Yan, Y., A. Neville, and D. Blowson, Biotribocorrosion of CoCrMo orthopaedic
implant materials - Assessing the formation and effectof the biofilm. Tribology
International, 2007. 40(10-12): p. 1492-1499.
200. Zhou, J., Y.-T. Tsai, H. Weng, E.N. Tang, A. Nair, D.P. Dave, and L. Tang, Real-time
detection of implant-associated neutrophil responses using a formyl peptide receptor-
targeting NIR nanoprobe. International Journal of Nanomedicine, 2012. 7: p. 2057-68.
201. Kop, A.M., C. Keogh, and E. Swarts, Proximal component modularity in THA-at what
cost? An implant retrieval study. Clinical Orthopaedics and Related Research, 2012.
470(7): p. 1885-1894.