Corrugation gratings for fast integrated complementary metal-oxidesemiconductor photodetectors: implementation and diffraction analyses Bradley D. Clymer and Dana Gillfillan We present simulation experiments to show the feasibility of using a corrugation grating structure at the silicon-silicon dioxide interface to reduce photon-absorption depth and therefore to improve response times for shallow p-n junction photodiodes for use in the optical interconnection of very-large-scale- integrated circuits. A fabrication method that uses standard complementary metal-oxide semiconductor fabrication steps is presented for generating the grating structure. Simulations show reduction in 1/e photon-penetration depth to one half the value that is expected with no grating. I. Introduction It has been noted in the literature that integration of a fast photodetector is a critical concern for chip-to- chip optical interconnection in silicon very-large-scale- integrated (VLSI)circuits." The speed and the sensi- tivity of a simple p-n junction photodiode are largely functions of the depth of the p-n junction, the bias voltage applied across the junction, and the absorp- tion depth for the light in the semiconductor. For fast photodetection, nearly all the photons must be ab- sorbed in a region in which an electric field will sweep the optically generated electrons and holes across the junction to form a photocurrent. The electric field is usually generated by applying a reverse bias to a junction diode to create a wide region of space charge that is due to ionized dopant impurities. This region is often referred to as a depletion layer because it is depleted of free carriers by the electric field that is established by charge distribution of the ionized impurities and by the voltage-potential difference of the two sides of the junction. Photons absorbed outside the depletion layer generate carriers that either recombine before crossing the junction (e.g., do not contribute to the photocurrent) or first diffuse to the depletion region then drift across the junction to At the time the research was performed the authors were with the Department of Electrical Engineering, The Ohio State Univer- sity, 2015 Neil Avenue, Columbus, Ohio 43210. D. Gillfillan is now with AT&T Columbus, 6200 E. Broad Street, Columbus, Ohio 43213. Received 6 June 1990. 0003-6935/91/304390-06$05.00/0. 0 1991 Optical Society of America. generate a diffusion-based photocurrent. Because the diffusion process is driven only by the random motion of the carriers caused by population variation, it is a significantly slower transport mechanism than drift, which uses electrostatic force to transport the charge carriers. The width of the depletion layer can be increased by applying a more-negative bias voltage to the junction but is limited by the magnitude of the voltage signals available on the chip. For a maximum voltage difference of 5 V, typical of complementary metal-oxide semiconductor (CMOS) VLSI systems, the depletion-layer thickness is limited to approxi- mately 3 pim. A significant fraction of the photocur- rent is the slower diffusion current when the average penetration depth for photons is larger than the depletion-region thickness in a vertical junction, as Fig. 1 shows. The impulse response for diffusion current is approximately exponential, with a time constant determined by the carrier lifetime in the semiconductor, typically approximately 50-100 ns for silicon CMOS circuits. The increase in photodetector capacitance that is due to a larger surface area is expected to be negligible compared with the increase in current response. The improvement in response between diffusion and drift current can be estimated by the relationship between transit time for drift (typically less than 0.1 ns) and the carrier lifetime (typically 50-100 ns). For exam- ple, if the beam spot has a 10-pum diameter, the increase in photodetector size from 10 x 10 to 10 x 100 [pm represents a ten-fold increase in capacitance, but the conversion from diffusion to drift represents nearly a 1000-fold increase in current source re- sponse. The actual increase in bandwidth of the 4390 APPLIED OPTICS / Vol. 30, No. 30 / 20 October 1991
Transcript
Corrugation gratings for fast integrated complementarymetal-oxide semiconductor photodetectors:implementation and diffraction analyses
Bradley D. Clymer and Dana Gillfillan
We present simulation experiments to show the feasibility of using a corrugation grating structure at thesilicon-silicon dioxide interface to reduce photon-absorption depth and therefore to improve responsetimes for shallow p-n junction photodiodes for use in the optical interconnection of very-large-scale-integrated circuits. A fabrication method that uses standard complementary metal-oxide semiconductorfabrication steps is presented for generating the grating structure. Simulations show reduction in 1/ephoton-penetration depth to one half the value that is expected with no grating.
I. Introduction
It has been noted in the literature that integration ofa fast photodetector is a critical concern for chip-to-chip optical interconnection in silicon very-large-scale-integrated (VLSI) circuits." The speed and the sensi-tivity of a simple p-n junction photodiode are largelyfunctions of the depth of the p-n junction, the biasvoltage applied across the junction, and the absorp-tion depth for the light in the semiconductor. For fastphotodetection, nearly all the photons must be ab-sorbed in a region in which an electric field will sweepthe optically generated electrons and holes across thejunction to form a photocurrent. The electric field isusually generated by applying a reverse bias to ajunction diode to create a wide region of space chargethat is due to ionized dopant impurities. This regionis often referred to as a depletion layer because it isdepleted of free carriers by the electric field that isestablished by charge distribution of the ionizedimpurities and by the voltage-potential difference ofthe two sides of the junction. Photons absorbedoutside the depletion layer generate carriers thateither recombine before crossing the junction (e.g., donot contribute to the photocurrent) or first diffuse tothe depletion region then drift across the junction to
At the time the research was performed the authors were withthe Department of Electrical Engineering, The Ohio State Univer-sity, 2015 Neil Avenue, Columbus, Ohio 43210. D. Gillfillan is nowwith AT&T Columbus, 6200 E. Broad Street, Columbus, Ohio43213.
Received 6 June 1990.0003-6935/91/304390-06$05.00/0.0 1991 Optical Society of America.
generate a diffusion-based photocurrent. Because thediffusion process is driven only by the random motionof the carriers caused by population variation, it is asignificantly slower transport mechanism than drift,which uses electrostatic force to transport the chargecarriers. The width of the depletion layer can beincreased by applying a more-negative bias voltage tothe junction but is limited by the magnitude of thevoltage signals available on the chip. For a maximumvoltage difference of 5 V, typical of complementarymetal-oxide semiconductor (CMOS) VLSI systems,the depletion-layer thickness is limited to approxi-mately 3 pim. A significant fraction of the photocur-rent is the slower diffusion current when the averagepenetration depth for photons is larger than thedepletion-region thickness in a vertical junction, asFig. 1 shows. The impulse response for diffusioncurrent is approximately exponential, with a timeconstant determined by the carrier lifetime in thesemiconductor, typically approximately 50-100 ns forsilicon CMOS circuits.
The increase in photodetector capacitance that isdue to a larger surface area is expected to be negligiblecompared with the increase in current response. Theimprovement in response between diffusion and driftcurrent can be estimated by the relationship betweentransit time for drift (typically less than 0.1 ns) andthe carrier lifetime (typically 50-100 ns). For exam-ple, if the beam spot has a 10-pum diameter, theincrease in photodetector size from 10 x 10 to 10 x100 [pm represents a ten-fold increase in capacitance,but the conversion from diffusion to drift representsnearly a 1000-fold increase in current source re-sponse. The actual increase in bandwidth of the
Fig. 1. Photodetection with shallow p-n junction in silicon VLSI.
photodetector is a complicated function of the distri-bution of photon absorption and the density gradientof carriers generated, as well as the RC loadingassociated with the receiver circuit used. If suitableparameters, such as carrier mobilities and lifetimes,were known, a time-varying continuity simulationcould be performed to simulate the response time ofthe photocurrent with appropriate loading. Unfortu-nately, the values of parameters such as carriermobilities and lifetimes are dramatically influencedby surface effects such as unmatched charges andlattice strain. Because the corrugated structure of thegrating is expected to produce a complicated siliconsurface, the characterization of the bandwidth of thephotodiode is empirically measured at a later time.The feasibility of an improvement in response can bedemonstrated by using diffraction analysis to showthat the depth of photon penetration is reduced, as ispresented here.
We previously presented an integrated photodetec-tor with a corrugation grating to diffract light.5 In thissystem, the grating structure diffracts the light alongpaths determined by the period of the grating struc-ture, permitting a higher percentage of photon absorp-tion at shallow depths, as Figs. 2 and 3 show.
light at normall
incidence
;ligh trft:r
.... :..:.., ,~~..,. .......
direction,. :.. .......
.. .. .. .. .
-I
i;
00.
_0-oW
0tD
-D
=r
photon absor tion densit
Fig. 2. Model for photon-absorption density with light at normalincidence and no grating.
Fig. 3. Model for photon-absorption density with light at normalincidence with a surface grating.
Shallower penetration of photons indicates moreabsorption closer to the silicon surface, and, there-fore, less diffusion photocurrent and faster overallresponse.
In Ref. 5, we presented a computer-simulationstudy of diffraction efficiency by varying the gratingperiod, the angle of incidence, and the filling factor fora square corrugation profile. Here, we present inSection II a procedure for fabrication of the corruga-tion structure that is compatible with existing CMOStechnology. A brief review of the model and theanalysis used for simulation studies with the expectedcorrugation profile for this process is presented inSection III, followed by simulation results in SectionIV. Concluding remarks are given in Section V.
II. Implementation of the Corrugation Pattern
The silicon-silicon dioxide corrugation grating can beimplemented by a novel use of existing patterningmasks and processes that are standard to most CMOSfabrication systems. Typically, an active-layer mask isgenerated that is the union of the masks used tofabricate the p-channel transistor and the n-channeltransistor source and the drain and gate areas. InCMOS fabrication, the active-layer mask is used toprotect these transistor areas during the growth ofthe thick-field oxide used for isolation of interconnec-tion layers on the chip.7
The process used for field oxide growth can be usedin the formation of the corrugation grating, becausewhen silicon dioxide is grown from the silicon crystal(rather than deposited), silicon from the substrate isdepleted. This process is shown in Fig. 4. As theoxygen supplied from the top combines with thesilicon from the crystal, silicon dioxide growth occursin both the upward and the downward directions,adjusting the position of the silicon surface in theprocess. 7
Patterning the oxide growth is usually done by firstgrowing a thin protective silicon dioxide layer uni-formly upon the silicon surface, then depositing andpatterning a silicon nitride layer to inhibit furtheroxide growth in areas specified by the active-layer
mask. Growth of the oxide actually proceeds in threedirections, as Fig. 5 shows.7 The oxide grows upwardand downward as discussed above with the unpat-terned system in Fig. 4 but also grows laterallyunderneath the silicon nitride mask, forming theprofile commonly called a bird's beak by forcing thesilicon nitride layer away from the silicon. The bird'sbeak effect during the field oxide growth is a keyconstraint on the limiting dimensions of transistorsin VLSI systems. For the generation of the corruga-tion grating, however, the effect can be used as asmoothing operation to make the grating profile moresinusoidal than abrupt, as Fig. 6 shows. In thegeneration of this structure, the sizes of the slitsbetween the nitride mask areas will help to controlthe rate of oxide growth, both laterally under thenitride and vertically above and into the siliconsubstrate by limiting the supply of oxygen for growth.
There are several computer-aided design packagesavailable for generation of fabrication mask sets, suchas MAGIC.8 MAGIC checks layout design rules thatspecify spacing and size constraints for a given fabri-cation system. Designers use a work-station environ-ment to create transistors and interconnections bydrawing rectangles representing sources, drains, gates,and polysilicon and metal wires. Usually the softwarepackage generates the specific fabrication masks basedon the layers drawn by the designer, e.g., the active-layer mask by the union of source, drain, and gatelayers. The corrugation grating for the photodetectorcan be represented as a periodic set of drain or sourceareas separated by small gaps. This format permitsthe automatic generation of the periodic nitride active-layer mask used during oxide growth in addition toproviding a mask set used to diffuse dopants into the
Fig. 6. Corrugation grating formed by patterned oxide growth.
substrate to form the junction of the photodiodeshown in Fig. 6. Lateral diffusion of the dopant atomsunder the closely spaced ridges of the grating causessmearing of the boundaries between separate ele-ments in the periodic structure, forming an approxi-mately uniformly doped region for the photodetectorjunction.
The optimum period of the grating structure hasbeen determined to be approximately 0.6-0.7 m forincident light at 0.8 ,um.5 Because this is less than theminimum feature size permitted for drain or sourceregions, software modifications in the computer-aided design layout system will be necessary to accom-modate the use of these levels for nontransistordevices.
111. Model and Analysis of Sinusoidal Relief GratingThe geometry used for the simulation studies pre-sented in this paper is similar to that describedpreviously,5 except that a sinusoidal grating is substi-tuted here for the rectangular grating profile. Wedivide the entire structure into four regions along across-sectional cut through the photodetector, shownin Fig. 7. Region 0 represents the air space above thechip, bounded by the oxide layer below. We treat wavepropagation in this region only indirectly in thispaper, assuming that second-order reflected wavesfrom the oxide side of the interface are much lower inamplitude than the incident waves transmittedthrough the interface from the air space above.Planarization and deposition of a conformal oxidecoating for the chip should leave this surface rela-tively smooth. Region 1 represents the portion of theoxide above the thickest extent of the corrugationprofile. The material in this region is modeled as alossless homogeneous dielectric. Region 2 representsthe transitional portion of the structure, where thedielectric properties are spatially varying in bothdepth and transverse directions. We follow the ap-proach of Moharam and Gaylord9 in subdividing this
AIRREGION 0
.....................................
Oxide Nitride ask
SILICONSubstrate
Fig. 5. Silicon dioxide growth with nitride mask.7 Fig. 7. Cross-sectional geometry of grating and silicon substrate.
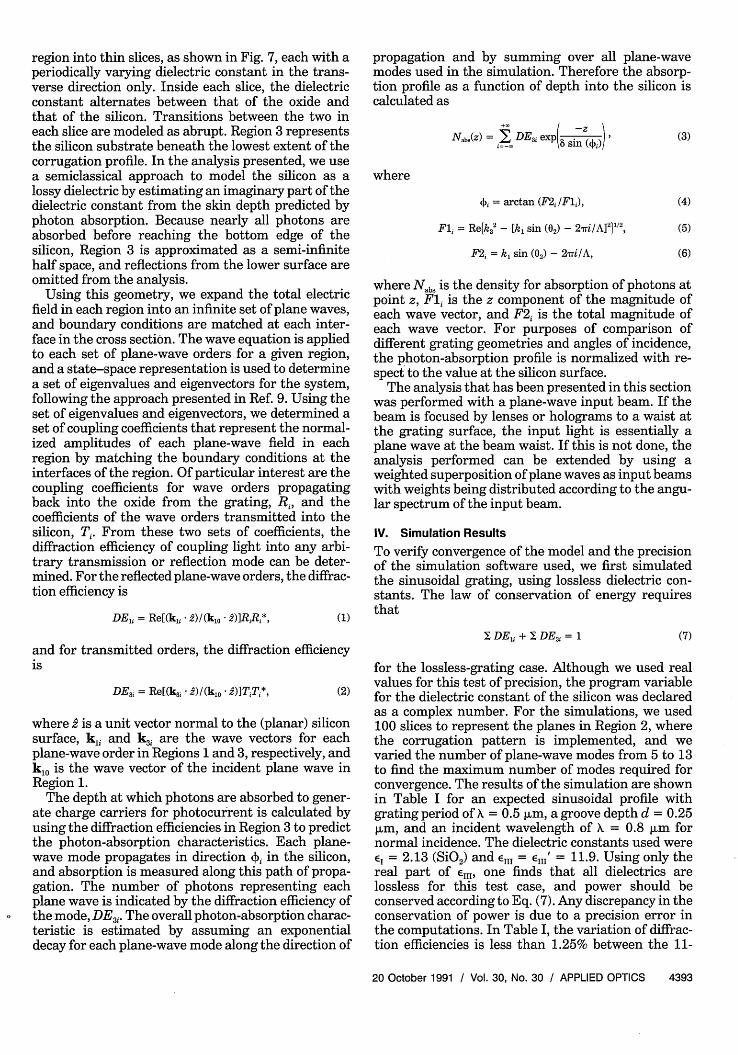
region into thin slices, as shown in Fig. 7, each with aperiodically varying dielectric constant in the trans-verse direction only. Inside each slice, the dielectricconstant alternates between that of the oxide andthat of the silicon. Transitions between the two ineach slice are modeled as abrupt. Region 3 representsthe silicon substrate beneath the lowest extent of thecorrugation profile. In the analysis presented, we usea semiclassical approach to model the silicon as alossy dielectric by estimating an imaginary part of thedielectric constant from the skin depth predicted byphoton absorption. Because nearly all photons areabsorbed before reaching the bottom edge of thesilicon, Region 3 is approximated as a semi-infinitehalf space, and reflections from the lower surface areomitted from the analysis.
Using this geometry, we expand the total electricfield in each region into an infinite set of plane waves,and boundary conditions are matched at each inter-face in the cross section. The wave equation is appliedto each set of plane-wave orders for a given region,and a state-space representation is used to determinea set of eigenvalues and eigenvectors for the system,following the approach presented in Ref. 9. Using theset of eigenvalues and eigenvectors, we determined aset of coupling coefficients that represent the normal-ized amplitudes of each plane-wave field in eachregion by matching the boundary conditions at theinterfaces of the region. Of particular interest are thecoupling coefficients for wave orders propagatingback into the oxide from the grating, R, and thecoefficients of the wave orders transmitted into thesilicon, T. From these two sets of coefficients, thediffraction efficiency of coupling light into any arbi-trary transmission or reflection mode can be deter-mined. For the reflected plane-wave orders, the diffrac-tion efficiency is
DE1i = Re[(k - )/(k - )1RjRj*, (1)
propagation and by summing over all plane-wavemodes used in the simulation. Therefore the absorp-tion profile as a function of depth into the silicon iscalculated as
Nabs() = DE2 exp .j' (3)
where
Pi = artan (F2j IF1,), (4)
Fli = Re(k32 - [k, sin (02) - 2nri/A]21
12,
F2j = kl sin (02) - 2'rri/A,
(5)
(6)
where Nabs is the density for absorption of photons atpoint z, Fli is the z component of the magnitude ofeach wave vector, and F2i is the total magnitude ofeach wave vector. For purposes of comparison ofdifferent grating geometries and angles of incidence,the photon-absorption profile is normalized with re-spect to the value at the silicon surface.
The analysis that has been presented in this sectionwas performed with a plane-wave input beam. If thebeam is focused by lenses or holograms to a waist atthe grating surface, the input light is essentially aplane wave at the beam waist. If this is not done, theanalysis performed can be extended by using aweighted superposition of plane waves as input beamswith weights being distributed according to the angu-lar spectrum of the input beam.
IV. Simulation Results
To verify convergence of the model and the precisionof the simulation software used, we first simulatedthe sinusoidal grating, using lossless dielectric con-stants. The law of conservation of energy requiresthat
and for transmitted orders, the diffraction efficiencyis
DE2, = Re[(k2 i - !)/(k, -i)]TT*, (2)
where 9 is a unit vector normal to the (planar) siliconsurface, k and k are the wave vectors for eachplane-wave order in Regions 1 and 3, respectively, andk1o is the wave vector of the incident plane wave inRegion 1.
The depth at which photons are absorbed to gener-ate charge carriers for photocurrent is calculated byusing the diffraction efficiencies in Region 3 to predictthe photon-absorption characteristics. Each plane-wave mode propagates in direction d5j in the silicon,and absorption is measured along this path of propa-gation. The number of photons representing eachplane wave is indicated by the diffraction efficiency of
I the mode, DE3 . The overall photon-absorption charac-teristic is estimated by assuming an exponentialdecay for each plane-wave mode along the direction of
X DEj + X DE2, = 1 (7)
for the lossless-grating case. Although we used realvalues for this test of precision, the program variablefor the dielectric constant of the silicon was declaredas a complex number. For the simulations, we used100 slices to represent the planes in Region 2, wherethe corrugation pattern is implemented, and wevaried the number of plane-wave modes from 5 to 13to find the maximum number of modes required forconvergence. The results of the simulation are shownin Table I for an expected sinusoidal profile withgrating period of X = 0.5 jim, a groove depth d = 0.25Vlm, and an incident wavelength of X = 0.8 pim fornormal incidence. The dielectric constants used wereE= 2.13 (Si02 ) and E... = E,,, = 11.9. Using only thereal part of E,,,, one finds that all dielectrics arelossless for this test case, and power should beconserved according to Eq. (7). Any discrepancy in theconservation of power is due to a precision error inthe computations. In Table I, the variation of diffrac-tion efficiencies is less than 1.25% between the 11-
Table 1. Diffraction Efficiencies for Reflected and Transmitted Wavesfor 5-, 7-, 9-, 11-, and 13-Mode Simulations for Convergence
Number of ModesDiffractionEfficiency 5 7 9 11 13
DEo 0.0382 0.0416 0.0472 0.0512 0.0494DE, I 0.0000 0.0000 0.0000 0.0000 0.0000DE,,-, 0.3032 0.3231 0.3647 0.3897 0.3820DE3 0 0.1770 0.1071 0.0663 0.0381 0.0505DE3 .1 0.3032 0.3231 0.3647 0.3897 0.3820DE32 0.0892 0.1026 0.0785 0.0657 0.0681YDE - 1 6 x 10-15 3 x 10-15 2 x 10 2 2 x 10⁻¹ 1 8 x 10⁻⁹
VC-)z
z
LHI
C-)
0.75
0.50 -
0.25gT(i-l)
.... S -T(i=-2) T(i=2)6=0) ...............................
R~~~~~~~~i = 2 = m~~~~~~~~~~~~~~~~~~~~.....
oT(= 5/3 lo 15 20 25 30
T3) ANGLE OF INCIDENCE, 01mode and the 13-mode simulation, with computationprecision determined by conservation of power of theorder of 10'.
After verifying the precision of the simulation* software for the sinusoidal gratings, we used the
complex dielectric constant for silicon and evaluatedthe diffraction efficiency for plane waves transmittedinto the silicon. The imaginary part of the dielectricconstant was estimated by using a semiclassical ap-proach that models power loss resulting from photonabsorption as the electromagnetic power decay wheneach plane wave propagates through a lossy medium.The classical skin-depth parameter is matched to theaverage absorption depth, , and the imaginary partof the dielectric is given as
jelly =, xIJ X (8)
where Eml," = 0.303 for X = 0.8 jim and the correspond-ing 8 = 10 jim.
Using the complex dielectric constant for siliconcalculated for incident light at X = 0.8 jim, wesimulated diffraction efficiencies for angles of inci-dence 0 < 40°, using 13 plane-wave modes and d =0.25 jim with periods of A = 0.5, 0.6, and 0.7 jim. Theresults are shown in Figs. 8, 9, and 10, respectively. Inthese figures, only the i = 0, 1, +2, and ±3 modesare shown because the relative power in higher-orderwaves was found to be negligible. In the figures, the
Fig. 9. Diffraction efficiencies of reflected and transmitted plane-wave modes for grating period A = 0.6 ALm.
curves labeled T represent the transmitted plane-wave orders, with i denoting the order, and the curveslabeled R represent the reflected plane-wave orders. Acomparison of the figures shows that diffractionefficiency for normal incidence is highest for the A =0.5-jm grating, but the diffraction efficiency wasmore uniform over a wide range of angles for A = 0.6and A = 0.7-jim gratings, with maximum flatnessshown in the 0.7-jim grating in Fig. 10.
After determining the transmission-diffraction effi-ciencies for each order, we obtained an equivalentphoton-absorption profile by summing the effectiveabsorption profiles from Fig. 3 for each angle of wavepropagation in the silicon. The calculated photon-absorption profiles for the three grating simulationsdescribed above are shown in Figs. 11, 12, and 13 asfunctions of penetration depth for incident angles of01 = 0, 10, 20, and 30°, respectively. In each figure, thesolid curve represents the calculated decaying expo-nential absorption profile that would result from asingle plane-wave propagating normally to the siliconsurface if no grating were present. A comparison ofthe A = 0.5, 0.6, and 0.7 lm cases shown in Figs. 11,12, and 13, respectively, shows a higher percentage ofphotons absorbed near the surface for the A = 0.7-jimgrating. As can be expected from the diffraction-
Fig. 11. Photon-absorption profile for selected angles of incidencefor the grating period A = 0.5 pum.
1.00
;a0o
F4
u0
10.00
DEPTH, z (pm)20.00
Fig. 12. Photon-absorption profile for selected angles of incidencefor the grating period A = 0.6 pm.
1.00
0 51~~~~~~~~~~~~~-
0.75
0.50< E L ma.
UO0.25 ~-
0.000.00 5.00 10.00 15.00 20.00
DEPTH, (m)
Fig. 13. Photon-absorption profile for selected angles of incidencefor the grating period A = 0.7 pm.
efficiency result, this case also has the lowest varia-tion in characteristic profile as the angle of incidenceis varied. Angles of incidence less than 10° havealmost identical profiles compared with normal inci-dence. This is demonstrated in Figs. 12 and 13, wherethe curves for 0 = 0 and those for 10° are nearlyindistinguishable.
When comparing the 1/e points of the profiles in
Fig. 13, one finds that the /e depth is reduced from10 jim in the undiffracted case to 6.8 jim for 0, = 30°,to 5.0 jim for 0, = 20°, and to 4.5 m for 1 < 10°. Ifangles of incidence are limited to 0 < 20°, the depthof photon penetration before absorption is reduced toone half the undiffracted value. The diffraction effi-ciencies, and, therefore, the reduction in absorptiondepth could possibly be improved by using deepergratings, but the fabrication process used to imple-ment the grating structure will probably inhibit thegrating depth from being larger than half a stripewidth in the patterning mask because of the two-dimensional nature of oxide growth.
V. Concluding Remarks
We have presented simulations for a corrugationgrating pattern implemented at the interface betweensilicon and silicon dioxide for the reduction in photo-detector response times in shallow p-n junctionsavailable with standard CMOS VLSI fabrication pro-cesses. Although the actual improvement in band-width is not easily calculated, because key parameterssuch as carrier mobilities and lifetimes near thegrating are not available, an improvement in re-sponse is expected because the average photon pene-tration depth is reduced. Based on the simulationsperformed, a sinusoidal profile permits a reduction inpenetration depth of approximately 50% by dif-fracting plane waves into nonnormal propagationmodes.
B. D. Clymer acknowledges the support of theDepartment of Electrical Engineering, The Ohio StateUniversity, and from a Research Challenge Grantfrom the Ohio Board of Regents. D. Gillfillan acknowl-edges the support of AT&T Columbus Works. Wethank Steve Bibyk and Qiushi Ren for their helpfulcomments and discussion.
References
1. L. A. Bergman, W. H. Wu, A. R. Johnston, R. Nixon, S. C.Esener, C. C. Guest, P. Yu, T. J. Drabik, M. Feldman, and S. H.Lee, "Holographic optical interconnections for VLSI," Opt.Eng. 25, 1109-1118 (1986).
2. B. D. Clymer and J. W. Goodman, "Optical clock distribution tosilicon chips," Opt. Eng. 25, 1103-1108 (1986).
3. B. D. Clymer, "Optical clock distribution for VLSI," Ph.D.dissertation (Stanford University, Stanford, Calif., 1987).
4. B. D. Clymer and J. W. Goodman, "Timing uncertainty forreceivers in optical clock distribution for VLSI," Opt. Eng. 27,944-954 (1988).
5. B. D. Clymer, "Surface-relief grating structures for efficienthigh bandwidth integrated photodetectors for optical intercon-nections in silicon VLSI," Appl. Opt. 28, 5374-5382 (1989).
6. D. H. Hartman, M. K. Grace, and C. R. Ryan, "A monolithicsilicon photodetector/amplifier IC for fiber and integratedoptics application," IEEE J. Lightwave Technol. LT-3, 729-738(1985).
7. W. Maly, Atlas of IC Technologies (Benjamin, New York, 1987).8. W. S. Scott, G. Hamachi, R. N. Mayo, and J. K. Ousterhout,
1985 VLSI Tools: More Works by the Original Artists (U.California Press, Berkeley, Calif., 1985).
9. M. G. Moharam and T. K. Gaylord, "Diffraction analysis ofdielectric surface-relief gratings," J. Opt. Soc. Am. 72, 1385-1392 (1982).