30
COSC 340: Software Engineering Debugging with Dynamic Binary Analysis & Instrumentation Michael Jantz COSC 340: Software Engineering 1
| Date post: | 12-May-2018 |
| Category: |
Documents |
| Upload: | vuongnguyet |
| View: | 215 times |
| Download: | 2 times |
COSC 340: Software Engineering
Debugging with Dynamic BinaryAnalysis & Instrumentation
Michael Jantz
COSC 340: Software Engineering 1

Program Analysis
• Programmers often use analysis tools to improve program quality
• Static Analysis‒ Analyze program source code or machine code without running it
‒ Often performed by compilers (type checking, optimizations)
• Dynamic Analysis‒ Analyze a client program as it runs
‒ Profilers, error checkers, execution visualizers
‒ DA instruments the client program with analysis code
‒ May change depending on program input
COSC 340: Software Engineering 2
Source Analysis vs. Binary Analysis
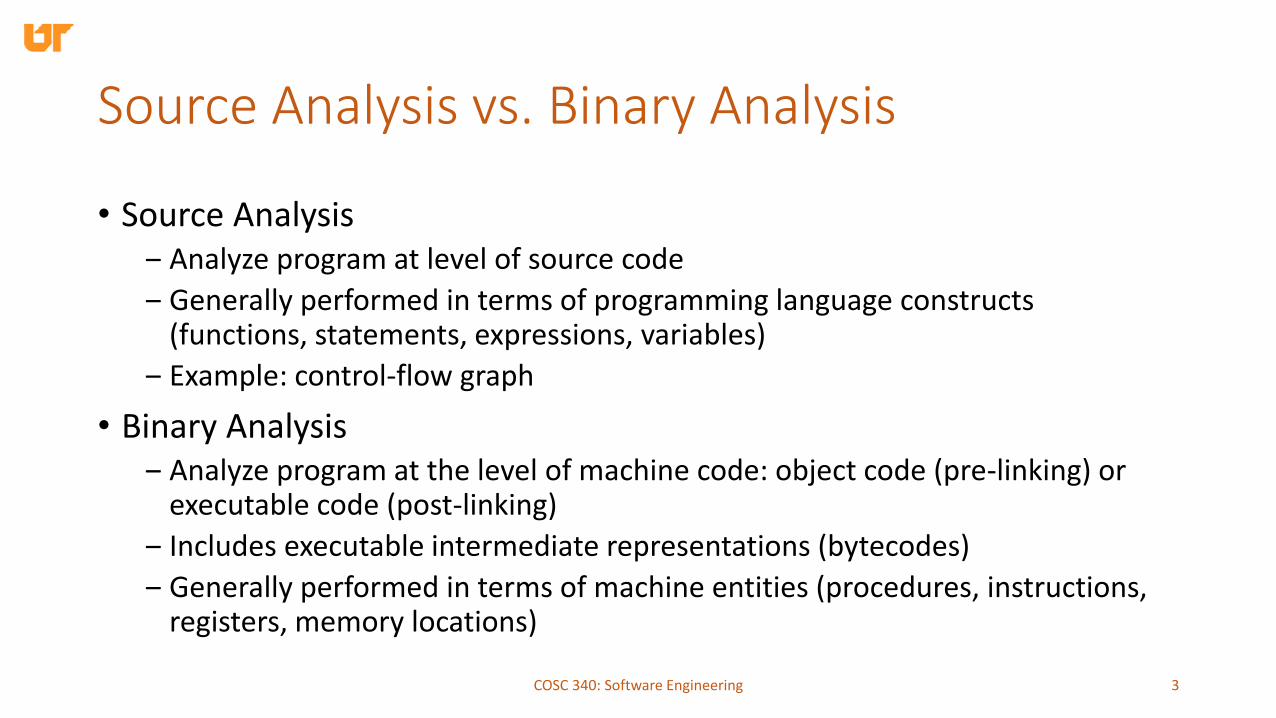
• Source Analysis‒ Analyze program at level of source code
‒ Generally performed in terms of programming language constructs (functions, statements, expressions, variables)
‒ Example: control-flow graph
• Binary Analysis‒ Analyze program at the level of machine code: object code (pre-linking) or
executable code (post-linking)
‒ Includes executable intermediate representations (bytecodes)
‒ Generally performed in terms of machine entities (procedures, instructions, registers, memory locations)
COSC 340: Software Engineering 3

Analysis Properties
Considers all execution pathsPlatform independentAccess to high-level information (functions, expressions, variables)
Considers run-time information, but only for one execution pathPlatform independentAccess to high-level information(functions, expressions, variables)
Considers all execution pathsDoes not require sourceAccess to low-level information(registers, memory locations)
Considers run-time information, but only for one execution pathDoes not require sourceAccess to low-level information(registers, memory locations)
COSC 340: Software Engineering 4
Static Dynamic
Source
Binary

Analysis Properties
Considers all execution pathsPlatform independentAccess to high-level information (functions, expressions, variables)
Considers run-time information, but only for one execution pathPlatform independentAccess to high-level information(functions, expressions, variables)
Considers all execution pathsDoes not require source codeAccess to low-level information(registers, memory locations)
Considers run-time information, but only for one execution pathDoes not require source codeAccess to low-level information(registers, memory locations)
COSC 340: Software Engineering 5
Static Dynamic
Source
Binary
Instrumentation for Dynamic Binary Analysis
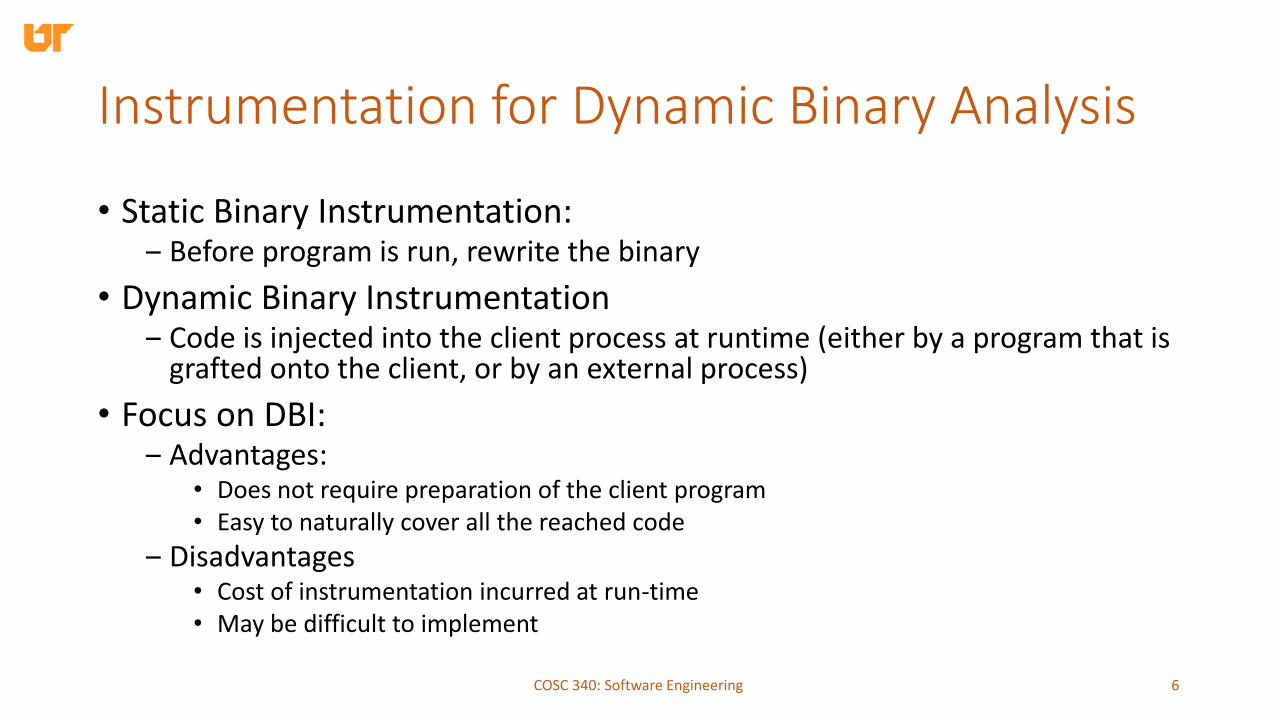
• Static Binary Instrumentation:‒ Before program is run, rewrite the binary
• Dynamic Binary Instrumentation‒ Code is injected into the client process at runtime (either by a program that is
grafted onto the client, or by an external process)
• Focus on DBI:‒ Advantages:
• Does not require preparation of the client program• Easy to naturally cover all the reached code
‒ Disadvantages• Cost of instrumentation incurred at run-time• May be difficult to implement
COSC 340: Software Engineering 6
Valgrind
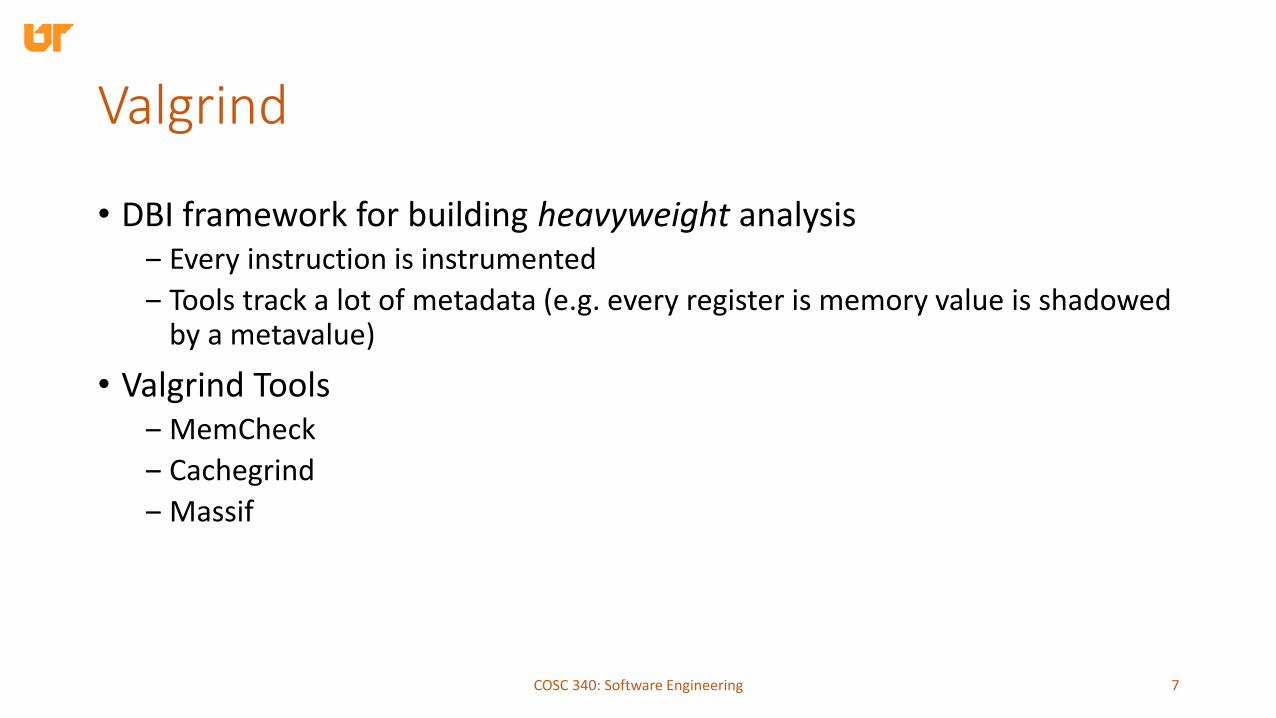
• DBI framework for building heavyweight analysis‒ Every instruction is instrumented
‒ Tools track a lot of metadata (e.g. every register is memory value is shadowed by a metavalue)
• Valgrind Tools‒ MemCheck
‒ Cachegrind
‒ Massif
COSC 340: Software Engineering 7
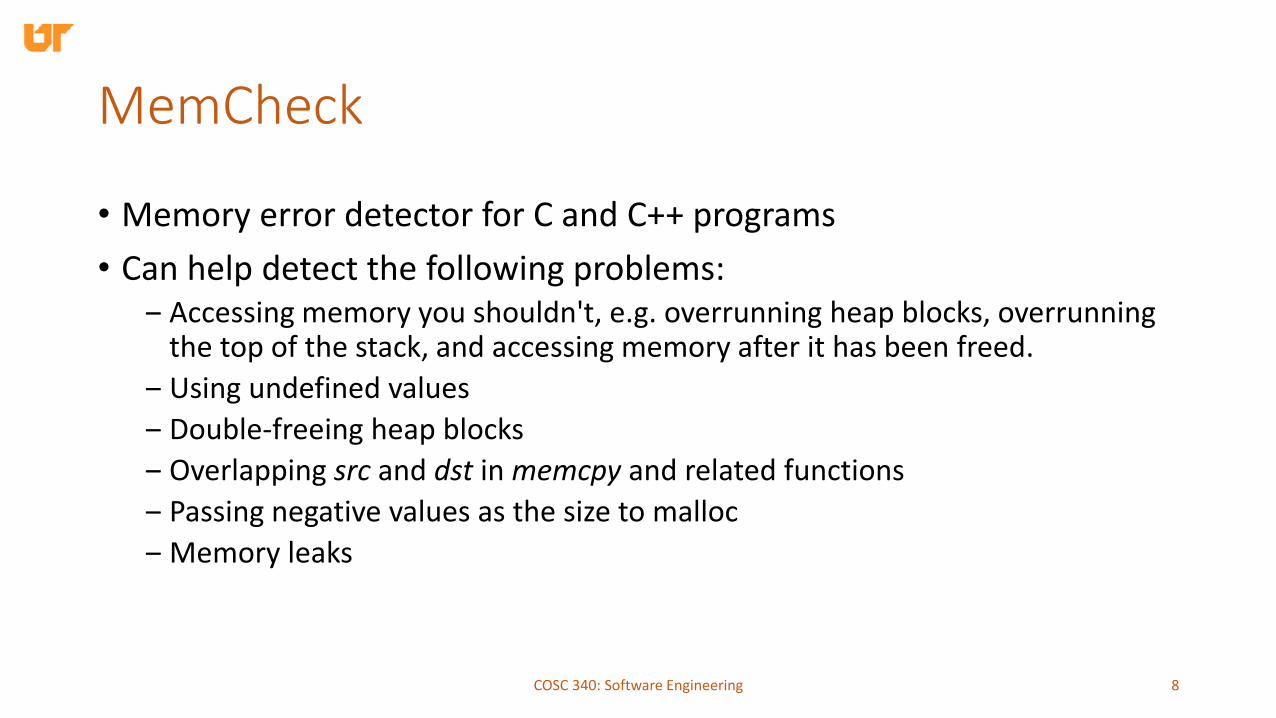
MemCheck
• Memory error detector for C and C++ programs
• Can help detect the following problems:‒ Accessing memory you shouldn't, e.g. overrunning heap blocks, overrunning
the top of the stack, and accessing memory after it has been freed.
‒ Using undefined values
‒ Double-freeing heap blocks
‒ Overlapping src and dst in memcpy and related functions
‒ Passing negative values as the size to malloc
‒ Memory leaks
COSC 340: Software Engineering 8

MemCheck Example
#include <stdlib.h>#include <stdio.h>
void f(void){
int* x = malloc(10 * sizeof(int));x[10] = 0; // problem 1: heap block overrun
} // problem 2: memory leak -- x not freed
int main(void){
int y;printf("y = %d\n", y); // problem 3: y used before initialized
f();return 0;
}
COSC 340: Software Engineering 9

MemCheck Example
• Running MemCheckvalgrind --leak-check=full ./mc
==27967== Memcheck, a memory error detector
==27967== Copyright (C) 2002-2013, and GNU GPL'd, by Julian Seward et al.
==27967== Using Valgrind-3.10.0 and LibVEX; rerun with -h for copyright info
==27967== Command: ./mc
• Error seen when MemCheck detects an uninitialized value==27967== Conditional jump or move depends on uninitialised value(s)
==27967== at 0x4E7CE12: vfprintf (in /usr/lib64/libc-2.17.so)
==27967== by 0x4E86C98: printf (in /usr/lib64/libc-2.17.so)
==27967== by 0x4005C1: main (mc.c:13)
COSC 340: Software Engineering 10
MemCheck Example
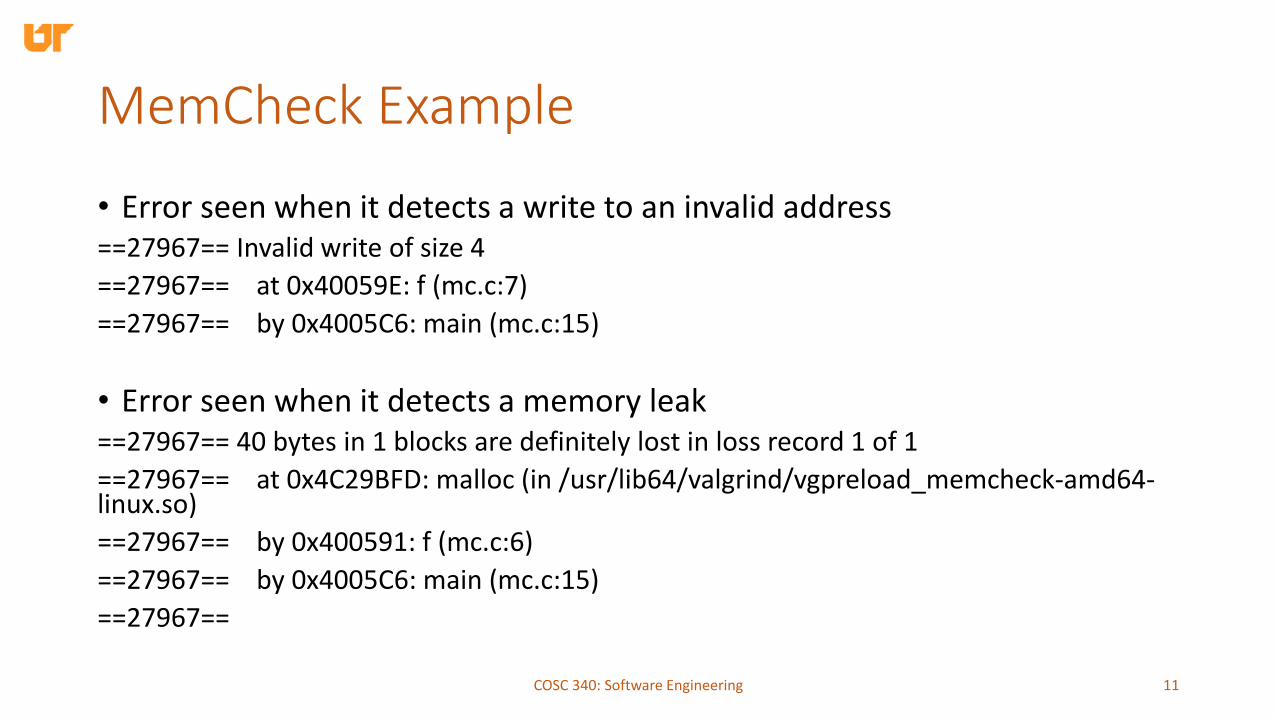
• Error seen when it detects a write to an invalid address==27967== Invalid write of size 4
==27967== at 0x40059E: f (mc.c:7)
==27967== by 0x4005C6: main (mc.c:15)
• Error seen when it detects a memory leak==27967== 40 bytes in 1 blocks are definitely lost in loss record 1 of 1
==27967== at 0x4C29BFD: malloc (in /usr/lib64/valgrind/vgpreload_memcheck-amd64-linux.so)
==27967== by 0x400591: f (mc.c:6)
==27967== by 0x4005C6: main (mc.c:15)
==27967==
COSC 340: Software Engineering 11
Cachegrind
• Simulates how your program interacts with the cache hierarchy and branch predictor‒ Includes simulation for first-level instruction and data caches (I1 and D1) and
the last level (LL) cache
‒ Does not simulate caches between first and last level
COSC 340: Software Engineering 12

Cachegrind
• Collects the following:‒ I cache reads (Ir which is the same as the instructions executed), I1 cache read
misses (I1mr) and LL cache reads and misses (ILmr)
‒ D cache reads (Dr, which equals the number of memory reads), D1 cache read misses (D1mr) and LL cache data read misses (DLmr)
‒ D cache writes (Dw, which equals the number of memory writes), D1 cache write misses (D1mw) and LL cache data write misses (DLmw)
‒ Conditional branches executed (Sc) and conditional branches mispredicted(Scm)
‒ Indirect branches executed (Bi) and indirect branches mispredicted (Bim)
COSC 340: Software Engineering 13
Cachegrind Example: Matrix Multiply
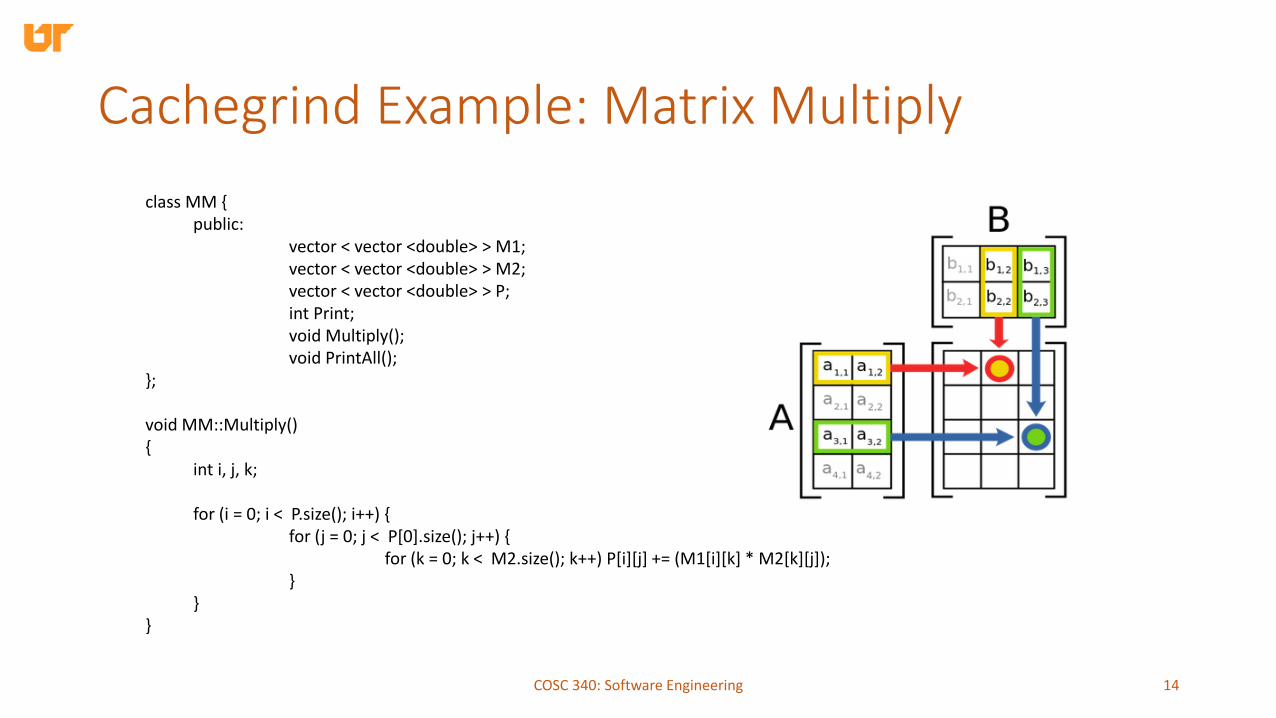
class MM {public:
vector < vector <double> > M1;vector < vector <double> > M2;vector < vector <double> > P;int Print;void Multiply();void PrintAll();
};
void MM::Multiply(){
int i, j, k;
for (i = 0; i < P.size(); i++) {for (j = 0; j < P[0].size(); j++) {
for (k = 0; k < M2.size(); k++) P[i][j] += (M1[i][k] * M2[k][j]);}
}}
COSC 340: Software Engineering 14
Cachegrind Example: Matrix Multiply
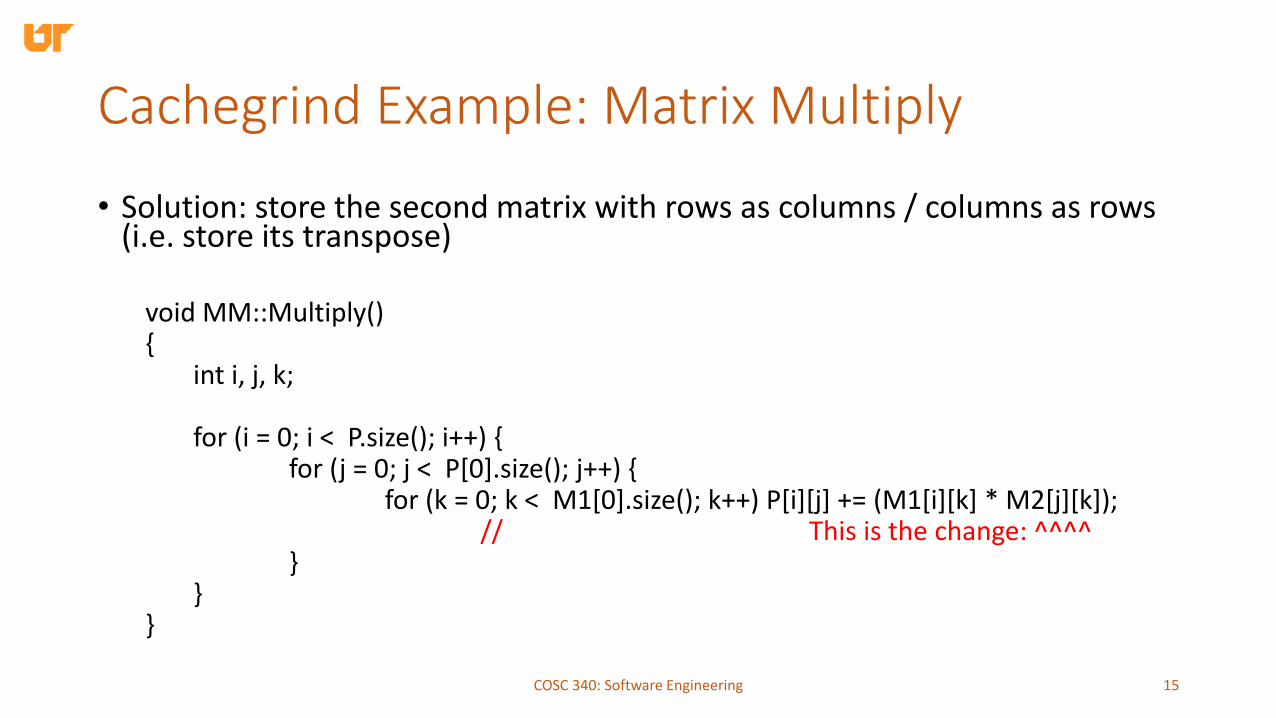
• Solution: store the second matrix with rows as columns / columns as rows (i.e. store its transpose)
void MM::Multiply(){
int i, j, k;
for (i = 0; i < P.size(); i++) {for (j = 0; j < P[0].size(); j++) {
for (k = 0; k < M1[0].size(); k++) P[i][j] += (M1[i][k] * M2[j][k]);// This is the change: ^^^^
}}
}
COSC 340: Software Engineering 15

Cachegrind Example: Matrix Multiply
COSC 340: Software Engineering 16

Cachegrind Example: Matrix Multiply
COSC 340: Software Engineering 17
Massif: Heap Profiler
• Measures how much heap space your program uses‒ Useful space and extra bytes for alignment
‒ Can also measure stack space (but does not do so by default)
• Collects 'snapshots' of memory usage at certain point in time
• Also tells you how much heap data is allocated at each allocation site
COSC 340: Software Engineering 18
Massif Example
COSC 340: Software Engineering 19
Massif Example
• Run massif:‒ > valgrind --tool=massif ./prog
• View information collected by massif‒ > ms_print massif.out.PID
• By default, snapshots measured in instructions executed‒ For short-running programs, use --time-unit=B to measure snapshots in bytes
allocated
COSC 340: Software Engineering 20
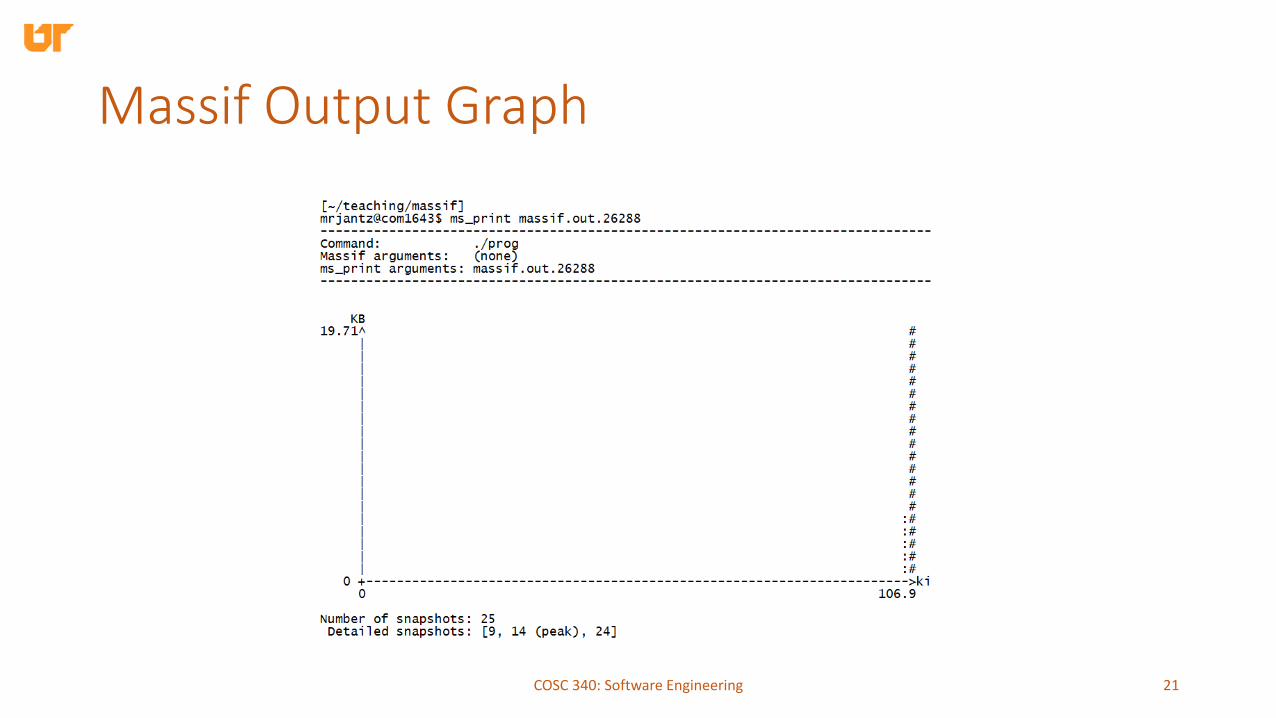
Massif Output Graph
COSC 340: Software Engineering 21
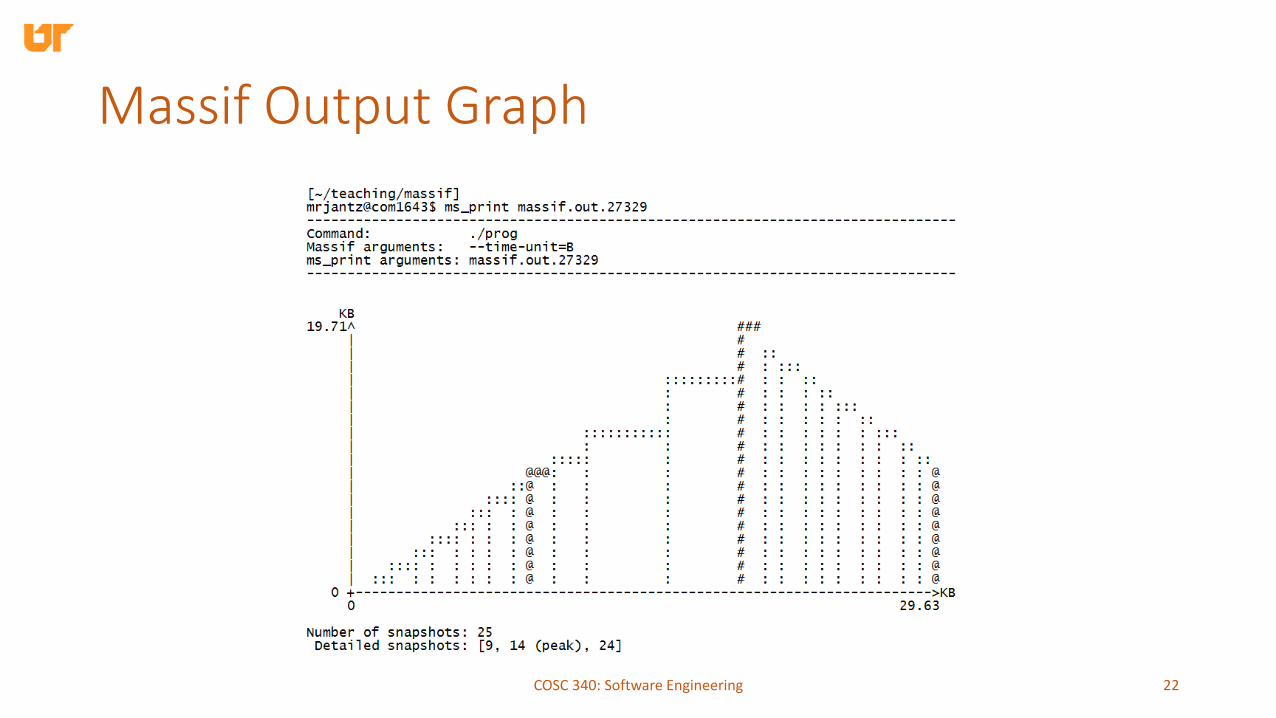
Massif Output Graph
COSC 340: Software Engineering 22

Snapshot Details
COSC 340: Software Engineering 23
Intel Pin
• Another tool for dynamic binary instrumentation
• Allows users to write their own DBI tools‒ Insert 'arbitrary' code in 'arbitrary' places in the executable
‒ Uses dynamic compilation to instrument executables as they are running
‒ Provides a platform-independent API for doing useful things with DBI
• Some example tools written in Pin‒ Memory tracers
‒ Call site profilers
‒ Cache simulators
COSC 340: Software Engineering 24

Pin's Software Architecture
COSC 340: Software Engineering 25

Pin Tool for Tracing Memory Writes
COSC 340: Software Engineering 26

Output of pinatrace (Memory Tracing Tool)
COSC 340: Software Engineering 27
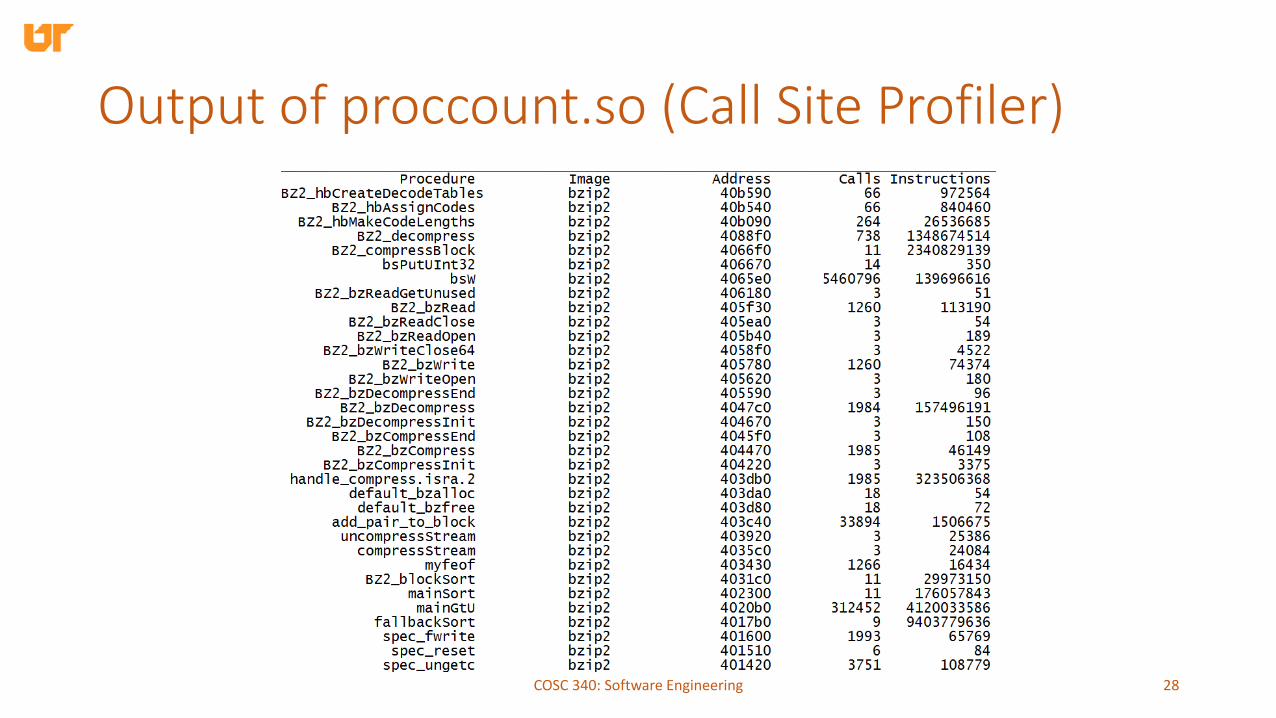
Output of proccount.so (Call Site Profiler)
COSC 340: Software Engineering 28
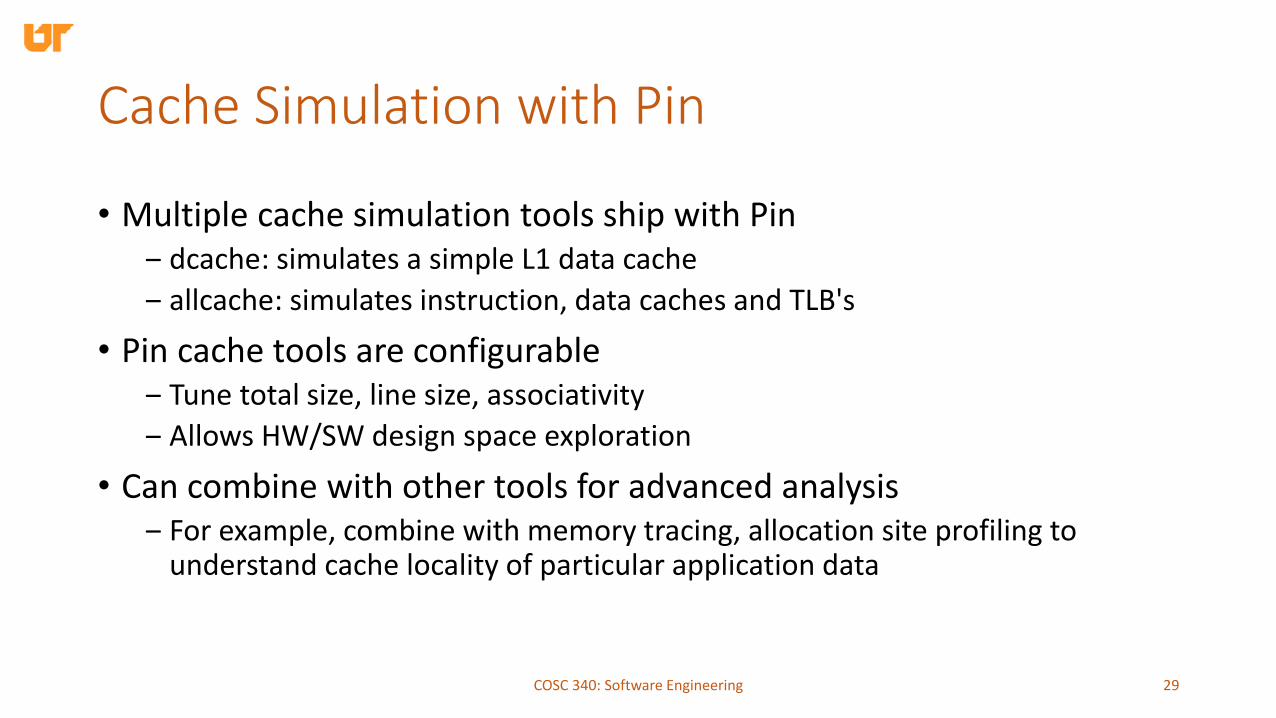
Cache Simulation with Pin
• Multiple cache simulation tools ship with Pin‒ dcache: simulates a simple L1 data cache
‒ allcache: simulates instruction, data caches and TLB's
• Pin cache tools are configurable‒ Tune total size, line size, associativity
‒ Allows HW/SW design space exploration
• Can combine with other tools for advanced analysis‒ For example, combine with memory tracing, allocation site profiling to
understand cache locality of particular application data
COSC 340: Software Engineering 29
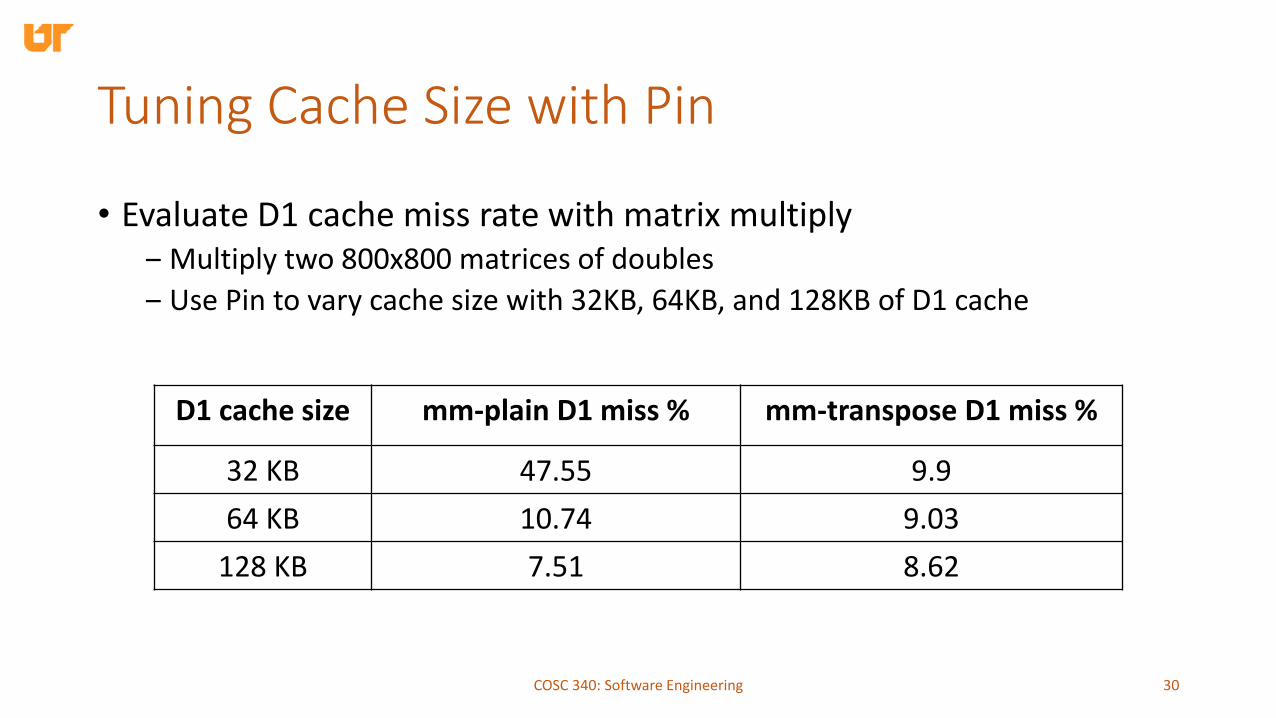
Tuning Cache Size with Pin
D1 cache size mm-plain D1 miss % mm-transpose D1 miss %
32 KB 47.55 9.9
64 KB 10.74 9.03
128 KB 7.51 8.62
COSC 340: Software Engineering 30
• Evaluate D1 cache miss rate with matrix multiply‒ Multiply two 800x800 matrices of doubles
‒ Use Pin to vary cache size with 32KB, 64KB, and 128KB of D1 cache


