63
Cosmological Prospects with HSC and PFS IPMU Oct 6 th 2011 Richard Ellis (Caltech) SNe CMB Lensing

Cosmological Prospects with HSC and PFS
IPMU Oct 6th 2011
Richard Ellis (Caltech)
SNe
CMB
Lensing

Dark Energy: Nobel Prize in Physics 2011

EUCLID Mission Accepted by ESA 1.2m telescope @ L2 under ESA’s Cosmic Vision program
Optical/IR imaging to H=24 over 20,000 deg2 for weak gravitational lensing (40 galaxies arcmin-2)
Near-IR spectra with 1:3 sampling over 20,000 deg2 to H=22 for baryonic acoustic oscillations (1.6 108 galaxies)
w to 2%, wa to 10% using two methods

Outline
• Review of methods for probing dark energy • Current status and limitations • Associated requirements • New ideas • Implications for PFS/HSC
• PFS Science Vision • Cosmology (near and far) • Galaxy formation • Unforeseen science
• Status of PFS
• Collaboration • Technical issues • Science planning
AIM: LOTS OF DISCUSSION – LESS FORMAL THAN HI-Z TALK!

Two rogue cosmic ingredients Dark Energy (1998 - ) Dark Matter (1933 - )
Fritz Zwicky
HSC and PFS promise fabulous progress in years up to Euclid

Many Earlier Hints of a Cosmological Constant 1984: Turner, Steigman & Krauss and, independently, Peebles invoked Λ to reconcile data with inflation and age discrepancy between old stars and that suggested in a low density Universe 1990: Efstathiou, Sutherland & Maddox demonstrated clustering of galaxies in 2-D APM survey of 2. 106 galaxies was incompatible with SCDM (Ω=1), proposing ΛCDM model 1995: Ostriker & Steinhardt summed up observational constraints ahead of supernovae data arguing for consideration of a non-zero Λ 1998-9: Results from SCP and HiZ supernovae teams demonstrate accelerating Universe 1999: Mike Turner coins the term `dark energy’

Implications of Cosmic Acceleration
Perlmutter et al 1999 Why not Λ? two puzzles:
• Quantum field theory suggests Λ= 8πGmP
4
(10120 larger than data)
• Why acceleration now?
ρM ∝ R-3 (matter)
ρvac = const (vacuum)
New physics: “dark energy”
- a scalar field: possibly time-dependent
- modification to GR gravity?

Characterizing Dark Energy as a Scalar Field • Cosmic acceleration could be caused by a new property of space - a negative pressure p
• Can characterise its behaviour via the equation of state of the vacuum
p = f ( ρ ) where ρ is the relevant energy density. The parameter w is introduced where
p / ρ = w • Can view this as a theoretical generalisation of the cosmological constant Λ
w = -1 corresponds to a cosmological constant
w < - 1/3 required for acceleration today
• Why should w be time-invariant? Perhaps it evolves e.g.
w(t) = wo + wa (1 - a(t) )

Consumer’s Guide to Observing Dark Energy
• Type Ia Supernovae: dL(z) to z ~ 2
• Most well-developed and ongoing with rich datasets
• Key issue is physics/evoln: do we understand SNe Ia?
• Weak lensing: G(t) to z ~ 1.5
• Less well-developed; ground vs space, needs photo-z’s
• Key issues are fidelity, calibration
• Baryon “wiggles”: dA(z), H(z) to z ~ 3
• Late developer: cleanest requiring huge surveys
See US DETF (Kolb et al) & ESA-ESO reports (Peacock et al).
The Popular Methods

First generation surveys:
• Supernova Cosmology Project (Perlmutter et al 99)
• Hi Z Supernova Project (Riess et al 98)
• Extensions using HST (Knop et al 03, Riess et al 04)
Second generation surveys:
• CFHT SN Legacy Survey (Astier et al 06, Conley/Sulllivan et al 11)
• ESSENCE project (Woods-Vasey et al 07, Foley et al 09)
• Carnegie IR survey (Freedman et al 09, Stritzinger et al 11)
• HST: z > 1 clusters (Suzuki et al 11), deep fields (Riess et al 07)
• Intermediate depth: SDSS2 (Kessler et al 09)
Fundamental Issues:
• Progenitor physics: evolution, host galaxy dependencies etc
• Dust extinction, photometric calibration
Might there be a systematic floor in the use of SNe in precision studies?
Method I: Supernova Surveys
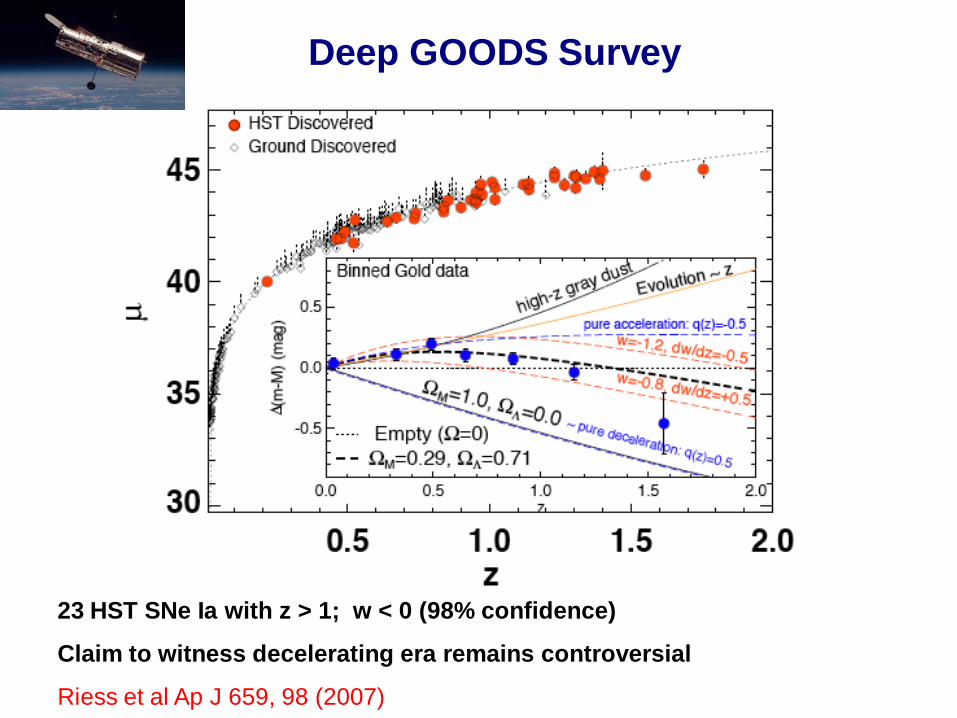
23 HST SNe Ia with z > 1; w < 0 (98% confidence)
Claim to witness decelerating era remains controversial
Riess et al Ap J 659, 98 (2007)
Deep GOODS Survey

CFHT Legacy Survey (2003-2008)
Megaprime
Deep Synoptic Survey
`Rolling search’
Four 1 × 1 deg fields in ugriz 5 nights/lunation 5 months per accessible field 2000 SNe 0.3 < z < 1
Caltech role: verify utility of SNe for cosmology
Sullivan+Nugent+RSE
Detailed spectral followup of 0.4<z<0.7 SNe Ia
HST studies of local SNe Ia

State of the Art in DE – SNLS
Conley et al (2011); Sullivan et al (2011)
Precision study of 472 intermediate redshift SNe Ia
Systematic errors ≈ statistical errors Systematic errors dominated by photometric calibration; if this could be fixed Δw~2%!
(including systematics)

Systematic Errors (SNLS)
Conley et al (2011)
The limiting precision is (arguably) not the number of distant SNe but primarily a self-consistent photometric calibration and poorly-understood host-dependencies

SNe Ia Properties Depend on Host Galaxy - I
Ia rate
SFR/mass
SN Ia rate correlates with specific star formation rate of host
Light curve `stretch’ likewise correlates
SN properties depend on mix of stellar population and hence redshift
Sullivan et al Ap J 648, 868 (2006)
Redshift bias predicted & observed: Howell et al Ap J 667, L37 (2007)
stretch

SNe Ia Properties Depend on Host Galaxy - II
Even allowing for a stretch and color correction (S,C), Sullivan et al argue there is a higher order dependence of SN Ia luminosity on the host specific SFR. Including this reduces Hubble diagram scatter but its physical origin is unclear!
Sullivan et al (2010)

Do SNe Ia Evolve? UV Probes Metallicity
UV dependence expected from deflagration models when metallicity is varied in outermost C+O layers (Lenz et al Ap J 530, 966, 2000)
Some models (not all) predict metals increase UV blanketing & produce shift in UV features

UV Evolution in SNe Ia? Update
Phase Stretch Redshift
• Ellis et al (2008) – Keck rest-frame UV spectra for 36 z~0.5 SNLS SNe Ia • Sullivan et al (2009) – comparison with 11 Riess et al z>1 HST grism spectra • Cooke et al (2011) – comparison with 12 local HST STIS UV spectra • Maguire et al (in prep) – increased sample to 28 local HST STIS UV spectra

Sullivan et al (2009)
Early Comparison (0.5 < z < 1.2)

Initial HST STIS – Keck Comparison 0 < z < 0.5
Palomar Transient Factory (PTF) revolutionizes early discovery of SNe Ia so that HST can be triggered in time for UV maximum light spectrum Initial comparison of 12 local UV spectra with z~0.5 Keck sample shows tantalizing differences! Cooke et al (2011)

Latest Results 0<z<0.5: Preliminary
Maguire et al (in prep)

New Ideas - I: Cosmology from SNe IIP? Hamuy & Pinto (2002) propose a new “empirical” correlation (0.29 mag, 15% in distance) between the expansion velocity on the plateau phase and the bolometric luminosity with reddening deduced from colors at the end of plateau phase.
Ultimately the Hubble diagram of SNe IIP could provide an independent verification of the cosmic acceleration, but more importantly be more promising probe of dark energy with JWST/TMT/E-ELT
Nugent et al Ap J 645, 841 (2006)

SNLS Type IIP Multicolor Light Curves
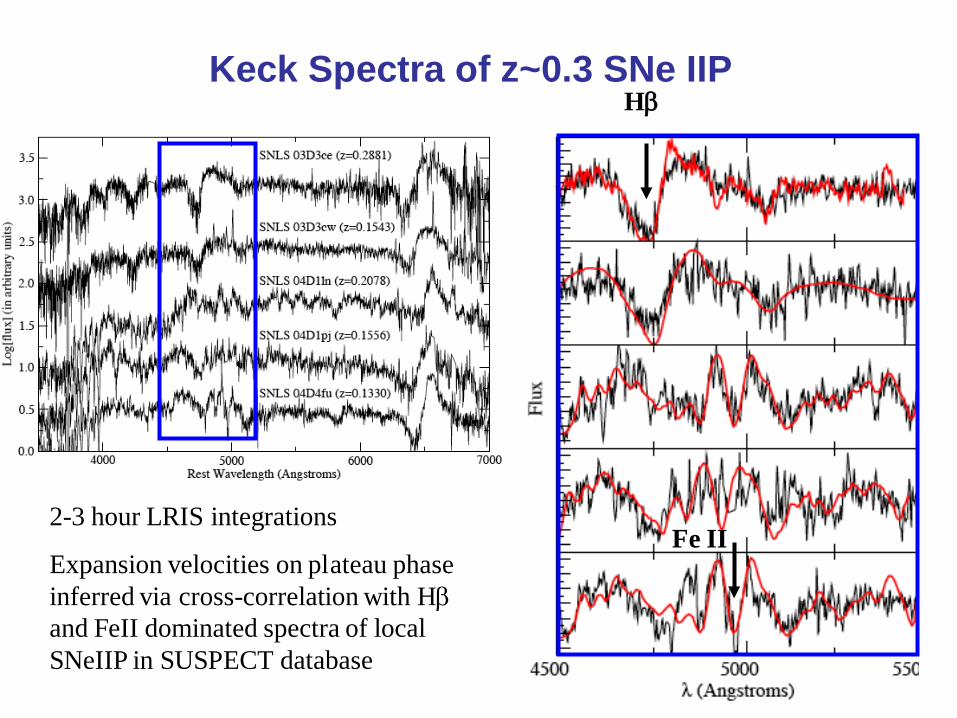
Keck Spectra of z~0.3 SNe IIP
2-3 hour LRIS integrations
Expansion velocities on plateau phase inferred via cross-correlation with Hβ and FeII dominated spectra of local SNeIIP in SUSPECT database
Hβ
Fe II
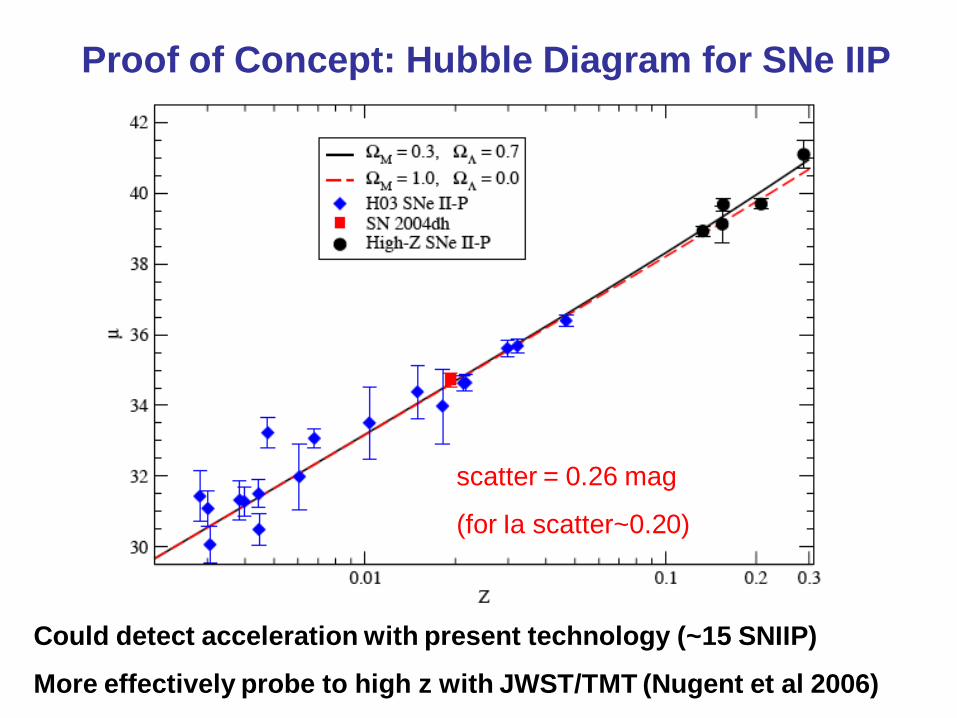
Proof of Concept: Hubble Diagram for SNe IIP
scatter = 0.26 mag
(for Ia scatter~0.20)
Could detect acceleration with present technology (~15 SNIIP)
More effectively probe to high z with JWST/TMT (Nugent et al 2006)

Integral of star formation history
Observed stellar masses
Various workers have proposed top-heavy IMF to explain: - intense SF in high z galaxies (Baugh et al 2005) - mismatch between integral of SF and assembled stellar mass (Wilkins et al 2008)
Ivan Baldry
New Ideas - II: Testing IMF via z>2 SNe IIN?

SNLS light curve gmax= 25.7 rmax= 25.2 i,max= 25.1
Determining Rate of SNIIN 2<z<3 (M > 40-60M?)
SN LBG
UV luminosity density of searched LBGs c.f.♯of SNIIn – tests IMF slope
Cooke, RSE et al
Keck LRIS spectrum -- Lyα at z=2.32
z SN234161 2.013 SN58306 2.187 SN23222 2.231 SN19941 2.357 SN165699 2.364 SN57260 3.028*

SNe Ia Summary • A single parameter (stretch/luminosity) is clearly inadequate as a description of the Ia population
• Host galaxy dependencies are complex. They could signify more than one progenitor mechanism whose mix will change with z. The current light curve shape correction may not correct such biases to the 0.02 mag level at z > 1
• UV evolution/dispersion results represent additional complications. Until understood, these may represent more biases, especially at z > 1
• We should be prepared for a systematic floor in precision of using SNe for dark energy studies: probably doesn’t affect current usage (δw ~ ±0.05) but suggests more work before investing in precision SNe work with future missions
• Improved instrumentation on Subaru offers new opportunities for high z SNe but spectroscopic follow-up is always the bottleneck

Method II- Weak Gravitational Lensing
Unlensed Lensed
Intervening dark matter distorts the pattern: various probes: shear-shear, g-shear etc

Contrasting Distance & Growth-based Methods: I Friedmann equation gives us epoch-dependent Hubble parameter which defines expansion history:
This can be observed in two ways:
(i) geometry via comoving distance-redshift relation (e.g. SNe)
(ii) effect on growth of density inhomogeneities (e.g. weak lensing)
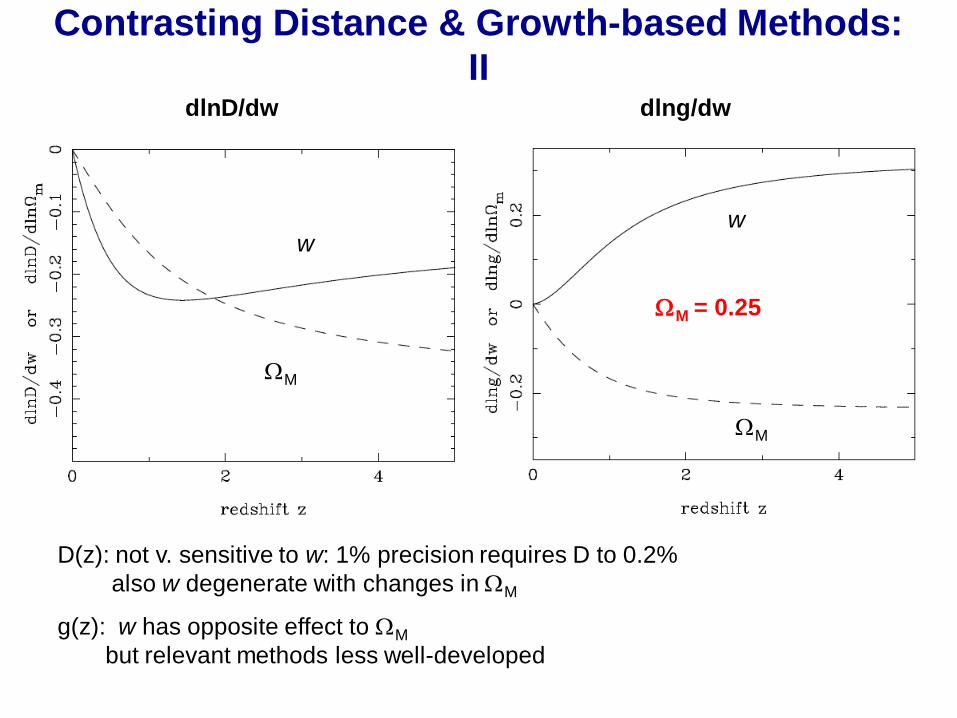
Contrasting Distance & Growth-based Methods: II
dlnD/dw dlng/dw
w w
ΩM
ΩM
D(z): not v. sensitive to w: 1% precision requires D to 0.2% also w degenerate with changes in ΩM
g(z): w has opposite effect to ΩM but relevant methods less well-developed
ΩM = 0.25
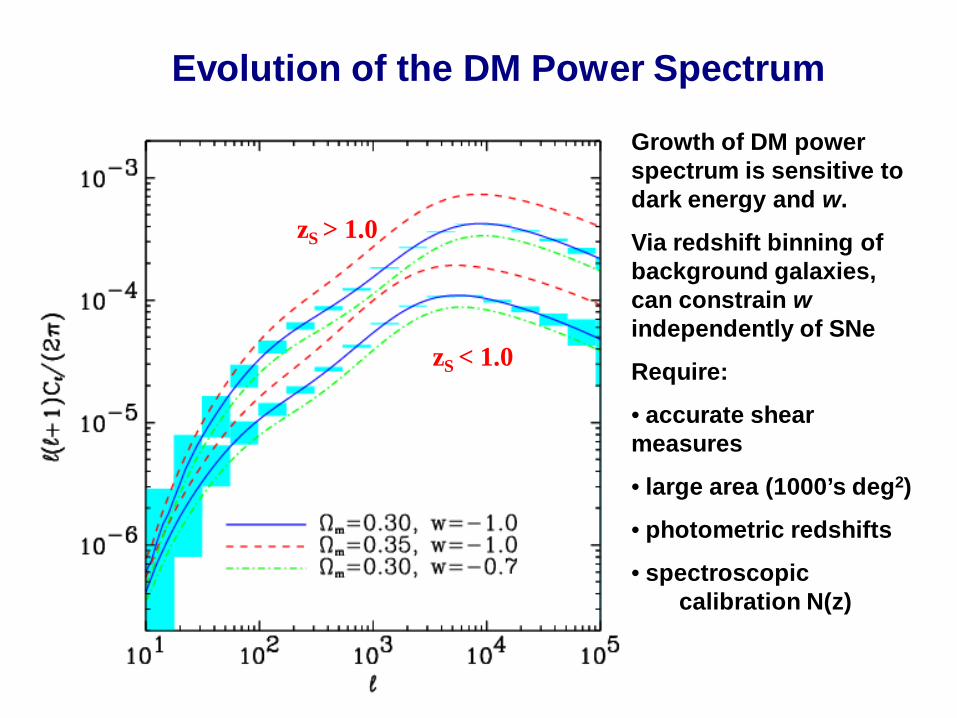
Growth of DM power spectrum is sensitive to dark energy and w.
Via redshift binning of background galaxies, can constrain w independently of SNe
Require:
• accurate shear measures
• large area (1000’s deg2)
• photometric redshifts
• spectroscopic calibration N(z)
zS > 1.0
zS < 1.0
Evolution of the DM Power Spectrum
33
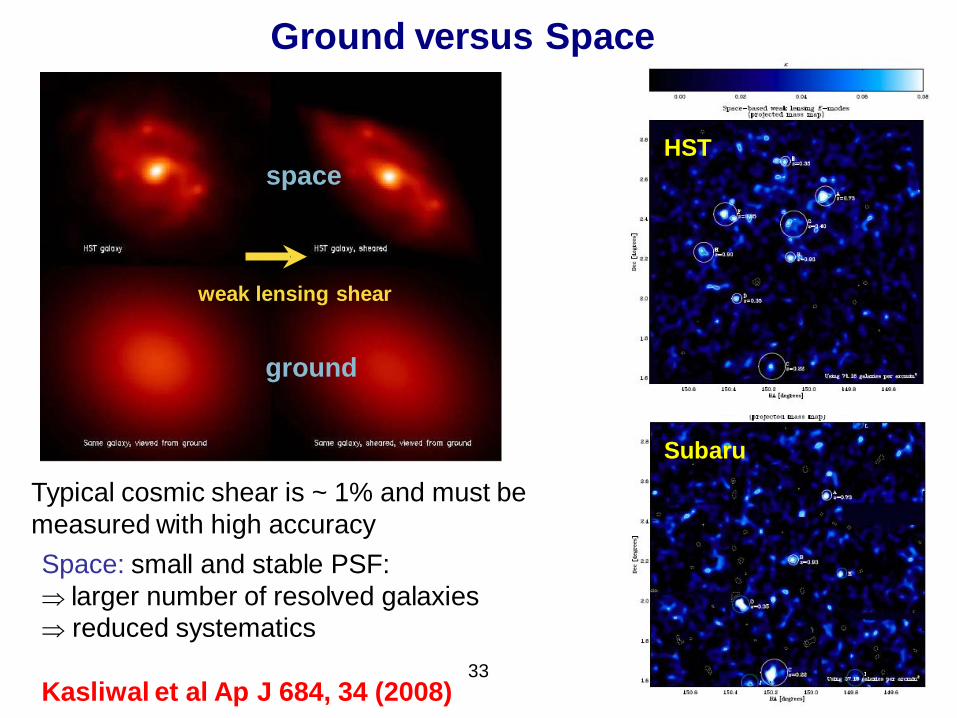
Space: small and stable PSF: ⇒ larger number of resolved galaxies ⇒ reduced systematics
weak lensing shear
space
ground
Typical cosmic shear is ~ 1% and must be measured with high accuracy
Ground versus Space
HST
Subaru
Kasliwal et al Ap J 684, 34 (2008)

zspec zspec
zphoto
• Need photometric redshifts for 109 galaxies
• But need 1-2 micron infrared data to achieve this precision for z >1 − impossible from ground (sky brightness)
• Additional need >105 spectroscopic redshifts for calibrating the photo-z’s
zphoto
OPT OPT+IR
Access to Space for Photometric Redshifts

Weak Lensing Issues
• Calibration: Need to measure shear to 10-3 & control systematics to 10-3.5 ; current methods 10 x worse. Much work needed but good progress (STEP1/2, GREAT08, GREAT10)
• Point spread function correction: Both ground (LSST) and space (Euclid) facilities are semi-funded. A space platform will offer superior performance so must be realistic in goals
• Redshift distributions: require accurate photometric N(z) for background populations. This means combining optical and infrared data with high precision and calibrating with a large spectroscopic survey
Provocative remark! The lensing community is very enthusiastic and hard-working but outside this community there is a lot of skepticism! Euclid and LSST will be drivers and HSC has to establish its place

During observation, a galaxy image is convolved with a PSF: making it bigger and changing its ellipticity
During data analysis, shear measurement methods seek to undo these changes to recover the true shape
An imperfect shear measurement method may not measure (any of) these quantities well. It instead obtains an inaccurate measurement, denoted by a hat.
Testing Lensing Algorithms The Forward Process
The Inverse…
…problem

STEP project: blind comparisons on simulated datasets
Heymans et al (2006), Massey et al (2007)
Most algorithms don’t yet recover shear at the necessary precision (in terms of linearity m1 or calibration c1)
∆γ = m1γ + c1 The contestants
STEP: Correctly Extracting the Weak Signal
required precision

GREAT08 + GREAT10 Challenge
Med
ian
reds
hift
Survey area
Figure of merit Q (high is good) derived from comparing submitted and input power spectrum C(l) For a particular survey, for systematic errors to match statistical ones, you get a target Q
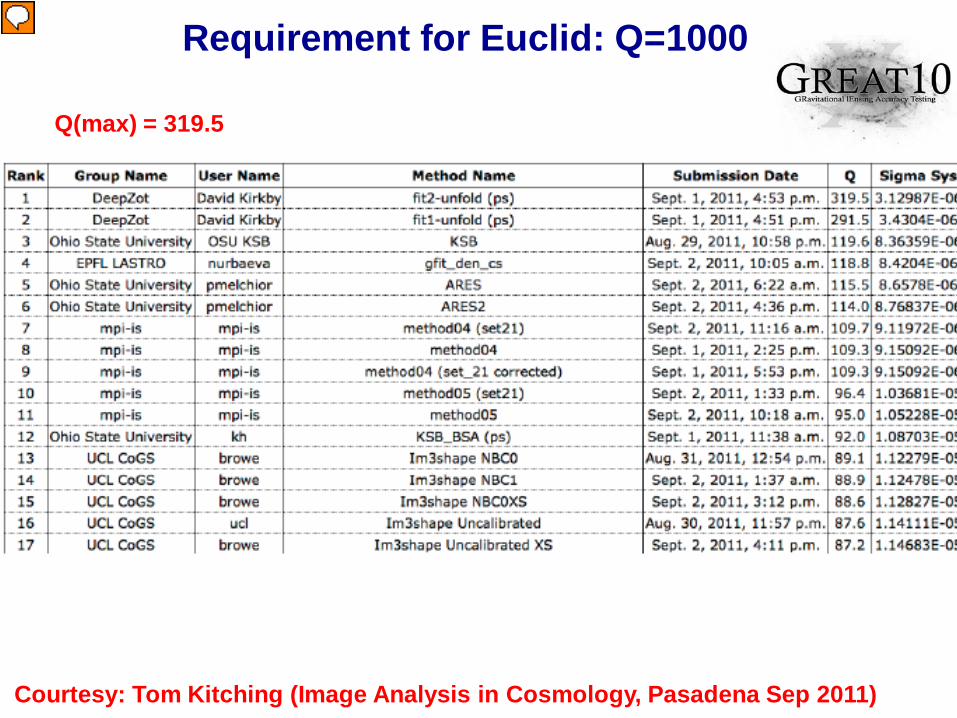
Requirement for Euclid: Q=1000
Courtesy: Tom Kitching (Image Analysis in Cosmology, Pasadena Sep 2011)
Q(max) = 319.5

Here’s hoping for the best..
Courtesy: Tom Kitching (Image Analysis in Cosmology, Pasadena Sep 2011)
Q

Method III – Large Scale Structure
Residual of acoustic horizon at last scattering in galaxy distribution. Peebles & Yu 1970; Sunyaev & Zel’dovich 1970
Confirmed at 3-4σ by 2dF (Cole et al) and SDSS (Eisenstein et al)

Combining SDSS and 2dF
Percival et al MNRAS 381, 1053 (2007)
Combining with WMAP, SNLS in flat case:
Ω = 0.249± 0.018; w = -1.004 ± 0.088
P(k) / P(k)smooth

`WiggleZ’ Project (PI: Glazebrook) - 240,000 redshifts with AAΩ spectrograph - Emission line g z>0.5 from GALEX+SDSS - 103 deg2, 220 nights zP~0.6 - First results from 132,500 redshifts -
AAOmega
GALEX
N(z)
Projected result: ∆w~8%
Blake et al (2011) 3.2σ detection

44
Cosmology with PFS
[O II] redshift survey: 0.6<z<1.6 R<22.9; 4 × 10⁶ galaxies; 80 clear nights
- BAO yielding w to 3% (valuable test of w ≠ -1.0) - RSD yielding fg to 1.5% (first test of modified GR as soln to DE) - large scale structure and galaxy evolution in clusters and field
Synergy with HyperSuprimeCam (targets, colors, weak lensing) PFS would be the first survey to probe z > 1 complementing BOSS with similar precision, offering the potential of a breakthrough in understanding Dark Energy
Baryonic Acoustic Oscillations Redshift Space Distortions

Modified Gravity?
?
All current measurements relate to expansion rate, assuming H(z) comes from GR Friedmann equation
H2(z) = H20 [ (1-Ω) (1+z) 2 + ΩM (1+z) 3 + ΩR (1+z) 4 + ΩDE (1+z) 3 (1+w) ]
Curvature matter radiation extra term from non-GR?
Suppose DE is an illusion, indicating failure of Einstein gravity on large scales. Density fluctuations perform differently to global expansion history as valuable probe

46
Redshift Space Distortions
• Acts as measure of gravitationally-induced peculiar velocities
• Growth fg = d ln δ / d ln a and expect fg ≈ Ωm
0.55 • Independent of Λ & w • Suppose DE is an
illusion, indicating failure of Einstein gravity. Density fluctuations perform differently to global a(t) as valuable probe
• So measure fg ≈ Ωmγ
Is γ = 0.55??
• Quickest potential breakthrough for DE!
PFS offers best opportunity after BOSS!
2dF VVDS WFMOS

47
PFS Science White Paper (Takada & Silverman)

48
DE Figure of Merit Forecasts
Working group needs to discuss many issues: • non-linear effects (clustering and redshift-space distortion) • scale dependent bias for RSD (combining HSC DM and PFS) • merits of the IR BAO component (much harder) • target selection and survey optimization (80, 100, 120 nights?)

Competitive Landscape - I BigBOSS
DESpec
ngCFHT
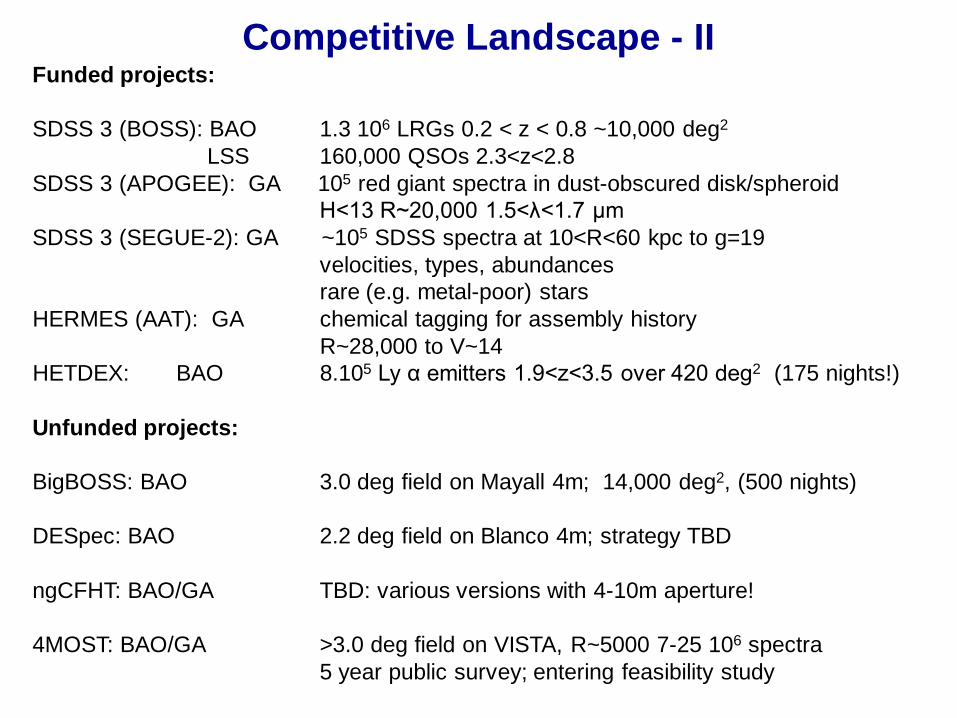
Competitive Landscape - II Funded projects: SDSS 3 (BOSS): BAO 1.3 106 LRGs 0.2 < z < 0.8 ~10,000 deg2 LSS 160,000 QSOs 2.3<z<2.8 SDSS 3 (APOGEE): GA 105 red giant spectra in dust-obscured disk/spheroid H<13 R~20,000 1.5<λ<1.7 μm SDSS 3 (SEGUE-2): GA ~105 SDSS spectra at 10<R<60 kpc to g=19 velocities, types, abundances rare (e.g. metal-poor) stars HERMES (AAT): GA chemical tagging for assembly history R~28,000 to V~14 HETDEX: BAO 8.105 Ly α emitters 1.9<z<3.5 over 420 deg2 (175 nights!) Unfunded projects: BigBOSS: BAO 3.0 deg field on Mayall 4m; 14,000 deg2, (500 nights) DESpec: BAO 2.2 deg field on Blanco 4m; strategy TBD ngCFHT: BAO/GA TBD: various versions with 4-10m aperture! 4MOST: BAO/GA >3.0 deg field on VISTA, R~5000 7-25 106 spectra 5 year public survey; entering feasibility study
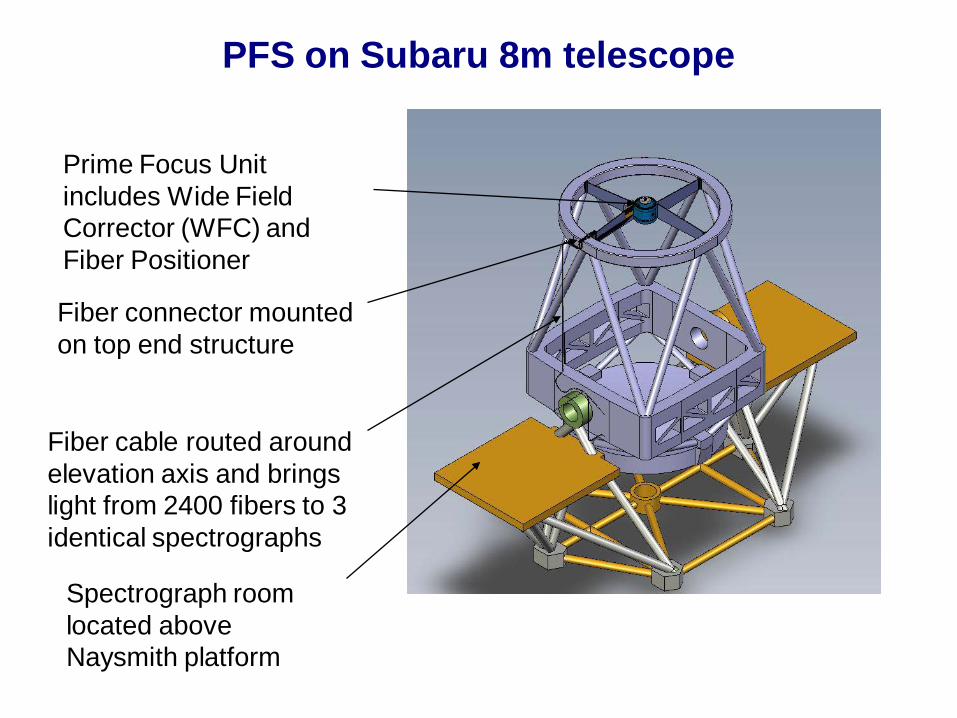
PFS on Subaru 8m telescope
Prime Focus Unit includes Wide Field Corrector (WFC) and Fiber Positioner
Fiber cable routed around elevation axis and brings light from 2400 fibers to 3 identical spectrographs
Spectrograph room located above Naysmith platform
Fiber connector mounted on top end structure

PFS Positioner
Optical Bench with Positioner Units
Positioner Unit - Cobra
Cobra system tested at JPL in partnership with New Scale Technologies Designed to achieve 5μm accuracy in < 8 iterations (40 sec) Up to 4000 positioners 8mm apart in hexagonal pattern to enable field tiling
A&G Fiber Guides
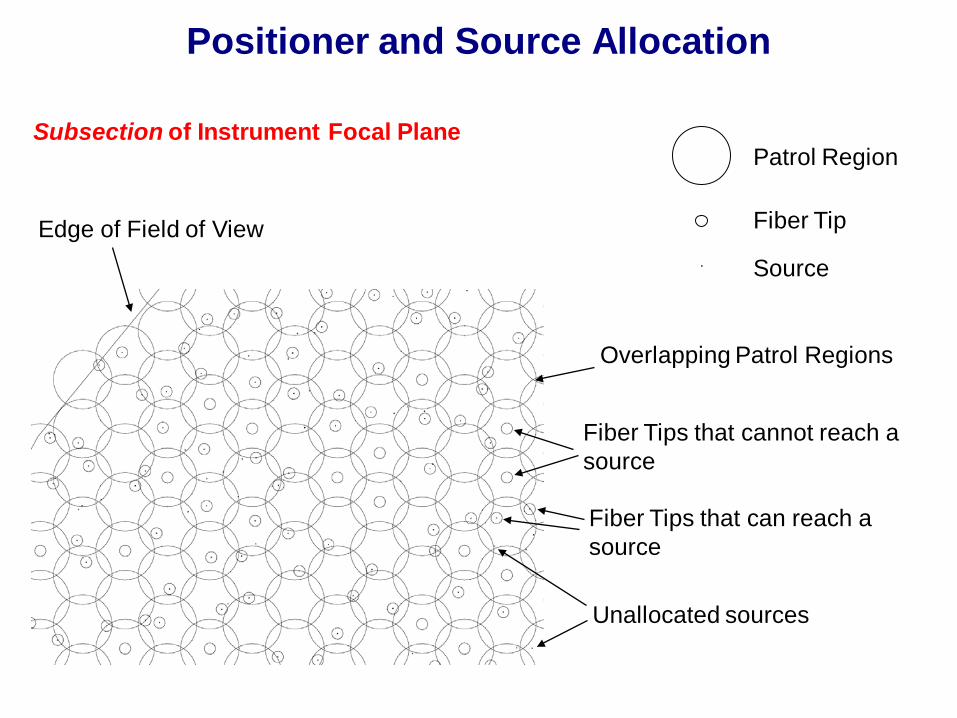
Positioner and Source Allocation
Subsection of Instrument Focal Plane
Edge of Field of View
Overlapping Patrol Regions
Fiber Tips that cannot reach a source
Fiber Tips that can reach a source
Unallocated sources
.
Patrol Region
Fiber Tip
Source

Positioner Element – “Cobra”
• Each Positioner element uses 2 “rotary squiggle” motors (2.4mm) with 5μm resolution and ~instantaneous response
• Each motor rotates to provide complete coverage of the patrol region.
• Optical fibers mounted in “fiber arm” which attaches to upper positioner axis
• Fiber runs through the center of the positioner
• Prototyped and tested in through JPL and New Scale Technologies
First axis of rotation
Second axis of rotation
Patrol Region Top View
Fiber Tip

55
Prototype array of positioners is an essential precursor to proposing for a ~2400-4000 element system Following Japanese community approval of PFS (Jan 2011), Caltech/JPL is now developing prototype as working system ($400K award Sep 2011) Verify scalability using prototype module of 7 units by summer 2012 Retire risks on
- assembly & integration - multiplexed electronics - performance variability - collision avoidance - metrology imaging - closed loop behavior
Cobra fiber positioners
Proposed 7-element prototype to demonstrate mechanical integration, tolerances, & integrated electronics
Multiplexed motor electronics
Next Step: Cobra 7-element Prototype

Unit 3-arm Spectrograph
Design: Jim Gunn (Princeton)
f/2.5 Schmidt collimator with 250mm beam & VPH gratings λλ 3800 Å – 1.3 μm in 3 f/1.0 cameras: 3800-6700 Å R~2000 6550-10000 Å R~4000 97000-13000Å R~4000 Optical arms: Two 2K × 4K Hamamatsu CCDs IR arm: Teledyne 4K × 4K HgCdTe 1.7 μm cutoff array

57
Quality of Spectra Required
White Paper Simulation (5000sec) Keck LRIS 1.3<z<1.6 (12 hours!)
Emission line surveys practical, but stellar continuum measures very hard

58
Science Planning…
• Scientific scope and priorities of a SSP is an important precursor to a functioning PFS partnership
• The combination of the WFMOS science case and the PFS White Paper provides an excellent starting point but Working Groups in the key areas need to define requirements and perhaps undertake more realistic simulations
- Cosmology - Galactic Archeology - Galaxy Evolution - AGN/QSOs • Recognize other multi-object programs (BOSS, HERMES, 4MOST…)
• Possibility of sharing PFS time across programs (e.g. galaxies and cosmology)
• How do we account for unforeseen opportunities in the era of TMT/LSST?

59
Galactic Archeology
Galactic Streams
Galactic Structure is Near-Field Cosmology! Stellar kinematics and abundances offer a huge potential in synergy with GAIA – a revolution in our understanding of DM halo & how Milky Way & M31 assembled. But now competitive as GAIA approaches! How can PFS complement other surveys?
GAIA 3-D revolution
M31 Halo

60
Galactic Programs
• Original WFMOS GA program was ambitious (by Gemini design)
LowRes (dynamics) R ~5000 V < 20; 3 × 10⁶ stars; 76 nights HiRes (chemistry) R~20,000 V < 17; 106 stars; 110 nights
NB: R~20,000 capability would have been unique to 8m aperture but no longer a first light capability (although White Paper recommends later upgrade)
• PFS White Paper offers several individual programs • Milky Way halo: R~3000 106 stars V<20.5 + GAIA (50 nights) • Studies of M31 halo (30 nights) • Local Group dwarfs (8 nights)
• Key issues:
• Which are competitive with 4m programs and 8-10m M31 campaigns? • Are there useful collaborative synergies with other programs? • Which GA programs fit well into a SSP?

The basic case is well-posed in the PFS White Paper in two components: - Galaxy & AGN evolution to z~2 through a wide area survey 30 deg2 zAB<22.5 106 galaxies 100 nights
• multi-facetted approach involving detailed of mass assembly, chemical evolution, QSOs, clusters (X-ray, SZ) etc.
- Lyman alpha emission in various HSC samples in the range 2<z<7 30 deg2 i’AB<24 30,000 LBGs and 8,000 LAEs 40 clear nights
• large scale structure (LAEs), stacked LBG spectra, feeding Keck/VLT and TMT for more detailed studies
Both programs well suited to Subaru and beyond reach of competitor instruments (except HETDEX for LAEs @ z~2-3) Key issue: optimal survey areas (e.g. to combat cosmic variance) practicality of securing suitable spectra at these very faint limits balance of effort between 1<z<2 and higher z
Distant Galaxies

62
Future Synergies Important

63


