European Co-operation in the Field of Scientific and Technical Research C C O O S S T T 3 3 4 4 5 5 Procedures Required for the Assessment of Highway Structures Final Report European Commission Directorate General Transport and Energy
Transcript
European Co-operation in the Field of Scientific and Technical Research
CCOOSSTT 334455 Procedures Required for the Assessment of Highway
Structures
FFiinnaall RReeppoorrtt
European Commission
Directorate General Transport and Energy
Prepared by the Working group leaders of the COST 345 action: Kenneth Charles Brady (TRL, UK)
Miles O'Reilly (TRL, UK) Lojze Bevc (ZAG, Slovenia)
Neither the European Commission nor any person acting on be-half of the Commission is responsible for the use which might be
made of the following information.
The views expressed in this publication do not necessarily reflect the views of the European Commission.
A great deal of additional information on COST Transport is available on the World Wide Web. It can be accessed through the CORDIS server at the following address:
http://www.cordis.lu/cost-transport/home.html
Editors: Richard Jordan, Aleš Žnidarič
COST 345 Final Report
1
TABLE OF CONTENTS
Chapter 1 Introduction ......................................................................................................1 1.1 THE EUROPEAN HIGHWAY NETWORK ................................................................. 1 1.2 HIGHWAY STRUCTURES ................................................................................................ 3
1.2.1 Their part in the road network..............................................................................................3 1.2.2 Assessment procedures for highway structures .................................................................3 1.2.3 Why assessment procedures are required............................................................................4 1.2.4 The challenge to owners and operators...............................................................................5
Chapter 3 Summary of WG1 Report on Inventory.......................................................... 11 3.1 BACKGROUND ................................................................................................................. 11 3.2 THE INFORMATION ...................................................................................................... 11
3.2.1 The road network..................................................................................................................12 3.2.2 Bridges ....................................................................................................................................13 3.2.3 The age of bridges.................................................................................................................13 3.2.4 Overall length and span of bridges ....................................................................................15 3.2.5 Replacement cost of bridges ...............................................................................................15 3.2.6 Annual running costs of bridge stock................................................................................19 3.2.7 Culverts...................................................................................................................................20 3.2.8 Retaining walls .......................................................................................................................20 3.2.9 Tunnels ...................................................................................................................................21 3.2.10 General....................................................................................................................................24
3.4 SUSTAINABLE CONSERVATION............................................................................... 31 3.4.1 The amount of expenditure required.................................................................................31 3.4.2 Other information.................................................................................................................31
3.6.1 The existing situation in the EU15.....................................................................................35 3.6.2 Dedicated, earmarked or hypothecated road user charges.............................................39
3.7 IMPLEMENTATION, DEVELOPMENT AND RESEARCH ................................ 39 3.7.1 Inventory of Highway Structures .......................................................................................39 3.7.2 Funding...................................................................................................................................39 3.7.3 Monitoring the Programme.................................................................................................40
COST 345 Final Report
2
3.7.4 Research .................................................................................................................................41 3.7.5 Verification and evaluation..................................................................................................43
Chapter 4 Summary of Working Groups 2 and 3 Report on inspection and condition assessment ..................................................................................... 45
4.1 BACKGROUND..................................................................................................................45 4.2 IDENTIFICATION AND QUANTIFICATION OF ACTION ...............................45
4.2.1 Introduction...........................................................................................................................45 4.2.2 Current position ....................................................................................................................46 4.2.3 Use of design codes for assessment...................................................................................47 4.2.4 Future strategy.......................................................................................................................47
4.3 TYPES OF DEFECT..........................................................................................................49 4.3.1 General ...................................................................................................................................49 4.3.2 Review of defects ..................................................................................................................50
4.4 INSPECTION ......................................................................................................................57 4.4.1 Introduction...........................................................................................................................57 4.4.2 Current position ....................................................................................................................58
4.6 DATA MANAGEMENT....................................................................................................70 4.6.1 Type and format of data ......................................................................................................70 4.6.2 Application of data ...............................................................................................................71
4.8 QUALIFICATION AND CERTIFICATION................................................................74 4.8.1 Current position ....................................................................................................................74 4.8.2 The training of inspectors....................................................................................................74 4.8.3 Interpretation and analysis...................................................................................................75
Chapter 5 Summary of Working Groups 4 and 5 Report on numerical techniques for safety and serviceability assessment ..................................... 77
5.1 BACKGROUND..................................................................................................................77 5.1.1 Significance of structural assessment.................................................................................78 5.1.2 Numerical methods of assessment.....................................................................................78 5.1.3 Levels of assessment.............................................................................................................79
Chapter 6 Summary of Working Group 6 Report on remedial measures .................... 115 6.1 BACKGROUND ............................................................................................................... 115
6.1.1 Scope .....................................................................................................................................115 6.1.2 Defects and deterioration ..................................................................................................115 6.1.3 Approach to remedial works .............................................................................................116
6.2 WATER MANAGEMENT.............................................................................................. 116 6.3 REMEDIAL MEASURES FOR BRIDGES ................................................................ 117
Chapter 7 Consolidated listing of recommendations ................................................... 141 7.1 RECOMMENDATIONS FROM WORKING GROUP 1 (INVENTORY)......... 141 7.2 RECOMMENDATIONS FROM WORKING GROUPS 2 AND 3
(INSPECTION AND CONDITION ASSESSMENT)............................................. 143 7.3 RECOMMENDATIONS FROM WORKING GROUPS 4 AND 5
(NUMERICAL TECHNIQUES, AND SAFETY AND SERVICEABILITY) ..... 146 7.4 RECOMMENDATIONS FROM WORKING GROUP 6 (REMEDIAL
MEASURES)....................................................................................................................... 149 7.5 RECOMMENDATIONS ON ASSET MANAGEMENT (SEE ANNEX I)........ 150
I.2.1 Basis........................................................................................................................... 162 I.2.2 Data collection, collation and feedback ............................................................... 162
I.3 ASSET VALUE ................................................................................................................. 163 I.3.1 Asset value as a measure of performance ............................................................ 163
I.4 NET PRESENT VALUE ................................................................................................ 164 I.5 WHOLE LIFE COSTING.............................................................................................. 164
I.5.1 The need for case studies ....................................................................................... 165 I.5.2 Design life................................................................................................................. 165
I.7 BUSINESS CASE..............................................................................................................169 I.8 RESEARCH AND DEVELOPMENT.........................................................................169
Table 3-1 Distribution of roads ........................................................................................................ 12 Table 3-2 Number of bridges............................................................................................................ 14 Table 3-3 Replacement costs of bridges .......................................................................................... 16 Table 3-4 Typical unit replacement cost of bridges ....................................................................... 18 Table 3-5 Running costs of bridges.................................................................................................. 19 Table 3-6 Detailed information on culverts .................................................................................... 20 Table 3-7 General information on retaining walls.......................................................................... 21 Table 3-8 Detailed information on retaining walls ......................................................................... 22 Table 3-9 Number of tunnels............................................................................................................ 25 Table 3-10 Operational and construction information for tunnels ............................................... 26 Table 3-11 Replacement and running costs of tunnels ................................................................... 27 Table 3-12 HGV taxes in Member States (EU15) as of 1 January 1998 (Commission
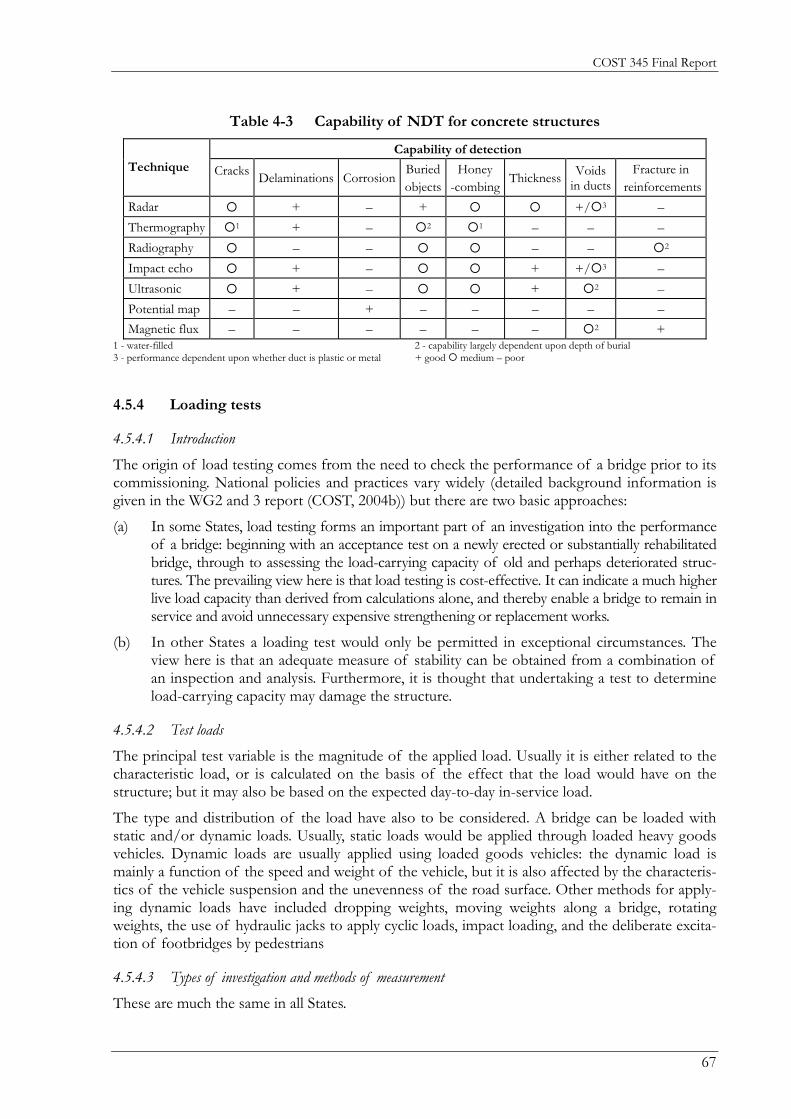
of the European Communities, 1998)............................................................................ 37 Table 3-13 Road revenue and road expenditure in 1994 (Bousquet and Queiroz, 1998) ........... 37 Table 3-14 Dedicated user fees (Bloom, 1999) ................................................................................. 38 Table 4-1 Checklist of actions ........................................................................................................... 48 Table 4-2 Capability of NDT for steel structures .......................................................................... 66 Table 4-3 Capability of NDT for concrete structures ................................................................... 67 Table 5-1 Examples of systematic (bias) and random variations in material
properties ............................................................................................................................ 86 Table 5-2 Analysis methods recommended for each level of assessment ................................ 101 Table 5-3 Selected risks in society ................................................................................................... 104 Table 5-4 ISO/CD 13822:1999 - Target reliabilities .................................................................... 105 Table 5-5 ISO/CD 2394:1998 – Consequences of failure.......................................................... 106 Table 5-6 Eurocode 1:1993 - Target reliabilities ........................................................................... 106 Table 5-7 NKB Report No. 36:1978 - Target reliabilities, ultimate limit state ......................... 106 Table 5-8 JCSS - Target reliabilities, ultimate limit state .............................................................. 107 Table 5-9 CSA - Target reliabilities, ultimate limit state............................................................... 107 Table 5-10 Software tools for reliability analysis............................................................................. 114 Table 6-1 Remedial measures for concrete bridges ...................................................................... 118 Table 6-2 Remedial measures to limit scour, after Melville and Coleman (2000) .................... 123 Table 6-3 Remedial measures for steel substructures .................................................................. 126 Table 6-4 Remedial measures for masonry arch bridges, based on Page (1996)...................... 128 Table 6-5 Remedial measures for timber substructures and bridges ......................................... 131 Table 6-6 Remedial measures for CSBSs ....................................................................................... 133 Table 6-7 Remedial measures for concrete box-type structures and concrete arch
culverts ............................................................................................................................... 135 Table 6-8 Remedial measures for tunnels ...................................................................................... 137 Table 6-9 Remedial measures for earth retaining walls................................................................ 139
COST 345 Final Report
6
Figures
Figure 1-1 Evolution of passenger and goods transport on roads 1970-1998 (European Commission, 2000)...........................................................................................2
Figure 2-1 Asset management cycle....................................................................................................10 Figure 3-1 Relation between ppp/capita and average bridge replacement cost ...........................17 Figure 3-2 Strategic plan for future structures’ maintenance expenditure (Das and
Mičić, 1999) .........................................................................................................................33 Figure 3-3 The effects of different maintenance strategies on costs.............................................36 Figure 4-1 Deformation of a superstructure due to undermining of a pier by scour ................51 Figure 4-2 Deterioration of the construction joint between the roof and side wall of
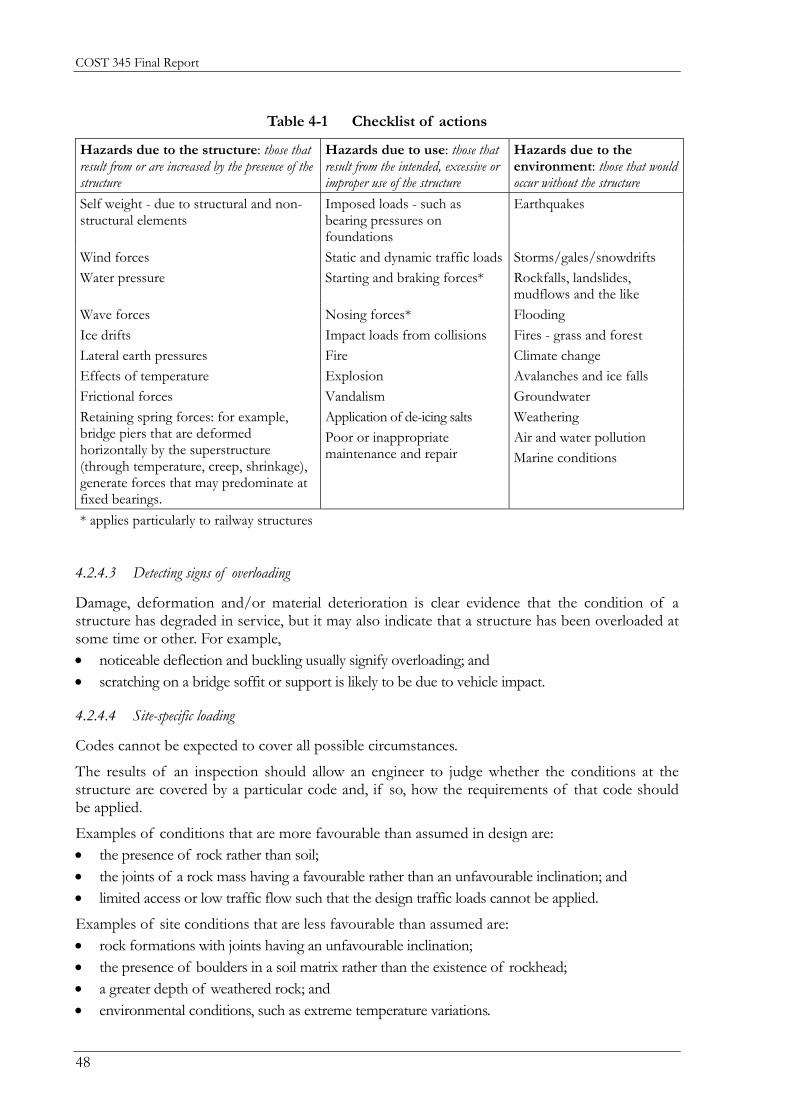
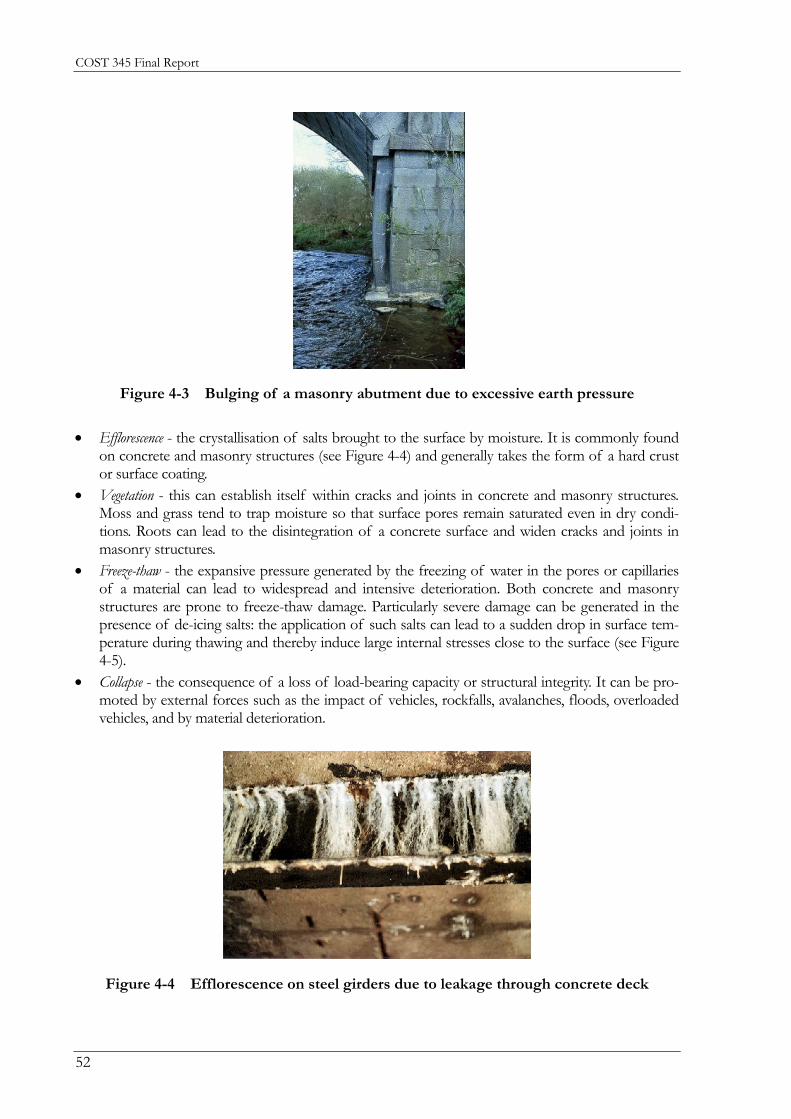
a concrete box structure due to differential movement................................................51 Figure 4-3 Bulging of a masonry abutment due to excessive earth pressure ...............................52 Figure 4-4 Efflorescence on steel girders due to leakage through concrete deck........................52 Figure 4-5 Freeze-thaw damage of a footway aggravated by the action of de-icing
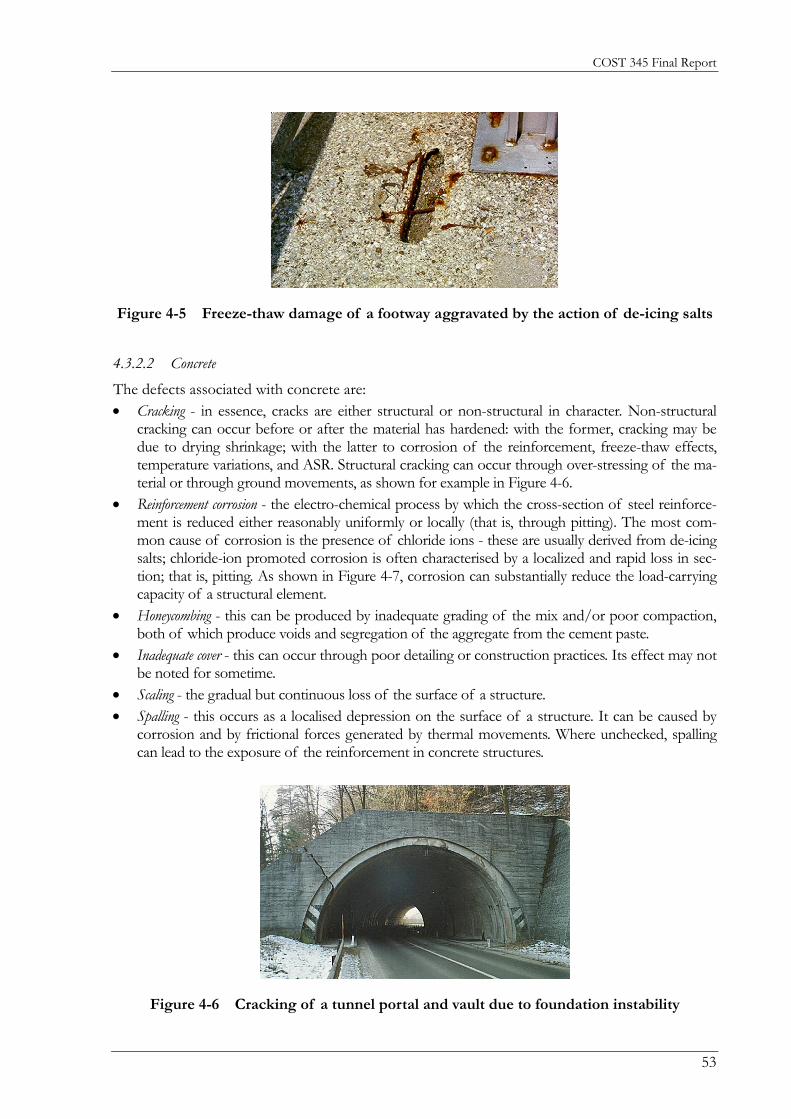
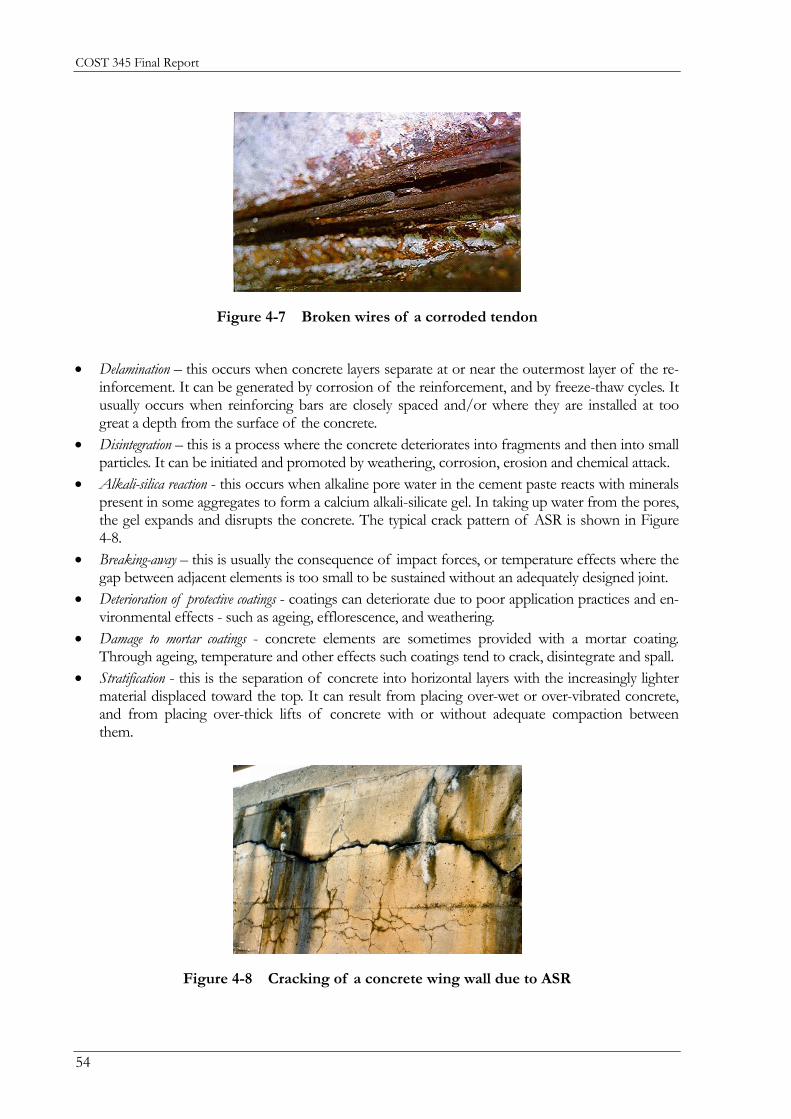
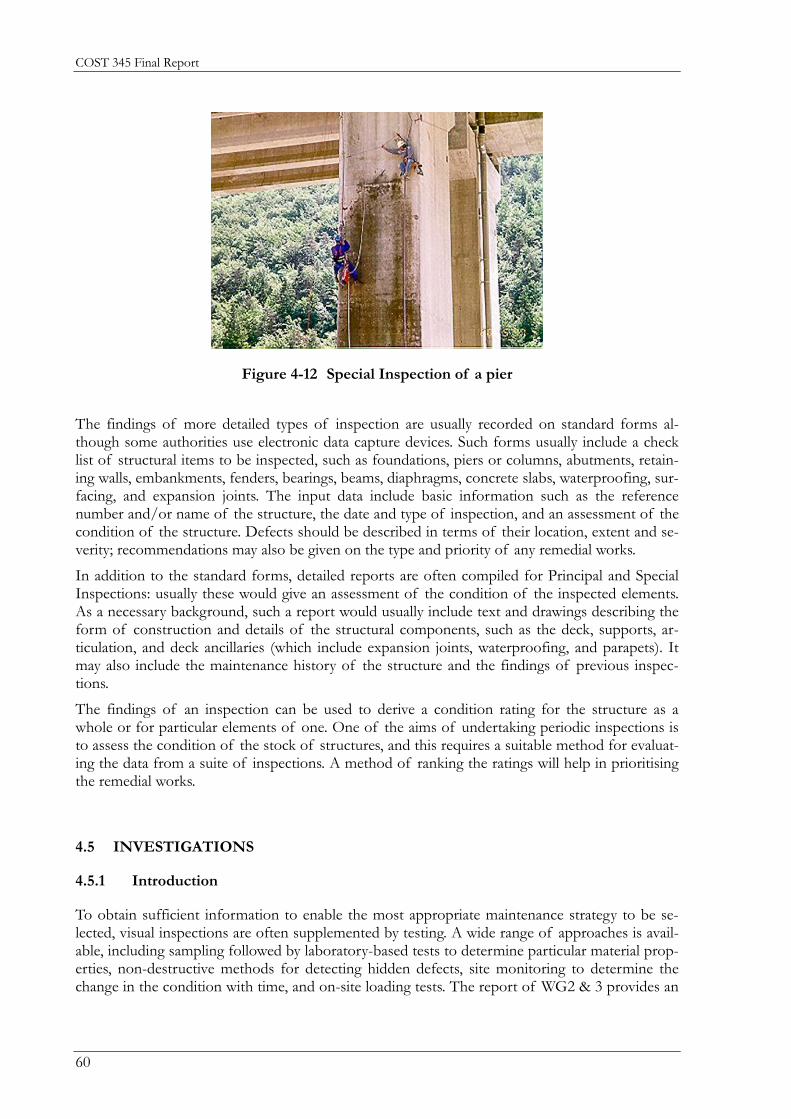
salts .......................................................................................................................................53 Figure 4-6 Cracking of a tunnel portal and vault due to foundation instability...........................53 Figure 4-7 Broken wires of a corroded tendon ................................................................................54 Figure 4-8 Cracking of a concrete wing wall due to ASR ...............................................................54 Figure 4-9 Corroded steel superstructure ..........................................................................................55 Figure 4-10 Cracking of a spandrel wall of a masonry arch bridge .................................................56 Figure 4-11 A bullet hole in a steel structure.......................................................................................57 Figure 4-12 Special Inspection of a pier ..............................................................................................60 Figure 4-13 Flowchart of data obtained from an inspection ............................................................71 Figure 4-14 Condition of a column in 1997 and 2000.......................................................................72 Figure 5-1 Variation of steel yield strength, fy, represented by (a) a probability
distribution function and (b) a cumulative distribution function ................................82 Figure 5-2 Distributions of resistance R, stress S and safety Margin M = R-S......................... 109 Figure 5-3 Two-dimensional probability density functions .......................................................... 110 Figure 5-4 Transformation to the standardised space................................................................... 111
COST 345 Final Report
7
Executive summary Because there has been no substantial effort to develop common standards for the maintenance of highway structures, COST Action 345 was undertaken to describe current European practice on the inspection, assessment, maintenance and repair of the stock of in-service highway struc-tures. Information on the stock of highway structures and current expenditure levels was ob-tained and requirements for future work were defined. A reliable, integrated system of inspection, assessment and maintenance is required to ensure the safety of the public at large, and the effi-cient allocation and expenditure of resources to the upkeep of the stock to avoid unnecessary replacement or strengthening of existing structures with all the attendant costs and traffic delays.
The Action was supported by the European Commission and involved experts from 16 Euro-pean States. The Action covered all types of highway structure and so encompassed bridges, cul-verts, tunnels, and earth retaining structures, but low-value structures, such as street furniture, and very long span bridges were excluded. The programme of work was undertaken by seven Working Groups. Working Group 7 produced this Final Report. The other six Groups produced four Reports that are available on the COST 345 website at www.zag.si/cost345. The main find-ings from COST Action 345 are as follows.
The current stock of highway structures in European countries, the cost of their re-placement and the annual costs of maintaining, repairing and renewing them
In the 27 European countries covered by the Action, it is estimated that there are about l million bridges in, at least 50 thousand kilometres of retaining wall and about 4000 2-lane kilometres of tunnels; the best estimates of the replacement costs of these structures are €400 billion, €79 bil-lion and €110 billion respectively. There are considerable gaps and shortcomings in the informa-tion available for structures on Local and to a lesser extent on Regional roads. Current levels of expenditure on maintenance, repair and renewal, particularly on Local and to a lesser extent on Regional roads are inadequate. Financing of maintenance, repair and renewal needs to be put on a more consistent and sustainable basis if the full benefits of the management systems and tech-niques being developed for sustaining the stock of structures on the highway infrastructure are to be fully realised.
Methods used to inspect and assess the condition of highway structures
The more common types of defect found on highway structures are described. Inspections are undertaken to detect the presence of defects, determine the cause, extent and rate of deteriora-tion, and provide information for assessing stability and serviceability. Particular attention should be given to the integration of the inspection process within bridge management systems, the util-ity of standard report forms, and the identification of factors that pose the greatest risk to the safe use of a structure. It would seem necessary to introduce a certification scheme for inspec-tors. Details of the more commonly used tests that supplement visual inspections are provided. Guidelines on the application and interpretation of NDT methods, and improving NDT equip-ment and the capture and analysis of data from such tests are required. There are different opin-ions on the advantages and limitations of loading tests. Monitoring to help in the assessment of the stability and serviceability of a structure should be undertaken as a matter of routine. Long-term studies are required to track the initiation and propagation of defects and deterioration processes.
Condition assessments are undertaken to identify deterioration processes, rate the condition of a structure and/or its components or elements, and provide information for establishing the condi-tion of the stock of structures. The derivation of a condition rating for a bridge requires a large
COST 345 Final Report
8
measure of engineering judgement. To help rationalise such judgement, further work is required to investigate the potential of mathematical methods based on, for example, probability, neural networks and fuzzy logic. The condition rating does not provide a direct measure of the level of safety or, therefore, the priority for remedial measures, so methods to develop an adequacy rating or priority ranking for structures should be reviewed. Assessment procedures should be devel-oped for all types of major highway structures, not just bridges. Databases should be suitably structured to allow the input, retrieval and interrogation of the information obtained from in-spections, tests, monitoring works, assessments and remedial works. There would seem to be benefit in establishing a register or log for each highway structure.
Numerical techniques for safety and serviceability assessment
Five levels of assessment are recommended to identify which structures are at an unacceptably high level of risk so appropriate remedial measures can be taken. They range from the simple but conservative to the complex but accurate. Engineers must deal with uncertainty due to inherent variability, imperfect modelling and estimation error. An integrated approach to traffic loading, structural condition and structural response is described that can remove much of the uncer-tainty that existed during the design phase. Load modelling based on traffic weight statistics can be used where structures are not subjected to the full design levels of loading. The concepts of static and dynamic traffic load simulation, taking into account time invariant and variant loads, load combinations and extreme values are discussed. Probabilistic methods can be used to take account of uncertainties associated with material properties, with allowance for the difference be-tween test values and in-situ material properties. Proposed mathematical and probabilistic models for concrete and reinforcing steel are summarised.
Structural analysis methods for different bridges, culverts, tunnels, earth-retaining walls and rein-forced soil are recommended for the five levels of assessment recommended. Target reliabilities indices are presented to help decide an acceptable probability of failure, and different methods for determining the reliability are summarised. First or Second Order Reliability Methods give good results in most cases.
Remedial measures for highway structures.
Preventative measures to control, arrest or prevent further deterioration, and repairs to restore the condition of deteriorated components and elements are summarised. Possible remedial measures for concrete bridges and structures, steel structures, masonry arch bridges, timber bridges, culverts, tunnels and retaining walls are tabulated.
When selecting remedial measures for a particular structure, both the cause and effect of any de-fect or deterioration should be considered so appropriately targeted remedial measures can be executed. Most material deterioration mechanisms that affect highway structures are primarily due to the effects of water. Deterioration can be prevented or limited by reducing the aggressive-ness of the environment, by protecting the structure from the environment or by using durable materials. It is normally appropriate to use preventative measures to prevent deterioration and avoid the need for costly repairs in the future.
Case histories and other detailed information on remedial measures should be collated and ana-lysed in order to identify poor details and practices, and the possible range of service lives of re-medial measures. Guidance should be prepared to help engineers select the most cost-effective measure for a particular application and, for when funding is limited, how to prioritise mainte-nance.
COST 345 Final Report
1
Chapter 1 Introduction
The highway network is currently the most important part of the land transport infrastructure in the EU, and the proper upkeep of the stock of structures on the network is crucial to its efficient operation. Whilst considerable effort has in recent decades been put into the development of new standards and codes for the design of new structures, comparatively little has been done on the development of guidance documents covering the assessment of existing structures. This European Commission Action aims to redress that imbalance.
The main objective of COST Action 345 was to define the procedures required for the assess-ment of the stock of in-service highway structures. Note that the term ‘procedures’ in the title covers (a) physical methods, such as visual examination and testing, (b) methods of analysis, both qualitative and quantitative, and (c) construction practices for maintenance and refurbishment. These cover more or less, respectively, inspection, assessment and remedial measures.
The secondary objectives of the Action were to: • collect information on the stock of highway structures and current expenditure levels; • identify the types of structure, such as masonry arch bridges, that are not amenable to simple
inspection, analysis or repair; and • to define the requirements for future research work into the inspection and assessment of
highway structures.
As with all COST Actions, the work was controlled by a Management Committee and progressed through Working Groups. In all seven Working Groups were established and these produced a series of reports of direct use to practising engineers involved with the upkeep of highway struc-tures (COST, 2004a, b, c and d).
This report describes the background to the work and provides a summary of the work under-taken within the various Working Groups, along with their findings. A number of recommenda-tions were made by the various Working Groups and, for ease of reference, a consolidated list of all the recommendations arising from COST Action 345 is given in Chapter 7 of this report.
1.1 THE EUROPEAN HIGHWAY NETWORK
The movement of people and goods has a pivotal role in the development of any society. The importance of transportation was recognised in the Treaty of Rome by the provision for a com-mon transport policy across the EU.
At present within the EU, the annual expenditure within the transport industry is around €1000 Billion, or more than 10% of the Gross Domestic Product (GDP), and the industry employs more than 10 Million people (EC, 2001).
The highway network is currently the most important part of the land transport infrastructure in the EU. In 1998, some 92.7% of passenger-kilometres travelled and 73.7% of the tonne-kilometres of goods traffic were by road (EC, 2000). And while the proportion of passenger travel by road has remained relatively static over the years, the proportion of goods traffic has in-creased dramatically from 47.9% since 1970. In absolute terms, in 1998 passenger travel and goods traffic were, respectively, 2.2 and 3 times their 1970 levels: see Figure 1-1. Despite growing problems of congestion and pollution, the passenger and goods traffic carried by roads are pre-
COST 345 Final Report
2
dicted to increase further over the next decade or so. Thus the highway network is, and will re-main for the foreseeable future, a crucial economic and social artery of Europe.
There is a high social price to pay for the use of this extensive road network. In 2000, it was es-timated that in the EU more than 40,000 people were killed in road accidents and more than 1.7 Million were injured (EC, 2001). This annual death toll is equivalent to the population of a small town the size of Auxerre, Canterbury, or Waterford and the total number of people injured is equivalent to the population of urban areas the size of Leeds, Marseilles or Valencia. The total annual cost of traffic accidents (including direct and indirect costs) was put at more than €160 Billion, or about 2% of GDP. Only a very small number of accidents is due in any way to short-comings in the performance of the stock of highway structures, such as bridges, retaining walls and tunnels. There is, however, no room for complacency, and considerable sums are spent each year on the upkeep of the stock to ensure that this remains the case.
Highway networks are hierarchical. Their classification varies from State to State across Europe, as does the proportion of roads within each class. Nonetheless, the primary or National routes might represent about 5% of the total road length but carry about half the total tonne-kilometres of goods traffic. This backbone of routes is interconnected by a network of secondary or Re-gional roads that also links them to the tertiary or Local road network. The tertiary road network makes up about 75-85% of the road network. Its importance should not be underestimated: in most cases it provides both the initial and final means of access.
The value of the road infrastructure across Europe is immense and almost defies quantification. For example, in the UK, the strategic road network is valued at around €100 Billion and is the single largest Government asset (HM Treasury, 2001). (The ‘strategic’ network represents less than 5% of the total road network in the UK.).
0
500
1000
1500
2000
2500
3000
3500
4000
4500
1970 1974 1978 1982 1986 1990 1994 1998
Year
Pass
enge
r tr
ansp
ort (
billi
on p
km)
0
200
400
600
800
1000
1200
1400
Goo
ds tr
ansp
ort (
billi
on tk
m)
Passenger transport
Goods transport
Figure 1-1 Evolution of passenger and goods transport on roads 1970-1998 (European Commission, 2000)
COST 345 Final Report
3
1.2 HIGHWAY STRUCTURES
1.2.1 Their part in the road network
Bridges, retaining walls, tunnels and other buried structures make up a substantial proportion of the fixed assets of a highway infrastructure. The stock of highway structures in Europe has been increasing over the years: some in-service structures predate the 20th century - indeed some ma-sonry arch bridges date back to Roman times. Most of the older structures are of historic and ar-chitectural importance. A conservative estimate of the replacement cost of this stock is €600 Bil-lion, and perhaps €2 to 3 Billion is spent annually on its upkeep.
Highways structures are a vital element of the road network. The closure of a bridge or tunnel severs the highway on which it is located. Failure of a retaining wall is often less dramatic but traffic is impeded and the public is put at some risk. The consequences of such incidents are re-lated to the location of the unserviceable structure. For National Roads, the resulting detours may have severe economic and political consequences as shown, for example, with the fires in the Mont Blanc and St Gotthard Tunnels (Bettelini, 2002; Tunnels and Tunnelling International, 2001). On the other hand the closure of a lightly trafficked local road inconveniencing at most a few hundred travellers will have little impact either economically or politically, and, provided such incidents are not too numerous, they can be overlooked at a national or even a regional level.
More commonly, defective structures on the highway result in the imposition of weight and/or speed restrictions and/or lane closures. Again the repercussions are greatest on National Roads and least on Local Roads where, being less dramatic, their impact on the general public is reduced as is their political impact. However their economic consequences can still be serious with heavy goods vehicles often being forced to make considerable detours and in some cases being completely excluded from some areas.
1.2.2 Assessment procedures for highway structures
The proper upkeep of the stock of highway structures is crucial to the smooth running of a highway network. For this, it is necessary to have effective and properly documented methods for inspecting and assessing their condition, and proven, economic repair techniques. As would be expected, national highway authorities across Europe have developed and issued their own documentation covering: • inspection methods, particularly non-destructive techniques; • test procedures, such as determining site-specific traffic loads; • numerical analysis, such as the use of probability/reliability methods to define safety; and • bridge assessment.
However, to date there has been no substantial effort to develop common standards for the maintenance of highway structures. This is in sharp contrast to the concerted effort that has been put into the development of new standards and codes, such as CEN Eurocodes, covering the design of new structures and earthworks, even though in many States: • the annual expenditure on maintenance is higher than on new construction - this situation
will become more prevalent as infrastructure accumulates; and • the annual expenditure on the construction of new highway infrastructure is a small percent-
age of the value of that already in place.
COST 345 Final Report
4
1.2.3 Why assessment procedures are required
In the absence of procedures for the assessment of in-service highway structures, serviceability and stability will, quite naturally, tend to be determined according to the design rules for new structures. However, the level of conservatism or safety appropriate for the design of a new structure is higher than that required of an in-service structure. Furthermore, few of the existing stock of structures will have been designed to the current design requirements. It might be diffi-cult to identify the version of the standard or code used to design a particular structure, and in many cases the design process would have invoked a quite different approach to that promul-gated in current design documents. Many bridges would not have been designed to withstand current traffic loading, indeed some will pre-date the first national design document. In addition, accurate as-built records do not exist for many structures: problems of documentation could be expected to increase with the age of a structure. Perhaps not surprisingly, therefore, despite many years of maintenance-free operation, the inher-ent level of safety of many in-service structures can be shown to be inadequate relative to cur-rent design documents. It will be appreciated that it is simply not feasible to close or demolish structures that do not comply with current design criteria even if the resources were readily available: and they are not - the cost of replacing the existing stock would be about 6% of GDP. However, in the absence of adequate documentation covering the inspection and assessment of highway structures, there will be a tendency to assess stability using current design documents, and such assessments are likely to underestimate the inherent stability of a wide range of structures. In some cases, this will lead to the unnecessary replacement or strengthening of existing structures with all the attendant costs, particularly those associated with traffic delays. On the other hand, a reliable system of in-spection, assessment and maintenance is required to ensure the safety of the public at large.
The age (longevity), condition and the likelihood of failure of a structure are intuitively related. What is needed, therefore, is a system of assessment within which longevity and condition are qualitatively or quantitatively balanced against the factors of safety specified in current design standards. Information will often be limited, and at times even lacking, but the inspection regime and assessment process must provide a sensible procedure which enables the existing structures which have performed adequately over the years to continue to do so in the future.
In-service assessments are most needed in times of change to determine whether the stock of structures is adequate for the new situation. A good example is the introduction of 40 tonne lor-ries across the EU. For example, in the UK structures which had sustained the current traffic loads since the previous increase in 1983 had to be re-evaluated, and either passed as fit to carry the higher loads, or strengthened appropriately. Also, new construction forms and materials might be promoted because of savings in initial costs, but requirements for inspection, assess-ment and maintenance can be overlooked or underestimated: in any case problems of durability might only become apparent in service.
Assessments are also required on a routine basis as part of a coherent operation and maintenance programme. This should apply to a complete highway network and transcend local boundaries and responsibilities, or even national ones when applied to the Trans-European Road Network, for example. Evaluation can be a particularly difficult process with some types of structure, for example masonry arch bridges and dry-stone retaining walls where current theory suggests that many of them do not have a sufficiently high factor of safety but experience shows that they are perfectly adequate. It will be appreciated that in-service conditions might change with time. For example, traffic loads on many bridges have increased over the years in line with the growth of heavy goods traffic and the size, gross weight and axle loads of the vehicles. Thus the rate of
COST 345 Final Report
5
‘structural’ ageing of the stock of bridges has increased with time, and is likely to continue to do so. This should be borne in mind when assessing or predicting the rate of deterioration of the bridge stock: it has particular implications for structural features prone to fatigue.
1.2.4 The challenge to owners and operators
Owners, highway authorities and their agents operate in a world where: • public safety is paramount, and emphasis is given to the rare but spectacular disaster; • there is competition for funds – for example, for new build and maintenance works; • there is a continual stream of regulations governing health and safety, and construction prac-
tices; • it is necessary to show that stakeholders are provided with a level of service commensurate
with their investment; and • there is political pressure and public demand to:
address the problem of congestion, stimulate the economy by, for example, reducing travel costs, improve the quality of life by, for example, reducing accidents and increasing access to
improve social cohesion, adopt a sustainable approach to operations, minimise the construction of new roads, and reduce the impact of traffic on the environment.
All the above demand the maximum usage of the current highway network and affect the way that the growth and maintenance of a network is funded. Highway authorities require a range of tools for managing their business to meet the above constraints and challenges.
In the optimistic environment that inevitably surrounds the development of new construction forms, techniques and materials, the needs of inspection, assessment and maintenance can be undervalued. Often the motivation for development springs from the savings to be had in con-struction costs and so long-term expenditure is not a priority. No matter what research precedes the introduction of a novel method or material, its proving ground is in-service behaviour, as only here will problems of durability become apparent.
There can be and often is a fundamental dichotomy between the short-termism of political institutions and the long-term requirements of a highway network. Although they cover a much broader field than the maintenance of highway structures in Europe, the following quotations from the World Bank (1994) are not out of keeping here: • ‘Inadequate maintenance has been an almost universal (and costly) failure of infrastructure
providers in developing countries’; • ‘The rates of return from World Bank-assisted road maintenance projects are nearly twice
those for road construction projects’; • ‘Failings in maintenance are often compounded by ill-advised spending cuts. Curbing capital
spending is justified during periods of budgetary austerity but reducing maintenance spend-ing is false economy’.
Some of the reasons why maintenance is not appreciated include, in terms of professions, the following: • For politicians, maintenance is not concerned with the grandiose and usually is only news-
worthy when problems occur;
COST 345 Final Report
6
• For economists, it is a never-ending drain on resources and does not seem to be planned or costed particularly well;
• For administrators, it is a piecemeal chore that can be labour intensive and require the han-dling of prodigious amounts of data;
• For engineers, it is often not deemed to be intellectually challenging or prestigious.
The increasing realisation that material and financial resources are finite and limited is encouraging greater emphasis on the conservation of the existing stock of highway structures in a serviceable condition. The owners and operators of a highway network are legally responsible for its safety and owe a duty of care to the public. By following a formalised and documented system of inspection, assessment and maintenance, highway authorities and their agents will be able to show that they have taken due care, and owners will be assured that their fixed assets, i.e. the highway infrastructure, are being protected.
The processes of registration, inspection, assessment, and remediation form the skeleton of an asset management system. It is vital to consider the flow through the sequence of processes as well as the processes themselves: the course of action through time is driven by an assessment of risk. Further information on asset management is given in Annex I, and a number of recommen-dations on the development and use of such systems is given in Chapter 7.
COST 345 Final Report
7
Chapter 2 Details of COST 345
2.1 SCOPE
It was against the backdrop of the foregoing that COST Action 345 was undertaken with its main objective being to define the procedures required for the assessment of the stock of in-service highway structures.
The Action covered all types of highway structure and so encompassed bridges, buried structures (such as culverts and tunnels), and earth retaining structures, but low-value structures with a re-placement value less than €25,000, such as street furniture, were not included, nor were excep-tional high value structures such as very long span bridges. Structures on all classes of road were considered, but it was accepted from the outset that information might not be readily available for structures on the lower classes of road. To limit the programme to manageable levels, earth-works and rail infrastructure were not covered.
COST was seen as the most appropriate mechanism for dealing with this subject because it is es-sential to have agreement between the technical representatives of national governments. It is also highly desirable that there is input from, and to, those COST States which are not yet a part of the European Union.
A European-wide project allowed an exchange of information and, in particular, advertised the experience and expertise of those States which have a well developed, mature highway network and, in that way, promoted sound engineering practices. It provided continuity and allowed re-gional variations such as climate and environment to be considered and, by drawing from the ex-pertise of the various States, maximised the value of the project to Europe as a whole.
The end-users of the results of this Action include International, National and Local Govern-ment highway organisations and agencies, construction companies and the technical and scientific community. At International and National levels, the data collected as part of this study could in-fluence matters of policy regarding safety and the administration and operation of highways. Such data will also be of interest to different parts of these institutions for decision-making in the areas of transport policy, legislation, research and development.
2.2 BENEFITS
There are a number of benefits arising from this Action, and although many are difficult to quan-tify financially and/or politically they will help satisfy the stated business aims of most national and local highway authorities and operators.
The outcome of the Action might promote the development of European-wide standards cover-ing the maintenance of highway structures. The development and application of reliable inspec-tion, assessment and maintenance procedures for the European highway network could ensure the continued high performance of the network and, potentially, could save billions of Euros in construction, maintenance and traffic delay costs. The development and acceptance, throughout Europe, of such procedures and standards would also give rise to tangible and intangible benefits to highway users, maintaining authorities and owners.
COST 345 Final Report
8
The provision of information on inspection, assessment and repair methods may improve the ef-ficiency of such operations, provide more reliable predictions of performance and expenditure, and assist in the timing, planning and execution of inspection and repair work. Given the sub-stantial expenditure on the upkeep of the highway network across Europe, even a small percent-age saving in expenditure would represent a considerable sum.
This Action might lead to changes to current practices in some countries, which would provide immediate cost savings, and generate innovations in others through follow-up work. For example, preliminary studies of the stock of masonry faced earth retaining walls along the highway network in the UK have shown that an annual expenditure of less than 1% of their replacement cost is needed to keep the stock of such walls in satisfactory condition. The economic benefits for such a small sum are considerable; not only are the structures preserved in good condition but the costs of replacement works and the very much greater traffic delay costs associated with such works are avoided.
At a regional or local level, engineers charged with the upkeep of a section of highway infrastruc-ture will benefit from the availability of information on methods of inspection, assessment and analysis. These could improve the efficiency of operations, provide more reliable predictions of expenditure, and assist in the planning and execution of inspection and maintenance works. Such information will also be of benefit to road operators and contractors concerned with mainte-nance works.
Sustainability becomes an ever more pressing consideration with the realisation that our material and financial resources are finite and limited. Although some further development of the high-way system is undoubtedly required the more pressing consideration in many countries is fast be-coming the conservation of the existing highway infrastructure in good condition. This unfortu-nately is a mundane and routine task which may well be overlooked in the short term by authori-ties with apparently more important problems on their hands. However curtailment of mainte-nance expenditure on the highway infrastructure wastes money since it almost invariably results in some structural damage which is more expensive to rectify in the long term. The outputs from this Action will help to ensure that such oversights are less likely in the future and provide a sounder basis for highway authorities to develop a systematic long term policy for the mainte-nance of the existing stock of structures on the road system.
2.3 ORGANISATION
In all, some 16 countries - Austria, Belgium, the Czech Republic, Denmark, France, Germany, Ireland, Italy, the Netherlands, Poland, Romania, Slovenia, Spain, Sweden, Switzerland and the United Kingdom - signed the Memorandum of Understanding (MoU) for the Action. This pro-vided a strong basis of technical expertise and geographical spread which should ensure very high quality results. As with all COST Actions, the work was controlled by a Management Com-mittee (MC) and progressed through Working Groups (WG). In all seven WG were established, details of the membership are given in the various WG reports.
WG1 (Inventory) undertook a data gathering exercise to investigate: • the length of the highway networks across Europe; • the number of highway structures; • the current expenditure on maintenance and repair; and • the methods used to finance the operation of highway networks.
WG2 (Inspection) assembled information on:
COST 345 Final Report
9
• the requirements for and the frequency of inspections; • the methods used to inspect structures; • the collection and collation of data from inspections; and • the load testing of structures.
WG3 (Condition assessment) examined various rating systems that are used to provide a ‘condi-tion assessment’ of a highway structure.
WG4 (Numerical techniques) considered: • the use of numerical techniques for quantifying the in-service condition of a highway struc-
ture; and • modelling methods, for traffic loading for example.
WG5 (Safety and serviceability) examined: • the philosophy used to define structural safety; • acceptable levels of safety; • methods of defining the safe load capacity of structures; and • the setting of serviceability limits for various types of structure.
WG6 (Remedial measures) considered the very broad field of repairing structures and therefore a rather selective approach had to be adopted.
The position and interaction of the WGs within the framework of an asset management system are shown in Figure 2-1.
The brief of WG7 (Reportage) was to: • ensure the completion of the various WG reports; • complete the final report; and • promote the findings of the project through publication and through workshops and semi-
nars.
The WGs have produced a series of reports of direct use to practising engineers involved with the upkeep of highway structures. Because of the overlap of interest between WG2 and 3, and between WG4 and 5, these WGs produced combined reports.
2.4 TIMETABLE
Cost Action 345 commenced in April 1999 and was due for completion some three years later. However, at an early stage the programme of work was extended, at the behest of the COST Se-cretariat, to cover how the level of safety of highway structures could be defined. This provided a more rounded project but increased the workload. In recognition of this, and other issues that delayed progress, the Action was extended to the end of 2003.
At European level, the work of the CEN Committee dealing with Eurocode 1 (Basis of Design and Actions on Structures) was taken into account in the work. Consideration was also given to interaction with initiatives at a global level such as those of the Permanent International Association of Road Congresses (PIARC). The Action also incorporated relevant information obtained from the Framework IV Transport RTD project BRIME (2002), which was concerned with the evaluation of bridge management procedures.
COST 345 Final Report
10
INVENTORY [WG1]
INSPECTION [WG2]
CONDITIONASSESSMENT/RATING [WG3]
NUMERICAL ASSESSMENT [WG4]
SAFETY AND SERVICEABILITY [WG5]
REMEDIAL MEASURES [WG6]
RENEWAL REPAIR ANDPERHAPS
IMPROVEMENTWORKS
ROUTINEMAINTENANCE
ASSETMANAGEMENT
NEW WORKSDESIGN PROCEDURES
Figure 2-1 Asset management cycle
COST 345 Final Report
11
Chapter 3 Summary of WG1 Report on Inventory
3.1 BACKGROUND
A prerequisite to the development of sustainable and economical maintenance regimes is detailed information on the number of the different types of structure, including their location on the highway network, as well as an assured source of consistent annual funding.
To obtain information on the magnitude of the task involved in developing such maintenance regimes for highway structures, Working Group 1 was to collect, analyse and report on information from COST countries on the extent, magnitude and value of the structures on their highway infrastructure in order to provide reliable estimates of: • the current stock of highway structures, • the cost of replacing these structures, • the annual cost of maintaining, repairing and renewing this stock of structures.
Data were collected by means of a questionnaire, supplemented with information and clarification obtained by direct contact with relevant authorities in the participating States.
The WG 1 report (COST, 2004a) summarises and analyses the data received, and considers the limitations of these data as well as the shortcomings of current maintenance regimes for all categories of road. Extrapolation of the results is undertaken to provide an estimate of the resources required to maintain the existing stock of structures on the road system across Europe. Finally, the steps required to develop and finance a comprehensive regime for the maintenance, repair and renewal of the stock of highway structures on much of the European road system are considered.
Within the report the following shorthand is used to refer to groupings of countries. EU15: Austria, Belgium, Denmark, Finland, France, Germany, Greece, Ireland, Italy,
Luxembourg, the Netherlands, Portugal, Spain, Sweden and the United Kingdom. Europe 25: The countries in EU15 plus Bulgaria, the Czech Republic, Estonia, Hungary,
Latvia, Lithuania, Poland, Romania, the Slovak Republic and Slovenia. Europe 27: The countries in Europe 25 plus Norway and Switzerland.
3.2 THE INFORMATION
A structure was taken to be an individual construction on the road system such as a bridge, culvert, retaining wall, or tunnel. The replacement cost of a structure was defined as the cost of rebuilding the whole structure without either changing or improving its function and purpose, or enhancing it in any way or increasing its capacity.
Because an important objective of the exercise was to determine the long-run annual expenditures required to keep the existing stock of highway structures intact and in serviceable condition, information was requested on the current expenditure on maintenance, repair and
COST 345 Final Report
12
renewal1 for the various types of highway structure. For example maintenance of a steel suspension bridge would include repainting, damage to parapets would be repaired, while the replacement of corroded hangers and cables would constitute renewal. In the extreme, the rebuilding of a completely defective structure is a wholly replacement expenditure unless the opportunity has been taken during that event to enhance the capacity of the facility in which case apportionment of funding between the cost of renewal and new works would be appropriate.
The thirteen countries listed in Table 3-1 replied to the questionnaire. These countries have some 4.03 million kilometres of road and a population of about 328 million (EC, 2000); the corresponding approximate figures for the eight EU countries in the list are 3.3 million kilometres of road and 265 million people. The data contained in these replies are summarised in Table 3-1 to Table 3-11 and discussed below.
Information on the road network was broken down into three categories as follows:
1 The expression ‘maintenance, repair and renewal’ used in this report embraces the activities
‘rehabilitation, periodic maintenance and routine maintenance’ used in OECD (1994). It is, therefore, a catch all term to encompass all the expenditures used to keep the existing stock of structures in a satisfactory condition.
COST 345 Final Report
13
(a) National Roads.
These are primary roads of the highest commercial and strategic importance usually maintained by the National Road Authority but inter-urban toll roads are also included.
(b) Regional Roads.
Although not of national importance these secondary roads are major traffic routes carrying heavy traffic within the local region; many heavily trafficked urban streets fall into this category.
(c) Local Roads.
All roads anywhere in the country that are not in (a) and (b) above. These tertiary or local roads comprise about 75-85% of the road network.
3.2.2 Bridges
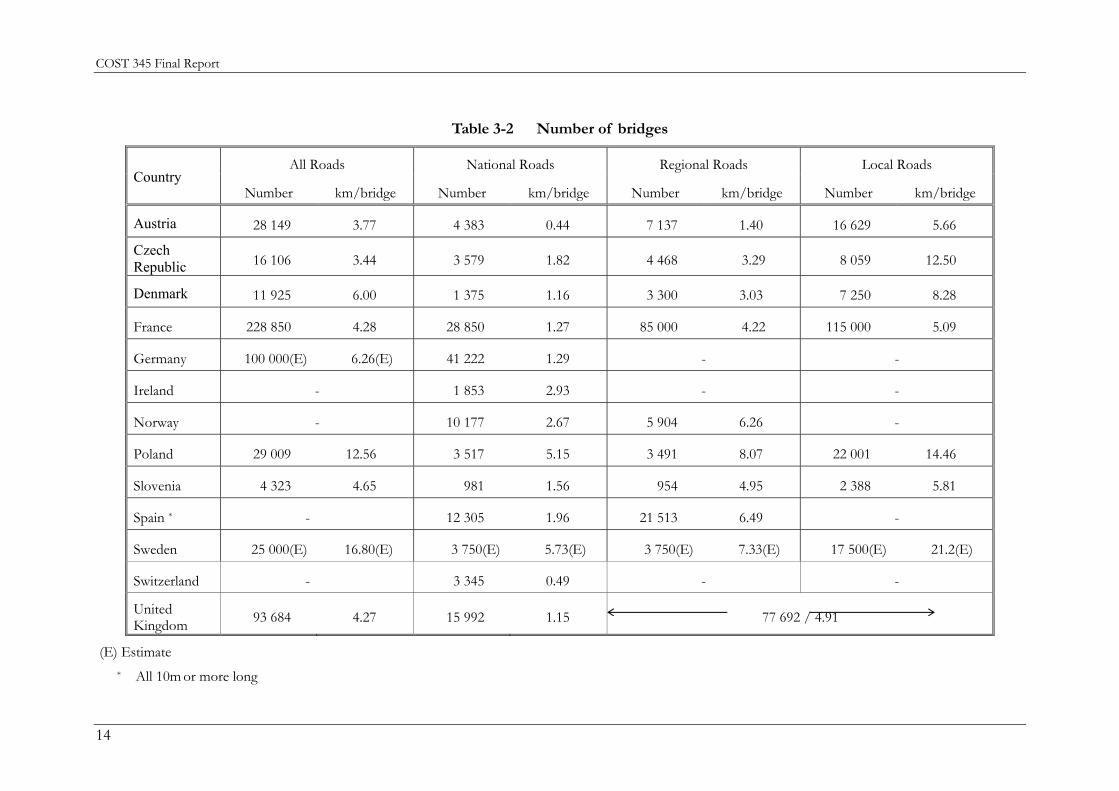
For the purposes of the questionnaire, a bridge was defined as a structure with a minimum length or span of 2m. All respondent countries were able to provide information on the number of bridges on the National Roads but information was not always available for Local Roads. The information supplied is summarised in Table 3-2 to Table 3-5.
3.2.2.1 Frequency of bridges Complete information for the number of bridges on the whole road network was received from eight countries (see Table 3-2): in all there are 437046 bridges on 2483771km of highway giving an average of 1 bridge every 5.68km. The number of bridges per head of population in these countries is 1 bridge per 437 persons.
3.2.2.2 Bridge superstructure
Information was received from 10 countries2 on the type of superstructure and the material in the superstructure. Again more complete information is available for National and Regional Roads than for Local Roads. Reinforced concrete in slab and beam-and-slab bridges are the most common material and types of construction; in France, Ireland, Spain and the UK 30% or more of bridges are arches and by inference most of these are constructed of masonry. Steel and composite structures combined comprise more than 20% of the bridge stock in three countries, with five countries having 10% or less. Suspension and cable-stayed bridges are rare.
3.2.3 The age of bridges
Ten countries provided information on the age of their bridge stock. In only three countries was more than 8% of the bridge stock in existence pre-1900: this seems a very low proportion. On the other hand 48% or more of bridges are said to have been constructed from 1970 to date in Austria, Denmark and Sweden. It may well be that this is so on National and Regional Roads but it is difficult to conceive that this can be true for Local Roads; in simple terms it means that over half or more of the bridge stock on the whole road network has been constructed during the last 31 years.
2 From here on, countries which did not provide information on any particular matter have not been
included in the Tables.
COST 345 Final Report
14
Table 3-2 Number of bridges
All Roads National Roads Regional Roads Local Roads Country
Number km/bridge Number km/bridge Number km/bridge Number km/bridge
Data under this heading were provided by ten countries. With the exception of Spain, where a bridge was by definition 10m or more long3, a high proportion of bridges were less than 10m long; only a few per cent of bridges were longer than 100m. On average 62% of spans were shorter than 10m while 4.6% were greater than 50m.
3.2.5 Replacement cost of bridges
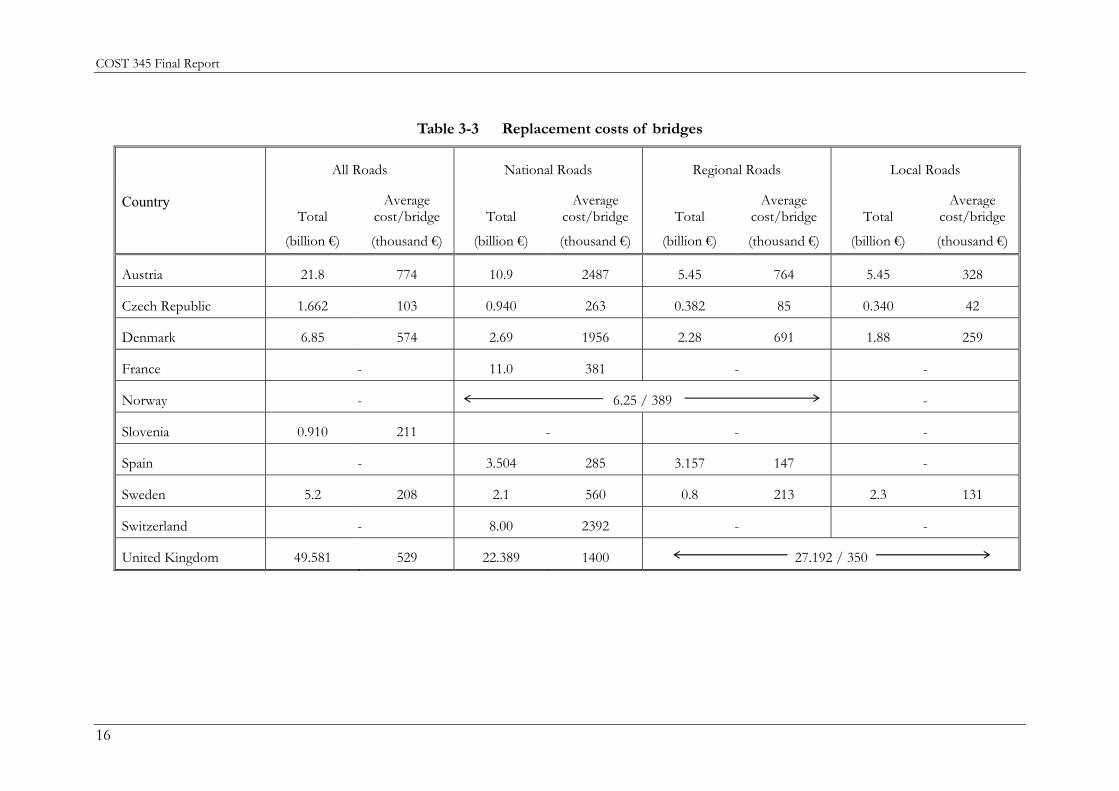
Information was received from ten countries on the replacement cost of bridges (see Table 3-3); six countries provided figures for all roads, the remainder related to either National or National and Regional Roads only.
Replacement cost was chosen as a straightforward measure of the present ‘value’ of the structures on the road network. This varies with time as the cost of construction works generally increase over time (occasionally it can decrease in an economic depression). Replacement cost is a measure of the resources that would need to be applied to rebuild the structure but does not include any amount for the value of the land on which the structure stands since this is already in the ownership of the road authority. A ‘replacement value’ approach was adopted in determining the asset value of the road infrastructure in OECD (1994).
The total of the bridge replacement costs for all roads in the five countries providing this information and listed in Table 3-3 is €86 billion and their population is about 92 million. More striking perhaps is the wide difference in the average replacement cost per bridge in the various countries which range from €103k in the Czech Republic to €774k in Austria. These data have been plotted in Figure 3-1 and there appears to be some relation between the national GDP (PPP)/capita [Gross Domestic Product (Purchasing Power Parities)/capita] (see EC, 2000) and the average cost of bridge replacement. It may be noted too, before leaving Table 3-3, that the average replacement cost in these six countries also decreases with reducing road importance as would be expected reflecting the likelihood of larger and more impressive bridges on National and Regional Roads.
It is difficult to reconcile the data provided in Table 3-4 on the unit cost, €/m2, of replacing bridges with average replacement costs in Table 3-3 and the relation shown in Figure 3-1. The range is somewhat reduced with the lowest costs in Spain being 16-27% of UK figures, which were the highest, and somewhat greater than those for Denmark. Surprisingly unit replacement costs in the Czech Republic and Slovenia overlapped those in Sweden although the upper value in that country was approaching the lower end of the Danish figures. There is obviously something anomalous here and the reasons for this are unclear.
Information from the USA which put the replacement cost of their 600000 bridges at $300 billion or $500k (currently (July 2002) €500k approximately)4 each would suggest that the higher figures in Table 3-3 are of the correct order of magnitude (Briaud and Gibbens, 1999)5.
3 In Spain, bridges less than 10m long are classed as culverts.
4 Since its introduction the value of the Euro has varied between €1 and 1.2 to the US$.
5 Chase (1998) states that there are “more than 581000 highway bridges greater than six metres in length on the public road network in the USA”.
COST 345 Final Report
16
Table 3-3 Replacement costs of bridges
All Roads National Roads Regional Roads Local Roads
This heading embraces the costs of maintenance, repair and renewal of the bridge stock as well as its management and the cost of regular inspection of bridges. Data was received on these top-ics from ten countries and these are summarised in Table 3-5.
Apart from Slovenia, Sweden, Switzerland and the higher UK figure the annual running costs of the bridge stock do not include renewal costs which are usually part of the capital or invest-ment budgets. As such they are at the mercy of political exigency and structures where the more economic solution is replacement may have to be patched-up year in year out from funds de-voted to maintenance and repair. The evolution of the financial arrangements for bridge mainte-nance in Sweden is why the percentage of replacement cost expended under the heading mainte-nance, repair and renewal is on the high side for Sweden in Table 3-5. It is of interest to see from the footnotes to the Table that the percentage of replacement cost expended annually by authori-ties responsible for bridges on National Roads can be much higher than that devoted to Regional and Local Roads.
Table 3-5 Running costs of bridges
Maintenance, repair and renewal Management Inspection Country
Total (million €)
Percentage of replacement cost
(million €)
(million €)
Austria 80* 0.4* 0.53
Czech Republic - 0.04* 4.2 0.06
Denmark 40* 0.6* + 4 1
France 81 - 12** 9**
Norway *** 23* 0.46* 3 2
Slovenia 24 2.6 - 0.18***
Spain *** 20.88* 0.3* 0.81 1.34
Sweden **** 73 1.4 2 2
Switzerland ** 78.8 0.98 - -
United Kingdom - 0.3 - 1.1***** - -
* Renewal not included ** National bridges only *** National and Regional bridges only **** SNRA figures only ***** Higher percentage contains renewal cost + 1% National, 0.3% Regional and Local roads
COST 345 Final Report
20
3.2.7 Culverts
In the questionnaire a culvert was defined as a drainage structure with a minimum span of 2m and a maximum span of 10m. Many of the respondents did not recognise this nomenclature and in their records included these types of structures under bridges.
Of the three countries that supplied information on culverts, Ireland and Slovenia may have classified some culverts as bridges since the minimum span is 2m for both classifications, and in Spain bridges are defined as having a span of 10m or more. The disparity in the frequency of culverts on the highways of these countries is doubtless due to these factors.
Table 3-6 shows that average replacement cost per culvert.
Table 3-6 Detailed information on culverts
Country (number) Details
Ireland (119 on National Roads)
Slovenia (1040 on National and Regional Roads)
Spain (90891 on National and
Regional Roads)
Spacing (km/culvert) 45.62 6.01 1.80
Materials of construction (%)
Concrete 2.42 91.35 36.97
Pipes (precast concrete) 38.71 0 2.23
Corrugated steel 58.87 0 2.33
Other 0 8.65 58.47*
Replacement cost
Total (billion €) - 0.038 (E) 2.649
Average per structure (thousand €) - 36.54 (E) 29.15
Annual expenditure on maintenance, repair and renewal (% of replacement cost) - - 0.028
(E) Estimate * Masonry
3.2.8 Retaining walls
A retaining wall for the purposes of the questionnaire was defined as an earth retaining structure for which the level of the ground in front of the wall was 2m or more lower than the level of the ground behind the wall (as Geotechnical Category 2 or 3 of Eurocode 7).
Only six countries supplied information on retaining walls and the position is detailed in Table 3-7. The more detailed information supplied by the Czech Republic, Denmark, France, Spain and the United Kingdom is summarised in Table 3-8. Apart from Denmark, which has a generally subdued topography, the length of retaining wall per km in the other four countries on National roads is reasonably consistent averaging between 23.40 and 28.64m/km. For the whole road
COST 345 Final Report
21
system the length of wall averaged 8.25 and 11.1m/km in the Czech Republic and the United Kingdom respectively.
Only Spain and the United Kingdom supplied information on the type of construction: gravity retaining walls were the most common in both countries but the extremely high estimate of the percentage of such structures in the United Kingdom is doubtless a reflection of the large number of drystone and improved drystone retaining walls in that country. There are striking differences too in the use of reinforced concrete and more particularly reinforced and anchored soil retaining structures in the two countries.
According to the information supplied there are considerable numbers of drystone and improved drystone retaining walls in the Czech Republic and United Kingdom, but this form of construction appears to have been little used in Spain. It is also known that there are considerable lengths of drystone retaining walls and their derivatives in France (Walker et al, 2000).
The height of ground supported by most retaining structures on highways is between 2 and 4m. Few walls support more than 10m of ground and the somewhat higher percentage of high walls in France and Spain presumably reflects the more rugged terrain in parts of those countries.
Replacement costs per km of wall vary widely (see Table 3-8). Expenditure on maintenance, repair and renewal of these structures was often extremely low and well below any figure which could be reasonably expected to maintain them in good condition over extended periods of time.
3.2.9 Tunnels
For the purposes of the questionnaire an enclosed road 100m or more in length was defined as a tunnel. Road tunnels usually have two traffic lanes which may take traffic in one or both directions (often referred to as unidirectional and bidirectional tunnels respectively); cut-and-cover and immersed tube tunnels as well as bored and driven tunnels were all to be included.
Tunnels, length for length, are on average the most expensive structures to construct on the road system: they are also the least numerous. Operating costs are high with lighting being continually required; mechanical ventilation is needed in all but the shorter and more lightly trafficked facilities.
Table 3-7 General information on retaining walls
Country Comment
Czech Republic 5543 walls average length 82.5 m
Denmark 18 walls on National roads; average length 341.7 m No data for Regional and Local roads
France 13 729 walls on National roads; average length 67 m No data for Regional and Local roads
Spain 3641 walls on National roads; average length 70 m No data for Regional and Local roads
Sweden 600 walls (E) SNRA roads and Stockholm area
Other (including unknown) 6.17 27.78 13.44 0.77 (E) 5 (E)
Height distribution (%)
2.00 to 4.00 m - 77.78 61.59 (E) 70 (E)
4.01 to 6.00 m - 16.67 77.84
29.59 (E) 25 (E)
6.01 to 10.00 m - 5.56 16.72 7.03 (E) 4.3 (E)
10.01 m and higher - 0 5.44 1.79 (E) 0.7 (E)
Replacement cost
Total (billion €) - 0.027 - 0.142 6.86 (E)
Per m of wall (thousand €) - 4.39 - 0.561 1.55
Maintenance, repair and renewal per annum (% of replacement cost) - 0.1 - 0.0044 0.03 - 0.75
(E) Estimate * National roads (excluding motorways)
COST 345 Final Report
23
Information on the number of tunnels on the road network were received from 12 countries and there are at least 2235 road tunnels in them: these data are summarised in Table 3-9 to Table 3-11 and apart from bridges are the most comprehensive received for structures on the road network; also shown in Table 3-9 is information on the number of tunnels at least one kilometre long (UNECE, 2000). Unfortunately data were not supplied by Italy where there are known to be 180 tunnels exceeding 1km long, 76 of them having twin tubes. For the seven countries giving information for all roads some 50% of tunnels are on National Roads, although in France, for example, about 30% of tunnels are on both Regional and Local Roads with the remaining 40% or so on National Roads.
3.2.9.1 Operational Characteristics The information on the traffic flow and ventilation of road tunnels is summarised in Table 3-10. Apart from Norway about 68% by length of road tunnels operate with unidirectional traffic flow which is inherently safer for the road user. It avoids head-on conflict between opposing traffic streams and the ventilation strategies to be used in emergencies can be simpler. The major fires in the Mont Blanc and Tauern tunnels in 1999 and in the St Gotthard tunnel in October 2001 were in single-tube tunnels carrying bidirectional traffic. At that time there were no emergency escape tunnels or passages at the Mont Blanc and Tauern tunnels but there were at the St Gotthard tunnel. Although 11 lives were lost there, the indications are that this escape facility was very effective in reducing casualties. It would also have provided a safe route for emergency services to approach the fire, but whether it enabled fire fighters to control the conflagration and limit damage more quickly is as yet unknown. Emergency escape routes have been incorporated into the recently reopened Mont Blanc tunnel.
Mechanical ventilation was fitted in a little over 60% of tunnels. With an average tunnel length of less than 500m in many countries (see Table 3-9) this is not altogether unexpected as the drag effect of unidirectional traffic alone provides effective ventilation of road tunnels of up to a kilometre or more in normal driving conditions.
3.2.9.2 Method of Construction Most tunnels are bored and lined (see Table 3-10). This type of construction includes both tunnels in rock driven by drill and blast and in soft ground constructed using a shield; more recent examples of either of these types of tunnel may be driven by a tunnel boring machine (TBM) or the New Austrian Tunnelling Method (NATM). Unlined tunnels were only reported in France, Spain and Sweden and would have to be located in very hard and stable rock conditions. Cut and cover tunnels are quite common and are usually to be found in urban areas where the presence of buildings and other man-made obstructions hamper the development of the road network. Tunnels constructed by the immersed tube method are rare in the countries supplying information; again the European country where the greatest number of tunnels constructed by this technique are to be found, namely the Netherlands, did not respond to the questionnaire6.
3.2.9.3 The Age of Road Tunnels Only three countries France, Spain and the United Kingdom reported having any tunnels constructed in the Nineteenth Century and indeed few were constructed in the opening 45 years of the Twentieth Century. At least half of all road tunnels in all the responding countries were constructed in the period 1970-2000.
6 According to Leendertse and Oud (1989) there would have been 16 road tunnels in the Netherlands by
the early 1990s, the majority of them constructed by the immersed tube method.
COST 345 Final Report
24
3.2.9.4 Replacement and Operating Costs Information on the replacement costs of road tunnels was received from seven countries and on the costs of operating, maintaining, repairing and renewing them from six (see Table 3-11); for brevity the latter costs are referred to in this section as whole life operating costs. Replacement costs per metre length of tunnel vary enormously from €156250 in Denmark to €8710 in Austria, which is somewhat surprising given that the average cost of bridges in the latter country was the highest returned; the very high figure from Denmark probably reflects the impact of the high costs and traffic capacity of immersed tube tunnels there.
The somewhat artificial nature of the concept of replacement costs is most apparent for tunnels. In the event of renewal being required the most likely way forward would be to refurbish the existing tunnel on the present alignment thus obviating the need to excavate a new tunnel and avoiding this major expense. This type of work has already been undertaken when, for example, redundant railway tunnels have been enlarged to carry road traffic7. In road tunnels such an exercise in refurbishment would be facilitated by the provision of generous clearances in all new tunnels; for example the provision of full-size hard shoulders on the Bell Common and Holmesdale tunnels on M25 in the UK will enable those sections of that motorway to be widened from 3 to 4 lanes in each direction without the need for any major structural works.
No clear pattern emerged from the information supplied on the whole life costs of operating etc road tunnels and it is doubtful whether expressing these as a percentage of replacement costs is appropriate. At the present time the annual costs of operating tunnels are likely to be much greater than the costs of the maintenance, repair and renewal of the facility given the fact that such a large proportion of the stock of the tunnels have been constructed within the last 50 years or so. However when renewals are required, such as the road deck at the Dartford Tunnel, the cost can be extremely high (Greeman, 2000; Healey, 1999).
As regards the absolute costs of operating road tunnels it seems anomalous that only €5.5 million is spent annually in Austria on whole life costs for 320 tunnels while €2.0 million and €6.0 million are spent in Denmark and Sweden to operate 6 and 25 tunnels respectively: Spain spends €13.1 million annually on 226 tunnels which also seems rather low.
3.2.10 General
There are a number of general points arising from the replies to the questionnaire.
Although severance of the Local Road network does not normally inconvenience large numbers of people, the figures provided for bridges (Table 3-3) show that their total replacement costs on Local Roads can exceed those for National Roads.
In Table 3-2 the number of bridges in Germany is clearly an estimate and looks suspiciously low: comparison with the United Kingdom, which has a very similar population density, would suggest a figure of the order of 150000 bridges rather than the 100000 in their reply to the questionnaire. Other anomalies and inconsistencies in the data have been mentioned above, all of which point to the under-recording or overlooking of information.
7 Redundant railway bridges have also been used to carry highways.
COST 345 Final Report
25
Table 3-9 Number of tunnels
All Roads National Roads Regional Roads Local Roads Country
* data from UNECE (2000) ** 2-lane m *** over 150m long
COST 345 Final Report
26
Table 3-10 Operational and construction information for tunnels
Traffic flow Ventilation Type of construction (km)
Country Unidirectional (km)
Bidirectional (km)
Mechanical (km)
Without mechanical
(km)
Cut and cover
Bored and lined
Bored and unlined
Immersed tube Composite
Austria 206 81 202 85 145 175 0 0 0
Czech Republic 7 1 8 0.3 6 11 0 0 0
Denmark 2.6 0 2.3 0.3 4 0 0 2 0
France 160 94 166 88 163 222 1 6
Ireland 1.3* 0 1.3 0 0 0 0 1 0
Norway** 61 729 428 359 - - - - -
Spain *** 73 47 85 36 17 184 25 0 1
Sweden 8 7.5 11 4.5 6 2 16 1 0
United Kingdom 48* 8 47 6 22 18 0 2 0
* 2-lane km ** National and Regional roads *** National roads only
COST 345 Final Report
27
Table 3-11 Replacement and running costs of tunnels
Replacement cost Cost of operating, maintaining, repairing and replacing tunnels
Country Total
(billion €) Per metre length
(€) Total
(million €) % of replacement
cost
Austria 2.5 8710 5.5 0.2
Czech Republic 0.088 10633 0.64 0.73
Denmark 0.4 156250 2.0 0.2 – 1.0
Slovenia 0.166 11773 - -
Spain * 1.065 8802 13.1 1.2
Sweden 1.5 96774 6.0 0.4
United Kingdom 3.6 65556 28.3 0.8
* National roads only
Finally attention must again be drawn to the question of financing expenditure on maintenance, repair and renewal. These categories are all part of the same process, i.e. that of conserving the stock of structures on the road network. It is counter-productive for the Engineers in the Maintaining Authority to have their decisions constrained by bureaucratic rules and regulations which distinguish between various elements of expenditure aimed at a single objective. The recognition of this in Sweden is certainly a step in the right direction and is to be commended. Unless Engineers are free to select the most appropriate course of action they cannot undertake these functions in the most effective and economical manner. It is hard, too, to see how the existing policy of putting renewal expenditures on the capital budget is consistent with a policy of sustainability.
In conclusion it is clear from the analysis of the results that even where information is available there are often serious gaps and deficiencies in the data. Surely in this day and age there should be the equivalent of a log book or the like attached to all significant highway structures on which are recorded all the important information needed to develop a realistic programme of maintenance, repair and renewal for the lifespan of that structure. This really should not be a problem for newly built and renewed structures where as-constructed details are available; for existing structures information may often be lacking but the accumulation of maintenance and work records is a much more sensible option than the ‘do nothing’ scenario.
3.3 DEVELOPMENT OF QUESTIONNAIRE RESULTS
It is possible using the data supplied to provide reasonably reliable estimates of the numbers of bridges on the road network in Europe using two simple approaches:
(i) through the relation between road length and bridge numbers; and
(ii) based on the relation between population and the number of bridges.
COST 345 Final Report
28
The first of these approaches implies that there is some connection between the occurrence of watercourses draining the countryside and the length of roads traversing it and could be considered as a reflection of the need for bridging such obstructions to permit movement. The second infers a relation between the numbers of bridges and the physical and monetary resources available to construct them; this supposition appears reasonable given that there are significant relationships between the extent and quality of the paved road infrastructure and the national per capita income (Hudson et al, 1997; Queiroz et al, 1994). Bridges by comparison with the roadway itself are expensive and their number and scale decrease as the importance of the road reduces.
The information available for retaining structures is fragmentary while that on tunnels is obviously incomplete.
3.3.1 Bridges
3.3.1.1 The size of the bridge stock As indicated in 3.2.2.1, there is an average of 1 bridge for every 5.68km of road in the eight countries supplying complete information for their whole road networks. At this frequency, it is estimated that the bridge stock in the Europe 27 countries is about 930000 structures.
Again in 3.2.2.1, it is shown that there is a bridge for every 437 persons on average for the eight countries giving data for all roads. Based on this figure, the number of bridges in the Europe 27 countries is estimated to be about 1112400.
The two approaches have given estimates which are in reasonable agreement but, given the limitations on the questionnaire data discussed in 3.2.10, they estimates are likely to err on the low side.
3.3.1.2 Overall replacement cost The average replacement cost of a bridge on the road systems of the six countries listed in Table 3-3 is €400k per structure. This puts the overall estimate of the replacement costs of the stock of about a million or so bridges in the Europe 27 countries discussed above at about €400 billion or a little less than 5% of the GDP of the countries concerned (EC, 2000). Given that bridging represents somewhat less than 20% of the average costs of roads (James, 1972) it would mean that the overall replacement cost of the road network in these countries is about 30% of GDP. This figure would appear to be well below the range quoted in OECD (1994).
3.3.1.3 The annual expenditure on maintenance, repair and renewal In Table 3-5 the annual expenditure on maintaining, repairing and renewing the bridge stock is given as a percentage of its replacement cost. As already mentioned only the values of 2.6% to 0.9% from Slovenia, Sweden and Switzerland and the 1.1% figure from UK include the costs of renewal. As already indicated there is some artificiality with replacement costs and it is of interest to note in Table 3-4 that the unit costs used to determine replacement costs are lower in Sweden than in the UK; this means that the actual amounts of money being spent in both countries rela-tive to the bridge stock is closer than these percentages suggest. Although this does indicate a shortcoming in the approach it is difficult to identify a normalising yardstick other than replace-ment cost which would improve the situation. It should be noted too that many of the figures in-cluding those from Sweden and Switzerland are essentially for National Roads only.
On the basis that the replacement cost of the bridges in the Europe 27 countries considered in 3.3.1.3 above is €400 billion then an annual expenditure on maintenance, repairs and renewals of 1-1.5% of bridge replacement cost would require an annual expenditure of some €4-6 billion
COST 345 Final Report
29
annually. Expenditure would almost certainly need to be somewhat greater in the initial years to make up for the current shortfalls and backlogs. Indeed it could well be that in the long-run average annual expenditure could be lower than the amounts given above. Improving the durability of new structures, which can be achieved at low additional cost, should ensure that the renewal element reduces over time. This is an area where there could be significant returns from research into the strategies used to conserve the bridge stock in the long term.
The information on expenditure on the maintenance, repair and renewal of bridges in Table 3-5 can also be used to provide some indication of the amounts currently being expended on those activities but some interpretation is required. Many of the figures do not include renewal costs and they are often for National or National and Regional Roads; also the high percentage, 2.6%, for Slovenia may well be because of the lower replacement cost of structures in that country. Making due allowance for these factors would suggest that the amounts currently being spent on maintenance, repair and some element of renewal of bridges in the Europe 27 countries could be €2-3 billion or so annually. Indeed given the lack of information for Local Roads it could well be less and is certainly unlikely to be more.
3.3.2 Retaining walls
As already indicated above little information was received on earth retaining structures and what there is has been summarised in Table 3-8. A very conservative stab at the length of earth retaining walls in the Europe 27 is obtained by assuming that 1% of their road network is supported by such structures. This would give a length of 52837km of retaining wall. Assuming a value of €1.5 million per km would put the overall replacement cost of the stock of retaining walls on the road network of the Europe 27 countries at €79 billion or 20% of the value of the stock of bridges.
3.3.3 Tunnels
As has already been mentioned, tunnels are the most expensive of the elements of the road system to construct and operate. In the questionnaire the operation, maintenance, repair and renewal of road tunnels were lumped together which was mistaken since the operation is a function of the road space created by the tunnel while the remaining three tasks are, to a considerable extent, related to the cost of constructing the tunnel structure.
Annual operating costs of road tunnels are on average about €400k per 2-lane kilometre. (This is less than the UK figure which is well researched, equal to the Danish figure and greater than the Swedish figure of €260 per 2-lane m per annum. The other values deriving from Table 3-11 would appear unrealistic.) The total length of the 2235 tunnels given in Table 3-9 is about 2400 2-lane km and the annual cost of operating them is, therefore, of the order of €1 billion. Although no information has been received from Italy it is known that there are 180 tunnels exceeding 1km long in that country with a length of about 500 2-lane km. Based on the relative proportions of tunnels in Austria and France it would be reasonable to infer that there are a further 600 – 800 road tunnels in Italy less than 1km long and perhaps 200 or so road tunnels on Regional and Local roads in Germany and Switzerland. This would put the total length of road tunnel in the Europe 27 countries mentioned close to 4000 2-lane km with annual operating costs of about €1.6 billion.
For tunnels on National Roads and those financed by the collection of tolls there is generally no difficulty in meeting these costs. On the other hand where tunnels are neither financed by central government nor self-financing through tolls there may well be problems. For example, with tunnels carrying Regional Traffic but financed by taxation on a more limited area there is an immediate conflict of interest - the motorists using the tunnels get the benefit of reduced
COST 345 Final Report
30
journey length and travelling time at the expense of taxpayers who may never use the facility or indeed possess a car8. In such circumstances Engineers and staff running the tunnel are put in an impossible and potentially unsafe situation. Everything has to be pared down to the minimum and necessary activities may have to be skimped and curtailed. This perhaps is the ultimate example of the consequences of uncertain financing of necessary annual expenditure on the road infrastructure.
It is extremely difficult using the replacement costs given in Table 3-11 to make a reliable estimate of the overall replacement cost of the road tunnels in the countries being considered in this report. Taking the low value of €10000 per 2-lane m would give a value of €40 billion and would appear unreasonably low being 11 times the replacement cost of 45 tunnels in the UK. The unit cost of tunnels can vary tremendously depending on ground conditions and quite a lot of the variation in the average values in Table 3-11 is doubtless due to differences in the predominant ground conditions in the various countries. Taking all of that into account it is estimated that an average replacement cost of €25-30000 per 2-lane m might be reasonable. On that basis the replacement cost of the stock of road tunnels in the Europe 27 countries would then be €100-120 billion or 25-30% of the replacement cost of their bridge stock.
Maintenance, repair and renewal of the tunnel structure have not been considered in the above and the difficulty of using replacement costs as a yardstick in tunnel renewal has already been considered. This is perhaps not as pressing a problem as it might seem as the majority of tunnels are either on National Roads or financed by tolls; in addition over 60% of tunnels are less than 30 years old with only about 10% older than 50 years. However in the longer term average expenditures of perhaps €1-2 billion annually could be involved.
3.3.4 Overall picture
Although some data was received on culverts given the ambiguity of their definition and their lack of usage it was not sensible to use them to obtain overall figures for their contribution to the structures element of the road infrastructure in the Europe 27 countries considered.
Summarising therefore, the best estimates of the replacement cost of the stock of bridges, retaining walls and tunnels are as follows:
The estimate for the number of bridges in the stock of highway structures would appear to be relatively robust with the estimates obtained by two quite different approaches in reasonable agreement. However, there are some differences in the definition of bridges in various countries and it would be useful if standardised definitions could be agreed. Almost certainly such an exercise would result in an increase in the recorded bridge stock; e.g. Spain defines bridges as having a length of 10m or more.
The estimate for retaining walls is rather tenuous but is considered to be a realistic lower bound to the likely stock of such structures; it is unfortunate that many highway authorities do not know how many such structures they are responsible for given that their replacement value is on average some €1.5 million per km.
8 This situation is not unique to road tunnels and may also apply to bridges and other road structures: it
also can apply to subsidised mass-transit systems which extend beyond the boundaries of the community providing the subsidies and which are used by people commuting from outside.
COST 345 Final Report
31
The position on tunnels is more soundly based than that for retaining walls but unfortunately the information from Italy is sparse although it is thought to have the largest number of road tunnels in any European country: information is also lacking from the Netherlands, where there are a significant number of immersed tube tunnels. Again their replacement cost of €110 billion is considered to be a realistic lower bound value.
3.4 SUSTAINABLE CONSERVATION
With Working Groups 2-6 of COST 345 dealing in depth and detail with the various processes needed to assess, maintain and ensure the conservation of the stock of structures on the highway network this Working Group considered the amount and sources of the financial resources needed to implement these processes on a consistent and continuing basis. Put simply Engineers are saying ‘We have the tools, give us the resources and we will undertake and finish the job’.
3.4.1 The amount of expenditure required
A yardstick commonly used to normalise the expenditure on the maintenance, repair and renewal of structures is the replacement cost of those particular objects. It is also important to consider the amount of these expenditures relative to the GDP; there is not a bottomless purse and investment in the transport infrastructure for example averaged 1.1% of GDP in the EU15 in 1995 (EC, 2000).
3.4.1.1 The present position in Europe Information on the current levels of expenditure on maintenance, repair and renewal provided by countries replying to the questionnaire is summarised in Table 3-5, Table 3-8 and Table 3-11.
In only four returns, Slovenia, Sweden, Switzerland and UK, do any of the figures include expenditure on renewal and this matter has been considered in 3.3.1.3 above for the case of bridge structures. The question, therefore, must be asked whether an expenditure of 1.0 to 1.5% annually of the replacement cost of bridges – and a somewhat lower percentage on retaining structures – is likely to be adequate to maintain the stock of highway structures over the long term, i.e. over the next 50 years or about half the design life of a new structure.
3.4.2 Other information
Like the returns to the questionnaire, there is little information on the financial resources required to sustain the stock of structures on the highway network in acceptable condition.
In the late 1980s, the Department of Transport in the UK commissioned a survey of the performance of 200 concrete bridges out of their stock of 5900 such structures. On the basis of this representative sample, Wallbank (1989) estimated that an annual expenditure of 1.73% of replacement value would be required over the following ten years on the Department’s stock of bridges. Subsequently the Highways Agency as successor to the Department of Transport, and currently the National Road Authority for England with the exception of London, developed a strategic plan in 1997 for their stock of structures (Das and Mičić, 1999): Figure 3-2 taken from that paper shows the projected levels of expenditure from 1998 to 2040. In 1997 the Highways Agency was responsible for 16000 structures including 10000 bridges (Narasimhan and Wallbank, 1999); if one takes an average replacement cost per structure of €1 million - a not unreasonable figure for structures on National roads - then the average annual expenditure shown in Figure 3-2 is about 1.75% of replacement value.
COST 345 Final Report
32
Assuming the above strategy still reflects the outlook of the Highways Agency in general terms there are two points which emerge:
(a) there was a current backlog of maintenance which needed to be cleared, and
(b) it showed the mix of essential, preventative and routine maintenance required to keep these expenditures at a reasonably steady level for the next 40 years or so.
It is also worth noting that studies for the Agency have shown that a maintenance regime such as that in Figure 3-2 is more economical overall than one where the funding for routine and preventative maintenance were inadequate (Wallbank et al, 1998). The two situations are compared subjectively in Figure 3-3.
More recently, a comprehensive review of the funding required for bridge and retaining wall maintenance was undertaken by the Bridges Group of the CSS (CSS, 2000). In the context of their review, maintenance included “preventative maintenance, regular inspection and eventual replacement”, i.e. all the elements covered by the terms maintenance, repair and renewal in the questionnaire.
The various approaches considered by them gave expenditures of 0.41% to 1.39% of the replacement cost as the annual expenditure needed to sustain the bridge stock. Of particular interest was the indication that the maintenance costs of masonry arch bridges might well be as low as a half those of steel bridges supported on reinforced concrete supports. With regard to retaining walls the methods reviewed indicated a range of annual expenditures from 0.48% to 1.39%. Their conclusion was that the “the level of funding required for maintenance should be 1.0% of the Replacement Cost for Bridges and 0.9% of the Replacement Cost for Retaining Walls”. Unfortunately the report also stated that existing expenditures on bridges and retaining walls in England on roads maintained by Local Authorities were 0.32% and 0.03% of replacement cost respectively.
The information on the cost of maintaining, repairing and renewing drystone retaining walls and their derivatives on National roads in England and Wales is given in O'Reilly et al (1999); a consistent average annual expenditure of 0.75% of replacement cost was found to be sufficient to sustain the stock of these structures.
The position regarding bridge maintenance in the USA was set out by Chase (1998). There are 581000 bridges, with a span of 6m or greater, on the 6.3 million kilometres of road in that country, or 1 bridge every 10.8km. On the National Highway System, some 260000km long, there are 122000 bridges or a bridge on average every 2.13km: this latter figure would sit very comfortably with the data given in Table 3-2 for National Roads in Europe. Information on the replacement value of the above bridge stock is not given in the paper but Briaud and Gibbens (1999) have put it at $300 billion (currently €300 billion or so).
According to Chase, expenditure on the operation and maintenance of all the highways in the USA in 1995 was $51.6 billion together with a capital expenditure of $46.5 billion: these sums together would represent about 1.3% GDP. Chase estimates that about a tenth ($5 billion) of the operation and maintenance expenditure was expended on bridges; this would represent 1.6% of the replacement value given above.
3.5 ANNUAL EXPENDITURE REQUIREMENTS
In the above the annual expenditure as a percentage of replacement cost to sustain the bridge stock varied from 1 to 1.75%. This is quite a difference and needs to be examined and if possible explained.
Figure 3-2 Strategic plan for future structures’ maintenance expenditure (Das and Mičić, 1999)
COST 345 Final Report
34
The lowest figure, 1%, relates to the stock of bridges on Regional and Local Roads in England where over 40% of the bridges are masonry/brick structures most of which would have been constructed before 1900. On the other hand about 90% of bridges on the National Roads in England were constructed in reinforced or prestressed concrete or steel after 1955 (Highways Agency et al, 1999). On the road network of the USA less than 15000 bridges are of pre-1900 vintage and over 70% of bridges were constructed after 1970 (Chase, 1998); again reinforced and prestressed concrete and steel are the predominant materials of construction.
There is a great deal of information on the deterioration of reinforced and prestressed concrete structures. The decks of bridges in the USA seem to be in a particularly poor condition but the condition of bridges on the National Road networks in England and France also gives cause for concern. Concrete bridges with metallic reinforcement, as well as steel bridges, are particularly susceptible to chloride attack from salt which is regularly applied to highways to control the formation of ice; in the present context it may also be relevant to note that the frequency of such saltings in England is least on local roads. There is also the question of levels of service where, as has already been discussed, the impact of delays on the local road network are less noticeable and politically significant.
A way forward, therefore, is to accept that in their current condition an annual expenditure of 1.6 to 1.7% of replacement cost is needed to sustain bridges on the National Road networks. A somewhat lower expenditure year in year out may be acceptable on Regional and Local Roads and the amount needed may vary from country to country depending on the composition of the stock of bridges: in the early years too there is likely to be a need to eliminate a backlog of repairs. As a starting point to be confirmed by subsequent experience it is suggested that an amount of about 1.25% of replacement value be expended on sustaining the existing stock of bridges on the Regional and Local Road network. Only time will tell if this is adequate.
Applying these figures to the bridge stock gives an expenditure of about €5.8 billion annually in the 27 European countries considered above and is strikingly similar to the expenditure for this purpose in the USA where there are fewer bridges but with higher replacement costs. It does, however, indicate that the outcomes of the analyses carried out are not unrealistic and of the correct order of magnitude.
The expenditure needed to sustain the stock of retaining walls of the 27 European countries considered is less certain. A figure of 0.75% per annum of replacement value has been found adequate to maintain gravity-type retaining structures of masonry construction, i.e. drystone walls and their derivatives: the needs of reinforced and prestressed concrete structures are likely to be greater. On the basis of a figure of 1.0% of replacement cost a sum of €790 million per annum would be required. In 3.3.3 the annual expenditure on operating road tunnels in Europe 27 was estimated to be €1.6 billion while the question of the appropriate levels of expenditure on the maintenance, repair and renewal of these facilities was put to one side to be determined at a later date by further investigation and study.
The annual expenditure of €5.8 billion, €790 million and €1.6 billion just mentioned are all considerable sums of money by any standards and there is clearly merit in carrying out research to revise them and to devise and develop strategies to reduce the amounts needing to be spent. On the latter score one possibility that has just been mentioned is the use of structures such as gravity retaining walls where all the structure is in compression and which do not contain degradable materials such as steel that can corrode in the longer term. Arch bridges have similar characteristics and advantages; given the vicissitudes of reinforced and prestressed concrete structures in the latter half of the last century perhaps the time is now ripe for the reintroduction of the arch bridge. The scope is great; reducing the above figures by just 0.1% for bridges and retaining walls could save about €480 million annually.
COST 345 Final Report
35
3.6 ASSURING FUNDS FOR MAINTENANCE
Although left until last this is undoubtedly the most important consideration in the development of long-term strategies for the maintenance, repair and renewal of the stock of structures on the road network. Without an adequate and consistent flow of funds for these purposes year on year the best laid schemes are put at nought.
The financing of the capital and maintenance expenditures - and indeed the maintenance of the road network as a whole - are in the end political decisions. The subject has already been broached in the Introduction above where the World Bank (1994) stricture on the false economy of cuts in maintenance expenditure during periods of budgetary restraint was cited. Examination of Figure 3-2 and Figure 3-3 make this point clear: indeed continuous and adequate routine and preventative maintenance may well reduce the requirement for essential maintenance in the longer term as indicated diagrammatically in Figure 3-3(c). This is, of course, something which could only emerge over a period of time when the maintenance regimes recommended above have been implemented and any current backlogs eliminated. That such a supposition is not fanciful relies on the common sense adage that ‘a stitch in time saves nine’ as well as the reasonable inference that the postponement of the time to replacement due to the enhancement of the life of structures - as a consequence of adequate routine and preventative maintenance - will eventually show through in reduced replacement expenditures; these can be a significant element of the cost of sustainable conservation. With such a prize in prospect it is worthwhile giving some consideration to the methods used to finance the road network.
3.6.1 The existing situation in the EU15
The types of vehicle tax structures across the EU are shown in Table 3-12 (Commission of the European Communities, 1998). All countries levy Vehicle Tax and Excise Duty and VAT on motor fuels but the tax levels differ considerably as is shown in Table 3-13 for 1994 (Bousquet and Queiroz, 1996). Apart from Luxembourg there would appear to be an excess of revenue over expenditure on roads in the remaining EU countries.
Ten countries collect tolls on roads and bridges and with the exception of Ireland it would appear that these are considered as taxes rather than charges (see Table 3-12). In France more than 70% of the 8250km of motorways and expressways are toll roads operated by either state owned or private company concessionaires (Bousquet and Queiroz, 1996); toll rates are set by Government with the concessionaires responsible for the construction, operation and maintenance of their motorways. The financial strength of the concessionaire companies enables them to construct new toll roads without Government support; for example a half of the investment in the French road network in 1991 came from these sources.
Accepting there is an argument against the dedication of road user charges for new road construction, because of its interference with budgetary control and political decision making, there is a very good case that the expenditures for maintenance, repair and renewal be retained within such a ring-fenced source. After all, the decisions to create the highway infrastructure have already been taken, with those made during the past century or so being democratically approved by elected representatives. Once created, infrastructure needs to be maintained on a regular basis; one way of achieving this without the annual budgetary wrangle is by having a dedicated fund for this purpose. And for the future, if this system were adopted, elected representatives would be asked to realise that when deciding on a new piece of infrastructure they are voting on the provision of maintenance resources for the lifetime of that structure as well as on the capital to construct it in the first instance.
1 Tolls applied so far are private charges rather than taxes 2 This is a regional ‘Euro-tax-disc’ on heavy goods vehicles and is valid for periods of 1 day, 1 week,
1 month or 1 year; annual cost varies from €750 - 1550 (European Commission, 2001, p19&74).
Table 3-13 Road revenue and road expenditure in 1994 (Bousquet and Queiroz, 1998)
Country Dedicated fees? 1 % of budget 2 Frequency of adjustment of user fees 3 Purpose 4 Australia Part
(Remainder of fees considered taxes)
N/A5 N/A National Highways and Roads of National Importance Distribution to State and Local Governments for other roads
New Zealand Yes 4 Several times per decade All highways and roads Safety enforcement Subsidies for public transport
Switzerland Yes 8 Approximately once per decade, requires popular vote
National Highways and Rail projects Shared with Cantons for National Highways and other roads
United States Yes 1.5 4 times in last 13 years Highways and Mass Transit 1 Dedicated fees? indicates whether or not fees or taxes collected from highway users are dedicated for transportation purposes 2 % of budget indicates what per cent of the total government budget is supported by highway user taxes and fees, if known 3 Frequency of Adjustment of User Fees indicates how frequently the dedicated fees are reconsidered, raised or adjusted 4 Purpose indicates any limitations on the use of the dedicated fees. Are the fees used for highways and bridges only; for highways bridges and mass
transportation; or for other transportation purposes? 5 N/A indicates not applicable or not available
COST 345 Final Report
39
3.6.2 Dedicated, earmarked or hypothecated road user charges
In this method a road fund, that is an off-budget fund, is set-up in which the monies extracted from the road user are held. Proponents of the concept argue that it (i) gives more assurance of minimum levels of financing, (ii) provides more stability and continuity, (iii) establishes a strong link between the levy or charge and spending and (iv) can preserve critical expenditure on high priority requirements. The argument goes that it should be used for items of expenditure which are associated with high rates of return but which are politically less visible. Interestingly the World Bank (1994) has found that the rate of return on expenditure on road maintenance was twice that on new construction! The objections to dedication of road user payments are that it (i) hampers budgetary control (ii) can lead to misallocation of resources and (iii) tends to make the budget inflexible.
A recent study for PIARC has looked into the matter (Bloom, 1999).
Table 3-14 summarises the information where some of the fees paid by road users are dedicated: according to OECD (1997) Japan has also earmarked national and local revenue sources. According to Bloom (1999) Argentina, Columbia, Hungary, Madagascar and Russia were said to have a dedicated road fund, although their operation was considered to have some shortcomings. In the USA some $20 billion are provided annually by the US Federal Highway Trust Fund which derives its income from motor-fuel and motor vehicle taxes (Chase, 1998; Bousquet and Queiroz, 1996): this represents about 20% of the total expenditure on highways in that country.
3.7 IMPLEMENTATION, DEVELOPMENT AND RESEARCH
3.7.1 Inventory of Highway Structures
All the thirteen countries who replied to the questionnaire provided information on the extent of their road networks and some data on the number of bridges on them (see Table 3-1 and Table 3-2); information on road tunnels was provided by twelve countries (see Table 3-9). Only six countries provided information on retaining walls (seeTable 3-7) with only five giving much detail (see Table 3-8). On the other hand in many cases information was not supplied for Regional and Local Roads particularly the latter. And where it was forthcoming it was often uncertain with estimates rather than actual figures being given.
The present situation, is that the inventory of structures on the European Road Network is incomplete; in many instances comprehensive data for the National Road Network is lacking and the situation is much worse for Local and Regional roads. The first step in implementing a programme for assessing and sustaining the stock of highway structures on the European road network should be the completion of an inventory of highway structures. Without clear identification of all the assets involved it is difficult to establish, finance and manage a sensible programme of work to achieve these objectives.
3.7.2 Funding
Regional and Local Roads which often represent some 90-95% of the road network are the major problem here. Revenue from road users - commercial vehicles and motorists - is in the main collected by Central Government and the trickle down effect is not consistent. The Regional and Local authorities responsible for roads have no direct access or inalienable rights to such funds. This is of course anomalous: these authorities provide and maintain roads but in general have no means
COST 345 Final Report
40
whatsoever of obtaining revenue directly from those who use them. And it is not immediately clear that the recent EU White Papers (European Commission, 1998 and 2001) have recognised this problem although to be fair the main thrust of their argument has been on the improvement of commercial traffic on national and international routes.
But whatever mode of transport - rail, road or sea - is used for the long haul it is almost inevitable that the secondary and tertiary tiers of the highway network are used for final delivery of the goods and very often their initial pick-up as well. An efficient transportation system also depends on the well-being of these roads as well as of the more heavily utilised and high profile primary system.
There are two immediate problems here:
(i) Current expenditure on the maintenance of bridges on Regional and Local Roads is 0.3% or less of their replacement value in many countries and can be derisory for retaining structures.
(ii) Maintenance of bridges and other highway structures cannot be divorced from the overall funding of maintenance of the whole road system.
A useful starting point here could well be that EU countries should aim to spend similar amounts on the administration, operation and maintenance of their road networks as does the USA, i.e. something in excess of $60 billion annually (Chase 1998) given that the GDP of both regions is approximately equal. If the objective is to emulate and surpass the US economy then these are the levels of expenditure needed to sustain an effective highway network. (The annual capital expenditure in the USA on their road system although a little less is of a similar order of magnitude but is of course outside the scope of this report).
3.7.3 Monitoring the Programme
The systematic collection of information on the work carried out on highway structures, its cost and subsequent performance is essential to success. The accumulation of such data should, over time, improve the allocation of resources and ensure that they are being applied in the most cost effective fashion.
A particular problem here is the trend to contract out maintenance and renewal to the private sector for periods of up to 10 years perhaps or even longer. In these circumstances much valuable information can - and has already been - lost since an organisation which, for whatever reason, knows that its contract is unlikely to be renewed has no incentive whatsoever to undertake this data collection chore and pass on the information to the new incumbent. Here the innate short-termism of the private sector is clearly at odds with the long-term objectives of the public sector client; even in the public sector itself the reorganisations of Central, Regional and Local Government can result in the loss of much data on the road network. Assets which have a life span of 50-200 years all need to have a ‘log book’ attached in some fashion for the period of their existence. Loss of as-constructed drawings and details of major maintenance works can be costly and result in the expenditure of limited resources on needless investigations and reinvestigations.
In Road Authorities themselves there is also a mismatch between the long-term needs of their stock of structures and the career span of their engineers. The latter can be pressured too by politicians with even shorter horizons who need the quick cheap fix to achieve their objectives and leave it to posterity to deal with any problems which may arise. One way of tackling this problem would be the formation of a centralised repository where all records of highway structures are archived. One possible location for this would be the vehicle registration and licensing organisation which might already have a computing capability suitable for keeping such data.
COST 345 Final Report
41
3.7.4 Research
The continuous record keeping advocated above provides the basis on which new forms of construction, maintenance techniques and the like may be judged. For example, the experience of structures with steel reinforcement has not been good but it is only some 25-40 years after their construction that the financial implications have become obvious to all. As there would appear to be no viable alternative to salting of the road network to control ice formation, apart from odd localised situations, then the durability of reinforcement or its alternatives need to be improved. Stainless and epoxy coated steel have been used in special situations but are expensive; plastics may well be the final answer but that is some way off. However given the difficulties mentioned in 3.7.3 above it may be many years before structures reinforced with plain steel cease to be built.
But already there are many examples of sustainable structures around us. For example scores of arched buildings, particularly cathedrals and bridges, have survived since the Middle Ages some even from Roman times. Granted that the increased headroom needed for arched bridges may lead to difficulty and additional cost elsewhere, is there not a case for the re-evaluation of their applicability? Similar considerations would apply to earth retaining structures although here there are already indications of the efficacy of gravity structures and some inklings of the promise of plastics.
In the latter half of the 20th century the emphasis in research and development was on minimising first cost. But the outcomes have not been as expected: although modern and ever improving technology did produce adequately strong and enhanced structures, these constructions have proved to be much less durable than their counterparts from earlier times. The trend towards whole-life-costing should eventually lead to amelioration of the problem but dramatic improvement must await the development of more durable new materials and structural forms. Sustainability recognises that there are limits to the world's resources and the highway network is a significant consumer. An effective system of assessing and sustaining the stock of road structures has a part to play in this scheme of things; so also has the supporting research and development.
It is also clear that the rate of road building and of the structures on them is set to slow down in the more affluent of the Europe 27 countries where their highway networks are already well developed and comprehensive. In these circumstances the priority will be on retaining the existing highway infrastructure in good condition and research needs to be directed to achieving these objectives effectively and economically. The development of rational processes and procedures which enable a trade-off to be made between the age of a structure and the margin of safety required of it needs to be addressed in order to maximise the utilisation of the existing stock of structures. There is need here for the development of a suite of standards for the assessment of existing structures to complement the plethora of standards for the design and construction of new structures; Supplement No 1-1990 to the Canadian Standard for Highway Bridges is an example of what is needed here (Canadian Standards Association, 1990).
Bridges due to their direct exposure to salt used for de-icing the highway are most at risk. Here increases in the cover to reinforcement and the elimination of movement joints - integral bridges - would go some way to reducing the rate of deterioration. The use of stainless steel would also help but the present perception is that the material is too expensive for general use. Carbon fibre reinforced polymer composites have been trialled in a number of bridges (ISIS Canada, undated; Christoffersen et al, 1999). Tilly et al (2002) has commented on the good performance of mass concrete bridges, while some steel-free deck slabs have been trialled on bridge rehabilitation projects (Newhook et al, 2001). Where structural deterioration is not universal there may well be a case for incorporating the structurally sound elements into the renewal scheme. A peculiar blind spot is the lack of advice and guidelines in codes and other documentation on scour at bridge piers, a phenomenon which is responsible for about half of all dramatic bridge failures (Tilly et al, 2002).
COST 345 Final Report
42
Deterioration problems with tunnels have not yet revealed themselves to any large extent presumably due to their relatively young age and to the generally lower exposure to de-icing salt. However, chlorides have been a problem in the road tunnels beneath sea or brackish water at Dartford, Dubai, Limfjord and Suez where significant repairs have been needed within 30 years or less of their opening to traffic. The comments above on the shortcomings of concrete reinforced with plain steel are equally relevant here.
The concrete linings of circular and arched tunnels usually contain reinforcement the function of which is principally to resist tensile stresses during the construction process. Although this does not appear to have resulted in durability problems in normal ground conditions there may well be a case for reviewing the situation since tunnel linings are essentially in compression for most of their life.
Reinforced gravity structures, often masonry faced, are commonly used for earth retaining walls supporting up to 3m of soil. Given the evidence of the deterioration of concrete reinforced with plain steel considered above it would be logical to use this form of construction to support even greater height of ground where this is feasible. The development of a range of suitable precast units to be erected by crane may overcome some of the problems in doing this although there will be situations where limitations on space renders such a solution impossible. Reinforced and anchored earth solutions would appear to have much to offer in such circumstances: there are also situations where the use of lightweight fills would be advantageous.
A particular problem in the assessment of highway structures is the discrepancy between the actual and predicted failure loads for bridges where the load applied at collapse can be up to five times that calculated (Tilly et al, 2002; Cullington and Beales, 1994). The development of realistic assessment methods would ensure that bridges are not unnecessarily replaced as a result of the use of inappropriate assessment procedures. Similar problems may well arise with retaining walls and tunnels but these have yet to be researched.
There are two modes for progressing research and development. The more common is through evolution by the slow and gradual improvement of existing technology and materials; the enhanced performance of pneumatic tyres during the past fifty years is a good example of this. The bulk of the improvements to the means of inspecting, assessing, maintaining, repairing and renewing highway structures are likely to stem from this kind of research. On the other hand there is the occasional revolutionary advance - often triggered by the exigencies of war or other emergency - where a breakthrough creates a new material or technology; the computer is a notable example of this.
Routine research can often be packaged but it is more difficult to cope in a bureaucratic structure with flashes of genius. There is much to be said for the centre of excellence and this is most easily achieved in universities and the like. However where long-term research and development is needed over periods up to 50 years or more other types of organisation may be more appropriate; there may well also be a case for creating a Europe wide organisation to obviate parochialism.
Finally it must be recognised that research is carried out because the outcome is unknown or uncertain. It is only some way down the line that the potential of any particular avenue of enquiry can be judged; often it is the least expected of the contenders which comes up trumps in the long term. But negative results are not a waste since they prevent resources being applied ineffectively: they are particularly important today when miracle cures are aggressively being marketed by commercial organisations.
COST 345 Final Report
43
3.7.5 Verification and evaluation
Given the large annual expenditures proposed for the maintenance, repair and renewal of the structures on the highway networks of the European 27 countries it goes without saying that systems need to be in place to ensure that such sums are spent wisely. To ascertain this three matters need to be addressed as follows:-
(i) the appropriateness of the systems and methods being used,
(ii) the quality of the products and services supplied, and
(iii) the auditing of the finances.
Dealing with these in reverse order it is normal for the current expenditure of Highway Authorities to be controlled and audited. But this is only part of the story as the level of expenditure may be inadequate and result in a reduction in the value of assets. Replacement cost is not a measure of value since a dilapidated structure in need of major repair or even requiring immediate replacement has the same monetary amount attached to it as a newly commissioned structure with 50 - 100 years of useful life ahead of it. There is, therefore, a need to provide a measure of the overall asset value of highway structures so that the effects on such assets of shortfalls in expenditure can be monitored and accounted for. Financial accounting is currently under a cloud; and it would appear that cosy relationships often involving conflicts of interest have resulted in auditors failing to spot financial improprieties and in some instances fraud. It is foolish to suppose that such evils will ever be completely eliminated but financial systems and operating procedures should minimise the opportunities for their occurrence; the use of truly independent auditors is an obvious way forward here.
The problem is very similar when it comes to assessing the quality of products and services. Quality Assurance relying as it does in the main on self-certification has been shown to be open to abuse and even Quality Control can be circumvented by the determined miscreant. Again there is a need for independent supervisors and assessors and for the retention by clients of sufficient in-house staff capable of overseeing and checking that the standards of quality and safety they require have been achieved.
And lastly there is the question of the appropriateness of the systems and methods being used. Here clients need to have available either highly experienced professional staff within their own organisation or access to a truly independent second opinion on the merits of proposals at the formative and design stages. A wrong choice at these times can lock a client into an inappropriate course of action which can lead to unnecessary expenditure when another strategy would have been more appropriate. Arrangements where a firm checks another's work and it is possible for their roles to be reversed on another scheme in the future can also lead to less than rigorous review of proposals and designs. On the other hand organisations such as CEDEX and LCPC in Spain and France respectively would appear well suited to undertake many of the independent roles suggested above in their respective countries.
3.8 CONCLUDING REMARKS
The replies received to the questionnaire circulated by COST 345 WG1, limited in number though they were, have provided very valuable information on the numbers and replacement cost of the structures on the highway infrastructure in European countries. These data have been extrapolated and conservative estimates have been made of the numbers of bridges and tunnels as well as the extent of retaining walling on much of the European road network. In particular the value of structures on the local road network have been identified and roughly quantified.
COST 345 Final Report
44
However the replies to the questionnaire also showed that there were considerable gaps in the information available, particularly for structures on Local roads and to a lesser extent on Regional roads. Without adequate information it is impossible to develop coherent and cost effective strategies and policies to ensure that highway structures can be sustained in an efficient and consistent manner. As a result of the work undertaken by Working Group 1, 16 recommendations have been made and these are listed in full in Chapter 7 of this report. Of the 16 recommendations, nine relate to the rectification of the deficiencies described above and the setting-up of regimes capable of sustaining the stock of highway structures efficiently in an acceptable condition over the long-term.
Unfortunately, the information obtained show that, with few exceptions, current levels of expenditure on maintenance, repair and renewal are inadequate; this is particularly so for Local and to a lesser degree for Regional Roads. The levels of financing needed to undertake these activities year on year were considered and recommendations made on the appropriate levels of such funding. Lastly the means of assuring the uninterrupted flow of these finances were considered.
There seems little doubt that the financing of the maintenance, repair and renewal needs to be put on a more consistent and sustainable basis if the full benefits of the management systems and techniques being developed for sustaining the stock of road structures on the highway infrastructure are to be fully realised. Five of the other recommendations given in Chapter 7 deal with the provision of an adequate stream of financial resources year in year out to achieve this objective and the remaining two relate to research and development.
As stated at the beginning of this report the road network is by far the most important element of the land transport infrastructure in the EU and as such is essential to its wellbeing and economic development. Highway structures, particularly bridges and tunnels, are crucial components in this network and the WG1 report has highlighted the deficiencies and limitations of current policies for their maintenance, repair and renewal. The situation is most critical on Local roads but not all is well on Regional roads and to some extent on National roads. An adequate and comprehensive infrastructure is an essential element of economic development and considerable sums have been, and are still being, spent on new road construction. However given the extent of the existing road network it is now more important than ever that the capacity of the existing highway infrastructure is exploited to the full. For road structures this can only be done by dedicating sufficient resources each and every year to their maintenance, repair and renewal and so sustain the stock of such structures.
We hope that the report, by identifying these shortcomings and the means of their resolution, will provide a starting point in the rectification of the current situation and hopefully in the fullness of time the worth of such valuable infrastructure will be optimised.
COST 345 Final Report
45
Chapter 4 Summary of Working Groups 2 and 3 Report on inspection and condition assessment
4.1 BACKGROUND
Working Group 2 examined the procedures used to inspect highway structures, whilst Working Group 3 examined the methods used to establish a condition assessment of such structures. The Working Groups were to report on these particular subjects, and also to recommend improve-ments to current procedures and provide suggestions for further research. The recommendations arising from Working Groups 2 and 3 are given in Chapter 7 of this report.
Before undertaking an inspection it is necessary to identify (and in some cases quantify) the ac-tions to which highway structures are subjected, and the types of defect that occur on them. These are discussed in 4.2 and 4.3 respectively.
Various inspection regimes have been implemented within Europe and the current inspection procedures used in some of the States participating in COST 345 are reviewed in 4.4. There is a good deal of commonality in the regimes, but the main differences between them are in the defi-nition of a structure, details of the inspection procedures, and the intervals between successive inspections. A range of tests can be used to supplement the information obtained from visual in-spections, and these tests can generate a substantial volume of data. Details of commonly used tests are provided in 4.5 while 4.6 addresses the problems of collecting, manipulating and analys-ing these data.
One of the objectives of an inspection is to provide the owner or delegated authority with a measure of the condition of a structure. There are a number of procedures for deriving a condi-tion rating and details of these are given in 4.7. The qualification and certification of those re-sponsible for inspecting highway structures are considered in 4.8 and some concluding remarks are provided in 4.9.
4.2 IDENTIFICATION AND QUANTIFICATION OF ACTION
4.2.1 Introduction
An action is defined in the Eurocode BS EN 1990 (British Standards Institution, 2002a) as:
(a) Set of forces (loads) applied to the structure (direct action);
(b) Set of imposed deformations or accelerations caused for example, by temperature changes, moisture variation, uneven settlement or earthquakes (indirect action).’
Highway structures are subjected to a wide variety of actions; for example, dead loads from self-weight and earth pressures, and live loads generated by traffic, wind, and perhaps also seismic events. It is necessary to quantify the relevant actions so that the stability and serviceability of a structure can be checked. Nonetheless, the structural integrity and condition of a structure can also be assessed through an inspection.
Inspections provide an opportunity to:
COST 345 Final Report
46
• check the design assumptions underlying the quantification of some actions; • detect changes in use that could affect the stability or serviceability of a structure; • detect damage due, for example, to vehicle impact, ground movements and vandalism; • detect signs of structural distress due to overloading; • identify areas of material degradation; and • provide a basis for determining structure-specific loads.
4.2.2 Current position
4.2.2.1 Verifying the inventory Some inventories identify the code or standard used for the design of a structure along with the year of its issue. Where this information is unavailable, an inspector familiar with the develop-ment of such documents may be able to infer it from the age and origin of the structure.
The types of data used to determine the design values of the actions include: • geometric information, such as the dimensions of the structural elements, the width of traf-
fic lanes and the thickness of the pavement; • material properties, such as the strength and stiffness of the structural components - includ-
ing any backfill and the foundation subsoil; • in-service environmental conditions, such as temperature range, wind, rainfall and depth of
the water table; • calculation assumptions, such as joint fixity and the rigidity and stability of foundations; • calculation expedients, such as the values of the various partial factors; and • calculation procedures, such as the method of analysis.
It is the case that as-built drawings are not always available or updated following the end of con-struction. The partition of the carriageway over a bridge into traffic lanes may be changed in ser-vice, but this may not be registered in an inventory; the same situation may arise with the thick-ness of the carriageway overlying a bridge or buried structure. (Such cases may be adequately covered by partial factors built into the design process.) Further information used in design, such as material properties and the (assumed) level of groundwater, could also be gathered during an inspection and incorporated into the inventory and related maintenance documents - but this is rarely done.
4.2.2.2 Changes in use Inspections tend to focus on the detection of defects or damage and so changes in use by users or even the owners of the structure, or of adjacent infrastructure, may be overlooked. It will be appreciated that the performance of a highway structure can be affected by planned or un-planned activities outside its site boundaries (e.g. the excavation or stockpiling of soil and the demolition or construction of buildings).
4.2.2.3 Identifying defects Asset management systems require areas of damage and material deterioration to be identified, but in some systems emphasis is on estimating the cost of remedial works rather than identifying and remedying the cause of degradation. For example, a subroutine could be devised to calculate the cost of repairing spalling to the concrete soffit of a bridge, but this would not address the underlying problem of the bridge having a sub-standard clearance.
COST 345 Final Report
47
4.2.2.4 Site-specific loading Details of the various actions (and their combinations) that should be considered in the design of highway structures are given national and European standards. These standards do not, how-ever, cover some site-specific or structure-specific actions, and so, for example, the Swiss road and rail authorities provide guidance on the actions due to rockfalls and avalanches to be consid-ered in the design of protection galleries.
4.2.3 Use of design codes for assessment
In assessing the stability of an in-service structure, the relevant actions could be quantified ac-cording to the standard or code(s) used for its design. However this would not satisfy the re-quirements of the owner or society at large because it would not take advantage of knowledge gained in the interim nor of changes in design practices, such as traffic loading. Such objectives could be overcome by applying up-to-date design codes to assess stability but this would un-doubtedly lead to unnecessary widespread and substantial strengthening works.
The WG2 and 3 report (COST, 2004b) provides a summary of the way in which some of the participating States deal with the assessment of in-service structures.
4.2.4 Future strategy
4.2.4.1 Systematic classification of hazards A better understanding of the actions that should be taken into account when designing and as-sessing structures requires the systematic identification of hazards. In each of the categories listed in Table 4-1 increasing action and or decreasing resistance can lead to failure: only the ac-tions are considered in the following. The table provides a checklist based on the origin of the hazard to show which actions may be relevant in a particular case.
4.2.4.2 Identifying discrepancies between in-service conditions and design assumptions An inventory should list important design assumptions and an inspector should be able, and be required, to check that these are not violated in service. Through an inspection the following may be observed: • surcharging behind an abutment, wing wall or retaining wall - which will increase the disturbing
earth pressure (a surcharge may be obscured by vegetation); • a blocked drainage system - this could generate a rise in the groundwater level and hence increase
water pressures; • placement of a new pavement without the complete removal of the original - thereby increasing
the dead load (this may only come to light during a site visit - it may not be recorded in an inven-tory);
• installation of new utility apparatus, street furniture and the like, such as pipes, poles, signs, light-ing columns and safety barriers;
• removal of vehicle weight or speed restrictions, or the failure to observe posted restrictions; • changes in the number and width of carriageway lanes; • excavations in front of retaining walls and bridge abutments or adjacent to buried structures -
such works can destabilize these types of structure; and • the growth of vegetation in cracks - this can lead to the deterioration of surfaces.
COST 345 Final Report
48
Table 4-1 Checklist of actions
Hazards due to the structure: those that result from or are increased by the presence of the structure
Hazards due to use: those that result from the intended, excessive or improper use of the structure
Hazards due to the environment: those that would occur without the structure
Self weight - due to structural and non-structural elements
Imposed loads - such as bearing pressures on foundations
Earthquakes
Wind forces Static and dynamic traffic loads Storms/gales/snowdrifts Water pressure Starting and braking forces* Rockfalls, landslides,
mudflows and the like Wave forces Nosing forces* Flooding Ice drifts Impact loads from collisions Fires - grass and forest Lateral earth pressures Fire Climate change Effects of temperature Explosion Avalanches and ice falls Frictional forces Vandalism Groundwater
Application of de-icing salts Weathering Air and water pollution
Retaining spring forces: for example, bridge piers that are deformed horizontally by the superstructure (through temperature, creep, shrinkage), generate forces that may predominate at fixed bearings.
Poor or inappropriate maintenance and repair Marine conditions
* applies particularly to railway structures
4.2.4.3 Detecting signs of overloading
Damage, deformation and/or material deterioration is clear evidence that the condition of a structure has degraded in service, but it may also indicate that a structure has been overloaded at some time or other. For example, • noticeable deflection and buckling usually signify overloading; and • scratching on a bridge soffit or support is likely to be due to vehicle impact.
4.2.4.4 Site-specific loading
Codes cannot be expected to cover all possible circumstances.
The results of an inspection should allow an engineer to judge whether the conditions at the structure are covered by a particular code and, if so, how the requirements of that code should be applied.
Examples of conditions that are more favourable than assumed in design are: • the presence of rock rather than soil; • the joints of a rock mass having a favourable rather than an unfavourable inclination; and • limited access or low traffic flow such that the design traffic loads cannot be applied.
Examples of site conditions that are less favourable than assumed are: • rock formations with joints having an unfavourable inclination; • the presence of boulders in a soil matrix rather than the existence of rockhead; • a greater depth of weathered rock; and • environmental conditions, such as extreme temperature variations.
COST 345 Final Report
49
4.2.4.5 Remediation Whenever possible, the underlying physical mechanisms and associated structural actions should be determined for all types of deterioration found during an inspection. It is bad practice to sim-ply repair defects that are found: the cause of any defect should be identified and assessed be-cause the need to eliminate its source may well affect the design and execution of the remedial works. Thus it is unreasonable to repair a crack before its origin has been determined: cracks due to overloading will reopen after repair, and filling cracks produced by thermal actions may lead to more extensive damage to the structure.
4.3 TYPES OF DEFECT
4.3.1 General
The condition of a highway structure can be detrimentally affected by various factors. These may act singly or in combination to generate functional, load-carrying and long-term durability prob-lems.
4.3.1.1 Design Defects and premature deterioration can result from: • inadequacies in the design approach or material specifications; and • inadequate detailing of particular parts of a structure (for example, short drain pipes under a
bridge deck can lead to wetting and subsequent degradation of the concrete surface).
4.3.1.2 Materials The use of sub-standard or inadequate materials can produce under-strength structures and in-crease expenditure on remedial works. Defects and deterioration may arise where: • the properties of the materials are untested, unknown or not well understood at the time of con-
struction (for example, the use of high alumina cement (HAC) in certain environments, or the use of reactive aggregates which can lead to alkali-silica reaction (ASR)); and
• poor quality control was exercised during construction (for example, the placing of sub-standard concrete; inadequate compaction etc.).
4.3.1.3 Construction Many problems of durability stem from poor construction practices. A common problem with concrete structures is inadequate cover to the reinforcement. The evidence of this may not be immediately evident but it will show itself with time through the corrosion of the reinforcement: an early sign is the appearance of the outline of the reinforcement mesh on the surface of the concrete: this print is produced by colour variations generated by vibration of the fresh concrete. Other defects at the construction stage include: honeycombing due to poor compaction or ag-gregate grading; cracking due to differential settlement of the falsework; and blow-holes due to air being trapped against the shutter.
4.3.1.4 Loading Defects due to in-service loading can take many forms. Excessive deflection of a bridge deck can be generated by higher than anticipated live loads and through a reduction in the load-carrying capacity of the structure. Excessive deflections of prestressed superstructures can result from the
COST 345 Final Report
50
use of prestressing reinforcement with a higher relaxation than assumed in design. Outward dis-placement of abutments or retaining walls may result from higher than anticipated lateral earth pressures (sometimes in combination with pore water pressures) or ground movements - due to the settlement of the foundations for example. Impact loads from vehicles, ships, or floating de-bris and ice can severely damage the supports and superstructure of bridges and other types of structure. Loading due to natural causes, such us flooding, earthquakes, landslides, rockfalls and fire can also damage structures: this damage may be evident many years after the event.
4.3.1.5 Environmental conditions Environmental conditions can promote structural instability as well as severe and chronic ser-viceability problems. Many types of defects and deterioration processes, such as ASR, exhibit characteristic visual patterns on the exposed surface of a structure: such patterns can give valu-able information about defects themselves, including their nature and cause. The time at which traces become visible can vary from a few hours (for plastic shrinkage and settlement cracking of concrete) to several years (for cracking in concrete through long-term drying shrinkage and ASR; fatigue cracking in steel structures; rotting of timber structures; erosion of riverbanks and scour of foundations). For a reliable condition assessment to be made it is essential to have records on the initiation of defects and deterioration processes and their propagation with time. Such re-cords seldom exist for older structures, but for new structures it is advisable that records are maintained from construction onwards.
4.3.1.6 Categorisation To track or assess the rate of deterioration of a structure, defects should be graded with respect to their nature, intensity and extent. Gradation should be in a manner that fits the type of dam-age, the cause of the damage, and the material forming the structural element. It is important that as much information as possible on those defects that affect the condition, functionality, du-rability and load-bearing capacity are included in the catalogue for the structure. Such catalogues are useful for training: they help inspectors make reliable judgements regarding defects and dete-rioration processes, the cause(s) of these processes and their likely rate of propagation, and on the selection of remedial works.
4.3.2 Review of defects
The WG2 and 3 report (COST, 2004b) identified and described the most commonly found de-fects on structural elements of highway structures, and then went on to look in more detail at specific defects for concrete, metal, masonry, and timber structures. A brief summary is provided below.
4.3.2.1 Common defects Commonly found defects of structural elements are: • Erosion - the wearing away of soil by water or, less commonly, wind. • Abrasion - the wearing away of a surface, most commonly by the action of airborne or water-
borne particles. • Deformation - a blanket term covering a change in shape or alignment from the as-built position
(see Figure 4-1) which includes: Buckling - a permanent change in the alignment of an element due to compression forces. Mechanical damage - a localised change in the shape of an element: this is usually generated
by impact forces. Distortion - usually associated with sagging and warping of masonry structures.
COST 345 Final Report
51
Figure 4-1 Deformation of a superstructure due to undermining of a pier by scour
• Deflections – these can be generated by loading, creep movements, and material degradation. Visi-ble signs of excessive deflection are sagging at the centreline of a bridge span, flexural cracking and ponding on the overlying pavement.
• Movements - excessive vertical movement of supporting structures (such as abutments, retaining walls and piers) can be generated in various ways, such as through faults in the design or construc-tion of their foundations. Settlements can be uniform or differential: the latter generates far more serious problems than the former (see Figure 4-2).
Lateral movements can be generated by the settlement of the foundation; excessive earth pres-sure - see Figure 4-3; failures of earthworks adjacent to a structure; water pressures produced by inadequate or blocked drains; and by changes in the strength or degree of consolidation of the subsoil or backfill. • Scour - the erosion of the riverbed under or adjacent to the foundations of a supporting structure
such as a bridge pier (see Figure 4-1). • Weathering - frost, rain, sunlight and air pollution can all affect the condition of the surface of a
structure, and the performance of exposed polymeric components. • Wetting - this can lead to the deterioration of concrete and steel structures, particularly where the
water is contaminated with aggressive agents, such as de-icing salts.
Figure 4-2 Deterioration of the construction joint between the roof and side wall of a concrete box structure due to differential movement
COST 345 Final Report
52
Figure 4-3 Bulging of a masonry abutment due to excessive earth pressure
• Efflorescence - the crystallisation of salts brought to the surface by moisture. It is commonly found on concrete and masonry structures (see Figure 4-4) and generally takes the form of a hard crust or surface coating.
• Vegetation - this can establish itself within cracks and joints in concrete and masonry structures. Moss and grass tend to trap moisture so that surface pores remain saturated even in dry condi-tions. Roots can lead to the disintegration of a concrete surface and widen cracks and joints in masonry structures.
• Freeze-thaw - the expansive pressure generated by the freezing of water in the pores or capillaries of a material can lead to widespread and intensive deterioration. Both concrete and masonry structures are prone to freeze-thaw damage. Particularly severe damage can be generated in the presence of de-icing salts: the application of such salts can lead to a sudden drop in surface tem-perature during thawing and thereby induce large internal stresses close to the surface (see Figure 4-5).
• Collapse - the consequence of a loss of load-bearing capacity or structural integrity. It can be pro-moted by external forces such as the impact of vehicles, rockfalls, avalanches, floods, overloaded vehicles, and by material deterioration.
Figure 4-4 Efflorescence on steel girders due to leakage through concrete deck
COST 345 Final Report
53
Figure 4-5 Freeze-thaw damage of a footway aggravated by the action of de-icing salts
4.3.2.2 Concrete The defects associated with concrete are: • Cracking - in essence, cracks are either structural or non-structural in character. Non-structural
cracking can occur before or after the material has hardened: with the former, cracking may be due to drying shrinkage; with the latter to corrosion of the reinforcement, freeze-thaw effects, temperature variations, and ASR. Structural cracking can occur through over-stressing of the ma-terial or through ground movements, as shown for example in Figure 4-6.
• Reinforcement corrosion - the electro-chemical process by which the cross-section of steel reinforce-ment is reduced either reasonably uniformly or locally (that is, through pitting). The most com-mon cause of corrosion is the presence of chloride ions - these are usually derived from de-icing salts; chloride-ion promoted corrosion is often characterised by a localized and rapid loss in sec-tion; that is, pitting. As shown in Figure 4-7, corrosion can substantially reduce the load-carrying capacity of a structural element.
• Honeycombing - this can be produced by inadequate grading of the mix and/or poor compaction, both of which produce voids and segregation of the aggregate from the cement paste.
• Inadequate cover - this can occur through poor detailing or construction practices. Its effect may not be noted for sometime.
• Scaling - the gradual but continuous loss of the surface of a structure. • Spalling - this occurs as a localised depression on the surface of a structure. It can be caused by
corrosion and by frictional forces generated by thermal movements. Where unchecked, spalling can lead to the exposure of the reinforcement in concrete structures.
Figure 4-6 Cracking of a tunnel portal and vault due to foundation instability
COST 345 Final Report
54
Figure 4-7 Broken wires of a corroded tendon
• Delamination – this occurs when concrete layers separate at or near the outermost layer of the re-inforcement. It can be generated by corrosion of the reinforcement, and by freeze-thaw cycles. It usually occurs when reinforcing bars are closely spaced and/or where they are installed at too great a depth from the surface of the concrete.
• Disintegration – this is a process where the concrete deteriorates into fragments and then into small particles. It can be initiated and promoted by weathering, corrosion, erosion and chemical attack.
• Alkali-silica reaction - this occurs when alkaline pore water in the cement paste reacts with minerals present in some aggregates to form a calcium alkali-silicate gel. In taking up water from the pores, the gel expands and disrupts the concrete. The typical crack pattern of ASR is shown in Figure 4-8.
• Breaking-away – this is usually the consequence of impact forces, or temperature effects where the gap between adjacent elements is too small to be sustained without an adequately designed joint.
• Deterioration of protective coatings - coatings can deteriorate due to poor application practices and en-vironmental effects - such as ageing, efflorescence, and weathering.
• Damage to mortar coatings - concrete elements are sometimes provided with a mortar coating. Through ageing, temperature and other effects such coatings tend to crack, disintegrate and spall.
• Stratification - this is the separation of concrete into horizontal layers with the increasingly lighter material displaced toward the top. It can result from placing over-wet or over-vibrated concrete, and from placing over-thick lifts of concrete with or without adequate compaction between them.
Figure 4-8 Cracking of a concrete wing wall due to ASR
COST 345 Final Report
55
4.3.2.3 Structural steel, aluminium, cast and wrought iron The defects associated with these are: • Fatigue cracking - this can occur in steel and aluminium structures through cyclic loading. It can also
be initiated by stress-corrosion - particularly in steel elements subject to both tension and cyclic stresses, and by hydrogen embrittlement.
• Fracture cracking - this can be generated by stress or strain concentrations and by low in-service temperatures: it is often triggered by a sudden increase in load.
• Corrosion - this can be initiated and promoted in a number of ways; the main ones are: environmental corrosion - this primarily affects metals in contact with soil or water stray electric currents - primarily in the vicinity of electric rail lines stress corrosion cracking - due to cyclic stresses galvanic corrosion - where electrically incompatible metals are connected together crevice corrosion - where moisture is present in cracks/gaps between components bacteriological corrosion - promoted by organisms, such as sulfate-reducing bacteria.
As shown in Figure 4-9, corrosion can seriously reduce the strength of structural members.
Figure 4-9 Corroded steel superstructure
4.3.2.4 Stone and brick masonry The main defects are: • Scaling, spalling and delamination - Scaling is the gradual and continuous loss of the surface of a
structure; it can affect both stone and brick masonry. Spalling is a localised depression at the sur-face of a structure: it occurs where the outer layers of masonry break off in parallel layers from the parent blocks. Delamination occurs when the outer surface of masonry splits into thin layers and peels off the surface.
• Falling-out of units - masonry blocks can be dislodged from structures due to the disintegration of mortar and movements of the structure.
• Cracking - cracks are usually found in combination with some form of deformation (such as set-tlement, tilting, and buckling). Longitudinal cracking between a spandrel wall and the arch barrel of a bridge is a common problem, see Figure 4-10. Due to the loss of mechanical bond between adjacent rings, cracking can occur as ring separation.
• Friability - the tendency of some stone, e.g. sandstone, to break up or powder. • Disintegration of mortar - mortar can disintegrate due to ageing, weathering, temperature variations,
moisture, freeze-thaw, and chemical reactions with percolating water.
COST 345 Final Report
56
• Detachment - the detachment of brick and stone units or panels can occur through the failure of construction joints or structural joints and also through the loss of mortar from a structure.
• Corrosion of metallic connectors - in masonry structures this can be promoted in the presence of moisture - particularly where it is contaminated with aggressive ions. The rupture of ties can lead to substantial deformation or even the collapse of a superstructure.
Figure 4-10 Cracking of a spandrel wall of a masonry arch bridge
4.3.2.5 Timber Timber can deteriorate as a result of splitting (due to loading and weathering), decay (due to fungi and other organisms that use woody tissue as food), deterioration of impregnants, and corrosion of nails, bolts etc. Note that some timber preservatives can be aggressive to metallic components. Elongated bolt holes are another problem – these can develop in timber that has insufficient bearing capacity, or from incorrectly positioned or formed drill holes. The consequence can be the unequal distribution of load among a cluster of bolts.
4.3.2.6 Asphalt pavement Defects in pavements can take the form of: • Cracking - the most common causes are temperature changes, shrinkage upon cooling, dynamic
loading, discontinuities in the construction, and settlement of the subgrade. Cracks can take vari-ous forms including longitudinal, transverse and sets of intersecting diagonal cracks (‘alligator’ cracks).
• Plucking-out of aggregate - the aggregate within an asphalt matrix can be lost in-service due to inade-quate binding action and/or weathering of the binder.
• Tracking - this can develop through the use of inadequate materials, poor construction practices, in-service conditions - particularly the passage of heavy wheel loads, and the ageing of the pave-ment material.
4.3.2.7 Waterproofing membrane Membranes can fail due to the use of inadequate materials, poor application (i.e. during bad weather or on inadequately prepared surfaces) as well as excessively high wheel loads and tem-perature variations. Also, inadequate detailing of the membrane around pipes etc. can lead to leakage - which in turn can lead to localised and severe deterioration.
COST 345 Final Report
57
4.3.2.8 Bonded plates The bond between a metallic or plastic plate and the underlying substrate can be lost where stresses in the anchorage zones are too high and the plates have not been provided with adequate mechanical anchorage devices. Debonding can occur where the inherent strength of the adhesive is too weak to resist the stresses or it has not been applied properly; for example, through inade-quate preparation of the substrate.
4.3.2.9 Deterioration of sealants Sealants tend to deteriorate due to their inherently poor resistance to weathering, through inade-quate adhesion to the substrate, and ageing. The evidence of deterioration can be seen from the initiation of cracks, and their propagation, and the disintegration of the material.
4.3.2.10 Vandalism This includes graffiti; broken sign posts, lamps, and drain pipes; and the removal of elements such as traffic signs and the components of safety fences. The presence of bullet holes (see Figure 4-11) from vandalism (or armed conflict) must be taken into account.
4.3.2.11 Deposits behind piers Floating objects such as branches, small trees etc. can be caught behind bridge piers. The build-up of such debris may increase the loads on a pier and on its foundations. The build-up of sedi-ment and timber in the vicinity of a bridge can reduce the clearance under the bridge, which in turn can change the water flow characteristics and lead to flooding.
Figure 4-11 A bullet hole in a steel structure
4.4 INSPECTION
4.4.1 Introduction
The reasons for inspecting a highway structure are: • to confirm that the structure is fit for purpose, and will remain so in the immediate future - that
is, the rate of deterioration is acceptably low; • to identify any obvious defects or instances of misuse, such as vehicle overloading, that may af-
fect the safety of the public using the structure; and • to establish plans and estimates for undertaking remedial works.
COST 345 Final Report
58
These are achieved by observing and recording the condition of a structure and when necessary providing appropriate information to an engineer to enable decisions to be taken on the timing and type of the remedial works. Thus the aims of an inspection include: • detection of defects and signs of structural distress; • determination of the occurrence, extent and cause of material degradation; • detection of changes in use that can affect safety and/or durability; • evaluation of the effectiveness of various repair techniques; • provision of information for assessing load-carrying capacity; and • determination of the condition of a structure, or of particular elements of one - the use of the
results of an inspection to determine a condition rating is covered in 4.7.
Inspections may involve: • a visual examination of the structure; • in situ tests and/or sampling and laboratory tests; • the use of access equipment; • traffic management works; and • the completion of standard forms and/or the production of a report.
Various inspection procedures and techniques have been devised and implemented for bridges in dif-ferent European States. The main differences between them lie in the definition of a bridge, the scope and intensity of the investigation, and the time-interval between the inspections. The WG2 and 3 report (COST, 2004b) reviewed the inspection procedures used in the States participating in COST 345, recommended improvements to these practices, and identified research needs. The review found that inspection procedures have only been developed for bridges, but in some States the procedures have been adapted and implemented for other types of highway structure.
4.4.1.1 Safety Inspections of highway structures carry an element of risk and so in planning an inspection the safety of the users, inspectors and, on occasions, the structure itself must be considered. A risk assessment may be undertaken prior to an inspection.
4.4.2 Current position
4.4.2.1 Inspection procedures A summary of the procedures used in a number of European States and in the USA is given in the following. The inspection procedures used in most countries generally follow those described in the OECD (1992) report. This recommended three basic types of inspection - Superficial, Principal and Special - but, in practice, Principal is commonly sub-divided into General and Ma-jor categories. Although, for each type of inspection, there is a good deal of commonality in the procedures adopted in various countries there are differences, for example, in the frequency of the inspection and the details of the investigation. • Superficial Inspection. This is usually carried out by maintenance personnel who do not have
any specialised knowledge of highway structures. It may be little more than a cursory check and can be undertaken from ground, deck level or from a platform built into a structure. The aims are to assess the overall condition of the structure, to note any changes in condition, and to identify major defects on and around the structure that may represent a hazard to the public or lead to high maintenance costs. In some States, this type of inspection is undertaken annually, but in most it is undertaken continuously (or effectively so) by road maintenance personnel.
COST 345 Final Report
59
• General Inspection. This comprises a visual examination of all parts of the structure that can be accessed without specialised equipment. The aims of the inspection are to detect all defects that can be seen from the ground, and to evaluate the condition of the structure. The inspection is undertaken by technicians who may have had some formal training in structural pathology, but training on the job is also commonplace. Qualified or experienced inspectors may be required for particularly complex structures. The recommended frequency of this type of inspection is two to three years - provided that Superficial Inspections are also undertaken. The results of the inspec-tion should contain, where necessary, a description of the defects and recommendations for a more detailed inspection.
• Major Inspection. This comprises a close visual examination of all the accessible parts of the structure and adjacent earthworks and waterways: in some States it may include a limited pro-gramme of tests. Specialized equipment or facilities may be required to enable the inspector to get close enough to the structure. In some States the examination has to be completed from touching distance, but others allow the use of cameras with zoom lenses. The complexity and condition of the structure govern the scope of the investigation. An engineer, adequately trained in structural pathology, should undertake or manage the inspection. The recommended frequency of this type of inspection is five to ten years, but a longer interval may be adopted according to factors such as structural condition, load-carrying capacity, deflections, settlement and joint openings. The re-port of the inspection should provide, as necessary, details of all defects observed, an assessment of the condition of the structure, and recommendations for further inspections and remedial works. The extent and severity of defects should be described in sufficient detail to enable the en-gineer to derive an estimate of the cost of any remedial works. The opportunity should also be taken to identify poor construction details.
Specific types of Major Inspections, such as Acceptance and Guarantee Inspections, are used in some States. An Acceptance Inspection is carried out on a new structure before it is opened to traffic (the purpose is to identify and record any work that is still outstanding under the contract), and on an in-service structure before responsibility for it passes to the Maintaining Agent. A Guarantee Inspection should be carried out before the end of the guarantee period. • Special Inspection. This is performed where there is a perceived need for detailed information.
It may involve an investigation of a particular defect found during an inspection of the structure or of other similar structures. (A recent example of the latter is the inspection of the tendons in post-tensioned concrete bridges in the UK.) Inspections are also undertaken on structures that are deemed to require regular monitoring: these include cast iron structures, those strengthened by bonded plates, those with traffic restrictions, and those required to carry an abnormally heavy load. Such an inspection may also be undertaken following some unusual event that can affect the performance of the structure. These events include flooding - where foundations are at risk from scour, an earthquake, a landslide, a major accident, and a chemical spillage or fire in the vicinity of the structure. Although an inspection can be carried out on the whole structure, it is usually un-dertaken on some particular component or element (see Figure 4-12), and it usually involves on-site measurements and laboratory tests.
4.4.2.2 Reporting and acting upon the findings of an inspection As described above, the defects revealed during a Superficial Inspection are reported to an engi-neer so that appropriate action can be taken. However, if during an inspection it is clear that the severity of a defect puts the safety of users at risk, an inspector can propose or put in place im-mediate measures such as a load restriction, propping of the superstructure, or even closure of the structure. Such measures should remain in place at least until a second opinion or a further, perhaps more detailed, investigation is undertaken.
COST 345 Final Report
60
Figure 4-12 Special Inspection of a pier
The findings of more detailed types of inspection are usually recorded on standard forms al-though some authorities use electronic data capture devices. Such forms usually include a check list of structural items to be inspected, such as foundations, piers or columns, abutments, retain-ing walls, embankments, fenders, bearings, beams, diaphragms, concrete slabs, waterproofing, sur-facing, and expansion joints. The input data include basic information such as the reference number and/or name of the structure, the date and type of inspection, and an assessment of the condition of the structure. Defects should be described in terms of their location, extent and se-verity; recommendations may also be given on the type and priority of any remedial works.
In addition to the standard forms, detailed reports are often compiled for Principal and Special Inspections: usually these would give an assessment of the condition of the inspected elements. As a necessary background, such a report would usually include text and drawings describing the form of construction and details of the structural components, such as the deck, supports, ar-ticulation, and deck ancillaries (which include expansion joints, waterproofing, and parapets). It may also include the maintenance history of the structure and the findings of previous inspec-tions.
The findings of an inspection can be used to derive a condition rating for the structure as a whole or for particular elements of one. One of the aims of undertaking periodic inspections is to assess the condition of the stock of structures, and this requires a suitable method for evaluat-ing the data from a suite of inspections. A method of ranking the ratings will help in prioritising the remedial works.
4.5 INVESTIGATIONS
4.5.1 Introduction
To obtain sufficient information to enable the most appropriate maintenance strategy to be se-lected, visual inspections are often supplemented by testing. A wide range of approaches is avail-able, including sampling followed by laboratory-based tests to determine particular material prop-erties, non-destructive methods for detecting hidden defects, site monitoring to determine the change in the condition with time, and on-site loading tests. The report of WG2 & 3 provides an
COST 345 Final Report
61
overview of the initiation and role of testing and goes on to review sampling, non-destructive testing, loading tests and monitoring. A brief summary is provided below.
4.5.1.1 Initiation and role A programme of tests usually forms part of one of the following activities: • Inspection - the requirements for such tests are described in 4.4. • Assessment of load-carrying capacity – these can include tests to verify the form of construction
and the dimensions of the structure, and to determine the nature and condition of the structural components. An on-site load test can be used to determine structural behaviour, which can be compared to the model used in design: further details are provided in #.#
• Remedial works - tests can be undertaken to determine the extent and cause of material deterio-ration, and thereby help to identify the type of work required.
4.5.1.2 Types of test Various types of test can be undertaken. Some provide information on the overall behaviour of a structure whereas others only cover a particular component or element: some can be applied on a one-off basis but others can or have to be repeated periodically.
4.5.1.3 One-off tests In general, one-off tests provide data on a structural detail, such as the depth of cover, or on a specific material property: in many cases this is all that is required. A one-off test may be used to supplement a visual inspection, provide information on a defect detected during an inspection, or form an integral part of a Special Inspection.
4.5.1.3.1 Assessment
One-off measurements are often undertaken as part of an assessment of load-carrying capacity. This involves an inspection as well as analysis. The former provides information for calculating both the applied loads and the structural resistance. The information includes the dimensions of the structure (obtained from a geometric survey) and the density of the materials: in combination these provide an estimate of the dead loads and the superimposed dead loads. It also includes measurements for determining the strength of structural elements: this includes details such as the location and extent of cracks, defective materials, and structural damage; the location and se-verity of corrosion etc.
There is a hierarchy of assessment methods. Starting from the simplest, the complexity of the method is increased until the structure is shown to be adequate - or it becomes clear that the structure is indeed inadequate. The more complex the method, the more detailed the investiga-tion and associated test programme.
Determining material properties from on-site tests and/or sampling and laboratory-based tests can justify an increase in the material strength used in an analysis, and thereby increase the as-sessed load-carrying capacity. However, care is necessary in collecting and interpreting the data and a large sample size may be required to ensure the reliability of the assessment.
4.5.1.3.2 Deterioration
Where deterioration has been noted during an inspection, one-off tests may be used to obtain in-formation that can help to identify the most appropriate course of action. There are numerous factors that need to be considered when planning a test programme. For example, some deterio-ration mechanisms are affected by the microclimate; thus in-service conditions on the leeward
COST 345 Final Report
62
side may differ from those on the windward side etc. It would seem necessary to undertake tests in areas where deterioration is most likely to occur, but these are not necessarily the most readily accessible parts of a structure. The supervising engineer, perhaps acting in conjunction with a test house, has to select the types of test and identify the most appropriate sites for sampling and/or on-site tests.
4.5.1.4 Periodic/continuous monitoring Repeated measurements allow the condition of a structure can be monitored over time. The main reasons for monitoring the performance of a structure are, in brief: • to check its behaviour during construction; • to help direct the management of its maintenance; • to check that there is no further loss in capacity or utility (that is, strength or serviceability); • to confirm the stability and serviceability of a structure that has a load-carrying capacity below
that required by current standards but which is not showing signs of distress.
The frequency of measurement depends on what is being monitored, the rate at which this may change and the effect this change may have on the performance of the structure. For example, it may be appropriate to measure chloride-ion concentrations during Principal Inspections (i.e. at 6 to 10-year intervals) whereas crack widths may be may be measured on a weekly basis, and some measurements, such as acoustic monitoring, can provide near-continuous information.
4.5.1.5 Interpretation and application Following, or even during, the test programme there are two stages to complete: firstly the valida-tion and evaluation of the results of a test, and secondly an assessment of the implications of all the test results, on the stability of the structure for example.
In many cases the first stage is relatively straightforward and it is only necessary to ensure that the tests have been carried out to the appropriate standards and that the data are consistent and reliable. For example, concrete strengths, chloride ion concentrations, and depths of carbonation can be re-ported as measured. However the results of surveys and some types of test require interpretation - sometimes by a specialist: these include a ground-penetrating radar survey, a radiographic survey, and a half-cell potential test. In these cases a test house will usually produce an interpretative report.
The test data are commonly used as input to a calculation - for example, measurements of con-crete strength in determining load-carrying capacity. The results of a survey may help to define what action is required - for example, a radiographic survey will show the extent of the voids in a post-tensioning duct.
4.5.2 Semi-destructive tests
A structure can be damaged by on-site tests and also through the recovery of samples for labora-tory-based tests. The elements and areas affected by such operations and the severity of the ensu-ing damage vary according to the type of on-site test and the method used to recover the sam-ples. It is usually necessary to undertake on-site tests or take samples from all areas where dete-rioration has occurred, or where it is thought to have occurred. To provide a reference, testing and/or sampling should be undertaken at locations that show no signs of deterioration. Exam-ples of destructive operations are given in the following.
4.5.2.1 Concrete structures
• Taking cores for laboratory-based tests to measure physical and chemical characteristics;
COST 345 Final Report
63
• Taking cores or cutting slots to determine the in situ stresses in concrete; • Drilling access holes to inspect the conditions within a post-tensioning duct; • Removal of the concrete cover :
to determine the cross-section of the reinforcement or the condition of a tendon, for access to determine the stress in a tendon - this is done by measuring the strain re-
leased by cutting a wire, and to obtain samples of concrete and/or the reinforcement - to determine, for example,
chemical composition and/or mechanical properties; and • Undertaking on-site tests - damage can be generated by undertaking some tests; for example us-
ing impact hammers and the Windsor probe (ASTM, 2003). Check bullet level
4.5.2.2 Steel structures
• Taking samples for determining the mechanical characteristics, chemical composition and the susceptibility of material to fatigue and/or brittle failure;
• Drilling holes or cutting slots to determine the in situ stress regime; and • Taking samples for investigating the competency of welds.
4.5.2.3 Masonry structures
• Sampling to determine the mechanical properties and chemical composition of the masonry units, mortar, and fill materials;
• In situ measurements of the strength of the masonry; and • On-site tests and/or sampling to determine the strength of any anchors, ties or fixings.
4.5.2.4 Timber structures
• Taking specimens for investigating the mechanical properties of the wood and fixings and the re-sistance of the wood to decay; and
• Coring to determine the depth of decay or the depth of fire damage.
4.5.2.5 Soils and fills Where ground conditions have to be investigated as part of a structural assessment, care should be taken to ensure that (a) the samples are representative, and (b) sampling disturbance will not significantly affect the outcome of the test(s). In most cases it is necessary for the test data to be interpreted by appropriately qualified and experienced personnel.
General requirements for site investigations are described in Eurocode 7 DD ENV 1997-2. De-sign assisted by laboratory testing, and DD ENV 1997-3. Design assisted by field-testing (British Standards Institution, 2002b).
Laboratory tests are commonly undertaken to determine the following characteristics of soils: • identification and classification tests (e.g. water content, bulk density, particle density etc.); • shear strength (triaxial compression tests, direct shear tests, vane tests etc); • compressibility - of clayey soils (oedometer test); • permeability; • chemical composition (organic content, carbonate content, pH value etc.); and • compaction characteristics - as described by the dry density/moisture content relation.
Laboratory tests are also undertaken to determine the properties of rocks, such as:
COST 345 Final Report
64
• material classification; • strength - through uniaxial compressive strength tests and point load tests; • shear strength of seams and joints; and • swelling characteristics.
The following are commonly undertaken as part of an on-site investigation: • penetration tests, which involve driving or pushing in a solid cone or open-ended tube; • pressuremeter tests - to determine, for example, the stress regime in the ground; • dilatometer tests - again, a variety of equipment and procedures are used; and • permeability tests.
4.5.3 Non-destructive tests
4.5.3.1 Introduction Where the cause and extent of a defect cannot be determined through a visual inspection, addi-tional investigations may be undertaken and these would usually involve non-destructive or semi-destructive tests. Thus the existing guidelines on assessment must be able to take account of the information derived from NDT. The WG2 and 3 report (COST, 2004b) provides details of the range of NDT techniques used; a brief summary is provided below.
4.5.3.2 Mechanical methods
• Schmidt hammer - this is used to determine the hardness of the upper 30mm or so of concrete. Its main use is for mapping variations in concrete properties.
• Falling weight deflectometer - this is usually used for testing pavements. It comprises a standard ‘weight’ which is released from a known height onto a contact plate. Sensors record the deflection of the pavement, and the data are processed to determine the thickness of the component layers and to provide a qualitative measure of the overall condition of the pavement.
• Mechanical gauges - these are used to measure small movements between relatively close refer-ence points. The points are bonded to the surface of a structure and a gauge fitted between them. Such gauges are mainly used to monitor the width of a crack.
4.5.3.3 Electro-magnetic methods
• Ground penetrating radar - this is used to determine the internal details of a structure. Typical appli-cations of GPR are:
investigating the form of a structural element - for example, the number and thickness of various layers and the location of reinforcement;
detecting variations in the composition and condition of concrete - for example to iden-tify areas having a high moisture content;
detecting cracks and areas of delamination and honeycombing in concrete structures, and ring separation in masonry structures;
determining the location of reinforcements; and determining the location and/or condition of buried objects, such as foundations, service
lines, pipes, anchors, ties, and connectors. • Infrared thermography - as the temperature of a structure changes thermal gradients are set up within
it. Dry or water-filled features such as cracks, delaminations, and discontinuties affect the transfer of heat through a structure, and their presence may be identified by measureing variations in the temperature of the surface.
COST 345 Final Report
65
• Radiography - gamma radiography can be an effective means of determining damage within thin, lightly reinforced structures, and is of particular value for locating voids and determining the condition of reinforcements, prestressing tendons contained in ducts, and the external cables of suspension and cable-stayed bridges. X-ray radiography can be used to detect defects, such as pores and slag inclusions, in welds and steel castings. It can also be used to detect planar features, such as cracks, but the ease of detection depends on the orientation of the feature.
4.5.3.4 Acoustic methods Acoustic test methods are those based on the transmission and reflection of stress waves through the test piece. They are used to determine the properties of the material (based on measurements of the speed of propagation) and to locate and identify discrete buried objects or features - from reflections of the stress wave.
4.5.3.5 Electrical and electrochemical methods
• Half-cell potentials - corrosion is an electrochemical process and so it may be possible to detect or monitor its occurrence through measurements of electrical potential. A half-cell - such as a cop-per-copper sulfate half-cell, can be used to measure the potential difference between the surface of a concrete structure and the embedded reinforcement. Although the data may indicate of the occurrence of corrosion, they do not provide an indication of the rate of corrosion.
• Resistivity - the resistivity of a material is affected by the presence of moisture within its pores. Thus resistivity measurements on concrete may provide an indirect means of assessing the likeli-hood, extent, and rate of corrosion of the embedded reinforcement. They can also be made to determine the permeability and effectiveness of a seal coat applied to a concrete surface.
• Polarisation Resistance - this can be used to estimate the instantaneous corrosion current (Icorr) within reinforcements, and thereby assess the rate of degradation of the structure. However the tech-nique does not provide information on the loss in cross-section of the reinforcement - at present this can only be assessed by visual observation.
• Eddy currents - changes within the structure of a steel element can be detected by the perturbations they create in an electrical field induced in the element. Thus the presence of cracks and voids in welds and plates may be identified from an examination of such perturbations.
4.5.3.6 Magnetic methods
• Cover meters - several portable devices, known as cover meters, are available for measuring the thickness of the concrete cover to the embedded reinforcement. In such devices a magnetic field is generated between the two poles of the probe: the intensity of the field at a point is propor-tional to the cube of the distance from the faces of the pole. The magnetic field is distorted in the presence of a conductor, such as steel reinforcement, and the degree of distortion is a function of the bar diameter and its distance from the probe. Thus the device can be used to provide a measure of the depth of cover and the diameter of the reinforcement. The devices provide rea-sonably accurate data for lightly reinforced elements, but they may not do so for heavily rein-forced sections.
• Flux measurements - in this technique, steel elements are magnetised by an applied field. Local dis-turbances to the field are produced by a change in the cross-section of the steel element, such as at a wire break, and the disturbance is accompanied by a leakage of magnetic flux from the ele-ment; that is, the generation of a stray field. The technique is commonly used to examine the post-tensioned cables of suspension and cable-stayed bridges.
• Particle examination - With this technique, the part of a steel structure being examined is placed in a magnetic field and a fine powder of iron particles is blown onto its surface. In the absence of any
COST 345 Final Report
66
surface or subsurface discontinuities, the particles will form a uniformly aligned film. However, in the presence of a discontinuity the alignment of the particles will map the disturbance created in the magnetic field.
4.5.3.7 Modal analysis The resonance characteristics of a structural component are affected, to some degree or other, by the presence of a defect located anywhere within it. Thus an analysis of the resonance spectra can be used to complete a global, or at least a regional, assessment of integrity and condition; that is, a health check. There are two options for generating resonance in the component. A forced vibration test uses a controlled and measured input to determine the dynamic behaviour of the component, whereas an ambient vibration test makes use of the unknown and unmeas-ured input generated in-service, such as by traffic loading.
4.5.3.8 Laser scanner Laser scanners provide a high-resolution image and the data can be captured in digital format. Analysis of the images can detect the location of near-surface cracks, cavities and water leaks. Detailed maps showing the location of specific features can be produced from such images.
4.5.3.9 Summary of applications Table 4-2 and Table 4-3 summarise the applications of some NDT methods.
4.5.3.10 Combination of methods In some circumstances, the reliability and usefulness of the data derived from NDT can be im-proved by using a combination of tests. Typical examples are as follows. • A cover meter might be used to locate the reinforcement prior to recovering cores. • Magnetic techniques may be used to map out zones that have a high risk of corrosion, followed
by resistivity tests in these zones to determine the likelihood of corrosion. • A combination of tests can be used to measure the same property and thereby increase the level
of confidence in the data and its interpretation; for example, the prediction of strength using a combination of Schmidt hammer and ultrasonic tests.
• An improvement in the calibration or interpretation of the test data can be obtained by combin-ing the results of different tests; for example, the accuracy of predictions of strength may be im-proved by taking account of measured variations in density.
1 - water-filled 2 - capability largely dependent upon depth of burial 3 - performance dependent upon whether duct is plastic or metal + good medium – poor
4.5.4 Loading tests
4.5.4.1 Introduction The origin of load testing comes from the need to check the performance of a bridge prior to its commissioning. National policies and practices vary widely (detailed background information is given in the WG2 and 3 report (COST, 2004b)) but there are two basic approaches:
(a) In some States, load testing forms an important part of an investigation into the performance of a bridge: beginning with an acceptance test on a newly erected or substantially rehabilitated bridge, through to assessing the load-carrying capacity of old and perhaps deteriorated struc-tures. The prevailing view here is that load testing is cost-effective. It can indicate a much higher live load capacity than derived from calculations alone, and thereby enable a bridge to remain in service and avoid unnecessary expensive strengthening or replacement works.
(b) In other States a loading test would only be permitted in exceptional circumstances. The view here is that an adequate measure of stability can be obtained from a combination of an inspection and analysis. Furthermore, it is thought that undertaking a test to determine load-carrying capacity may damage the structure.
4.5.4.2 Test loads The principal test variable is the magnitude of the applied load. Usually it is either related to the characteristic load, or is calculated on the basis of the effect that the load would have on the structure; but it may also be based on the expected day-to-day in-service load.
The type and distribution of the load have also to be considered. A bridge can be loaded with static and/or dynamic loads. Usually, static loads would be applied through loaded heavy goods vehicles. Dynamic loads are usually applied using loaded goods vehicles: the dynamic load is mainly a function of the speed and weight of the vehicle, but it is also affected by the characteris-tics of the vehicle suspension and the unevenness of the road surface. Other methods for apply-ing dynamic loads have included dropping weights, moving weights along a bridge, rotating weights, the use of hydraulic jacks to apply cyclic loads, impact loading, and the deliberate excita-tion of footbridges by pedestrians
4.5.4.3 Types of investigation and methods of measurement These are much the same in all States.
COST 345 Final Report
68
Type of investigation: • visual examination - before and/or during and/or following a load test; • measurements made during a test, e.g. applied load, deflection of span, displacement at supports,
strain/stress, width of cracks; and • secondary effects - such as temperature, and exposure to sun and wind conditions.
Variables measured and the methods of measurement: • applied load (using load cells, pressure cells); • deflection/displacement (using dial gauges, inclinometers, accelerometers - for dynamic loading,
electronic distance measuring devices, lasers, photogrammetry etc.); • strain (using vibrating wire gauges, electric resistance gauges); and • temperature (using thermocouples).
Further details of the observations and measurements made during a loading test, and of the methods of measurement are provided in Tables AIV-6 and AIV-7 of the WG2 and 3 report.
4.5.4.4 Analysis and application of test data In some States, the data from a load test are used to compare the measured and calculated responses - usually it would include a comparison of deflections. Other States have no standard assessment crite-ria, and analysis is an integral part of the test procedure: analysis is undertaken to ensure that the ap-plied load is unlikely to generate any permanent deformation or damage. The results from a load test are mainly used to improve the structural model used for assessment purposes.
The assessment criteria and the approaches used to analyze the test data are summarized in Table AIV-8 of the WG2 and 3 report.
4.5.5 Monitoring
4.5.5.1 Introduction Monitoring can be defined as any periodic or continuous operation where the behaviour of a structure is quantified in some way so that its serviceability and stability can be evaluated.
Observations and measurements are taken to: • compare the predicted to the actual in-service performance - this can be used to check the validity
of some of the assumptions made in design; • detect defects as they occur in-service - and which may affect serviceability or safety; and • provide data for assessing the level of serviceability or safety.
Monitoring works may be implemented: • before construction - to determine the effect of construction works; for example, on the change
in ground water level brought about by the construction of a retaining wall; • during construction - perhaps in response to a problem that arises; and • in-service - as part of an assessment of condition and performance.
The main points to be taken into account when planning monitoring works are: • mechanisms that may dictate the behaviour of the structure; • selection of the element(s) to be monitored; • selection of the variables to be measured, and the location of the instruments; • prediction of the magnitude of the variables to be measured;
COST 345 Final Report
69
• selection of the instruments - taking account of the ease of installation, and the cost, robustness, sensitivity and reliability in service;
• the need for duplicate instruments and measurements to allow for the breakdown of equipment in service and to check consistency;
• data collection, storage and retrieval; and • safety.
In most States, monitoring is used to provide data for assessing structural condition, usually of bridges and tunnels. Monitoring works are usually implemented before or during the construction of walls and tunnels, whilst for bridges they are usually implemented following the end of construction. The following covers various measurement techniques and the application of the data: visual inspection is covered in 4.4.
4.5.5.2 Structural types
• Bridges - in most States, less than 25 bridges will be monitored in any detail at any one time. Commonly, measurements are made of: deformations or displacements generated by loading and/or creep movements; the width of cracks; and, in some indirect way, the degree or rate of corrosion. In some cases the strain in cables and tendons, and/or the force at their anchorage points, may also measured.
• Earth retaining structures - the need to monitor such structures depends on their condition, their rate of deterioration, and the consequences of their failure. In most States there is provision for un-dertaking periodic visual inspections of particularly important retaining walls, but in only a few are detailed monitoring works undertaken for other than research purposes. Typically, around 25 walls will be monitored in a State at any given time. Measurements will commonly be made of (a) changes in the vertical and horizontal position of the face of the structure and, perhaps also, of movements within the retained ground and foundations, and (b) pore water pressures. In some States the restraining forces provided by ground anchorages, ties and the like are also measured.
• Tunnels - all road tunnels are inspected at regular intervals, but measurements are not commonly made. The profile of a tunnel can be monitored, to check convergence for example, using con-ventional surveying techniques or, more commonly now, automatic scanning devices. Measure-ments might also be taken of the width and extent of cracks within the tunnel. Movements of the ground in and around a tunnel might also be made using, for example, conventional surveying techniques, slope indicators, and inclinometers. The lock-off load in bolts, anchorages and the like may also be measured.
4.5.5.3 Variables
• Pore water pressures - the pore water pressures sustained in soils affect the performance of buried structures and earth-retaining structures: in some cases these pressures can have a dominant ef-fect on performance. Several methods are used to measure such pressures, including an open standpipe, twin-tube hydraulic piezometers and sealed pneumatic piezometers.
• Deformation - surface movements can be determined using conventional optical techniques, auto-matic electronic distance measuring devices, or by GPS. Commonly, measurements are taken of:
convergence (that is, the change in distance between two reference points) - using a tape extensometer, convergence meter, induction transducer, or dial gauges ;
movement across a crack or joint in the structure or exposed rock face - using one of the range of proprietary devices (crackmeter, fissurometer, 3D jointmeter); and
vibrations - using accelerometers or velocity transducers.
A range of equipment is available for measuring subsurface settlement including:
COST 345 Final Report
70
extensometers, which measure the change in distance between two or more points along a common axis - different types have been devised to suit specific purposes;
buried settlement plates and gauges - a wide range of types are available; and hydrostatic profile gauges - typically comprising a torpedo that is drawn through a tube
laid horizontally in a trench.
Instruments used to detect subsurface horizontal movements and rotations include: inclinometers - which measure the magnitude and rate of lateral deformation; tilt-beam sensors and electro-levels - which measure the rotation between two fixed
points; and direct or inverted pendulum.
• Loads and stresses - the equipment for measuring loads and stresses include: earth pressure cells, these are used to monitor the total stresses in soils and soft rocks; load cells to measure the tensile forces in ground anchors, bolts, ties and the like; and load cells to measure the compressive force in structural components, e.g. struts, piles.
• Strain - the strains developed in structural components can be measured by a number of devices, such as vibrating wire gauges, electrical resistance gauges and accelerometers.
• Other variables - such as temperature, wind speed, precipitation, and moisture content, may be measured to provide a better understanding of how performance is affected by these variables, and also to correct the output from the instruments to a reference temperature.
4.6 DATA MANAGEMENT
4.6.1 Type and format of data
The findings of a formal inspection are usually recorded on purpose-designed forms; the infor-mation required includes: • basic information about the structure, such as its reference number and/or name, and location; • details of the type of inspection, including any limitations generated by problems of access; • the type and location of defects, and an assessment of their extent and severity; • an overall assessment of the structure; and • recommendations for short-term or long-term actions; for example, on the timing of subsequent
inspections and on the priority for remedial works.
In addition to the standard forms, interpretive reports are usually produced for Principal and Special Inspections.
The report from a Special Inspection should normally include drawings showing the form of construction, and a description of the important structural elements (e.g. bridge deck and piers) and ancillaries, such as expansion joints, waterproofing, and parapets. The location of substantial defects should be shown on drawings. Such a report should also provide a detailed description of the condition of the elements inspected and, where possible, details of the construction and maintenance history of the structure and the results of previous inspections.
All the information available on a particular structure should be coded appropriately so that it can be readily input to databases and also retrieved from them. The availability of suitably structured and populated databases is a fundamental requirement for generating and improving inspection procedures, for deriving a strategy for the long-term maintenance of highway structures, and for developing whole life cost models.
COST 345 Final Report
71
4.6.2 Application of data
As shown by the flowchart given in Figure 4-13 the data obtained from an inspection are used to decide the next course of action: this may be an immediate action or one that follows from a condition assessment of the structure.
INSPECTION
CONDITION ASSESSMENT
IMMEDIATE RESULTS OR
ACTIONS
IN-DEPTH INSPECTION
TEMPORARY LOAD RESTRICTION
TEMPORARY PROPPING
TEMPORARY CLOSURE
PREVENTIVE MAINTENACE
REPAIR WORK, REHABILITATION
IN-DEPTH INSPECTION
ASSESSMENT OF LOAD CARRYING
CAPACITY
STRUCTURAL REPAIR,
UPGRADING
REPLACEMENT
REPLACEMENT
PROPPING
LOAD RESTRICTION
CLOSURE
MONITORING
Figure 4-13 Flowchart of data obtained from an inspection
4.7 CONDITION ASSESSMENT
4.7.1 Definition and objectives
A Condition Assessment (CA) is undertaken to provide information on: • the overall condition of a structure and/or of its components or elements; • the nature, cause, intensity and extent of defects and areas of deterioration; and • the effect of the defects on the stability and serviceability of the structure.
If an inspection shows that the condition of the structure puts the safety of users at risk, meas-ures such as load restrictions or propping of the superstructure can be implemented immediately. These should remain in place until a further, more detailed, investigation is completed.
It is important that repair works are regularly inspected and assessed, and for the findings to be recorded in a systematic manner. These data can be used to assess the effectiveness of the repair
COST 345 Final Report
72
work undertaken at a particular site, and to compare the cost-effectiveness and durability of dif-ferent works undertaken at other sites with differing service conditions.
Another objective is to obtain data that can be used to assess the condition of the structure, and, thereby, of the stock of structures. The means of deriving a condition rating of a structure are described in 4.7.
Data on the rate of change of the condition of a structure, or of its components and elements, are essential input to decisions on the type and timing of maintenance and remedial works. For example, as shown in Figure 4-14, the condition of a column can be tracked through successive inspections to help fix the timing of the repair works.
Data on the rate of change in condition can also be used to develop new or improved models for predicting the rate of deterioration, and for whole life costing. The development of such models requires: • the collection of relevant data; • consistency in inspection and assessment, by different personnel at different times; and • a suitable quantified means of expressing condition.
Selection of the most appropriate type of remedial works requires information on the cause of the deterioration. But this is not always straightforward, particularly with ageing structures where there is limited historical information available. It is necessary, therefore, for structures to be in-spected at the end of construction, and perhaps also before they are put into service. Problems met during construction and changes to the as-designed layout should be recorded. This may help identify the underlying cause of a defect, and thereby improve the reliability of the inspec-tion and assessment process and the prediction of the rate of deterioration.
The main objectives of a CA are thus: • to identify deterioration processes; • to provide an indication of the condition of a structure and/or of its components or elements; • to identify what further works are required, such as inspection, maintenance and/or remedial
works - and also the likely cost and optimum timing of such works; • to rank a structure according to its need for further work; • to provide an indication of the condition of the stock of structures; and • to optimise expenditure on further works.
Figure 4-14 Condition of a column in 1997 and 2000
COST 345 Final Report
73
Only when a problem has been well defined and understood can the most effective treatment be identified, planned and executed. For a particular defect there are usually several potential reme-dial options; selection will be based on factors such as the residual life of the structure, the esti-mated cost, timing and effectiveness of the treatment, operational requirements during the works - such as user safety, lane closures, and the likely weather conditions.
4.7.2 Procedures
The following requirements must be met to obtain the data necessary for undertaking a condition assessment and for analysing the results of one or a series of assessments: • inspections must be undertaken regularly at appropriate intervals, starting from the commission-
ing of the structure and following the completion of any major repair work; • inspections must be completed by adequately trained and qualified personnel, and be undertaken
using appropriate equipment; • the availability of a catalogue that gives details of the possible defects and deterioration processes,
and information on the factors that can initiate and promote them; • the availability of a method for quantifying the severity and extent of defects; and • a means of assessing the impact of defects on the safety and durability of a structure.
4.7.2.1 Review of existing procedures Most procedures use a rating to quantify condition. A rating provides a convenient and effective means of expressing the general level of deterioration of a structure, or one of its components or elements. It should be based on a simple scoring system that takes into account all the defects that may have an impact on user safety and/or the durability of the structure. Thus the evalua-tion of every incidence of damage should take into account: • the nature and character of the damage; • its effect on the safety and durability of the structural element; • the effect that the damaged element (such as beam) has on the safety and durability of the struc-
tural component (such as a span of a bridge) and on the structure as a whole; • the maximum severity of the damage, and the likely future rate of deterioration; and • the current extent of the damage and its likely future rate of propagation.
The methods used in Europe and the USA were reviewed by the BRIME project (BRIME, 2002). This showed that two approaches were used to derive condition ratings for bridges: • A cumulative condition rating - where the rating for the most severe damage on each element is
summed for each span of the superstructure, each part of the substructure, the carriageway and accessories: the total sum is taken as the condition rating for the structure.
• A rating classification - where the rating for a bridge is taken as the highest of the ratings given to its components. This approach shows the number of bridges in each class but does not allow di-rect comparisons between different structures.
(More detailed information on the methods used for assessing the condition of elements, com-ponents and the bridge as a whole is provided in deliverable D2 of the BRIME project.)
It will be appreciated that a rating is an assessment of the condition and/or state of deterioration of a structure and, because no account is taken of the applied loads, it does not provide a meas-ure of the level of safety - thus structures having the same rating may have widely different levels of safety. Furthermore, in general, ratings do not rank a group of structures according to the ur-
COST 345 Final Report
74
gency of remedial or strengthening works: this would only be the case for identical structures with identical in-service loading conditions.
4.7.3 Phases
A condition assessment comprises two phases: • an inspection to gather information for analysis; it is essential that the data are appropriate and
relevant to the derivation of the required index (e.g. condition rating or priority ranking); and • evaluation of the index.
4.7.3.1 Inspection Two types of inspection can be considered: standard inspections and monitoring works.
Standard - These provide data on the condition of the structure at a particular time. But, immedi-ately following an inspection, damage can be inflicted and deterioration processes can commence or accelerate substantially. Thus substantial remedial works might be necessary where the time be-tween successive inspections is too long, or where a defect is not picked up at an early stage. Con-tinuous or long-term monitoring works can be a more efficient means of managing particular structures.
Monitoring - Equipment, based on the use of fibre optics for example, can be used to continuously monitor some aspect of the performance of a structure, such as deflection under live loading. Thus it is possible to track, continuously and remotely, the condition of a structure.
4.7.3.2 Evaluation At present, usually the general condition of a structure is expressed through a single number, which may also indicate the priority for remedial works. A review of the condition ratings used in some European States was undertaken as part of the BRIME project (BRIME, 2002): some of the results of that review are reproduced in Annex V of the report from WG2 and 3.
4.8 QUALIFICATION AND CERTIFICATION
4.8.1 Current position
All the States involved in COST 345 have developed standards for the qualification and training of inspectors. The various approaches have some common elements but they have different re-quirements regarding the knowledge and experience required of inspectors: for example, some States require an inspector to have a formal educational qualification whilst others require only that an inspector has some relevant practical training or experience. A more detailed summary of practice in a number of European States and the USA is given in the WG2 and 3 report.
4.8.2 The training of inspectors
For efficiency and effectiveness, an inspector must have up-to-date knowledge of material sci-ence, structural behaviour, and construction practices and techniques. Thus training/education courses should cover: • the use of new materials for construction and repair works; • the use of new structural forms - in particular their vulnerabilities; • the use of more effective and reliable investigative techniques;
COST 345 Final Report
75
• the change in traffic loading with time; • changes in the environment - particularly those that may affect safety and durability; and • the identification of new defects and/or a sudden increase in the incidence of particular defects.
Thus the basis of any qualification or approval system for inspectors should be continual training and education.
4.8.3 Interpretation and analysis
The methods used to analyse test results, and also report the findings of inspections and assess-ments, should be standardised. This will promote consistency in reporting and assessment so that comparisons of condition, for example, can be made with some confidence - as required to es-tablish a reliable priority ranking for remedial works. Standardisation should cover, amongst other things, terminology, computer packages, investigative and analytical techniques, and qualitative and quantitative measures of condition - including the units used to report deflection and defor-mation. The aim should be to provide a clear, concise and reliable description of the condition of the structure, and of any further work that is required.
4.9 CONCLUDING REMARKS
The importance of the highway network within the EU can hardly be overstated. Bridges, buried structures, earth-retaining structures and so on are vital elements of that network and so it is cru-cial that they are maintained in good order. There are similarities in the inspection and assessment procedures adopted for highway structures in various European States. This is not surprising given that there is a common aim to maintain the structures in a satisfactory condition at the low-est possible cost. However, there are differences in the details of the procedures and some of these, such as the use of loading tests, warrant a closer examination. Furthermore, although as-sessment codes are used in some States, in others in-service structures are assessed through de-sign codes for new structures - and this latter approach is unsatisfactory. There is also a wide-spread need to expand condition assessment methods to provide an adequacy rating (for safety) or a priority ranking (for remedial works).
Given the undoubted importance of the quality of inspections and assessments, it is surprising that there is such diversity in the requirements for the education and training of the personnel undertaking such work. And in many States there is no standard way of checking the reliability of inspections and assessments. It would seem necessary to introduce a certification scheme for in-spectors and/or assessors at a national level, but there is merit in adopting a pan-European ap-proach.
It would seem necessary to adopt a philosophy of continual improvement through periodic re-views and updating of inspection and assessment procedures - these include the utility of stan-dard inspection report forms, and the content of catalogues, advice notes and training courses.
The current inspection and assessment procedures have been developed, almost exclusively, for highway bridges. It seems necessary to devise procedures for all major highway structures: al-though such procedures can be based on those developed for bridges they must take account of differences in the nature and type of defects and loading regimes. Furthermore, current proce-dures have been devised for structures on the primary road network but because of differences in, for example, performance requirements, consequences of failure and maintenance budgets it is inappropriate to apply the same procedures to structures on all other categories of road. Thus,
COST 345 Final Report
76
as a matter of priority, it would seem necessary to devise an asset management system for struc-tures on the secondary and tertiary road networks.
COST 345 Final Report
77
Chapter 5 Summary of Working Groups 4 and 5 Report on numerical techniques for safety and serviceability assessment
5.1 BACKGROUND
Working groups 4 and 5 of this COST action treated the following aspects of the assessment of existing highway structures: • Levels of assessment: Five levels of assessment are recommended varying from simple but con-
servative to complex but accurate. • Uncertainty modelling: An integrated approach to traffic loading, structure condition and struc-
tural response is described. • Load modelling: There can be considerable unused capacity in highway structures that are not
subjected to the full design levels of traffic loading. This can be calculated from traffic weight statistics obtained from a weigh-in-motion system.
• Modelling materials for assessment: The processes are reviewed by which material properties in ex-isting structures can be estimated.
• Structural response modelling: The types of analysis appropriate to the five recommended levels of assessment are proposed.
• Target reliability levels: The levels of reliability considered appropriate for highway structure as-sessment are discussed.
• Reliability analysis: The available procedures for full reliability analysis of highway structures are reviewed.
All of these topics are covered in detail in the following sub-chapters and in more detail in the special report (COST, 2004c). Without providing the details, the report aims to give sufficient in-formation for engineers and network managers and authorities to choose the appropriate meth-odology for assessing their structures. It also aims to inform engineers charged with assessment about some of the procedures available.
When an existing highway structure is found to have deteriorated or when a fault or damage is discovered, it is relatively easy to determine the type and extent of the repairs necessary. In the absence of a detailed assessment, the purpose of such repairs would be to bring the structure to its original state as far as practicable.
On the other hand, when an existing structure has no apparent problem, but for example, traffic weights and volumes have increased, or the original design rules are now found to be inadequate, it is difficult to judge if the structure now needs to be strengthened or not. Any work done to a structure in perfect condition seems to be a waste of money and effort. Yet, if nothing is done, the structure will be at some risk. Formal calculation based assessments are necessary to deal par-ticularly with such cases.
Performing structural assessments is a very necessary process. The reasons are as follows:
(1) It is not possible in advance to know which structure will eventually collapse.
COST 345 Final Report
78
(2) One option would be to do nothing and accept that an occasional structure will collapse from time to time. This is not advisable for the following reasons:
(a) It would be politically unacceptable and no public authority can knowingly subscribe to it with the potential risk of death and injury, and the loss of amenity.
(b) There is no guarantee that only an odd structure will occasionally collapse if nothing is done.
Hence, the realistic approach is to carry out assessments of any potentially at risk structure groups, but improve the assessment methods to make them as accurate as possible so that the wasted assessments and strengthening are kept to a minimum. All research and development work in this area through the years has been aimed at achieving this goal.
5.1.1 Significance of structural assessment
Structural failure is not acceptable to the public; hence the order of the probability of failure in-herent in the assessment criteria is very small. When a structure is assessed to be sub-standard, it does not mean that it will necessarily fail or collapse. However, if such structures were left in large numbers without remedial action, there may be an unacceptable risk that a collapse in ser-vice would occur.
The absence of any apparent signs of distress in a structure does not mean that it is structurally adequate. When the failure mode is likely to be brittle, there may be no early warning signs. Fur-thermore, end restraint or composite action, which cannot be relied upon at all times in certain older structures, may temporarily prevent such a structure from showing distress.
Structure assessments are generally carried out using formal calculations based on standard speci-fied rules. This has given the impression that the process is precise and the result must be fol-lowed without question. Yet, many of the factors that bring about structural collapse cannot be taken into account in calculation. Then, there are many approximations and uncertainties in the as-sessment process and these should be examined and rational methods developed to make the as-sessment process more comprehensive and flexible, and yet consistent when carried out by dif-ferent engineers. Nevertheless, calculation-based assessments are the only practical means available at pre-sent for gaining assurance about the adequacy of the whole stock of highway structures.
5.1.2 Numerical methods of assessment
Currently, the rules used in highway structure assessment are provided mainly by design standards with additional standards relating to testing methods, including load testing. In some countries, the design standards used can be either the current standards, or those that were current at the time of construction. In others, only current design loading specifications can be used, although these can be modified specifically for assessment and can include reduced load levels based on restricted traffic conditions. Additional requirements can be given regarding exceptional traffic loading.
It is important to note that the rules set down in a design code constitute a set of prescribed rules that are only valid within a certain context. For assessment, situations often exist which ren-der design codes inapplicable either because of existing structural condition or because of the presence of non-conforming details. This is particularly true in the case of older bridges and cur-rent design codes have to be interpreted carefully before being used.
The design codes present safety margins that, in general, exceed those that are reasonable to ac-cept for the assessment of existing structures. This is because the level of knowledge of existing structures and the actual traffic conditions can be determined with a greater degree of certainty,
COST 345 Final Report
79
as they can be observed and/or measured. Thus, partial safety factors can be reduced while main-taining the same level of structural safety. Knowledge of the structures can be increased by inves-tigations and this can justify further reductions in partial safety factors.
It is clear that the establishment of principles and procedures to be used for the assessment of existing structures is needed because some aspects of assessment are substantially different from new design and require knowledge and procedures beyond the scope of design codes. In addi-tion, structure assessment should be carried out in stages of increasing sophistication, aiming at greater precision at each higher level. In order to save structures from unnecessary rehabilitation or re-placement (and therefore to reduce owners’ expenditure), the engineer must use all the tech-niques, all the methods and all the information available in an efficient way. Simple analysis can be cost effective if it demonstrates that the structure is satisfactory, but if it does not, it can present major drawbacks regarding the structure under study and more advanced methods should be employed.
5.1.3 Levels of assessment
The purpose of assessment is to check structures for their capacity to safely carry or resist spe-cific loading levels and to identify those structures which have an unacceptable probability of failure, either in part or complete collapse, under extreme conditions of loading and material weakness.
If a structure is found to be inadequate in an assessment, it becomes necessary to replace or strengthen it to make it safe for the required loading. Otherwise, as a temporary measure, the loading needs to be restricted in some way. Repairs, strengthening and traffic disruption resulting from them are costly to the owners and the users of the structures, and hence, the assessment of doubtful structures should be carried out as accurately as possible. At the same time, theoretically complex and rigorous assessments can themselves be very costly and time consuming.
Methods of assessment have been the subject of considerable research and development effort in recent years; as a result it is now possible to carry out assessments in five distinct levels. These levels of assessment are numbered 1 to 5, with Level 1 being the simplest and Level 5 the most sophisticated. Means for carrying out assessments at Levels 1, 2 and 3, are now generally avail-able. Levels 4 and 5 involve structural reliability calculations and are currently only used by ex-perts.
5.1.3.1 Level 1 assessment This is the simplest level of assessment, giving a conservative estimate of load capacity. At this level, only simple analysis methods are necessary, and partial safety factors from the assessment standards are used.
5.1.3.2 Level 2 assessment Level 2 assessment involves the use of more refined analysis, for example grillage analysis, finite element, non-linear or plastic analysis, and better structural idealisation. It also includes the de-termination of characteristic strengths for materials based on existing available data. No new tests would be carried out on the structure for a Level 2 assessment.
5.1.3.3 Level 3 assessment Level 3 assessment may apply the structure-specific loading. For many bridges, particularly on lightly trafficked roads, the use of bridge-specific traffic loading can be quite beneficial. It also makes use of
COST 345 Final Report
80
material testing to determine characteristic strength or yield stress and considers diagnostic load testing.
5.1.3.4 Level 4 assessment Level 4 assessments can take account of any additional safety characteristic to that structure and amend the assessment criteria accordingly. Any changes to the criteria used in this level may be determined through rigorous reliability analysis, or by judgemental changes to the partial safety factors. In the deliberations involving Level 4 assessments, care should be taken not to double count structure-specific benefits which have already been taken into account. For instance, if sys-tem analysis based methods such as the yield line method have been used in Levels 2 or 3 as-sessments, system effects should not be utilised in Level 4 assessments.
5.1.3.5 Level 5 assessment Level 5 assessment involves reliability analysis of particular structures or types of structure. Such analyses require statistical data for all the variables defined in the loading and resistance equations. The techniques for determining the probability of failure from such data are now available and can be undertaken relatively easily in modest time frames. It provides greater flexibility but the re-sults are very sensitive to the statistical parameters and the methods of structural analysis used. Consequently, it requires specialist knowledge and expertise.
5.1.3.6 Whole life assessment It is to be noted that the assessment of the structural performance of highway components, as carried out according to currently used codes and standards, determines the adequacy of a struc-ture at the time of the assessment. However, assessment of structures is an essential part of the management and operation of the road where conditions of safety and mobility must be guaran-teed at all times: this implies the evaluation of future maintenance needs. To reach this goal it is necessary to predict the future performance of structural elements/components, in particular under different maintenance strategies, and to cost the various options using the principles of whole life costing.
The whole life performance profile of a structure may be determined in terms of its available safety factor or load carrying capacity or reliability. Such a profile depends on the as-built capacity of the structure, material deterioration in future years, variations in loads and past maintenance activities. A number of different sources of uncertainty are inherent in this process, related to:
1. structural capacity and current loading;
2. time related performance and corresponding maintenance works;
3. amount of rehabilitation work; and
4. unit cost of work.
Reliability analysis and probabilistic methods are useful tools for dealing with the uncertainties re-lated to these values. Details about whole life costing procedures are given in (COST, 2004c).
5.1.3.7 Inspection: Level 0 assessment The road owners and operators make extensive use of assessment based on visual inspections or monitoring of structures. Even if such results are extremely conservative, they allow:
1. a rapid evaluation of the overall conditions of large populations of structures;
2. prediction of future trends based on past observations and experience; and
COST 345 Final Report
81
3. easy collection of data for defining maintenance and repair strategies and their costs.
Visual observations (extent and severity of damage) and simple tests are used to assess the condi-tions of structures based on an arbitrary scale, generally ranging from “good” condition to “very poor” condition. Their main advantages are their simplicity and repeatability, the low cost and the easy link with maintenance strategies, as maintenance options may be directly associated with condition ratings and classes of visual deterioration. One of the main disadvantages of visual in-spections is the subjectivity of the assessment as it depends on the experience and judgement of the engineer. Moreover, visual observations cannot detect latent defects or defects at early stages of deterioration (e.g. initiation of corrosion) and no direct information may be derived on the structural deterioration.
5.2 UNCERTAINTY MODELLING
If all information is known about a structure, including all of the material properties, all of the loads to which the structure is and will be subjected and how the structure does and will behave when subjected to these loads, an engineer can say whether or not a structure will survive for a certain period of time. Since it is not possible to know each of these exactly, engineers must make conservative approximations and estimations, which allow structures to be designed and as-sessed. Each approximation and estimation is associated with uncertainty. The sources of these uncertainties are often classified as either: 1. natural – uncertainties due to the unpredictability of loads, such as wind, earthquake, snow,
etc…, and the differences in mechanical behaviour of the materials in a structure; or 2. human – uncertainties due to intended and unintended departures from the optimal design,
such as approximations and calculation errors during the design phase or use of non-specified materials and changes without re-analysis during the construction phase.
In the assessment of existing structures, engineers do not have to work with the same uncertain-ties that existed during the design phase. As the structure exists, the loads to which it is subjected can be measured to give a more accurate portrayal of the extreme loads to which the structure is and will be subjected in the future. The material properties can be measured, which often has the effect of removing the conservative bias that the engineer had at the time of design. The overall structure can be tested to determine more accurately the structural behaviour and to verify the structural response models that were used.
The uncertainties in the evaluation of structures are due to inherent variability, imperfect model-ling and estimation error. These uncertainties can be incorporated into the assessment processes using probabilistic methods.
5.2.1 Evaluating uncertainties
Theoretical basis for modelling and analysing uncertainty is based on probability. To describe the range of values that a variable may have and the likelihood that it may have each of the values within the range, likelihood of occurrence experiments are often conducted. This experimental data can then be shown graphically as a histogram or frequency diagram (Figure 5-1).
From this data probabilistic distributions can be determined to describe mathematically the likeli-hood of the variable having each of the values within a range of possible values. It should be noted that the availability of data and the quality of information will affect the degree of uncer-tainty when using probability. However, the lack of sufficient data does not lessen the usefulness of probability when assessing existing structures.
COST 345 Final Report
82
Fitted distribution
Test data
( )f ffY y
Test data
Fitted distribution
( )F ffY y1.0
fy fy
(b) (a)
Figure 5-1 Variation of steel yield strength, fy, represented by (a) a probability distribu-tion function and (b) a cumulative distribution function
5.2.2 Reducing uncertainty
Uncertainty due to inherent variability often cannot be reduced. For example, the wind loads on a structure cannot be modified by human intervention in a reasonable way. However, in some cases it is possible to reduce uncertainty due to inherent variability in the design phase by ensuring the quality control measures, e.g. of concrete strength. This is of little help when evaluating existing structures. Uncertainty associated with imperfect modelling and estimation error can be reduced by adopting a more accurate model or updating an existing model.
Assessments of existing structures can benefit from using additional test data or information to update initial estimations or distributions. The Bayesian approach may be used to systematically incorporate new information into an existing model.
5.2.3 Common mistakes
The modelling of uncertainty must of course be done correctly. Some of the major sources of errors in the consideration of uncertainties using probabilistic methods are: • lack of identification and separation of different statistical populations; • inadequate test data; • neglecting the systematic variations in observed variables (e.g. temperature effects); • excessive extrapolation of statistical information; and • neglecting correlations between variables.
More information on these subjects can be found in various references on probabilistic analysis (e.g. Ang, 1975 and 1984; Schneider, 1997).
5.3 LOAD MODELLING
5.3.1 Introduction
The design and assessment of highway bridges and culverts has traditionally been based on con-servative empirical methods. For bridge/culvert assessment, similar models can be used. How-
COST 345 Final Report
83
ever, in some cases of assessment, great savings can be made if it can be shown that the bridge has sufficient capacity to carry the load to which it is subjected. In many cases, such an approach can be used to justify not strengthening the bridge or certainly a reduced rehabilitation require-ment.
As with the design of a new bridge, the loads to which an existing structure is subjected are: • dead and superimposed dead load; • wind and temperature loading; • differential settlement and earth pressure; • traffic loading (normal, abnormal and permit, e.g. UK HA & HB loading); and • earthquake, ship impact, ice, scour and flood etc.
In prescribing these loads, bridge design codes specify the partial safety factors by which they should be magnified and combined in determination of load effects (i.e. bending moments, shear forces etc.) at the serviceability (SLS) and ultimate limit states (ULS) for a variety of loading combinations. The magnitudes of these partial safety factors reflect the uncertainty associated at the design stage with both material resistance and the combined load components. For example, the British Standard dealing with loading, BS5400 Part 4, specifies a dead load ULS partial safety factor, flγ = 1.15 for concrete while the factor for steel is flγ = 1.05, reflecting the relative uncer-tainties associated with these materials. In addition, the ULS factor for superimposed dead load is
flγ = 1.75. Clearly, these factors attempt to represent the level of uncertainty facing the engineer at the design stage. In the assessment of an existing structure a more accurate assessment of the loads to which the structure is subjected is possible. For example, dead and superimposed dead loading can clearly be assessed to a higher degree of accuracy for an existing structure, e.g. through measurement of the actual thickness of the asphalt layer. The obvious consequence of more accurate load as-sessment is in the justified reduction of the associated load partial safety factors at the ultimate and serviceability limit states. In addition, for the existing structure, the effects of the construc-tion process and subsequent life of the structure, during which it may have undergone alteration, deterioration and/or other changes to the as-designed state, must be taken into account. Numer-ous national codes (BD44/95 (Highways Agency et al, 1995), BD 21/97 (Highways Agency et al, 1997), Danish Road Directorate (1996) etc.) and International Standards (ISO/CD 13822, 1999, ISO 12491, 1998, ISO 2394, 1998) exist relating to the assessment of existing structures. An ad-ditional consideration of the assessment process is in the combination of loads to determine overall effects.
5.3.2 Load Types
Determination of loads for the assessment of an existing structure is in general a simpler task than for the design of a new structure. Accurate knowledge of the loads and of the condition of the structure permits an updating of load and resistance models, thereby resulting in more accu-rate modelling of the reliability/safety of the structure. The benefit of this is a justifiable reduc-tion in the load partial safety factors for the various prescribed combinations (which are not en-visaged to change from the design code) whilst at a minimum maintaining the required level of safety for the structure.
5.3.2.1 Loading Data Required for Assessment The data required for the assessment of an existing structure may be readily obtained through manual surveys etc. Any standard method may be used for collection of data relating to dead and
COST 345 Final Report
84
superimposed dead loads and, once accurately determined, these loads may be included in the as-sessment of the structure, without the need for significant further statistical analysis.
It is recognised that the time variant live loads, such as traffic, wind, temperature and earthquake effects represent random phenomena and require statistical modelling to determine the magni-tude of their characteristic effects. Extreme value distributions, such as the Gumbel family, are fit to measured data. Subsequent extrapolation of these distributions to a specified level of confi-dence or for a specified return period, yields a value of the given effect for a specified probability exceedance level.
The duration of time over which data is collected to accurately model the extreme values de-pends on the effect being determined. For wind and temperature data, maximum and minimum values of the particular effect over a representative period of time (e.g. 50 years) and for a spe-cific sampling frequency (e.g. monthly) should be collected. Typically such data is readily available from meteorological stations in the region of the structure under consideration. Earthquake data relating to ground acceleration etc. may be obtained from geological stations.
For traffic data, it is important to collect data continuously in representative periods of time. The duration of recording is clearly dependent upon a number of factors, i.e. time, budget, location etc.. It is obviously desirable to have as much data as possible; however 1-2 weeks of continu-ously recorded data in conjunction with the results of manual surveys is felt sufficient.
5.3.2.2 Static Traffic Load Simulation for Assessment Of the loads to be modelled, perhaps the most variable are those due to traffic. The characteristics of these vehicles vary widely with respect to their gross vehicle weight (GVW), axle spacing, distribution of load to axles, location in lane, velocity and in the likelihood of multiple presences of vehicles on the structure both longitudinally and transversely. Truck loading is a random phenomenon for which probabilistic models and statistical data are required. For assessment of existing structures, monitor-ing of traffic data using a weigh-in-motion (WIM) system can provide the necessary statistics to de-velop site specific loading models for ULS and SLS reliability assessment.
In general, traffic records will only give information on normal traffic. The most critical situa-tions for long spans appear when the traffic is congested while for short spans (i.e. <20 m) or lo-cal load effects, the heaviest individual axle (or group) or vehicle load is dominant. Therefore, it is necessary to combine realistic traffic scenarios (arrangements of vehicle, traffic types) such as free flowing and jammed traffic. It is important for subsequent extrapolation to ensure that the duration of each simulated scenario be retained for comparison with respect to its expected fre-quency during the lifetime of the bridge. A number of alternative traffic flow scenarios should be performed for both free flowing, jammed and mixed traffic, on the structure under consideration. It is often desirable to employ a technique such as Monte Carlo simulation or Poisson arrival processes to increase the number of simulated scenarios.
5.3.2.3 Dynamic Amplification of Static Load Effects One main issue of contention in determining characteristic load effects is the application of dy-namic amplification factors (DAF) to calculated effects determined from free and mixed traffic flow simulations. A number of issues may be raised concerning both the theoretical derivation and ac-tual application of these amplification factors to extrapolated static load effects for bridge as-sessment:
1. The dynamic amplification factor is generally theoretically derived as the ratio between the dynamic and static values corresponding to the same fractile. Yet, the maximum dynamic effect will not correspond to the maximum static effect.
COST 345 Final Report
85
2. The factor is presented as a function of the influence surface, the span length and the number of lanes on the bridge. The factors take no account of the random variables de-scribing either the vehicles themselves (i.e. their gross weight, speed, dynamic characteris-tics etc.) or of the relative dynamic interaction between the vehicles and the bridge. In addi-tion research has demonstrated that the dynamic amplification is inversely proportional to the weight of the vehicle, i.e. as the gross vehicle weight increases, the dynamic amplifica-tion reduces (SAMARIS D30, 2006).
As in the prescription of static load effects for design code calibration, the prescription of dy-namic amplification factors must attempt to provide a set of values that are applicable for a large range of structures. However, in the assessment of a particular structure, more accurate assess-ment of appropriate factors may be made through surveys of structural condition, road surface roughness, condition of joints at bridge extremes, natural frequency etc., all of which contribute to the dynamic amplification factor. Such detailed work, which may also include detailed finite element modelling to take account of the probabilities of arrival, vehicle frequency matching, ve-hicle-bridge interaction etc., may only be applicable for significant capital projects. However, it is important to understand that the option is available.
5.3.3 Conclusion on load modelling
It is clear that load modelling for the assessment of an existing structure has the advantage of employing site-specific loads for the determination of load effects. Manual surveys may be per-formed to measure actual sizes for more realistic estimation of dead and super imposed dead loads, while data concerning wind, temperature and earthquake effects may be obtained from lo-cal meteorological and geological stations for required return periods. Traffic data may be col-lected continuously at the site by weigh-in-motion technology and statistical techniques may be employed to make the best use of what is available. The advantages of various concepts of static and dynamic traffic load simulation are obvious when the site-specific parameters of traffic char-acteristics are considered. In calculating extreme SLS and ULS load effects, load combination may be applied based upon existing codes of practice, with reduced partial safety factors, to re-flect the reduced uncertainty associated with the applied loads. Alternatively, combination rules such as Turkstra’s or Borge’s rules may be employed. Extrapolation of load effects to determine extreme values may be performed using one of the Gumbel family of Extreme Value distribu-tions, or an alternative distribution.
5.4 MODELLING MATERIALS FOR ASSESSMENT
5.4.1 General
Assessment of highway structures requires accurate modelling of the resistance of their struc-tural elements. This demands knowledge of the material properties in the structural elements, of the structural dimensions and about how the various materials within the elements act together. It is also necessary to understand the influences on the material properties and structural dimen-sions, of time (i.e. the extent and strength changes due to deterioration mechanisms such as fa-tigue and corrosion), fabrication methods and quality control measures.
This sub-chapter addresses material properties in a general way applicable to the assessment of all materials that are used in highway structures. A few more specific details given are: • variations in material properties and how they are modelled, • initial compliance controls,
COST 345 Final Report
86
• aspects to be considered when modelling the concrete and steel reinforcement that comprise concrete elements.
The reader is referred to the main report (COST, 2004c) and its Appendix B for a more detailed look at the mathematical and probabilistic models proposed for material properties by various re-searchers.
5.4.2 Variations
Not being able to determine exact material properties at all locations and times within or between structures results in uncertainties of the material properties that are to be used to determine structural resistances. These uncertainties can be accounted for by modelling the material proper-ties probabilistically.
Material properties within a structure vary both spatially and temporally. They vary spatially be-cause in each different location there is a different exact combination of components. For exam-ple, concrete at different places in a structure is made of different combinations and configura-tions of aggregate, cement and water. The material properties vary temporally because of the loading of the structure and the physical processes at work in the materials. For example, loading of steel reinforcement into the strain hardening range, past the initial linear elastic portion, changes the future yield stress of the steel and the hydration process in concrete results in in-creases in concrete strength.
In addition to these uncertainties the variation between material test specimens and the material in a structure must be considered. This variation has a systematic component due to bias in the predictions and a random component, which can be attributed to a lack of completeness in the models used for prediction, as well as differences in the materials used, qualities of workmanship and the effects of time. Table 5-1 gives examples of systematic (bias) and random (coefficients of variations – COV) variations found in some common material properties. These values were taken from CEB (1991) and Ellingwood (1980). It must be noted that these are only examples and are not necessarily applicable in all cases.
The modelling of material properties probabilistically involves the determination of representa-tive probabilistic distributions. This requires a mathematical model and direct representation of the random variables in the mathematical model. The initial (or prior) distribution used in the model is based on existing historical data, test data, or expert opinion, or a combination of all
Table 5-1 Examples of systematic (bias) and random variations in material properties
Tensile strength of concrete (20MPa – 40MPa) ft 1.47-1.28 0.18-0.16 (CEB, 1991)
Modulus of elasticity of concrete Ec 1.18 0.10 (CEB, 1991) Tensile strength of reinforcing steel
(400MPa) fy 1.22 0.08 (CEB, 1991)
Modulus of elasticity of reinforcing steel Es 1 0 (CEB, 1991)
COST 345 Final Report
87
three. It must be ensured that the information, on which the distribution is based, represents ac-tual conditions, including environment, loading, fabrication, time effects, etc… The validity of the selected distribution should be verified and the prior distribution should be updated when new information becomes available. More information on testing the validity of distributions and on updating distributions with new information is given by Ang (1975).
5.4.3 Compliance
Modelling of the material properties of existing structures should take into consideration the compliance controls, if any, of the material at the time of construction. Compliance controls are performed to ensure the material is of the desired quality. They affect the probability of having certain (low) material properties. For example, if each structural member or group of specimens is tested and the ones that do not comply with the test are removed, the probability of having the undesired material properties in the structure is greatly reduced.
Taking into consideration the compliance tests must account for the errors associated with these tests. The uncertainty incorporated into them depends on the exact tests and the procedure. For example, if a compliance control test failed then the test specimen may be subjected to further testing or be discarded immediately. The ability of compliance control tests to reduce the prob-ability of having certain material properties depends on the ability of the compliance tests to de-termine whether or not a lot is inadequate (Kerksen-Bradley, 1991).
5.4.4 Considerations when modelling concrete
5.4.4.1 Sources of uncertainty Sources of uncertainty in concrete properties are due to variations in the properties of the com-ponents of the concrete and proportion of concrete mix, variations in mixing, transporting, plac-ing and curing methods, variations in testing procedures, and variations due to concrete being in a structure rather than in test specimens (Mirza, 1979b). The concrete properties discussed herein are strength in compression and tension, modulus of elasticity in compression and tension, and creep and shrinkage.
5.4.4.2 Concrete strength in compression (in-situ) In-situ concrete strength, fc, is not the same as the concrete strength measured in test cylinders or cubes, f ’c. It is normally lower than f ’c because of the different placing and curing procedures and of vertical migration of water during the placement of concrete, the effects of difference in size and shape, of different stress regimes, the difference in directions of casting and loading of the structure and the specimens (Mirza, 1979b). The mathematical models of in-situ concrete strength predominantly transform the concrete strength of test cylinders, considered as random variables, into the characteristic in-situ concrete strength.
The important concrete characteristics to be accounted for are:
1. Basic compressive strength f ’c: The concrete strength measured in test cylinders, the basic compressive strength of concrete, varies due to variations such as the exact composition and configuration of the constituents in each cylinder, the variations in the position of the cylinder in the test frame, and variations in the loading speeds. Normal and lognormal distributions are nor-mally used to represent it, although preference is given to lognormal distributions as they do not have negative values. Normal distributions give an increasingly conservative approach to the modelling of the low tail of f ’c and lognormal distributions give unconservative estimates at the low tail (Balaguru, 1995). The coefficient of variation is smaller for the log-normal distribu-
COST 345 Final Report
88
tion. The log-normal distribution gives a better fit than the normal distribution for concrete strength when the coefficient of variation is greater than 0.15-0.20 (Mirza, 1979b).
2. Changes in concrete strength with time: Concrete strength changes with time due to the loads applied. Increased loading causes micro cracks to grow and weakens the concrete and the physical processes at work in the concrete, such as hydration (Neville, 1997). In the JCSS probabilistic model code (JCSS, 2001), it is recommended to take into consideration the concrete age at time of loading, t (days), and the duration of the loading (τ) by using a deterministic function. The average in-situ strength increases by about 25 –30 percent be-tween 28 days and 1 year (Bartlett, 1996; JCSS, 2001).
3. Changes in concrete strength due to spatial variation: The concrete strength varies spatially in a structure due to variations in the properties of the components of the concrete at the different locations. To take into consideration spatial variation, it is recommended in (JCSS, 2001) to use a standard normal variable which is correlated within one structural element and uncorrelated for different elements. It is recommended to use a log-normal variable to represent the additional variations in strength due to the special placing, curing and harden-ing conditions of in-situ concrete.
4. Degree of quality control: The degree of quality control affects the variation of the con-crete material properties (Mirza, 1979b; Stewart, 1995). This can be used to determine im-proved probabilistic models of concrete properties by reducing the coefficient of variation of the distribution (Stewart, 1995).
5. Effect of the speed of loading on concrete strength: The effect of loading rate on the in-situ concrete strength affects the determination of in-situ strength (Mirza, 1979b). The faster concrete is loaded the stronger it is. The loading rate has little effect on the overall coefficient of variation of concrete (Mirza, 1979b).
6. Concrete Strength in Tension: The relationship between tensile and compressive strengths of concrete depends on the size and type of aggregate, air entrainment, curing conditions, water/cement ratio, cement content and age at the time of loading (Mirza, 1979b). Models of tensile strength are proposed for example in (CEB-FIP, 1991); (JCSS, 2001) and (Mirza, 1979b).
5.4.4.3 Modulus of elasticity The modulus of elasticity of concrete (the relationship between stress and strain) depends on the modulus of elasticity of the aggregate and the volumetric proportion of aggregate in the con-crete (Neville 1997). A model of modulus of elasticity is proposed in (JCSS, 2001) that uses a de-terministic creep coefficient, the ratio of the permanent load to total load and depends on the type of structure and a log-normal variable to represent the additional variations in the modulus of elasticity due to the special placing, curing and hardening conditions of in-situ concrete.
There is a high degree of correlation between initial tangent modulus and compressive strength. The initial tangent modulus of elasticity of in-situ concrete can be described by a normal distri-bution (Mirza, 1979b). There is little difference between the modulus of concrete in compression and in tension (Mirza, 1979b; Johnson 1928).
5.4.4.4 Concrete compression strain A model of ultimate compression strain is suggested in (JCSS, 2001). It is recommended to use a log-normal variable to represent the additional variations in the ultimate compression strain due to the special placing, curing and hardening conditions of in-situ concrete.
COST 345 Final Report
89
5.4.4.5 Drying shrinkage Drying shrinkage of concrete is commonly defined as the time-dependent reduction of volume of hardened concrete, paste or mortar resulting from the loss of water. The rate of drying shrinkage depends on temperature and relative humidity in the concrete, the elastic properties of the paste and aggregate and their shrinkage as well as the restraint imposed by the aggregate and unhydrated cement, water-cement ratio, degree of hydration and admixture. Models are proposed by Madsen (1983).
5.4.4.6 Creep Creep is the gradual increase in strain in concrete with time under load (Neville 1997). Creep can thus be defined as the increase in strain under a sustained stress and, because this increase can be several times as large as the strain under rapid loading, creep is of considerable importance to structures. The random variability of creep and shrinkage effects in concrete structures is often very large and should be accounted for in assessment (Madsen, 1983).
5.4.5 Considerations when modelling steel reinforcement
5.4.5.1 Uncertainty in steel reinforcement The uncertainties in the determination of steel strength are due to the variation in the strength of the material, variation in cross section of the bar, effect of rate of loading, and on effect of bar diameter on the properties of the bar (Mirza, 1979a). Effort must be made to ensure that distri-butions determined from test data are properly transformed to represent the in-situ conditions and the type of test performed. Different tests may sometimes be performed to measure the same property. For example, often there are two quoted steel strengths, the mill test strength and the static strength. The mill strength tests are done at a rapid rate of loading and use actual areas. The static strengths are determined based on nominal area and use a strain rate that is similar to what is expected in a structure.
5.4.5.2 Yield and ultimate strength The yield strength of reinforcing steel is taken as the stress at a corresponding strain. This strain normally corresponds to the initial plastic deformation of the reinforcement. A model for the yield strength of reinforcing steel is proposed in (JCSS, 2001), taking into consideration the varia-tions in global mean of different mills, the variations in a mill from batch (melt) to bath and the variations within the melt. Normal or beta distributions can be used to represent yield strength (JCSS, 2001; Mirza, 1979a).
Strength fluctuations along bars are negligible (JCSS, 2001; Woodward, 1999). The yield force of a bundle of bars under static loading is the sum of the yield forces of each contributing bar. In general, it can be assumed that all reinforcing steel used at a job originates from a single mill. The correlation coefficient between yield forces of individual bars of the same diameter can be taken as 0.9 (Rackwitz, 1996). The correlation coefficient between yield forces of bars of different di-ameter and between the yield forces in different cross sections in different beams in a structure can be taken as 0.4 (JCSS, 2001). The ultimate strength is often represented by normal or beta distributions (Mirza, 1979a; JCSS, 2001).
5.4.5.3 Variations in area of bar cross section The actual areas of reinforcing bars tend to deviate from the nominal areas due to the rolling process. In general it has been found that the ratio of the actual to the nominal area is less than 1 and can be represented by a normal distribution (Mirza, 1979a; JCSS, 2001; Allen, 1972; Wiss, 1973).
COST 345 Final Report
90
5.4.5.4 Modulus of elasticity There is no difference in the modulus of elasticity of Grade 40 and 60 reinforcing steel (Mirza, 1979a; CEB-FIP, 1991).
5.4.5.5 Coefficients of correlation Coefficients of correlation between reinforcement area, yield stress and ultimate strength are given in (JCSS, 2001).
5.4.6 Conclusions on material modelling
Material properties play an important role in the determination of the behaviour of highway structures. The uncertainties associated with material properties can be taken into consideration using probabilistic methods. When determining the values of material properties to be used in the assessment of an existing structure, the difference between test values and in-situ material properties must be considered, as well as the effects of compliance controls.
5.5 STRUCTURAL RESPONSE MODELLING
5.5.1 Introduction
The assessment of a highway structure requires the calculation of the response of a mathematical model of the structure to a complete range of loading conditions. This model should satisfy condi-tions of equilibrium and produce deformations compatible with the continuity of the structure and support conditions. It must be checked that reactions and internal forces/stresses at all sections of the structure are within reasonable safety levels. An assessment at Level 1 (Section 5.1.3) is carried out with traditional methods of structural analysis (simple, convenient and often conservative) while assess-ment at higher levels will involve more refined methods of analysis.
Compared to the design stage, the assessment of a structure needs to determine what the physi-cal structure really is. The designer has assumed by mathematical relationships the uncertainties related to the ultimate loads assumed, the relationship of actual material properties and the extent to which all the potential failure modes can be modelled (Baker, 1988). In the process of assess-ment, some of these uncertainties can be reduced through suitable field measurements. There-fore, partial factors used in design are inappropriate for assessment purposes. It must be ac-knowledged that the determination of partial factors for assessment will still be subjective to some extent and regardless of the method of analysis chosen, there will be uncertainty in many of the parameters.
Separate or interdependent mathematical models of the structure and the soil can be established to determine the structural response. Hence, a particular model for a given structure will be influ-enced by the assumptions adopted for the foundation and the soil. If the ground can sustain the loading with acceptable displacements or provide appropriate stiffness, soil-structure interaction can be ignored in low-level studies. The method of analysis to be used will depend on the follow-ing characteristics: • behaviour of the structural material, • structural geometry and boundary conditions and • nature of the applied load.
COST 345 Final Report
91
Traditional methods of structural analysis are based on one- or two-dimensional (2D) models with elastic materials, geometric linearity and static loads. Other available techniques allow for three-dimensional (3D) modelling, a variety of non-linear response actions and dynamics. In higher levels of assessment, the method of analysis should ideally take account of all the signifi-cant aspects of the structural response to loads and imposed displacements. In the following pages, a number of currently available analysis techniques and the incorporation of field data into the structural models are reviewed and classified into the five levels of assessment proposed in Chapter 5.1.3.
5.5.2 Methods of analysis
At first, structural assessment methods were purely based on experience. Then, findings in the 16th century allowed the use of criteria based on statics or elasticity. In the 19th century, the applica-tion of energy methods resulted in methods based on allowable stresses. Today, structures are gen-erally assessed with limit state methods (plastic methods, finite element methods and non-linear methods are employed in this calculation) and probabilistic approaches. The near future is orien-tated towards a reliability-based design/assessment approach.
A limit state is a condition beyond which a structure, or a part of it, would become unfit for its intended use. A limit state can be assessed on a deterministic or a probabilistic basis. A serviceabil-ity limit state (SLS) denotes a loss of utility, e.g. due to cracking, exceeding displacements or vibra-tions. The ultimate limit state (ULS) corresponds to the maximum load-carrying capacity of the structure or its section leading to collapse. It can be reached by: • loss of equilibrium when a part or the whole structure is considered as a rigid body, • excessive stresses in a section or the whole structure due to post-elastic or post-buckling be-
haviour and • fatigue failure.
A first division of methods of analysis could be made into empirical, algebraic and numerical. Other divisions could be made according to the number of dimensions of the structural model (framed structures or walls and slabs), the behaviour of the structural material (elastic or plastic), the magnitude of the displacements with respect to the original geometry (linear or non-linear), the characteristics of the section (cracked or uncracked reinforced concrete section), the nature of the applied load (static or dynamic) or the definition of the structure (in deterministic or prob-abilistic terms).
5.5.2.1 Empirical, algebraic, and numerical methods Empirical methods are simplified analytical tools, applicable to very specific cases. They have the ad-vantage of providing a quick assessment of the structure, generally conservative. They only need a few geometric parameters. Their main disadvantage lies in the subjective appraisal of some parame-ters while ignoring many others. Algebraic methods are limited to cases where load distribution, sec-tion properties and boundary conditions can be described by simple mathematical expressions. Nu-merical methods provide a more practical means of analysis for complex structures. Unlike the sub-jective idealisations assumed in empirical methods, numerical methods can allow for: • a definition of the real structural profile, preferably obtained from observation and meas-
urements on site, • a more accurate spatial localisation of the applied load and • a structural model with strength properties equivalent to that of the material characteristics
of the real structure, preferably taken from load tests.
COST 345 Final Report
92
The finite element (FE) method is the most popular numerical method. Others are less general: e.g. the finite difference method, successfully applied to bridge decks that can be simulated with orthotropic plate theory, or the finite strip method, successfully applied to straight, skew and curved-plate and folded-plate structures.
When using the FE method, the structures are subdivided into a finite number of simple ele-ments, and complex differential equations are solved for the simple elements. In frames, trusses and grids, the elements are bars/beams connected at nodes. In walls, slabs, shells and mass struc-tures, 2D and 3D continuous elements are used. FE analysis may be used for detailed stress analysis. Even though it ignores a lot of uncertain characteristics of the structure, a 3D model can be capable of predicting the structural response satisfactorily.
5.5.2.2 Frame and spatial analysis Frame analysis is used for framed structures that are discretised as a set of one-dimensional members. Framed structures consist of members that are long compared to their cross section (e.g. beams, grids, plane and space frames or trusses). When structures with two significant di-mensions (e.g. a wide bridge deck) are studied with frame analysis, the effects of transverse load distribution or the transverse composition of the structural material cannot be taken into ac-count. In spatial analysis, the internal forces/moments generally have six components. Further assumptions are sometimes made in order to simplify the 3D problems.
5.5.2.3 Cracked or uncracked analysis It is normal practice to analyse using gross section properties. More accurate analysis allows for cracking of sections. The rigidity of a section can be greatly reduced when allowing for cracking. The relative rigidity of cracked and uncracked sections might affect bending moments.
5.5.2.4 Elastic and plastic analysis Elastic methods are commonly used to analyse the performance of a structure, especially con-cerning serviceability, while plastic methods are used to analyse the mechanism of collapse of a structure.
1. Elastic methods: Steel structures and concrete subjected to small displacements obey Hooke’s law (linear elastic deformation). When the stress-strain relationship is non-linear, it is necessary to develop an expression relating forces and deformations in terms of stress and strain, axial load and extension, or moment and curvature. When deformations in a structure are proportional to the applied load, the principle of superposition applies and the in-ternal forces can be determined by adding the effect of the forces applied separately. If the structure is statically indeterminate, the principle of superposition is valid only if Hooke’s law is obeyed because the internal forces depend on the deformation of the members.
2. Plastic methods: The plastic approach is increasingly used in design, particularly for steel construction. The load is increased until yielding occurs at some locations. On further in-crease a fully plastic condition is reached, at which a sufficient number of plastic hinges are formed to transform the structure into a mechanism. This method is limited by the effect of repeated loading and instability. For slabs, the yield-line theory gives an upper bound of the ultimate load capacity of a reinforced concrete slab by studying assumed mechanisms of failure (Ghali, 1989; Nielsen, 1984). The strip method gives a lower bound solution to the collapse load. Neither the yield-line method nor the strip method of ultimate load guarantee safety against cracking or excessive deformation at service loads. Then, failure can occur prior to the occurrence of a mechanism if insufficient ductility exists at plastic
COST 345 Final Report
93
hinges. Yield line methods can be difficult to use in assessment and the FE Equilibrium method offers an alternative solution.
5.5.2.5 Linear and non-linear geometry In some cases, the geometry of the structure is substantially distorted by the applied loads, and equilibrium cannot be based on the original directions and relative position of loads and mem-bers. As a result, the structure behaves nonlinearly even if the stress-strain relationship of the material is linear. For instance, if axial forces are large, they can cause a change in bending stiff-ness (especially in slender members). A non-linear analysis is required in the cases of creep and shrinkage in concrete, accurate simulation of cyclic load effects, etc.
5.5.2.6 Static and dynamic analysis From the point of view of the nature of the applied load, the methods of analysis can be static or dynamic. Static forces produce displacements that do not vary with time (Sub-sections 5.5.2.1 to 5.5.2.5).
Dynamic forces are time-dependent and cause vibration of the structure. These forces can be re-lated to cyclic loading (analysed with methods of fatigue assessment), impact loading (analysed with empirical methods), seismic and wind loading (analysed using response spectra methods), or free/forced vibration due to traffic (analysed with finite element interaction models):
Dynamic response analysis incorporates uncertainties regarding boundary conditions, imperfection effects, levels of damping and of excitation. In order to solve the dynamic problem, the structure is generally discretised through lumped-mass, generalised displacements or finite element procedures (Clough & Penzien, 1993). There are different types of dynamic analysis: • Real eigenvalue analysis is used to determine the basic dynamic characteristics of a structure, the
frequencies and mode shapes at which the structure naturally tends to vibrate. Some ap-proaches to solve this problem are: Givens Householder and modified Givens Householder methods (for small, dense matrices), inverse power and Sturm modified inverse power (for determining a few modes) and Lanczos (for medium to large models).
• Frequency response analysis calculates the response of a structure to loads that vary as a function of frequency. Two different methods can be used in frequency response analysis: the direct and the modal methods. The first one solves the coupled equations of motion in terms of forcing frequency using complex algebra. The other utilises the mode shapes of the structure to reduce and uncouple the equations of motion.
• Transient response analysis calculates the response of a structure to loads that vary with time. The time-varying loading can include non-linear effects that are a function of displacement or velocity. As in frequency response analysis, direct and modal methods can be used depend-ing upon the structure and the nature of the loading.
• Others include response spectrum analysis, random response or non-linear transient response and can be used in combination with one of the preceding methods.
The accurate analysis of earthquake and wind effects is highly complex (Gould & Abu-Sitta, 1980). When the wind action is considered, the degree of sophistication of the analysis can be re-lated to the probable maximum mean hourly wind speed appropriate to the return period, the fundamental natural frequencies and the wind-loaded lengths of critical members. In practice, only wind-sensitive and/or large bridges need to be investigated for interaction with wind.
Earthquake loading is a common application of enforced motion at a set of points in the structure for transient response. Rigorous dynamic analysis requires the use of characteristic earthquake accelerograms. The large-mass method can be used to model the action of an earthquake and sim-
COST 345 Final Report
94
pler deterministic methods based on spectra response to estimate the maximum displacements of the structure. Structural models can be lumped or generalized coordinate, single or multi-degree of freedom, elastic or elasto-plastic systems, subjected to translation, rotation or multiple excita-tion. More complicated analysis, involving the random nature of the excitation and the non-linear nature of the response, may be desirable in some cases. If the soil is resting on rigid-base rock, the soil can be represented in the analytical model by combining a layer of soil with the structure model. As stiffness and damping properties of the soil substructure are frequency dependent, the earthquake response analysis is more conveniently carried out in the frequency domain and then transformed back into the time domain.
The passing of a truck over a bridge is an enforced motion transient problem. The following tech-niques can be used to simulate bridge-vehicle dynamic interaction: • Lagrange multiplier techniques: The Lagrange Multiplier formulation allows for the representation
of the compatibility condition at the bridge/vehicle interface through a set of auxiliary func-tions. An entry into the assembled stiffness matrix of the vehicle-bridge system allows for the definition of the forces acting on the bridge due to the moving wheels. A compatibility con-dition between the vertical displacement of the wheel and the bridge at the contact point is also established (Cifuentes, 1989).
• Convolution methods: The bridge and truck are modelled separately and combined in an iterative procedure. The method involves convolution of the vehicle loads either in the time domain or with modal responses of the bridge. The convolution integral is solved by transformation to the frequency domain using the fast Fourier transform. The method is then extended by an iterative procedure to include dynamic interaction between the bridge and a mathematical model of a vehicle (Green & Cebon, 1994).
5.5.2.7 Fatigue assessment The Palmgren-Miner rule is commonly used for fatigue damage calculation. Fatigue can be as-sessed by: • simplified methods that are applicable to parts of bridges with classified details and which are
subjected to standard loadings or • methods using first principles that can be applied in all circumstances.
Palmgren-Miner rule can be used to compute the total lifetime of a new structure, but it does not allow the prediction of remaining lifetime of existing or partially damaged structures (Jacob 1998). A Fracture Mechanics approach, such as Paris-Erdogan’s law, can be used for this purpose, though they require knowledge of more parameters than the Palmgren-Miner’s rule.
5.5.2.8 Impact assessment Accidental collision impact loading is usually specified in the form of equivalent static loads to be applied at specified levels against balustrades and piers. A correct dynamic analysis is highly com-plex so that present designs are based on full-scale tests using a vehicle with appropriate impact characteristics.
5.5.2.9 Deterministic and probabilistic analysis Generally bridges are assessed using deterministic methods with elastic or plastic limit state analy-sis. Fully deterministic methods derive the loads from worst possible traffic conditions and nominal material strength values. However, probabilistic analysis can be considered in special cases, e.g. to check the need for bridge strengthening. In a probabilistic analysis, uncertain pa-rameters concerning load (Section 5.3), resistance (Section 5.4) and the computer model are rep-resented as stochastic variables with corresponding statistical distributions.
COST 345 Final Report
95
5.5.3 Bridge structures
When assessing bridges, those failure modes, against which the structure was originally designed, must be checked (e.g. ultimate capacity of a structural member being exceeded as a result of overloading). Failure can occur due to: • yielding of the material at a sufficient number of locations to form a failure mechanism, • buckling induced by axial compression or • torsional-flexural buckling without stresses exceeding the elastic limit.
Inspection strategies are used to assess the structure and prevent failure modes resulting from lo-calised deterioration of critical components (e.g. corrosion of a prestressing cable) which are not considered herein (Woodward & Bevc, 2003).
Elastic methods of analysis should be used to determine internal forces and deformations. Plastic methods of analysis (e.g. plastic hinge methods for beams, or yield line methods for slabs) may be used when they model the combined local and global effects adequately, though elastic methods generally lead to more conservative solutions. All members must be assessed for the worst com-binations of loading. The maximum load-carrying capacity of a structure is calculated for the ul-timate limit state (instability, buckling, fatigue).
The behaviour of the deck structure must be checked against different modes of failure. This procedure is generally assessed in successive steps as follows:
a) The response of the structure is checked first by linear elastic analysis. Modules of elasticity and shear modulus values should be appropriate to the section material. In-plane shear flexibil-ity should be allowed for in concrete flanges of box sections due to shear lag effects.
Primary stresses can be obtained from the combined effect of all the local load actions in producing bending, shearing or twisting of the structure. Conventional structures can be calculated using beam theory. However, more rigorous treatment allowing for second order effects (shear lag, warping, etc.) might be necessary for unconventional structures (e.g. thin-walled box-like structures). The ultimate capability of the structure can be calculated using plastic bending theory.
When assessing a structure, if the supports have moved compared to the design stage, they will induce internal forces in a statically indeterminate structure. A change in stress distri-bution within a section due to differences in temperature variation, shrinkage or creep can also be revealed during the assessment process.
b) Different parts of the structure can be analysed using elastic grillage theory, beam-and-slab models, finite element methods, etc. (Hambly, 1991). Clearly, the assessment of 3D effects can only be done accurately with 3D models.
The grillage analogy involves idealising the structure as a number of longitudinal and transverse beam elements, rigidly connected at nodes. Transverse beams may be orthogonal or skewed with respect to the longitudinal beams. Each beam element represents either a composite section (e.g. main girder with associated slab) or a width of slab (e.g. a transverse beam may represent a width of slab equal to the spacing of the main beams). In a beam-slab model plate-bending finite elements are added to the grillage. A fine model mesh al-lows for an analysis of local effects due to wheel loadings.
The bridge deck can be analysed with planar models. However, the use of effective flange widths is only approximate and it cannot address the issue of upstands. Hence, for accurate results, bridge decks with edge cantilevers, voided decks, cellular box or transverse dia-phragms should be modelled in 3D, but these models are considerably more complex.
COST 345 Final Report
96
Brick type elements can be used to describe the geometry of highly complex bridge decks very accurately.
c) Finally, discontinuities and details can be analysed by elastic analysis to determine the de-tailed stress distribution using finite element methods, etc. Load actions near discontinuities will be taken into consideration. Further stresses as a result of this stress concentration can result in fracture and a fatigue analysis is required.
5.5.4 Culverts
The culvert will respond differently if it is made of corrugated steel (flexible) or reinforced con-crete (rigid). While steel structures deflect longitudinally to conform to the surrounding founda-tion, reinforced-concrete structures tend to behave as beams due to the stiff nature of its box-type structure.
Flexible culverts are thin-walled structures and their integrity depends mainly on the confining capability of the surrounding soil. Techniques to incorporate the effect of soil-structure interac-tion are presented below. The response of a 3D finite element culvert model involving soil-structure interaction might differ significantly from a 2D approach. In soil-structure systems in-corporating rigid culverts, the stiffness of the culvert will be well in excess of the stiffness of the surrounding soil mass and interaction effects are much less important.
5.5.5 Earth-retaining structures
There are two main types of retaining walls: • Non-embedded walls: Stiff structures for which the soil-structure interaction is relatively
simple (e.g. gravity, counterfort or cantilever walls). • Embedded walls: Flexible structures for which the soil-structure interaction has a strong in-
fluence on its behaviour (e.g. embedded cantilever walls, propped or anchored cantilever walls).
Retaining walls and soil are mutually interdependent. The soil does not only generate loading but also adjusts and distributes earth pressures to accommodate small movements.
5.5.5.1 Simple models In the first analysis of an earth retaining structure, soil-structure interaction can be ignored and bending moments in the wall can be calculated from the assumed earth and water pressure dia-grams. Although the behaviour of the wall is not truly represented, this method provides an ade-quate factor of safety in terms of stability, and it is necessary before moving to other methods to take into account the relative stiffness between soil and structure. Limit equilibrium (Coulomb wedge analysis), stress field (Rankine) and limit analysis (upper and lower theorems of plasticity) are simple methods of analysing retaining walls (Potts, 1992). All of these methods assume the soil to be everywhere at failure. Empirical factors have to be used to allow for wall flexibility and sur-charges have to be made in an approximate manner. A grillage analysis of edge corner effects can be used for studying 3D structures (e.g. abutments).
5.5.5.2 Sophisticated models More elaborate models of earth retaining structures allow for soil-structure interaction, but they require information on the stiffness characteristics of the wall, the soil and the props or ground anchors, the shear strength parameters and water conditions, in addition to the initial in situ soil
COST 345 Final Report
97
stresses. The difficulty of assessing these parameters reliably limits the accuracy of the predic-tions obtained with these methods.
Beam on elastic foundation (Winkler springs) requires appropriate values for the spring constants to represent the ground behaviour. Complex retaining structures are reduced to a single isolated wall and much of the soil-structure interaction is not considered. The wall is represented using ei-ther finite differences or finite elements. Winkler models are suitable for determining internal forces, but, if displacements around the excavation are to be predicted, a continuum model is re-quired. A beam on springs requires less computer resources than finite element methods, but computer capacity is generally not a limiting factor today.
Continuum models: As in the beam on springs approach, general ground movements are not al-lowed in continuum model calculations. The advantage of a continuum model is the small com-putational effort required when compared to more sophisticated finite element models. Contin-uum models use interaction coefficients derived from finite element analyses or boundary integral equations. They are commonly applied in the case of embedded walls.
Finite element method takes account of the interaction between all the components within the retaining wall (geometry, soil parameters and boundary conditions). For over-consolidated clay, linear elastic finite-element methods might achieve good predictions of overall ground and wall movements. More sophisticated models are necessary to predict the magnitude of the move-ments behind the wall. For soft clays and sands, yield in shear should be included in the finite elements modelling the soil. The major source of uncertainty arises from a lack of knowledge of the pressure due to compaction of the retained soil.
5.5.6 Reinforced-soil structures
Reinforced soil can be used as an alternative to earth-retaining structures. A simplistic approach assesses its internal and external stability through the use of ultimate properties. Additionally, in-ternal stability can be assessed with a permissible-stress approach.
When using the finite-element method, the structure is commonly modelled in 2D. Strip rein-forcements can be treated as sheets with equivalent tensile and frictional characteristics or as a single material with properties representative of both soil and reinforcement. Due to the difficul-ties of analysing collapse in a discretised system, the finite element method is not capable of pro-viding reliable detailed behaviour. However, it can be useful where conventional methods are not feasible (i.e. analysis of reinforced soil in combination with a structure).
5.5.7 Tunnels
Methods of analysis of tunnels range from simple beam-and-spring models to finite element models incorporating bedding, fracture planes and other elaborate features. Beam-and-spring models represent the tunnel lining as a string of interconnected pin-ended structural beams, and the ground as a series of radial springs. The cohesion or internal friction of the ground is not represented in these models. A finite element mesh can be used to represent the ground with in-ternal friction and cohesion properties and linear elastic axial and shearing stiffness. Some models allow for elasto-plastic behaviour and ground properties are varied in different layers (Bickel, 1996). However, the use of analytical methods is less reliable than for other types of structure due to the complexity of the system and the variability of the ground. Thus, the use of 3D finite element modelling and plasticity is limited to research and empirical methods have been devel-oped to cover a wide range of circumstances.
COST 345 Final Report
98
5.5.8 Integration of field data and structural models
In order to represent the structural response correctly, accurate field measurements must be taken. The quality of the output depends on the quality of the input. Accordingly, complex ana-lytical tools can only be justified if a realistic assessment of the material properties and overall condition of the existing structure can be made. Then, structural models can be improved by measuring dynamic effects or by measuring other results of load testing.
5.5.8.1 Visual inspection It is necessary to carry out a visual inspection of the structure being assessed (Woodward and Bevc, 2003). This inspection might reveal: • scouring of piers and/or abutment supports, • cracks in a section of the structure, • quality and condition of the structural material, • deformations of the profile, • condition of the joints, • damping devices.
Calculations can vary as result of observation. Additionally, a number of reduction factors relat-ing to the condition of the bridge can be adopted based on observation. There is a need for a ra-tional basis for these reduction factors. The structure dimensions should be measured with ap-propriate surveying equipment on site and in the case of observed deformations, the new profile should be considered in the analysis.
5.5.8.2 Material and live load testing The assessment of a structure might require more data than purely the observation of the visible portion of the structure. Concrete tests include cover depth, rebound hammer, ultrasonics, im-pact echo, permeability, carbonation, thermography, radar, slot cutting, instrumented coring and others. Testing of reinforcement corrosion includes half-cell potentials, resistivity and rate of corrosion, chloride concentration and monitoring. Post-tensioning tendons can be tested with exploratory hole drilling, radiography, ultrasonics or through monitoring. Other tests are related to the determination of in-situ stress (Mallett, 1994).
Load testing must be carried out with caution and must protect the structure from further dete-rioration. Garas (1987) verified by testing some of the methods of analysis at realistic scales, which cannot be achieved in the laboratory. The passage of heavily loaded trucks can be used to determine the actual live-load behaviour of the structure and to predict maximum live-load stresses. Forced vibration (controlled excitation with a shaker, a hammer, rockets or the quick re-lease of forced displacements) or ambient vibration methods (due to natural causes such as wind, micro tremors and traffic) are typical dynamic tests to determine the frequencies and mode shapes of vibration of a bridge (Deger, 1996). As tests at full scale are expensive and limited, scaled physical models using measurements from testing on the real structure, could also be used for assessment purposes.
The original structural design might have been altered not only due to ageing and the application of loads, but also grouting, saddling, guniting or post-tensioning in previous maintenance pro-grammes. Housner (1997) discuss control systems, sensors for structural control, health monitor-ing and damage detection of Civil Engineering structures. Strains or displacements of the struc-ture are generally measured under the application of a load of known characteristics (static or dynamic). These measurements can give more realistic values for:
COST 345 Final Report
99
• support stiffness, joint condition, restraints, • behaviour of the cross section, • elastic properties of the structural material, • behaviour of the foundation, • fill and structural material density, • road profile (i.e. a bump, rutting, a pot-hole, etc.) and its effect on the traffic load and on the
structure, • natural frequencies and damping, • stiffness matrix.
Then, these characteristics can be incorporated into the structural model.
5.5.8.3 Calibration of the structural model The structural model is only as accurate as the assumptions made for its response to the applica-tion of a load. A combination of experimental data and a structural model can provide an insight into why a structure is behaving as observed. Optimisation techniques are commonly used for ad-justing parameters of the structural models to field measurements. Parameter values are deter-mined by comparing the measured and predicted response (Žnidarič, 1998, Quilligan, 2002). A unique solution is not always ensured and it is beneficial to have the best possible initial model (i.e. clearly defining the geometry). Data might be taken from design drawings but should be veri-fied by in situ measurements, especially for critical members, before starting the optimisation procedure. Then, the updated models can be used to more accurately predict and assess the be-haviour of the structure under different static or dynamic loading conditions. In a structural reli-ability model, the uncertainties in the design parameters are modelled probabilistically.
The process of identifying the behaviour of a given structure is summarised in the following steps (Doebling & Farrar, 1999): • Definition of the model chosen to predict the structural behaviour and the parameters of the
model to be identified. Sophisticated finite element models require parameters such as strain-displacement relationships, material constitutive properties, structural connectivity, geometric distribution of mass and structural damping. Assumptions must be made, i.e. linearity, time-invariance of model parameters or, for more complicated models: non-linearity, properties defined in terms of a probability distribution, etc.
• Definition and acquisition of the experimental data. There are two types: response measure-ments (static or dynamic) and excitation measurements.
• Definition of the objective function and the constraints. • Implementation of the optimisation technique to determine the identified parameters
(Friswell & Mottershead, 1995). The most common technique is least-squares minimisation. This approach calculates the structural properties such as stiffness, elastic modulus, density and thickness, which minimise the sum of squares of differences between the model and the measurements.
5.5.9 Levels of assessment
Methods of analysis are established for each structure and for five different levels of assessment. The levels reflect the level of sophistication of the analysis or time available to the assessor (Sec-tions 5.1.3.1 to 5.1.3.6). Level 1 of assessment corresponds to more simple/conservative meth-ods, while higher levels will be used for more rigorous modelling. The number of parameters re-quired increases with the level of assessment. Therefore, parameters for lower levels of assess-
COST 345 Final Report
100
ment can be based on visual observation, but parameters for higher levels of assessment may need load testing. The same methods of structural analysis are used for Level 2 and above, but specific material properties and loading can be included in higher levels. Hence, full partial factors from assessment standards can be used for Level 1, but characteristic strengths of materials must be based on data from the same or a similar structure for Level 2 and on load tests on the struc-ture being assessed for Level 3 or higher. Level 4 uses modified partial safety factors to account for any additional safety characteristics specific to the structure being assessed and Level 5 uses structural reliability analysis instead of partial safety factors (Section 5.7.1). Theoretically, the out-put of higher levels of assessment could be used as a diagnostic tool to prevent weaknesses at lo-calised points and/or information on safety values.
All categories are summarised in Table 5-2. A stability analysis is also to be considered in Level 1. An assessment associated with complex mathematical modelling should be used with consider-able caution. The analysis of a special load (i.e. the dynamic response of a bridge to the crossing of a truck) might require some numerical manipulation (i.e. convolution or Lagrange technique) of these structural models.
5.6 TARGET RELIABILITY LEVELS
5.6.1 Introduction
The target reliability level is the level of reliability required to ensure acceptable safety and serviceabil-ity of a structure. The selection of the target reliability depends on different parameters such as the type and the importance of the structure, possible failure consequences, socio-economic factors etc. Thus, the requirements for safety and serviceability for the assessment of existing structures are in principle the same as for the design of new structures. The main differences are: • economic considerations: the incremental cost between acceptance and upgrading an existing
structure can be very large whereas the cost increment of increasing the safety of a new structure is generally very small; consequently conservative criteria are used in the design standards for new structures,
• social considerations include disruption (or displacement) of occupants and activities as well as heritage values, considerations that do not affect the structural design of new structures,
• sustainability considerations: considerations relating to reduction of waste and recycling, are more prevalent in the rehabilitation of existing structures.
As a consequence the goal of minimum structural intervention which makes as much use of the existing materials in the structure as possible, applies for most existing structures of normal oc-cupancy and use.
5.6.1.1 Formats for specifying target reliability levels In order to be able to evaluate the results of an assessment and to judge whether a structure is deemed to be safe or not, target reliability levels must be specified by the authorities or bridge owner. They can be explicitly or implicitly specified in a code in different ways: • Level A: Global safety factor formats and allowable stress formats. With the Level A format,
only one safety factor is applied resulting in a lack of flexibility to adjust the safety margin ac-cording to differences in load dispersion, load combinations, consequences of failure and un-certainties in material modelling, load modelling and response modelling. Furthermore, Level A formats must be very conservative in order to cover all practical cases and therefore cannot be recommended.
COST 345 Final Report
101
• Level B: Semi-probabilistic load and resistance factor formats using partial safety factors and limit state design. The verification of the required safety applies limit states in which the rele-vant load, strength and geometrical parameters are specified as characteristic values, each as-sociated with a safety factor. These partial safety factors should reflect the actual knowledge of the uncertain parameters in the assessment. Level B formats are the core in any modern design code and are highly recommended as the format for establishing a general code for the assessment of existing structures.
Table 5-2 Analysis methods recommended for each level of assessment
Level of Assessment Structure Type
1 2 3 4 5
Not skew Beam
1-, 2- or 3-D linear or non-linear;
elastic or plastic; allow-ing for cracking
Not skew Slab Not skew
Beam & Slab Not skew Cel-
lular
1-D or 2-D linear elastic (beam theory
or plane frame analysis)
Skew, tapered and curved
1-D or 2-D simple grillage, linear elas-tic allowing for tor-
sion
2- or 3-D linear or non-linear;
elastic or plastic; allow-ing for cracking;
grillage or FEM (up-stand model if neces-
sary)
Arch Empirical or 2-D linear elastic arch
frame
2- or 3-D linear or non-linear; elastic or plastic; al-lowing for cracking
Bri
dge
s
Cable Stayed
2-D linear elastic with modified
modulus of elasticity for the cables
2- or 3-D linear or non-linear;
elastic or plastic; model-ling cable sag more ac-
curately
2- or 3-D; linear or non-linear;
elastic or plastic; grillage or FEM (upstand model if necessary); allow-
ing for soil-structure in-teraction, cracking, and
site-specific live loading & material properties
Rigid Frame linear elastic
Cu
lver
ts
Flexible
Frame linear elastic allowing for soil-
structure interaction (beam & spring)
2- or 3-D FEM linear or non-linear;
elastic or plastic; allowing for soil-
structure interaction, cracking
2- or 3-D FEM, linear or non-linear; elastic or
plastic; allowing for soil-structure interaction,
cracking and site-specific loading & material prop-
erties
Earth-retaining walls
Simple equilibrium method of analysis
Beam, 2- or 3-D non-linear FEM on
elastic foundation or elasto-plastic
continuum
3-D non-linear FEM, al-lowing for soil constitu-
tive models and site-specific loading & mate-
rial properties
Reinforced soil
Empirical models or 1-D linear
elastic
2- or 3-D FEM of soil
2- or 3-D FEM of soil in combination with existing structure and site-specific loading & material prop-
erties
Tunnels
Empirical models or beam-and-spring
models (non-cohesive soil)
2- or 3-D FEM; linear or non-linear;
elasto-plastic
3-D non-linear FEM with bedding, fracture planes, … and site-specific load-ing & material properties
FEM
ana
lysis
of sp
ecifi
c de
tails
of t
he st
ruct
ure
bein
g as
sess
ed n
ot c
onsid
ered
in p
revi
ous l
evels
Relia
bilit
y an
alysis
bas
ed o
n pr
obab
ilist
ic m
odels
COST 345 Final Report
102
• Level C: Probability-based formats (also reliability index formats of probability of failure formats) are also based on limit states. However, the uncertainties in the loads, strength, ge-ometry and the model are reflected directly in the modelling of the stochastic variables. The result of the analysis is the formal probability of failure with a specified reference period. The target levels must be specified as requirements for the probability of failure. In order to have a cohesive format, specifications on the modelling of uncertainties, including modelling uncertainties, must also be provided in the format. Level C formats are the basis for a more refined safety analysis which is recommended if it is believed that a Level B based assessment is too conservative.
• Level D formats take economical considerations into account. These are basically formats in which the partial safety factors in Level B or the target probabilities of failure in Level C are modified with economic considerations. The format is then based on, for example, decision-theory or life cycle cost.
5.6.2 Determination of the target reliability levels
Before some requirements for determining the target reliability levels for assessment of existing structures are described, it is important to stress that all the formats are examples of a formal set of verification rules which cannot be reflected in occurrence probabilities. It is therefore very important to be aware of the fact that only documented safety and approaches to improve the degree or level of documentation are covered by the approaches presented. Topics such as the “real” safety or the “real” load carrying capacity cannot be included formally. One of the reasons for this is that all the methods presented do not take into account the effects of possible gross human errors. These need to be addressed by appropriate counteracting strategies developed in the field of Quality Assurance. Quality Assurance strategies are outside the scope of this study.
5.6.2.1 Level A formats for assessment of existing structures The target reliability level used can be taken as the level of reliability implied by acceptance crite-ria defined in proven and accepted design codes. The calibration based on existing codes assumes that existing practice is optimal and that a correct application of the valid codes and standards re-sults in a safe structure. Traditional deterministic codes employing allowable stress or general safety factor formats are still in use in some countries. However, applying these codes and their load combination rules to the assessment of structures can lead to major inconsistencies in deal-ing with safety checking. Structural design codes usually deal with only one type of material or form of construction, such as steel, reinforced concrete, prestressed concrete or timber.
5.6.2.2 Level B formats for assessment of existing structures The partial safety factors in Level B formats as known from many design codes, can basically be obtained by applying two approaches: 1) judgment or guesstimation and 2) code calibration. In (1), which is the most commonly applied (as for example in some Eurocodes), the partial safety factors are based on experience and knowledge from previous formats or safety levels which have been proven to work in practice. The code calibration is more rationally based on probabilistic analysis, i.e. the Level B format is established based on a Level C format. In contrast to codes for new structures, formats for assessment should make allowance for mat-ters such as the quality of inspection, the extent and quality of on-site measurements, potential failure modes and possible consequences of failure. Thus, for the assessment of existing struc-tures, the required number or sets of partial safety factors are considerably larger than for the de-sign of new structures. It is clear that the applied partial safety factors in general should be
COST 345 Final Report
103
greater in a crude Level 1 assessment than in a refined Level 4 assessment. The partial safety fac-tors provided, reflecting the degree of uncertainty in the knowledge, should allow for better knowledge and reward the effort of obtaining higher quality and less uncertain knowledge by in-troducing lower partial safety factors. It is recommended that these partial safety factors be ob-tained by applying code calibration and Level C formats, i.e., probabilistic analysis.
5.6.2.3 Level C formats for assessment of existing structures Level B formats must by nature be a generalisation in order to work for many types of bridge and for many types of material and are thus in many cases conservative. It can therefore be worthwhile for the individual bridge to apply a Level C format using probability based assess-ment. This format basically includes requirements for target reliability levels (e.g. maximum for-mal probability of failure), typical statistical distributions and model uncertainties.
The uncertainties are physical uncertainties (identification of materials, traffic load model), statis-tical uncertainties and uncertainties due to simplifications in the structural evaluation model. They are modelled as random variables which are the input parameters for the limit state. The in-clusion of the so-called model uncertainty, which accounts for simplifications in the load and re-sistance models, into the limit state formulation, is also very important. The evaluation of the limit state can be used directly to determine the formal annual probability of failure or the di-rectly related reliability index, β, applying standard techniques such as the First Order Reliability Method (FORM). Other reliability assessment techniques are also possible. A structure, which can be proven to have a reliability index higher than the respective minimum reliability index, can be considered safe enough. In many of the modern codes, the overall safety requirements are specified in terms of reliability indices or probabilities of failure (see Section 5.6.4). The values stated in the codes can be considered as minimum reliability levels.
5.6.2.4 Level D formats for assessment of existing structures All the methods to determine target reliability levels presented above do not take into account economic aspects of maintenance and failure of a structure and thus, the very important parame-ter of costs. However, the target probability of failure could be obtained from an optimisation of overall costs including the costs of failure in such a way that the overall cost accumulated throughout the life of a structure is minimal. These overall costs include the cost of planning and of execution, operation, maintenance and even cost of demolition and restoration of a structure. Some of these cost parameters are very difficult to determine accurately.
Decision-theory based criteria give a decision about an existing structure with respect to the three main courses of action: • leave the structure unchanged, • strengthen the structure or change its use, • demolish the structure and replace it with a new structure.
Two criteria can then be derived which include the sum of all costs of failure cfail and the esti-mated cost for creating a new structure cnew:
do nothing: ftnewfail
fA pcc
p <+
−/1
1 (5.1)
demolish: ftnewfail
fA pcc
p ≥+
−/1
1 (5.2)
COST 345 Final Report
104
pfA is the probability after assessing the structure, pft is the target probability of failure (e.g. code specified value).
Life-cycle decision approach - concept of the minimum total expected cost makes decisions about the acceptability of existing structures presented above and leads directly to the concept of optimal inspection and repair policies so as to minimise total expected costs including repair and expected costs as a consequence of failures. Reassessments become more likely to be necessary as a structure gets older. When the estimated reliability falls below an acceptable level, immediate action is required such as closing the road section or reducing the load.
5.6.3 Acceptable risk criteria
In general, acceptance criteria have been formulated as risk acceptance criteria or sometimes, risk tolerance criteria. In defining acceptable risk criteria, it is possible to take into account acceptable or tolerable risk levels for other risks in society.
5.6.3.1 Risks in society Before discussing the target reliability level it is advisable to compare the calculated probability of failure with other risks in society (Table 5-3) and from these to infer acceptable risks for struc-tures. There is a great difference between voluntary and involuntary risks. Also, the risk depends on the degree of exposure to a hazard as well as on the potential consequences. Engineering structures are used by people in the expectation that they will not fail; thus, the probability of structural failure may be related to involuntary risk.
The number of fatalities and the associated frequencies are therefore critical results of a risk analysis. The possible consequences as well as the accumulated frequencies can be shown graphi-cally on a double-logarithmic diagram, the so-called FN-curve. If two systems have the same ex-pected risk, the system with the steeper curve should be preferred as this implies relatively fewer accidents with great consequences.
Construction work 70-200 2200 150-440 Manufacturing 20 2000 40 Building fires 1-3 8000 8-24
Structural failures 0.02 6000 0.1
5.6.3.2 Acceptable or tolerable risk levels From the risks that are encountered in society, various bodies such as regulators of hazardous in-dustries (nuclear or chemical facilities), have developed acceptable or tolerable risk levels related
COST 345 Final Report
105
to the consequences of a failure. One approach is the concept of ALARP (as low as reasonably practical) defining an upper limit to the risk, where greater risk cannot be tolerated, and a lower limit below which is of no practical interest. Between these two limits the risk must be reduced (e.g. through spending money) to a level which complies with ALARP.
5.6.4 Comparison of target reliability levels
In the following section the target reliability indices of various codes and standards currently in use are compared, with the distribution types used, where available. The designer dealing with the assessment may select the values that are most suited and best applied to the solution of the problem at hand. When comparing the values in the tables presented in the following sub-Sections and deciding on a reliability level, one must always consider the different reference peri-ods used in the various documents (e.g. one year, life-time of the structure, etc.).
5.6.4.1 ISO/CD 13822:1999 In the ISO/CD 13822:1999 “Bases for Design of Structures – Assessment of Existing Struc-tures” Code (International Organization for Standardization, 1999), the target reliability depends on the type of limit state examined and the consequences of failure. The target reliability index ranges from 2.3 to 4.3 for structures with very low and very high consequences of failure resp. (Table 5-4). Thus, for the assessment of highway structures in the ultimate limit state, a value of 4.3 would be suitable for most cases.
5.6.4.2 ISO 2394:1998 In ISO 2394:1998 “General Principles on Reliability for Structures” (International Organization for Standardization, 1998), the target reliability index to be chosen for assessment of existing structures depends on the consequences of a structural failure as well as the costs of a safety measure (Table 5-5). The following distribution types were used for the derivation of the reliabil-ity level:
• Resistance: Log-normal or Weibull distributions. • Permanent loads: Gaussian distributions. • Time-varying loads: Gumbel Extreme Value distributions.
Serviceability reversible 0.0 intended remaining working life irreversible 1.5 intended remaining working life Fatigue inspectable 2.3 intended remaining working life not inspectable 3.1 intended remaining working life Ultimate very low consequences of failure 2.3 Ls years* low consequences of failure 3.1 Ls years* medium consequences of failure 3.8 Ls years* high consequences of failure 4.3 Ls years*
*Ls is a minimum standard period of safety (e.g. 50 years)
COST 345 Final Report
106
5.6.4.3 Eurocode 1:1993 The target reliability indices presented in draft Eurocode 1 “Basis of Design and Actions on Structures” (Eurocode, 1993) only depend on the type of limit state examined (Table 5-6). Nei-ther the consequences of failure, not economic considerations as far as the costs of certain safety measures are concerned, are taken into account.
Table 5-5 ISO/CD 2394:1998 – Consequences of failure
Consequences of failure Relative costs of safety measures small some moderate great
Low 2.3 3.1 3.8 4.3 *Notes: (A): for SLS, use β = 0 for reversible and β = 1.5 for irreversible limit states
(B): for Fatigue Limit State, use β = 2.3 to β = 3.1 depending on the possibility of inspection (C): for ULS, use β = 3.1, 3.8 and 4.3
Table 5-6 Eurocode 1:1993 - Target reliabilities
Limit states Target reliability index β
(design working life: bridges 100 years)
Target reliability index β (1 year)
Serviceability 1.5 3.0 Fatigue 1.5 - 3.8 -
Ultimate 3.8 4.7
5.6.4.4 NKB Report No. 36: 1978 The Nordic Committee on Building Regulations (NKB) Report No. 36 “Guidelines for Loading and Safety regulations for Structural Design” gives reliability indices depending on the failure type and consequence. The values recommended for the ultimate limit state for a reference pe-riod of one year are given in Table 5-7. For the serviceability limit state NKB recommends values of β = 1 to 2. The values presented in Table 5-7 are also the basis of the PIARC report “Reliabil-ity Based Assessment of Highway Bridges” (PIARC, 2000).
5.6.4.5 JCSS 2000 The publication of the Joint Committee of Structural Safety “Probabilistic Evaluation of Exist-ing Structures” (JCSS, 2000) is devoted directly to existing structures and probabilistic evaluation. The target reliability indices given for the ultimate limit state and a reference period of one year depend on the failure consequence and the costs of safety measures similar to ISO 2394:1998 (Table 5-8). For the serviceability limit state, values of β = 1 to 2 are recommended. From these target reliability indices the standard code calibration process can be applied to obtain modified partial safety factors.
Table 5-8 JCSS - Target reliabilities, ultimate limit state
Relative cost of safety measure
Minor conse-quences of failure
Moderate conse-quences of failure
Large consequences of failure
Large 3.1 3.3 3.7 Normal 3.7 4.2 4.4 Small 4.2 4.4 4.7
5.6.4.6 CSA 1981 The Canadian Standards Association (CSA, 1981) uses a different and slightly more complicated approach than the documents presented above. To determine the target reliability factors such as the element or system behaviour, the inspectability or the traffic category are considered to de-termine the appropriate reliability index (Table 5-9). It should be noted that the reliability indices given in the table are valid for a reference period equal to the life-time of the structure.
Table 5-9 CSA - Target reliabilities, ultimate limit state
β = 3.5 – (∆E+ ∆S + ∆I + ∆PC ) ≥ 2.0
Adjustment for element behaviour ∆E
sudden loss of capacity with little or no warning 0.0 sudden failure with little or no warning but retention of post-failure capacity 0.25 Gradual failure with probable warning 0.5 Adjustment of system behaviour ∆S
element failure leads to total collapse 0.0 element failure probably does not lead to total collapse 0.25 element failure leads to local failure only 0.5 Adjustment for inspection level ∆I
component not inspectable -0.25 component regularly inspectable 0.0 critical component inspected by evaluator 0.25 Adjustment for traffic category ∆PC
all traffic categories except Permit Controlled 0.0 Traffic category PC 0.6
COST 345 Final Report
108
5.6.5 Conclusions on target reliability levels
When a reliability assessment of an existing structure is performed, it has to be decided if the probability of failure is acceptable. As shown in this chapter there is no easy answer to that ques-tion. The Engineer carrying out the assessment of the structure has to decide which of the val-ues are most suited and best applied to the problem at hand as the estimated probability of fail-ure associated with a project is very much a function of the understanding of the issues, the modelling of the data, etc. Furthermore, it depends on costs as well as consequences of failure. Still, the target reliability indices presented in the sections above can be helpful when a decision on the acceptable probability of failure has to be made.
5.7 RELIABILITY ANALYSIS
5.7.1 Reliability analysis methods
In this Section, the different formats presented in Section 5.6 are described in more detail, focus-ing on the reliability analysis method applied within each format. Only a short overview of the principal methods is given here as the concepts of reliability analysis are thoroughly presented in the ISO Code 2394 (International Organization for Standardization, 1998) as well as the ISO/CD 13822 (International Organization for Standardization, 1999). Detailed background in-formation can also be found in many text books. For an easy to understand introduction to reli-ability analysis and basic methods, the books by Schneider (1997) and Thoft-Christensen & Baker (1982) are recommended. For more advanced problems the books by Ditlevsen (1981), Ditlevsen and Madsen (1996), Melchers (1999) as well as Ang and Tang (1984) might be helpful.
5.7.1.1 Global safety factor format The traditional method to define structural safety is through a general factor of safety, which may be selected on the basis of experiments, practical experience, economic as well as political con-siderations. Global safety factor formats were the basis for most of the former codes and stan-dards used throughout Europe. The general safety factor format is often associated with elastic stress analysis and requires:
g
fa
RRSγ
=≤ (5.3)
where S is the applied stress and Ra is the allowable stress, which is derived by dividing of the so-called failure stress Rf of the material by a global safety factor γg, set conventionally. Thus, the safety principle consists of verifying that the maximum stresses calculated in any section of any part of the structure under worst case loading remain lower than the allowable stress. The values for the allowable stresses are set more or less arbitrarily based on the mechanical properties of the material used. Whether failure actually occurs depends entirely on how well represented is the actual stress in the structure at the critical cross-section and how the actual material failure is rep-resented.
5.7.1.2 Partial safety factor format The partial safety factor format is the basis of many codes and standards, such as the Eurocodes, currently in use. It is claimed to be semi-probabilistic, considering the application of statistics and probability in the evaluation of input data, the formulation of assessment criteria and the deter-
COST 345 Final Report
109
mination of load and resistance factors. However, from the user’s point of view, the application of the partial safety factor format is still deterministic. Thus, the partial safety factor format does not provide information that would allow the user to assess the actual risk or reserve carrying ca-pacity of structures.
The semi-probabilistic partial safety factor format replaces actual probability calculations as de-scribed in Section 5.6.2 by the verification of a criterion involving characteristic values of the re-sistance R and the stress S, denoted as Rk and Sk, as well as partial safety factors γR and γS and can be described by the following formal limit state:
R
kSk
RSγ
≤γ⋅ (5.4)
The reliability of a given structure is ensured by certain requirements for the limit state, the charac-teristic values and the partial safety factors. These requirements are for example stated in the codes using this approach. Partial safety factors are designed to cover a large number of uncertainties and may therefore not be very representative for evaluating the reliability of a particular structure. They should be calibrated using probabilistic methods and idealised reliability formats, but in most coun-tries where semi-probabilistic codes are used, the values of the partial safety factors are still influ-enced by experience and economic and political considerations.
5.7.1.3 Reliability formats Using reliability formats the stress S applied and the resistance R describing the strength of the structural element are described by stochastic variables as their values are not perfectly known. If the verification of the criterion related to the limit-state results in the inequality:
RS ≤ (5.5)
the structure is considered safe. The difference, R - S, is called safety margin M. Figure 5-2 shows the problem with the variables R, S and M. As the sum of two variables, the safety margin M is also a variable and is Normally distributed if the variables R and S are Normally distributed. β is the so-called reliability index and is determined as β = µM/σM.
Figure 5-2 Distributions of resistance R, stress S and safety Margin M = R-S
COST 345 Final Report
110
The safety margin M distinguishes three states: • the safe state or safety domain with M > 0, • the limit state with M = 0 and • the unsafe state or failure domain with M < 0.
The probability of failure pf of S ≤ R characterises the reliability level of a structure with regard to the limit state considered:
)0M(P)0SR(Ppf ≤=≤−= (5.6)
In Figure 5-3, R and S are plotted as marginal probability density functions on the r and s axes. The limit state equation M = R-S separates the safe from the unsafe region by dividing the "hump" into two parts. The volume of the part cut away and defined by s > r corresponds to the probability of failure pf. The design point (r*,s*) lies on the line defined by R – S = 0 where the joint probability density is greatest. If failure occurs it is likely to be near there.
If more than two variables are considered and if the safety margin is expressed by a non-linear function of the different variables, the probability of failure is:
∫≤
=0M
n1n1xf dx...dx)x,...,x(fp (5.7)
with M being the safety margin composed of n variables represented as components of the vec-tor x and M ≤ 0 representing the failure domain.
Reliability methods taking into account uncertainties of variables are the main criteria for a realis-tic safety assessment. Thus, reliability formats using probabilistic methods are an important alter-native to semi-probabilistic approaches. Reliability formats are based on the: • definition of a limit-state criterion, • identification of all variables influencing the limit-state criterion, • statistical description of these variables and consideration of stochastic (in)dependency, • derivation of the probability density and its moments for each basic variable, • calculation of the probability that the limit-state criterion is not satisfied and • comparison of the calculated probability to a target probability.
Figure 5-3 Two-dimensional probability density functions
COST 345 Final Report
111
If the assumptions on the variables are not based on adequate data, estimates of reliability can be misleading. When modelling the variables it is also important to take into account what design codes, design methods and assumptions the Engineer has used during the original design of the structure. Furthermore, old codes and standards are often a valuable source of information when parameters of the distributions have to be determined.
The evaluation of equation 5.7 is a difficult task, except for linear limit states and Gaussian vari-ables. A direct analytical solution or numerical integration are often not possible. Thus, two methods, i.e. the reliability index methods and simulation methods, are introduced which allow the calculation of the probability of failure, even for complicated functions.
Reliability index methods, such as FORM or SORM (First or Second Order Reliability Method), ap-proximate the calculation of the probability of failure. The first step consists of transforming the problem into a space of standard Normal Distributions (Figure 5-4). In the standardised space the nearest point from the origin to the transformed limit state is called the design point and its distance from the origin is the reliability index β. In FORM the failure surface is approximated by a tangent hyperplane at the design point and the probability of failure can be approximated by:
)(p f β−Φ= (5.8)
where Φ is the probability function of the standard Normal variable.
Figure 5-4 Transformation to the standardised space
Simulation methods. The most important sampling methods are the Monte-Carlo samplings (Melchers, 1999) where the probability density function and the associated statistical parameters of the safety margin are estimated approximately employing random sampling. This method is very time-consuming for the solution of real Engineering problems. Advanced simulation meth-ods, such as importance or directional sampling, try to reduce computational time by reducing the sample size required for the estimation of the probability of failure. These methods can be used instead of or together with reliability index methods especially in cases where it becomes important to check the accuracy of reliability index methods, such as multi-mode or multi-component failure.
COST 345 Final Report
112
5.7.1.4 Socio-economic formats Socio-economic formats are a combination of reliability formats with socio-economical consid-erations. Failure costs are introduced to determine the required probabilities of failure or reliabil-ity indices.
5.7.2 Calculation of failure probabilities for time-invariant problems
Only for very simple cases can the probability of failure be determined by exact analytical meth-ods or numerical integration. Direct numerical integration is only possible in some very special cases. For limit-state functions of more general form than linear functions and random variables that are non-Gaussian distributed, integration methods are not used in reliability computations due to the rapidly increasing computational demands as the number of dimensions increases (curse of dimensionality).
For most of the problems with a large number of random variables and different types of distri-bution, approximate methods, such as FORM or SORM, simulation methods or a combination of both, have to be used. The most common techniques are described in the following sections. More detailed information is given by, for example, Ditlevsen & Madsen (1996), Melchers (1999), Madsen (1987) and Ang & Tang (1984).
5.7.2.1 Simulation techniques There are two different types of simulation method. The first type consists of zero-one indicator based methods which are non-analytical and semi-analytical conditional expectation methods. Zero-one indicator methods are: • direct Monte Carlo simulations with sampling equal to the original probability density, • importance sampling where the Monte Carlo method is used with a fictitious density func-
tion close to the design point and • adaptive sampling where importance sampling is applied and the density function is later updated.
Direct Monte Carlo simulation is not likely to be used for Structural Engineering problems. For prac-tical problems many samples are required to estimate the usually very low probability of failure with an appropriate degree of confidence. For pf = 10-6 the necessary number of samples N could be estimated as N>1000/pf.
The importance sampling simulation is a more advanced sampling technique. Its objective is to reduce the size of the sample required. It is a very robust and efficient approach for single limit state problems. To reduce the size of the sample required, the conditional expectation methods comprise direc-tional sampling and axis orthogonal simulation. Directional sampling is applied for unions of events, whereas axis orthogonal simulation is suitable for intersections of events.
5.7.2.2 Second-moment and transformation techniques In First Order Reliability Method (FORM), the limit-state surface is linearised at the design point. The procedure to determine the probability of failure is straightforward even for non-linear limit-state functions. FORM includes also non-Gaussian random variables. It is quite a robust method and difficulties might only arise in very extreme cases where the linearisation of the transformed limit state equation leads to inaccurate results.
FORM uses the derivatives of the limit-state function. For simple examples the derivatives can be expressed explicitly. However, when the limit-state function is complex and dependent on struc-tural behaviour or analysis, other numerical procedures are necessary which increases the compu-tational effort as the number of basic variables increases. The use of a linear approximation for
COST 345 Final Report
113
the limit state surface becomes less accurate as the limit state function becomes more curved. Methods dealing with the non-linearity of the limit-state have been termed Second Order Reli-ability Method (SORM). In SORM the limit-state surface is approximated by a parabolic, quad-ratic or higher surface at the design point.
5.7.3 Time-variant problems
Time-variant problems are characterised by the variability of actions and/or strength over time (deg-radation) and need to be represented by stochastic processes. Typical time dependent problems for structural assessment may be overload (first passage) failure and fatigue or other cumulative failure.
For solving time-dependent problems three possible ways have been proposed so far which are associated with simulation and with FORM/SORM respectively: • importance and conditional sampling, • directional simulation in the load process space, • FORM for unconditional failure probability.
The simulation-based approaches are a natural extension of time-independent analysis once the outcrossing rate can be estimated efficiently. FORM applied to time-dependent problems tend to be far more difficult than for time independent problems and often numerical techniques have to be used to solve the resulting formulations. In this context importance sampling has been found to be particularly useful.
For practical Structural Engineering problems, a fully time-dependent approach would only be required when the resistance variables are time dependent or when more then one loading case has to be considered. Due to the complexity of the application of time-dependent approaches, these problems are often simplified.
5.7.4 Reliability analysis software
In practice reliability analysis and assessment of existing structures is in most cases not possible without appropriate software tools. Table 5-10 lists the most common software products along with their main features and implementation algorithms.
Other software certainly exists or is currently under development. Thus, the reader should keep the situation under review and use this list as a source for further information only.
There are also some programs available which combine reliability and finite element analysis. When using stochastic finite elements special attention should be given to the definition of the size of the random field mesh in comparison to the finite element mesh.
COST 345 Final Report
114
Table 5-10 Software tools for reliability analysis
Name of the software tool CALREL ISPUD NESSUS PROBAN STRUREL VAP
Chapter 6 Summary of Working Group 6 Report on remedial measures
6.1 BACKGROUND
Working Group 6 considered the measures used to maintain and repair highway structures. It should be appreciated that the resources expended on remedial works will be wasted where they are not carried out as designed and to a sufficiently high standard. Indeed, poorly executed work can initiate and promote deterioration of a structure.
6.1.1 Scope
The three main types of maintenance, repair and upgrading works are:
1. Preventative treatments to control, arrest or prevent further deterioration.
2. Repairs to restore the condition of deteriorated components and elements.
3. Works to restore or enhance the load-carrying capacity of a structure.
The WG6 report (COST, 2004d) focuses mainly on 1 and 2, which concern serviceability. Some information is given on 3, which concerns structural stability, but the design and construction of such measures are not covered. What follows, therefore, mainly concerns material rehabilitation. However, because of its importance, information is given on structural methods for addressing problems associated with scour.
The appropriateness of a particular remedial measure is a function of its technical and practical feasibility, the requirements of the client and users, the service life of the structure, the operational restrictions on site works (such as the time available, traffic management requirements and weather conditions), and its cost-effectiveness. Because the costs of remedial measures are dependent on many site-specific factors, they are not considered here.
6.1.2 Defects and deterioration
Structures can be defective through faulty design or poor workmanship, they can deteriorate in service, and they may not be able to cope with a change in service conditions - such as an increase in traffic loading. The following factors should be considered when selecting the remedial measure(s) for a particular structure: • the cause of the defect or deterioration; • the effect of the defect or deterioration on the serviceability of the structure; • the previous and likely future rates of deterioration; • the (likely) cost-effectiveness of the measures; and • the estimated remaining life of the structure and the service life required of the treated
structure.
Degradation processes can be initiated and promoted by one or more of a number of agents and processes, and so it may be difficult to pinpoint the underlying cause(s) of a defect or deterioration. However, it is crucial that the causes are correctly identified to allow appropriately
COST 345 Final Report
116
targeted remedial measures to be designed and executed. It can be cost-effective to address the causes before or at the same time repairs are undertaken.
6.1.3 Approach to remedial works
Strategies for preventing and limiting deterioration are: • reducing the aggressiveness of the environment; • protecting the structure from the environment; and • using tough and durable materials.
In virtually all cases, it is more cost-effective to implement preventative measures than to allow degradation to proceed to the point where substantial repairs, or even replacement, become necessary.
It is essential that the materials used for remedial works are fit for purpose. All materials should have a certificate of conformity, and documentation to confirm that their performance corresponds to that claimed. Materials should be installed in accordance with a method statement to help ensure that the performance claimed is realised in practice. Whenever necessary, on-site inspection of remedial works and testing of materials and on-site performance should be undertaken.
6.2 WATER MANAGEMENT
Most material deterioration mechanisms that affect highway structures are primarily due to the effects of water. This is because water: • transports aggressive species, such as chloride and sulfates ions, to the surfaces of structures; • transports aggressive species and contaminants into concrete components and elements; • promotes corrosion of exposed steelwork; • must be present for the corrosion of embedded steelwork to occur; • promotes the rotting of wood; • increases the vulnerability of masonry and concrete to frost attack; • washes out fines from soils and backfills - and can thereby lead to ground movements; • must be present in concrete for alkali aggregate reaction (AAR) to occur; • adversely affects appearance - through staining and algae growth for example; • when trapped, can lead to the break-up of road surfacings and the failure of expansion joints; • generates disturbing forces on the back of earth-retaining walls; • reduces the effective strength of soils - for example, by dissolving cements; • reduces pore water suction and thereby generates swelling in clayey soils; and • generates scour around bridge supports.
Water does have some beneficial effects. For example, it reduces the rate of carbonation in concrete, and saturated concrete contains little oxygen at potential corrosion sites. Thus concrete structures that are saturated (or dry) are likely to be the most durable, whereas those subject to wet and dry cycles are likely to be the least durable.
In identifying the most appropriate remedial measures, the following should be considered: • water held on or within the surfacing on bridges; • water held in the fill to masonry arch bridges;
COST 345 Final Report
117
• water held in service bays and ducts; • water held on bearing shelves; • stagnant or flowing water in tunnels and culverts; • water present in the soils behind bridge abutments, retaining walls, tunnels and culverts; • running water in and around foundations and structural supports; • leaks from water mains, sewers, drains, service ducts and trenches; • leaks through expansion joints and construction joints; • leaks through waterproofing membranes; • leaks through the joints between tunnel linings and sections of culvert; • drips from through-deck drains; • drips from longitudinal joints; • drips from the edges of decks; and • airborne water - for example, traffic spray and wind-blown discharges from overflows and
drains.
6.3 REMEDIAL MEASURES FOR BRIDGES
6.3.1 Concrete bridges
Remedial measures for concrete bridges are summarised in Table 6-1: the more common techniques are described in the following text. Further information can be obtained from a wide range of literature, including PIARC (2002), Ryall et al (2000), Mallet (1994), Allen et al (1993) and FIP (1991).
6.3.1.1 Drainage systems The provision of longitudinal surface gradients and crossfalls should direct water off a bridge deck, but kerbs or channels, gullies and carrier drains are required to ensure that water is removed as quickly as possible from the surface of a large structure.
If water can enter and accumulate in the bituminous surfacing on bridge decks, wheel loading can generate high hydrostatic pressures and thereby contribute to the failure of waterproofing systems, expansion joints and the surfacing itself. Edge drains should be provided to drain the full depth of a relatively permeable surfacing. Through-deck drains and/or longitudinal drains should be installed at low points at deck level.
Every effort should be made to prevent leakages at expansion joints, with particular care taken at half-joints. However, it should be assumed that all expansion joints will leak at some time so drainage channels should be provided at abutment and pier bearing shelves.
Where no alternative drainage system is present, weep holes should be provided to drain water from the backfill behind an abutment.
Discharges from drains should be prevented from reaching vulnerable parts of the structure and should not form a hazard in freezing conditions when icicles may form or discharges may freeze on surfaces below.
COST 345 Final Report
118
Table 6-1 Remedial measures for concrete bridges
Fault Measures
Ingress of aggressive species - such as chloride-ion rich water and carbon dioxide
Install/replace bridge waterproofing system Apply deck overlay Install/replace expansion joints Make multispan decks continuous Install/repair drainage systems Apply surface protection Seal cracks
Corroded tendons of post-tensioned bridges Regrout ducts Protect external tendons
Damaged tendons of post-tensioned bridges Repair/replace tendons Under-strength structural element Apply plate bonding
Apply wrap-on fibre reinforced plastic (for columns) Increase section thickness Install additional reinforcement Provide a supplementary prestressing force (by external post-tensioning) Provide additional supports
Defective foundations Underpin Scour, or damage to scour protection works Install protection measures
Repair/enhance protection systems
6.3.1.2 Deck waterproofing A waterproofing system should be applied to the upper surfaces of bridge decks to prevent damage by (a) aggressive solutions, derived from de-icing salts and industrial pollution for example, and (b) freeze-thaw.
The types of waterproofing include sheet systems, liquid-applied reactive resins and waterproofing-grade mastic asphalt. Sheet systems include pour and roll, torch-on and self-adhesive types.
COST 345 Final Report
119
A waterproofing system should be continuous across the deck between parapet upstands. Careful detailing is required at expansion joints, drains, edges and service bays to prevent the penetration of water beneath the system.
The concrete to which the waterproofing system is to be applied must be sound, dense, uncontaminated and at least surface dry. To minimise the formation of ‘pin-holes’ in liquid-applied systems (during curing) and the blistering of all types of system (after installation), particularly when high temperatures are encountered during surfacing - the concrete should have a low moisture content at the time the waterproofing system is applied, and the rate of application of solvent-based primers should be controlled carefully.
To prevent sub-surface water from accumulating in the surfacing, the void content at the interface between the waterproofing system and the surfacing should be negligible. The surfacing must be uniformly bonded to the waterproofing system.
6.3.1.3 Expansion joints The most appropriate type of expansion joint for a structure depends on the in-service thermal, traffic-induced and long-term movements; the traffic loading; the edge and verge details; the time available for installation; the required service life and the cost.
Where movements are likely to be small, buried-type expansion joints are preferred because the waterproofing system is continuous over the expansion gap and the joint does not prevent the flow of sub-surface water over a bridge. Other types, which include asphaltic plug joints, reinforced elastomeric joints and elastomeric-with-metal runner joints can form a barrier to water flowing over a bridge, and so sub-surface drainage must be provided to prevent water accumulating on their high side.
The service life of joints varies from type to type. It may be cost effective to install an expensive joint with a longer service life than a less costly type (Barnard and Cuninghame, 1997).
6.3.1.4 Making multi-span bridges continuous Problems of leakage at expansion joints can be reduced, or eliminated altogether, by making multi-span structures continuous.
Existing precast deck beams can be embedded into a cast in-situ integral crosshead, with longitudinal continuity provided by the reinforcement within the continuous deck slab. Pritchard and Smith (1991) give further details of this and other methods.
6.3.1.5 Bearings Bridge bearings that are ‘locked up’ or have a high coefficient of friction should be replaced or repaired.
The moving components of steel bearings such as roller, rocker, knuckle, leaf and link bearings should be greased. PTFE bearing material should be replaced when wear is excessive.
The replacement of elastomeric bearings should be considered where hardening of the elastomer has increased its shear stiffness to an unacceptably high level, or the elastomer has split.
6.3.1.6 Protection of exposed concrete Exposed concrete can be treated with a range of materials which may prevent the penetration of aggressive species such as chloride ions, prevent carbonation, prevent water penetrating through cracks, and create a surface that is easy to keep clean, and improve aesthetics.
COST 345 Final Report
120
Concrete at or near ground level is particularly vulnerable to deterioration and so measures must be taken to ensure continuity of protection between the above- and below-ground protection systems. However, treatment may be limited to the most vulnerable surfaces where the risk of the ingress of chloride ions derived from de-icing salts is high.
Pore liners are impregnants that penetrate into the concrete and react with it to form a water-repellent layer that allows water vapour to pass out of the concrete. They are colourless. The most commonly used pore liners are silanes and siloxanes. The concrete surfaces must be cleaned carefully and the moisture content of the concrete must be within certain limits for application to be successful.
Surface coatings range in thickness from less than 1mm up to 5mm or so. To be effective, they must be free of defects and pin holes, uniformly bonded to the concrete and able to bridge existing cracks and any new cracks that may form in the concrete. For most applications, the coating must allow the passage of water vapour from the concrete - as otherwise it will not adhere to the concrete. Multi-layer coatings are better able to bridge cracks and are less prone to defects such as pin holes. Selection criteria concerning performance and application are given by Pearson and Patel (2002).
Renderings are over 5mm thick and can change the appearance and texture of the concrete as well as improving durability.
6.3.1.7 Protection of buried concrete Buried concrete is susceptible to deterioration through aggressive species present in the ground and ground water. In aggressive ground conditions a protective treatment should have been put in place at the time of construction. In relatively benign conditions, concrete should have been designed to resist sulphate attack without the need for a protective treatment. However, the buried surfaces of abutments and wing walls, and also abutments, piers and columns at and around ground level may have been treated to provide secondary protection.
It is difficult to maintain or replace protective treatments below ground without major excavation, and so it is more economical to apply them in conjunction with other work. Where there is a high hydrostatic head, sheet membranes should be used on abutments and wing walls, at construction joints, over formwork tie-holes and where there is a risk of cracking. Bridge deck waterproofing should be extended down the back of abutments to 200mm below any construction joints at or above the level of a bearing shelf.
Resinous coatings should be used in the most aggressive ground conditions. Rubberised bituminous coatings, built-up to form the recommended minimum dry film thickness of 0.6mm, are suitable for secondary protection in less aggressive ground conditions.
6.3.1.8 Cathodic protection No matter what concentration of chloride ions is present in concrete, it is possible to prevent corrosion of the steel reinforcement by cathodic protection. The technique does not require the removal of concrete where there is no loss of structural integrity, but areas of spalling and delamination must be repaired. It is most beneficial where it eliminates the need to remove large areas of concrete that has a high chloride ion content.
There are two forms of cathodic protection, galvanic coupling and impressed current.
Galvanic coupling is achieved by connecting the reinforcement to a metal higher in the electro-motive force series, and so this sacrificial anode corrodes preferentially to the steel. It has limited application to reinforced concrete structures, but it finds use with elements that are immersed or
COST 345 Final Report
121
are in damp ground because these environments have a low resistivity. Also, discrete anodes can be used to protect the reinforcement in the vicinity of repaired areas of concrete. Sacrificial anodes have to be renewed on a regular basis.
For the impressed current technique, a direct current source is connected to an inert anode and the reinforcement, which acts as the cathode. To distribute the current flow and minimise the electrical pathway to the steel, the anode has to cover the entire concrete surface. The types of anode include: conductive coating systems, e.g. a graphite-filled paint; flame-sprayed metals that bond to the concrete surface; conductive mesh anodes attached to the concrete surface and over-laid with a layer of sprayed concrete; conductive overlays of cementitious materials; and embed-ded discrete anodes fixed into drilled holes or slots in the surface. The technique is not ideally suited for prestressing cables.
6.3.1.9 Desalination Desalination is a one-off treatment that can remove chlorides from contaminated reinforced concrete. It is similar to cathodic protection in that it involves the application of an electric current to the reinforcement, but it requires a higher current density. Under the influence of the electric field, anions (such as chlorides) are attracted to an electrolyte on the surface of the concrete and can thereby be extracted from it.
Desalination is most effective in removing chlorides from the zone between the first layer of reinforcement and the concrete surface. It increases the risk of ASR, and also increases the permeability of the concrete. Desalination should not be used on prestressing steel.
6.3.1.10 Realkalisation Realkalisation is a one-off technique that can be applied to carbonated reinforced concrete. The flow of current between a temporary anode and the reinforcement increases the alkalinity of the concrete to a passive level through (a) the migration of alkali metal ions from the electrolyte to the reinforcement, and (b) the generation of hydroxyl ions at the reinforcement. Realkalisation should not be used on prestressing steel.
6.3.1.11 Corrosion inhibitors Cast-in or migrating corrosion inhibitors can be used to prevent corrosion of embedded reinforcement. Cast-in inhibitors that are added to the mix water are much preferred for new concrete. Migrating inhibitors can be applied to old concrete by spraying, ponding, implanting (into drilled cavities) or by electro-injection (under a potential gradient). Apart from the last in the list, these methods rely on the capillary absorption and diffusion of the inhibitor through the concrete to the reinforcement. The speed at which this takes place depends on the porosity and level of saturation of the concrete.
6.3.1.12 Crack repairs Older reinforced concrete bridges, designed before crack control criteria were introduced, may have cracks wide enough to allow the ingress of aggressive species and so it may be necessary to seal them. The causes of cracking must be identified before repairs are made and measures taken to minimise the risk of further deterioration. Cracking along the line of the reinforcement is far more important than cracking at right angles to it.
Depending on their width, dead cracks can be sealed by injecting (through pressure, gravity or vacuum) a cementitious grout, flexible polymer or rigid epoxy resin. Provision for further movement must be made when sealing live cracks; thus the sealant should have a low stiffness modulus so that high stresses are not induced by movements.
COST 345 Final Report
122
6.3.1.13 Concrete repairs Prior to the application of any repair material, all unsound concrete should be removed to a depth below the main reinforcement by pneumatic hammer or water jetting. A repair is likely to bond better to water-jetted surfaces. Any rust on exposed reinforcement should be removed and aggressive agents cleaned off the reinforcement. Severely pitted reinforcement should be replaced.
The repair material and the parent concrete must be compatible in terms of their physical, chemical and electro-chemical properties, but as it is often impossible to match all properties the best compromise must be chosen.
Cementitious materials usually have properties closest to the parent concrete, but they are not suitable for all applications. Polymer resin mortars have higher strength and resistance to chemicals, and so they can be used where existing concrete has failed due to chemical attack or wear. Resin mortars, such as vinylester resins, have rapid setting times and early strength gain.
Flowable grout or concrete, or sprayed concrete can be used for large scale repairs where vibration of the repair material is difficult and where the area is congested with reinforcement.
Sprayed concrete is a mixture of cement, aggregate and water that is ejected at high velocity from a nozzle. Gunite has a maximum aggregate size of less than 10mm and water is injected into the dry mixture in the discharge nozzle. Shotcrete has a maximum aggregate size 10mm or greater and it is mixed with water prior to pumping.
Incipient anodes can arise and initiate corrosion in areas of concrete surrounding repairs (Vassie, 1984), so preventative measures such as cathodic protection may be required.
6.3.1.14 Regrouting tendon ducts Where voids are found in grouted tendon ducts but there is little evidence of corrosion, the voids should be filled with grout using vacuum-assisted injection.
The corrosion of tendons should be investigated and the rate of corrosion monitored. Further corrosion may be prevented by installing a bridge deck waterproofing system and, in a segmental structure, by preventing leaks through connections between segments. A bridge must be strengthened where corrosion has significantly reduced its load-carrying capacity.
6.3.1.15 Replacing and repairing damaged tendons Unbonded internal or external tendons can be replaced one at a time, but the live load on the bridge may need to be reduced during de-tensioning, and the operation must not impart any shock loading.
6.3.1.16 Scour protection The design of scour countermeasures and remedial measures are described in some detail by Melville and Coleman (2000). The various remedial measures for scour are listed in Table 6-2. With high water levels, the impact of boulders on supports at or near the level of the riverbed, and the impact of floating debris on the superstructure and supports must also be considered.
Riprap, a graded mixture of rock, broken concrete or other material, may be placed to protect piers, abutments and riverbanks from erosion. Rock riprap can adjust to deformations and subsidence of the riverbed, is easy to place and repair, and is relatively inexpensive.
Gabions, which comprise galvanised or coated wire mesh baskets and mattresses filled with rock or broken concrete, can be used where the available rock is of limited size or not of particularly
COST 345 Final Report
123
good quality. Gabions can be arranged and tied together around piers and abutments, joined as a mattress for riverbed paving across the full width of the invert.
Compared to riprap, gabions can be used in thinner layers to reduce turbulence, are more resistant to movement, and can be stacked at a steeper slope on banks.
Fabric bags, or continuous fabric mats with pockets, can be filled with concrete and used to protect piers. The bags and mats can be filled with dry concrete so that hydration occurs after they have been placed.
Table 6-2 Remedial measures to limit scour, after Melville and Coleman (2000)
Type of scour Purpose of measure Measure
To provide armour for piers and abutments
Riprap Gabions Cable-tied blocks Tetrapods Precast concrete blocks Used tyres Vegetation Enlargements and plinths Invert slabs
To alter the flow at and around piers and abutments
Sacrificial piles Deflector vanes
Local
To improve flow through a bridge Guide banks To control channel grade Check dams Degradation To control channel degradation Concrete or bituminous pavement To increase sediment transport Dredging
Formation of a cut-off Aggradation
To reduce the build-up of sediment Controlled mining Debris basin
To provide armour for river banks, prevent bank erosion, and stabilise the alignment of the channel
To reduce the flow velocity near banks and induce deposition of sediment
Piles Jack or tetrahedron fields Vegetation
Lateral erosion
To reduce the flow velocity near banks, induce deposition of sediment, and stabilise the alignment of the channel
Groynes
COST 345 Final Report
124
Prefabricated concrete blocks are designed to give a high degree of interlock using the minimum amount of material. Heavy concrete blocks can be placed side by side and connected together with cables to protect banks where flow velocities are particularly high.
An invert constructed from concrete, masonry or brick can be used to protect the riverbed around piers and abutments. Sheet piling can protect piers with shallow foundations, but the increase in the effective width of the pier or abutment may increase the depth of scour.
Sacrificial piles or flow deflecting vanes and plates can be placed upstream of a bridge pier to reduce scour. Testing is required to determine the optimum configuration.
The foundations of piers and abutments can be enlarged to prevent local scour. A shaped plinth cast above the bed level may reduce scour where it reduces turbulence and/or realigns the structure in the direction of the flow.
Groynes, which include spurs, dykes, dams, jetties and deflectors, may reduce flow velocity along a bank, but they may also be used to alter the flow direction and induce the deposition of sediment. Guide banks of earth or rock may improve flow alignment and prevent scour at and around an abutment.
6.3.1.17 Repairing scour damage Where a substructure has been damaged by scour, repairs must be made, as a matter of priority, to re-establish support and prevent further damage. Concrete bags or sheet piling can be placed around the support to act as formwork for tremie concrete, pumped concrete, prepacked concrete, hand-placed concrete or grout.
Small bags can be filled with dry concrete, or sand and cement, before being placed in position, but large bags could be filled after they have been positioned underwater. Synthetic fibre bags are sufficiently tough and durable to be filled with pumped concrete. Grout- or concrete-filled nylon tubes can also be used for much the same purpose. The bags and tubes should be anchored together.
6.3.1.18 Strengthening by increasing section thickness Slabs or beams can be strengthened by a reinforced concrete jacket. Consideration should be given to the bond strength and the transfer of shear force at the interface between the old and new concrete. As an alternative to installing a deck waterproofing system, in some instances a deck overlay may be used to restore ride quality and to increase the effective cover to the reinforcement.
A column can be strengthened by encasing it in a reinforced concrete jacket, but a simpler and sometimes more aesthetically pleasing way is to provide a wrapping of FRP. By orientating the fibres longitudinally and transversely, the longitudinal fibres act as additional tension reinforcement and the transverse fibres contain the concrete and increase its compressive strength.
6.3.1.19 Strengthening with reinforcing bars The tension zone of concrete elements can be strengthened by the addition of reinforcement. The new reinforcement could be placed in recesses cut into the existing concrete or it can be placed outside the original section and covered with sprayed concrete.
COST 345 Final Report
125
6.3.1.20 Strengthening by plate bonding Additional reinforcement in the form of steel plates or fibre-reinforced composites can be bonded externally to concrete elements to provide the support lost by corroded reinforcement, a safety margin where prestress may have been lost, flexural strength and/or shear strength.
The plates must be attached to sound concrete that is not delaminated and is unlikely to deteriorate. The anchorage zones require careful consideration because of the imbalance in the longitudinal strain in strengthened and unstrengthened sections.
Fibre reinforced plastic (FRP) sheets are now normally used to avoid problems encountered during the installation of steel plates and in-service corrosion that can lead to debonding. The fibres may be of carbon, aramid, glass and polyvinyl acetate (PVA). Although the cost of FRP per unit weight is considerably higher than that of steel, because FRP composites have a higher strength-to-weight ratio than steel, the cost of an FRP element is between 50 and 200% higher than the cost of an equivalent steel element; see PIARC (2002). Furthermore, FRP sheets are more versatile, and are easier to transport, fix and support during curing.
Stressed FRP plates may be used where stiffness is inadequate or there is cracking under load.
6.3.1.21 Strengthening by supplementary prestressing Supplementary prestressing (post-tensioning) can be used to strengthen reinforced and prestressed concrete structures through the introduction of longitudinal tendons to augment bending resistance, and/or vertical or inclined tendons to augment shear resistance. The effect of the anchorages on the existing structure requires careful consideration.
6.3.1.22 Strengthening by adding structural elements Bridges can sometimes be strengthened by the introduction of additional supports or beams. Additional supports are often provided as a temporary measure before repairs are made. Additional stringers can be positioned between the steel beams of a composite bridge to strengthen a deck slab.
6.3.2 Steel structures
The corrosion of steel decks should be prevented by applying a protective treatment or waterproofing system. The surfacing on a steel deck, which is normally subject to higher strains than the surfacing on a concrete deck, must be firmly bonded to the protective treatment or waterproofing system.
Information on the repair of orthotropic steel bridge decks is given Gurney by (1992). What follows refers mainly to the repair of steel substructures: remedial measures are summarised in Table 6-3.
6.3.2.1 Coatings Coatings for steel structures can be (a) barrier layers that exclude water and oxygen from the surface of the steel, or (b) sacrificial layers that also exclude water and oxygen but which provide electrochemical protection to the underlying substrate.
The cost of a coating is low compared to the cost of future maintenance work and so a durable coating should be selected. Over the years there has been a move towards the use of high-build coatings that can be applied in a few layers and which have short overcoating and drying times.
COST 345 Final Report
126
Table 6-3 Remedial measures for steel substructures
Fault Measure
Corrosion Install/replace bridge waterproofing system Install/replace bridge deck expansion joints Make multi-span decks continuous Install/repair drainage systems Apply protective coating Install enclosure Install cathodic protection and collar (underwater only)
Fatigue cracking Repair cracks Install plates
Plastic deformation (impact damage) Apply controlled load or deformation Apply controlled heating and cooling
Restricted movement at expansion joints Replace/repair bearings Replace/repair expansion joints
Corroded tendons of post-tensioned bridges Protect external tendons Damaged tendons of post-tensioned bridges Replace/repair tendons Elements assessed to be below strength Increase section thickness with plates
Replace element Install additional elements Provide supplementary prestress Provide additional support
Defective foundations Underpin Scour, or damage to scour protection works Install protection measures; see Table 6-2
Repair/enhance protection systems
The most vulnerable areas of steel are those subjected to water drips from leaking expansion joints, drainage outlets and the like. A high quality paint system can be applied in those areas or the paint system applied elsewhere can be overcoated.
The performance of a paint system is dependent primarily on the adhesion of the primer to the steel. Thus additional coats may provide little if any additional protection where the adhesion between the layers is poor.
Where a blast primer is used, the surfaces should be grit- or sand-blasted to remove all paint, rust scale and corrosion, and to produce a physically and chemically clean, roughened surface. Where it is difficult to ensure a high quality standard of preparation, a surface tolerant primer can be applied to hand-prepared surfaces that have been washed to remove soluble salts. A paint expert should be consulted to ensure that the old and new paint systems are compatible.
6.3.2.2 Enclosures Enclosures are sometimes used to limit the exposure of steelwork to corrosive agents. They have been used to reduce the corrosion of structures formed from weathering steel. A floor is
COST 345 Final Report
127
attached to the girders, and side panels are added to seal the floor to the soffit at the edge girders. Water that condenses is drained and so is unable to pond on the steelwork.
6.3.2.3 Cathodic protection and concrete jackets Small sacrificial anodes may be placed a regular intervals along steel elements in contact with water or wet ground that are at risk of corrosion in the presence of dissolved oxygen and/or aggressive agents in the water.
A concrete jacket may strengthen or protect a submerged pile. If the jacket cannot be extended well above the high water level and well below the riverbed, sacrificial anodes must also be used.
6.3.2.4 Plating New plates can be bolted or welded to a section weakened by corrosion or distorted by impact. The size of each plate should be sufficient to transfer loads through the plate to either side of the damaged area. It is necessary to assess (a) the increase in the dead weight of the structure, and (b) either the weakening of the existing sections by forming bolt holes, or the distortion and high residual stresses introduced by welding. The gaps between the new and existing elements should be filled/sealed to avoid generating a corrosion trap. Fasteners should be selected that will not corrode due to galvanic action. Welds should be without defects and, to reduce stress concentrations, discontinuities should be removed by grinding.
6.3.2.5 Crack repairs Cracked welds can be repaired by grinding out the affected area and refilling with new weld. Drilling a small hole at the end of a crack can stop its propagation in areas away from a weld. Unless a crack is due to faulty welding, repairs should be accompanied by measures to reduce the stresses in the vicinity of the crack to prevent repeat cracking.
6.3.2.6 Strengthening Steel bridges can be strengthened by supplementary prestressing - in much the same way as described in 6.3.1.21 for concrete bridges, or by replacing or adding elements.
6.3.2.7 Reversal of plastic deformation Plastic deformation caused by impact damage can be reversed by (a) the application of controlled loads or deformations, or (b) heating sections to induce thermal stresses.
6.3.3 Masonry arch bridges
Remedial measures used for masonry arch bridges are summarised in Table 6-4, and the main techniques are described in the following sections. Page (1996) gives a comprehensive guide to the repair and strengthening of masonry arch bridges.
6.3.3.1 Repointing Routine repointing can increase the load capacity of an arch by restoring the effective ring thickness to its full depth. The mortar should be weaker than the brick or stone, but not too weak because this will reduce the effective thickness of the arch ring.
COST 345 Final Report
128
Table 6-4 Remedial measures for masonry arch bridges, based on Page (1996)
Fault Measure
Deteriorated pointing Repoint Deteriorated arch ring Repair masonry
Install saddle Apply sprayed concrete to intrados Install prefabricated liner Grout arch ring Apply proprietary repair technique
Arch ring inadequate to carry in-service loads Install saddle Apply sprayed concrete to intrados Install prefabricated liner Replace fill with concrete Install steel beam relieving arches Install relieving slab Apply proprietary repair technique
Internal deterioration of mortar; which could lead to ring separation for example
Grout arch ring Stitch (using tie bars spanning across a crack)
Foundation movement Install mini-piles or underpin Grout piers and abutments
Outward movement of spandrel walls Install tie bars Install spreader beams Replace fill with concrete Demolish walls and rebuild Grout fill
Separation of arch ring beneath spandrel wall from remainder of arch ring
Stitch together
Weak fill Replace fill with concrete Grout fill Reinforce fill
Water leakage through arch ring Make road surfacing water resistant Install waterproofing Waterproof extrados and improve drainage
Scour, or damage to scour protection works Install protection measures; Table 6-2 Repair/enhance protection systems
6.3.3.2 Saddling The strength of an arch bridge can be substantially increased by casting a concrete saddle of minimum thickness about 150mm over the extrados. If the existing abutments cannot support the saddle, spread footings can be built behind the abutments, or piled foundations can be used with the saddle supported via spread footings onto a pilecap. The saddle may act compositely with the existing stone or brick rings, or it may act independently of them - as the main structural member.
COST 345 Final Report
129
The saddle does not affect the aesthetics of the bridge, but it requires removal of the fill and so, where appropriate, it should be combined with repairs to the spandrel walls.
6.3.3.3 Sprayed concrete The thickness of an arch ring, and hence its load-carrying capacity, can be increased by spraying a concrete lining onto the intrados. A reinforced lining between 150mm and 300mm thick would usually be applied. The lining would normally reduce the size of the arch opening but it may be used as a partial or total replacement for the existing ring.
Adequate support should be provided to the lining by augmenting the existing abutments or by cutting into the existing abutments to form a bearing surface.
6.3.3.4 Prefabricated liners A metal or glass reinforced cement prefabricated liner can be attached to the soffit to act as permanent formwork with the intervening void filled with concrete or grout. Corrugated or plane sheets can be used. As with sprayed concrete, the technique reduces the size of the opening and does not enhance the appearance of the arch.
6.3.3.5 Relieving arch Curved steel I-beams, rolled about their weakest axis to the shape of the intrados, can be used to provide permanent strengthening or temporary support to counter subsidence. The springings for the beams should either be cut into the existing abutments or fixed to their face. The gap between the beams and the arch can be packed with timber or filled with grout, or the beams can be encased in sprayed concrete.
6.3.3.6 Grouting Any voids in an arch ring, including those due to ring separation in a multi-ring arch, can be grouted so that the full depth of section is load bearing. Repointing may be necessary to avoid the excessive loss of grout through cracks. Cementitious or resin grouts can be used.
6.3.3.7 Stitching Stitching, which involves the grouting of dowels into holes drilled into the structure to restore shear transfer, is particularly effective for treating (a) arch ring separation and (b) the detachment of a spandrel wall from its backing.
6.3.3.8 Replacing the spandrel fill with concrete To stabilize a spandrel wall, the fill immediately behind a wall can be excavated down to the extrados of the arch barrel and replaced by concrete that is tied to the wall.
6.3.3.9 Reinforced fill The reduce the outward force on a spandrel wall, the fill behind the wall can be replaced by reinforced soil that acts as a high strength yet flexible medium.
6.3.3.10 Relieving slab A reinforced concrete slab can be cast over the fill to improve the load distribution on the arch and transfer load to the abutments. To relieve the live load acting on the arch and prevent load from being concentrated at the crown, a low strength concrete support can be provided at the abutments and a compressible layer installed under the central part of the slab.
COST 345 Final Report
130
6.3.3.11 Waterproofing, resurfacing and drainage Whenever possible, the amount of water entering a structure should be minimised, and what does enter should be removed by a positive drainage system. To achieve these objectives, waterproofing should be considered at two levels: at the road surface, and at the extrados of the arch.
A waterproofing system should be applied to a concrete relieving slab or to a saddle. The surfaces of the verge, footway or roadway should be relatively impermeable, and interfaces along kerb lines and/or spandrel walls should be sealed. Surfacing should be shaped to shed water away from the spandrel walls. For multi-span arches, drainage outlets should be provided through the piers at the springings. Abutments should be provided with weep holes. Perforated pipes may be installed through the fill to assist drainage to the outlets, and a filter drainage layer may be installed behind spandrel walls.
6.3.3.12 Tie bars Tie bars can be installed in the fill to restrain the movement of spandrel walls. The bars may pass through both walls and have pattress plates at each end, or one end may be provided with a pattress plate whilst the other is anchored within the fill.
6.3.3.13 Reinforced parapets Reinforced parapets may comprise a reinforced core that transfers load to a longitudinal beam that spans between pilasters, or a reinforced wall with a pinned foot secured by ties.
6.3.3.14 Underpinning Material can be excavated from beneath the foundations and be replaced with mass concrete, but the stability of the existing foundations must not be compromised by the work.
6.3.3.15 Mini-piles Mini-piles can be installed to (a) increase load capacity, and (b) reduce in-service settlement. To provide continuity, the piles may be bored through and cast into the existing pier or abutment. Weak supports should be grouted or stitched together.
6.3.3.16 Scour protection Information on scour protection is provided in 6.3.1.16. Scour protection to masonry arch structures is usually provided by placing riprap or an invert slab.
6.3.3.17 Embedded reinforcement and anchors An arch may be strengthened by various proprietary techniques that involve the placement and subsequent encapsulation of stainless steel bars or anchors into grooves or holes cut in the arch.
6.3.4 Timber bridges and substructures
Remedial measures for timber substructures and bridges are summarised in Table 6-5, and further information on the repair of timber structures is given in STEP (1995).
6.3.4.1 Preservative treatments In general, preservatives should be applied at regular intervals to all major structural components to deal with biological attack. They should be applied without delay to exposed untreated surfaces formed by cutting, drilling, cracking, splitting, etc. In selecting a preservative treatment for fungal
COST 345 Final Report
131
damage it is necessary to identify the type of rot causing the deterioration. Wet rots are unable to colonise an area where the moisture content is below 20 to 30%. Dry rots require a moisture content of between 30 and 40%.
The subterranean termites found in Europe can attack wood with a moisture content greater than about 20%. Beetles attack dry timber but they can tolerate some moisture. Marine borers can bore an extensive network of burrows in marine timber structures.
There are three main types of preservative that can be used to resist biological attack: tar oils, organic solvents, and water-borne treatments. In most European States, environmental, and health and safety requirements require preservatives to be non-toxic to humans and the environment (or at least non-toxic after application) and non-contaminating to the ground or water courses. A key requirement for a product is a high penetrability into the timber.
6.3.4.2 Waterproofing The control of moisture is often the most cost-effective and practical technique for extending the service life of a timber bridge. In most cases the deck protects the main structure from moisture and so the primary concerns should be to prevent damage to the deck and the passage of water through it.
Table 6-5 Remedial measures for timber substructures and bridges
Fault Measure
Fungal damage Apply preservative Waterproof deck Replace/repair element Strengthen element with reinforcement
Insect/marine borer damage Apply preservative Replace/repair element Strengthen element with reinforcement
High moisture content Waterproof/replace deck Install drainage Apply protective layer/cladding
Delaminations, cracking, splits and the like Apply preservative treatment Replace/repair element Strengthen element with reinforcement
Damaged deck Repair/replace deck Damaged or below strength element Replace/repair element
Strengthen element with reinforcement Bridge below strength Strengthen elements with reinforcement
Install additional elements Damaged pile Replace/repair pile
Jacket Scour, or damage to scour protection works Install protection measures; see Table 6-2
Repair/enhance protection systems
COST 345 Final Report
132
A timber deck may be protected by a waterproofing layer or sealant and ‘waterproofed’ with a concrete or asphalt overlay that directs surface water to a drainage system.
Cladding, sheet metal or sheet membranes can be used to protect elements most exposed to water, but they must not channel water onto underlying elements. It is beneficial to prevent the uptake of water by (a) applying a surface coating to the ends of elements, (b) positioning a barrier layer, or (c) eliminating conditions that enable water to rise by capillary action.
6.3.4.3 Deck repairs Speed restrictions may be required when nail laminations become permanently deformed or displaced. In a few cases it may be possible to replace defective laminations and prestress the deck panels. Metal fasteners and fixings should be protected against corrosion.
6.3.4.4 Deck replacement A deteriorated timber deck may be replaced by another timber deck, prestressed concrete deck planks, a cast in situ reinforced concrete deck slab, an FRP deck, or FRP panels.
6.3.4.5 Element repair, strengthening and replacement Elements may be strengthened by bonding timber or steel plates, or FRP sheets, or by securing timber and steel plates by fasteners. Stresses generated by differential shrinkage and thermal expansion between materials, and differential movements between elements or materials of differing stiffness should be avoided. Great care is required when the stability of a repair is dependent on the performance of an adhesive. The adhesive should have the appropriate gap-filling properties. Water traps or crevices or narrow gaps should not be formed.
New timber replacing a damaged section can be joined to the existing element at a simple butt joint by metal or wooden splice plates. Where more aesthetically pleasing joints are required one of a large number of scarf joint types with metal fasteners can be used.
6.3.4.6 Strengthening with additional elements Although timber elements can be repaired or replaced, it may be more cost-effective to add supplementary elements such as cross bracing, girders, stringers, cross heads and piers.
6.3.4.7 Piles A timber pile may be replaced by driving a new pile adjacent to the damaged pile. Alternatively, the pile may be strengthened by a reinforced concrete jacket, or the damaged section may cut out and replaced with reinforced concrete or a length of timber.
6.4 REMEDIAL MEASURES FOR CULVERTS AND UNDERPASSES
The main construction forms used for culverts and underpasses include corrugated steel buried structures (CSBSs), concrete box-type structures, and concrete and masonry arch structures. The remedial measures for arch structures are much the same as those described in 6.3.1 and 6.3.3.
6.4.1 Corrugated steel buried structures
The remedial measures for CSBS are summarised in Table 6-6, and the more commonly used techniques are described in the following.
COST 345 Final Report
133
Table 6-6 Remedial measures for CSBSs
Fault Measure
Corrosion of invert Repair/extend/install pavement Leaking joints Grout Corrosion on soil side and/or corrosion of bolts and plates at joints
Provide positive drainage along the carriageway above the culvert Waterproof and place concrete around the outside of the structure Reline
Invert damage from water-bourne debris
Install drop inlets and trash screens Repair/install pavement
Impact damage from traffic Install barriers, height restrictions and rubbing boards
Scour around inlet Install invert beam Install head wall
6.4.1.1 Pavements A new pavement can be installed or an existing pavement may be extended or repaired to contain the flow through a CSBS and thereby prevent damage to the invert by hydraulic action and/or corrosion. To prevent damage at the wet/dry line, the pavement should be able to accommodate flow up to 200mm above the mean flow level during the wettest season.
New pavements or extensions can be formed from concrete, or from coated steel or glass reinforced plastic profiled plates. All corroded areas of the shell that are to be overlaid must be properly prepared prior to installation. Where the flow and abrasion are not severe the mass concrete may be unreinforced, but reinforced concrete is required otherwise. An extension and existing concrete pavement should be bonded together. Mass concrete can be faced with paving slabs or with paviours. Plates must be fixed to the shell about 10mm above the corrugations, and the void between the shell and the plates must be grouted.
A pavement can be provided to strengthen a CSBS where the upper portion of a structure is sound but the invert is severely deteriorated. The shear connection between the shell of the culvert and the pavement must be able to transfer the ring compression from the shell to the pavement, and the pavement must be sufficiently strong to carry the compressive forces.
6.4.1.2 Secondary surface coating Surface coatings to the inner surfaces of a CSBS are likely to be most effective on and around joints and bolts (after grouting), and in areas affected by wind spray.
The effectiveness of a coating is highly dependent on the surface preparation. Corrosion products should be removed by abrasive blast cleaning or, in small areas, by abrading. In most cases, the refurbishment of a bituminous coating requires the removal of all areas of loose or brittle bitumen and the cleaning of the exposed surface. For more extensive refurbishment, the application of a coating that is not bitumen-based should be considered.
COST 345 Final Report
134
6.4.1.3 Grouting and concreting Grouting can be used to fill voids within the backfill and thereby stabilise a structure. Grouting may also prevent or reduce the seepage of leachates or de-icing salts from the backfill into the structure, and water flowing from the structure into the backfill through bolt holes and joints.
A cementitious grout is normally used when structural support is required: see 6.3.3.6. An expanding water-reactive grout should be used to provide a waterproof barrier. Low injection pressures should normally be used to avoid disturbance of the structure. Care should be taken to ensure that grout does not pollute watercourses or penetrate drains or service ducts.
6.4.1.4 Carriageway drainage Where a carriageway passes over a culvert, positive drainage systems should be provided at the verges and central reserve to drain the carriageway and thereby prevent de-icing salts in solution from coming into contact with the structure.
6.4.1.5 Waterproofing membrane Where excavation is feasible, a waterproofing membrane may be installed above a CSBS to direct the flow of water, which may contain corrosive species, away from the structure. The membrane may be of the type used for waterproofing bridges or one suitable for protecting structures below ground: see 6.3.1.2 and 6.3.1.7, respectively.
6.4.1.6 Relining A structure requiring strengthening either due to increased loads or deterioration due to corrosion may be relined. Given that CSBS are designed as flexible structures it is more fitting that flexible liners are used: these may take the form of a smaller diameter CSBS, plastic pipe, or glass reinforced plastic sheets shaped to match the existing profile. The annular space between the liner and the CSBS should be fully grouted.
Large structures may be relined with sprayed concrete: see 6.3.1.13.
6.4.1.7 Invert beam and head wall An invert beam and head wall should be constructed to prevent water flowing through the backfill along the outside of a structure.
6.4.1.8 Invert and impact protection Protection to an invert from the erosion forces of hydraulic traffic can be provided by drop inlets and trash screens, and by repairing, extending or installing a pavement. Barriers, height restrictions or rubbing boards can provide protection from the impact of traffic passing through a structure.
6.4.2 Concrete structures
Remedial measures for concrete box structures and arch culverts are summarised in Table 6-7.
6.4.2.1 Spalled/damaged concrete Areas of spalled concrete can be repaired as described in 6.3.1.13, and protective treatments can be applied to reduce the impact of salt water on the concrete structure.
COST 345 Final Report
135
Table 6-7 Remedial measures for concrete box-type structures and concrete arch culverts
Fault Measure
Corrosion of invert Repair/extend/install pavement Leaking joints Grout, rebate and seal Ingress of aggressive agents, such as chloride ion-rich water
Apply/replace waterproofing membrane to external surfaces Provide positive drainage at carriageway level Apply surface coating to internal surfaces Install drainage to side walls
Low passivity of reinforcement Replace contaminated or carbonated concrete Damaged concrete Grout
Invert damage from water-borne debris Install drop inlets and trash screens Repair/install pavement
Impact damage from traffic Install barriers, height restrictions and rubbing boards
Scour around inlet Install invert beam Install head wall
6.4.2.2 Crack repair Cracks should be sealed as described in 6.3.1.12.
Where cracks allow the ingress of aggressive species to the reinforcement, grouting should be considered in preference to the filling of cracks by injection. Where cracks have developed through the full section thickness, the cracked area could be broken out all the way around the structure and the gap filled with a flexible sealant; thus effectively creating a movement joint.
6.4.2.3 Joint repair Leaking joints between structural units should be sealed by grouting, and a rebate should be formed and filled with flexible sealant.
6.4.2.4 Drainage of side walls If the drainage system behind side walls has failed, weep holes should be provided to prevent the build-up of hydrostatic forces. Discharges should be directed away from the vulnerable parts of the structure.
COST 345 Final Report
136
6.4.2.5 Waterproofing Where excavation is possible, a waterproofing system may be applied to prevent water ingress: see 6.4.1.5. When applied to the top slab, the system should be extended at least 200mm below the joint between the slab and side wall. The system should be detailed to accommodate movements at construction joints. An alternative to waterproofing small structures may be to reline them: see 6.4.1.6.
6.4.2.6 Strengthening A reinforced concrete saddle may be cast over a concrete structure to strengthen it.
6.5 REMEDIAL MEASURES FOR TUNNELS
The main causes of degradation to tunnels include water inflow (in particular, saline or brackish water), the occurrence of voids between the tunnel lining and surrounding ground, aggressive conditions within the tunnel generated by engine exhaust products, and frost damage (particularly near the tunnel portals).
The problems encountered in tunnels and the remedial measures required are, depending on the type of construction, similar to those described earlier for concrete bridges, masonry arch structures, and culverts and underpasses. A summary of the remedial measures is given in Table 6-8. Measures concerning claddings and tunnel equipment are not considered.
The presence of asbestos in tunnels must be considered when remedial measures are being planned and undertaken. Repair work should, whenever possible, avoid the use of materials that are flammable or give off noxious/dangerous fumes.
6.5.1 Ground water drainage
Where there is a build-up of water pressure behind a lining or the ingress of water into a tunnel, the ground water drainage system should be cleaned and additional drainage installed as necessary. For individual cracks, channels can be placed at the points of water ingress with conduits running to a drain or sump in the invert. For more extensive cracking, an inner shell or shield can be installed. This usually takes the form of a waterproof membrane attached to the tunnel lining with a gap sufficient to allow water to flow to the invert: the membrane is then protected by a thin concrete overlay.
Many types of joint in reinforced concrete tunnel elements are inaccessible, non-replaceable and effectively maintenance-free. However, where necessary and possible, joints should be cleaned and repaired so that the drainage system functions effectively. Rigid joints can be grouted and the seals in flexible joints can be replaced.
6.5.2 Surface and sub-surface drainage
The amount of water entering a tunnel along the road surface is usually minimised by installing drainage troughs at the portals, and any water that does enter the tunnel can be controlled by surface and sub-surface drainage systems, as described in 6.3.1.1.
6.5.3 Grouting
When water ingress through the intrados is significant and/or forms a path for the erosion of the material surrounding the tunnel, the affected areas may be grouted as described in 6.3.3.6.
COST 345 Final Report
137
Expanding water-reactive grout can be used to provide a waterproof barrier, and cementitious grout can be used where structural support is required. The injection pressure should be limited to avoid disturbance of the structure, and care should be taken to ensure that grout does not enter drains and service ducts.
Table 6-8 Remedial measures for tunnels
Fault Measure Ingress of external water Grout around tunnel lining
Repair/seal cracks Install/repair ground water drainage system, such as individual channels, drip shields, lining systems Repair construction/expansion joints in lining Seal inner surface
Ingress of chloride ion-rich water, carbon dioxide and water from inside tunnel
Install/replace waterproofing Repair construction/expansion joints Install/repair drainage systems Apply surface protection, such as a coating or impregnant Repair/seal cracks
Usually, the deck slab of a tunnel should be waterproofed with a bridge deck waterproofing system and surfaced as described in 6.3.1.2.
6.5.5 Deck slab expansion joints
Expansion joints should be installed between deck slabs in the manner described in 6.3.1.3. To reduce problems of leakage, the number of expansion joints should be kept to a minimum. Leakages should be prevented from reaching the vulnerable parts of the substructure: see 6.3.1.1.
6.5.6 Protection of exposed concrete
Exposed concrete that is vulnerable to chloride ingress may be treated with an impregnant as described in 6.3.1.6. Anti-carbonation coatings can be applied to concrete at risk of carbonation. Coatings may be applied to tunnel linings to improve reflectance and prevent dirt retention, but the effect of ground water ingress on the lining must be taken into account under these circumstances.
6.5.7 Concrete repair
All concrete elements should be maintained as described in 6.3. Reinforced concrete drainage sumps may be waterproofed to protect them against aggressive species carried in solution.
6.6 REMEDIAL MEASURES FOR EARTH RETAINING WALLS
The remedial measures for retaining walls are summarised in Table 6-9. Some of these are similar to those described earlier for concrete bridges and masonry arch bridges, particularly those involving material refurbishment. The following concentrates on specific aspects of the measures particularly relevant to retaining walls.
6.6.1 Pointing
The following concentrates on dry-stone walls: further information on repointing is in 6.3.3.1. Hand-pointing or pressure-pointing can be used for dry-stone walls, but it is important that drainage paths are not blocked as this may hasten collapse where water pressures build up behind the wall. Additional weep holes should be installed where necessary. The mortar should not be too strong as this will concentrate the effects of any differential movement into fewer and wider cracks. A weak mortar will accommodate small movements and any cracking will be distributed as hairline cracks in the joints where they are less noticeable. O’Reilly (2000) gives information on the selection of mortars.
6.6.2 Grouting
To date, grouting has not been used much for the repair of retaining structures because of the problems of assessing its effectiveness. However, some soils are suitable for grouting, and the voids in fills composed of reject stone, rubble and knappings accumulated during the construction process can be grouted.
Fluid grout exerts a hydrostatic pressure on the wall and it is essential that this does not destabilise it. Drainage paths must not be blocked so additional drainage, weep pipes etc. should
COST 345 Final Report
139
be installed to prevent the build-up of water pressure behind the wall. Grout must be prevented from infiltrating service ducts, drains, nearby structures and watercourses.
Grouting is most appropriate for repairs where there are rapidly fluctuating water levels, such as canal locks and sea walls, where the movement of the water can leach out cementitious materials and wash out fines from the masonry. It creates a permanent barrier to prevent water movements within and behind the wall.
6.6.3 Soil nailing
Soil nailing involves the insertion, by boring or driving, of tensile elements into otherwise undisturbed soil or fill. The nails must cross the potential slip planes along which failure is most likely. When inserted into bored holes, the nails need to be grouted to gain contact with the soil. Usually the holes are declined by 10° to 20° to facilitate the grouting process. Soil nails do not normally generate any restoring force until ground movements occur. Further information on the use of soil nails for repairing retaining walls is given in Johnson and Card (1998).
Table 6-9 Remedial measures for earth retaining walls
Fault Measure
Water leakage through wall Grout backfill Install weep holes Install/repair ground water drains Repair burst water mains and leaking sewers
Ingress of chloride-ion rich water, and water from the exposed face of the wall
Apply surface protection, such as a coating or impregnant Seal cracks
Low passivity of reinforcement Increase depth of cover Replace contaminated and/or carbonated concrete
Instability of wall leading to excessive movement or cracking
Provide temporary support, such as props or berm, until permanent repair put in place Install/repair drains Point Grout Install soil nails/reinforcements and/or dowels Install ground anchors Construct crib wall Plant vegetation
Insufficient load capacity Strengthen (with one or more of the measures listed above)
6.6.4 Ground anchorages
Ground anchorages provide a stabilising force from a grouted length of tendon behind the potential failure plane that is transferred along a debonded length of shaft to a surface bearing
COST 345 Final Report
140
plate. Ground anchorages are active devices and the unbonded length is prestressed against the surface bearing plate: that is, stabilising forces are generated without the need for any soil movement within the structure. Ground anchorages are often installed at about 90° to the critical potential failure plane so that their effect is mainly one of increasing the frictional resistance along the plane by increasing the normal force across that plane.
6.6.5 Soil dowels
Soil dowels are relatively large diameter piles inserted into the ground across a potential failure plane. They are possibly more effective when installed at about 90° to the failure plane, but for convenience of installation they are often installed vertically. They provide enhanced shearing resistance mainly by their large diameter to length ratio and high bending stiffness.
6.7 CONCLUDING REMARKS
When selecting remedial measures for a particular structure, both the cause and effect of any de-fect or deterioration should be considered so appropriately targeted, cost-effective remedial measures can be designed and executed. Most material deterioration mechanisms that affect highway structures are primarily due to the effects of water. Therefore, it is normally appropriate to use preventative measures to avoid the need for costly repairs in the future due to such dete-rioration. Similarly, preventative measures should be considered when other remedial measures are being undertaken.
It is apparent that there is very little information in the public domain on the cost, durability and effectiveness of the different remedial measures that are described in the WG6 report. It could be argued that this information is too structure-specific to be of value, being dependant on the age, type and details of the structure, the scale of the works, the installation procedures, the ma-terials used and the in-service conditions. However, only by collating and analysing such informa-tion from case studies on a range of structures, in different service conditions and over an ex-tended period of time, can the effectiveness of remedial measures be assessed on a rational basis to enable engineers to select the most appropriate remedial measure(s) for a particular structure. Furthermore, a clearer picture would emerge on what types of structure and details are the most prone to deterioration so that design codes can be changed accordingly.
New and innovative remedial measures, protective treatments and repair materials are being of-fered to engineers on a regular basis. These can yield considerable savings in material costs, instal-lation costs or whole-life costs, or all three. In some countries, highway organisations require products to be approved before they can be used on their network. Whereas this gives confidence that products should perform to a certain standard, approval procedures rarely identify perform-ance to the standard required for a product to be cost-effective. Approval procedures cannot rep-licate all of the installation and in-service conditions so the performance in service is always the best indicator of performance, provided products are assessed under a range of service condi-tions, including extremes. However, the benefits of innovative products could be lost if they are not used widely until their long-term benefits are demonstrated. One possible solution to this di-lemma would be for products to undergo additional or more demanding approval procedures so an appropriate level of performance was demonstrated. This approach could affect radically the specification of products, the tendering process and free competition, and it may be unworkable in some cases. However, eventually, the use of products that are not cost-effective would reduce.
A list of recommendations, arising from the issues described above, is given in Chapter 7 of this report.
COST 345 Final Report
141
Chapter 7 Consolidated listing of recommendations
7.1 RECOMMENDATIONS FROM WORKING GROUP 1 (INVENTORY)
Recommendation WG1.1
Without full information on the number, location, size and replacement value of all the various structures on the highway network it is impossible to develop and resource a realistic programme for the maintenance, repair and renewal to sustain the stock of these structures. It is, therefore, our first recommendation that such information be systematically collected without delay in all countries so that policy and management decisions are soundly based.
Recommendation WG1.2 (c.f. Recommendations WG2 and 3.10, WG6.1, WG6.2, WG6.3 and AM.5)
It is clear from the replies to the questionnaire that detailed information on the structures on the highway system is often lacking. This is particularly so for Local and Regional Roads and even for National Roads in some countries. It is, therefore, recommended that in order to develop and refine long-term programmes of maintenance, repair and renewal to the stock of highway structures on all the road network there is a need to expand the basic data outlined in Recommendation WG1.1 to include as much detail as possible, including historic information, on the condition, work undertaken and expenditure relating to every structure on the highway network.
Recommendation WG1.3
Renewal is part and parcel of the process of sustaining the stock of structures on the highway system and it is recommended that steps be taken to alter the relevant financial rules to ensure that this is so.
Recommendation WG1.4
Current knowledge of the numbers of structures on the highway networks of Europe is imperfect and the estimates of the cost of replacing them leaves much to be desired. However, it is virtually certain that the estimates given in Chapter 3 are of the correct order of magnitude and very probably err on the low side.
It is, therefore, recommended that steps be taken to refine the above figures and obtain more precise information on the numbers and replacement values of the stock of all highway structures on the European road system.
Recommendation WG1.5
A unified classification system for highway structures, to be used in all European countries, should be developed to facilitate the task outlined above.
Recommendation WG1.6
Information on the costs of construction and replacement of road tunnels, as well as on the expenditure on their operation, maintenance, repair and renewal, is incomplete and flimsy. There
COST 345 Final Report
142
is, therefore, a need to obtain these data so that the appropriate levels of funding can be identified and provided for these crucial structures on the road network.
Recommendation WG1.7
On the basis of the limited information currently available it is necessary to earmark or dedicate the sum of €6.6 billion every year to be expended exclusively on the maintenance, repair and renewal of the bridges and retaining structures on the road networks of the Europe 27 countries. This compares with a current annual expenditure in these countries of perhaps €2-3 billion on the maintenance, repair and renewal of road bridges and perhaps 10-20% of that amount on retaining walls.
Recommendation WG1.8
The adequacy or otherwise of the above expenditure should be reviewed about 5 years or so after implementation of Recommendation WG1.7 using the results of detailed monitoring and updating of inventories.
Recommendation WG1.9
There is a need to ensure adequate financing of the maintenance, repair and renewal of highway structures on the whole road network but particularly on Regional and Local roads year in year out.
Recommendation WG1.10
The setting up of dedicated funds derived from charges on the road user should be considered as a means of insulating such necessary annual expenditures from the vagaries of the economy as well as short-term political pressures.
Recommendation WG1.11
There is a pressing need for each and every country to set aside, year in year out, adequate sums of money to sustain all their road infrastructure, including Regional and Local roads, and all the structures on it in an acceptable way.
Recommendation WG1.12
There is a need for each country to consider the setting up of a centralised repository for all data on the structures on their highway network.
Recommendation WG1.13 (c.f. Recommendation WG2 and 3.2)
There is a need to develop a series of assessment standards for highway structures complementary to the existing standards for the design and construction of new structures.
Recommendation WG1.14
There is a need to ensure that programmes of research and development are in place to ensure that the expenditures on maintenance, repair and renewal of highway structures are cost effective and achieve their purpose.
COST 345 Final Report
143
Recommendation WG1.15
There is a need to review the arrangements for road research and development within Europe to assess its effectiveness and determine whether any changes are needed to ensure its organisation and funding are appropriate and adequate for the future.
Recommendation WG1.16
There is a need to provide sufficient checks and balances in the system to ensure financial probity, impartial advice on design and the appropriate standard and cost effectiveness of expenditure on maintenance, repair and renewal of highway structures.
7.2 RECOMMENDATIONS FROM WORKING GROUPS 2 AND 3 (INSPECTION AND CONDITION ASSESSMENT)
Recommendation WG2 and 3.1
Key design assumptions should be defined in the inventory of an asset management system for a stock of structures. Where possible, the system should require these assumptions to be checked by an inspector.
Recommendation WG2 and 3.2 (c.f. Recommendation WG1.13)
A best practice guide for assessing highway structures should be established. Such a guide may lead to the development of national assessment codes in countries where they do not already ex-ist, but it would seem more productive to develop European-wide documents covering the as-sessment of highway structures.
Recommendation WG2 and 3.3
Specific loading rules for assessing in-service structures should be devised. The first priority is the development of a new code for traffic loading that takes account of local conditions, remain-ing service life, and supplementary safety measures such as monitoring and controlling traffic flows. There is benefit in considering a European-wide approach to the development of such codes.
Recommendation WG2 and 3.4
Information on actions (e.g. loads, temperature, wind) that have been investigated in some depth should be disseminated and compared. Relevant documents should be translated into English.
Recommendation WG2 and 3.5 (c.f. Recommendation WG2 and 3.24)
Methods and techniques should be available for assessing the condition of all types of highway structure. As a starting point those developed for bridges can be adapted to other highway struc-tures, but the evaluation of defects for other structures must be determined with respect to the nature and type of loading acting on them.
Recommendation WG2 and 3.6 (c.f. Recommendations WG6.5 and WG6.6)
A range of new materials is now being promoted for the construction and repair of bridges but, at present, their long-term durability has only been assessed from laboratory tests. It is essential to observe the in-service performance of these new materials, and continuous performance re-
COST 345 Final Report
144
cords should be established for them as a matter of course. Appropriate equipment should be developed for detecting and monitoring deterioration processes.
Recommendation WG2 and 3.7
Long-term studies should be undertaken to track the initiation and propagation of defects and deterioration processes. Such studies should cover a range of structural types, and both ageing and new structures.
Recommendation WG2 and 3.8
Inspection procedures should be reviewed to determine where improvements in current practice can be made. Issues of particular interest are: • defining the objectives of an inspection; • integration of the inspection process into the management of structures; • economic, environmental, safety and social implications; • determining the level of detail required in an inspection; and • setting the frequency for the different types of inspection, but allowing flexibility according
to the type of structure and what is being inspected.
Recommendation WG2 and 3.9
The usefulness of the standard inspection report forms and the information provided to an in-spector should be reviewed. Consideration should be given to the use of purpose-designed forms for each type of structure.
Recommendation WG2 and 3.10 (c.f. Recommendations WG1.2, WG6.1, WG6.2, WG6.3 and AM.5)
Consideration should be given to the establishment of a register or log for each highway struc-ture. Such a document could contain details of its design and construction, inspection reports and details of any remedial works.
Recommendation WG2 and 3.11
The factors that pose the greatest risk to the stability of a structure should be identified and in-cluded as part of the inspection process. Such factors may include: • traffic accidents - thus there may be a need to check road alignment, visibility, lane markings,
and signs for speed, weight restrictions and clearances; • seismic activity, subsidence and settlement - some elements are more at risk than others; and • erosion and scour.
Recommendation WG2 and 3.12
The methods of procurement and the specifications used for testing highway structures should be reviewed. From this, model contract documents should be established to suit various require-ments for testing.
Recommendation WG2 and 3.13
Advice or guidance notes on various NDT methods are required to extend the ranges of applica-tion, to encourage consistent and appropriate usage, and to improve the interpretation and appli-
COST 345 Final Report
145
cation of the test data in assessing the condition of a structure. Such notes should include de-tailed information from case studies.
Recommendation WG2 and 3.14
Research should be directed at producing cheaper, more reliable and user-friendly NDT equip-ment. Emphasis should be given to improving the signal processing equipment used for radar and ultrasonic surveys.
Recommendation WG2 and 3.15
The use of load tests for assessment purposes should be reviewed: this should cover cost-effectiveness, instrumentation, and data collection and analysis.
Recommendation WG2 and 3.16
It is recommended that loading tests are undertaken on novel or prototype structures.
Recommendation WG2 and 3.17 (c.f. Recommendations WG2 and 3.25 and WG6.2)
In-service structures should be monitored as a matter of routine. Advice or guidance notes should be produced to encourage such exercises: these should cover the planning of such work; data collection, analysis and application to whole-life cost models; measurement techniques and equipment; and personnel qualifications. Where possible, they should also include information from case studies.
Recommendation WG2 and 3.18 (c.f. Recommendations WG6.1, WG6.2, WG6.3 and AM.5)
The data obtained from monitoring exercises should be held centrally, and in a form that makes them easy to retrieve and interrogate.
Recommendation WG2 and 3.19 (c.f. Recommendation WG2 and 3.26)
The methods used to collect and record the data obtained from inspections of highway struc-tures should be reviewed. This should cover the use of photographic techniques, including ste-reo-photogrammetry and video recording.
Recommendation WG2 and 3.20
The type and amount of data collected, archived and analysed from inspections should be re-viewed periodically to ensure that they meet the requirements of the management system.
Recommendation WG2 and 3.21
The extent to which the type, quality and quantity of data from an inspection satisfies the re-quirements of a condition assessment should be reviewed periodically. And, where necessary, work should be directed at improving or developing investigatory techniques, instruments, and the collection and analysis of site data.
Recommendation WG2 and 3.22
Further work should be directed at improving the methods used to identify and rank the impor-tance of defects with regard to the safety, durability and cost of maintaining highway structures.
COST 345 Final Report
146
Recommendation WG2 and 3.23
Methods for deriving an adequacy rating or priority ranking of structures should be investigated. This should include a review of the potential of new mathematical techniques, such as fuzzy set theory and neural networks.
Recommendation WG2 and 3.24 (c.f. Recommendation WG2 and 3.5)
Taking the methods used for bridges as a starting point, methods for assessing the condition of earth retaining walls and buried structures should be established.
Recommendation WG2 and 3.25 (c.f. Recommendations WG2 and 3.17 and WG6.2)
Long-term monitoring works should be undertaken as a matter of course, and the results of such case studies made available for reference purposes.
Recommendation WG2 and 3.26 (c.f. Recommendation WG2 and 3.19)
Work should be directed at improving the methods used to inspect and monitor the condition of in-service structures, the methods used to analyse the data from such exercises, and the quality of inspection reports.
Recommendation WG2 and 3.27
As a matter or priority, work should be undertaken to develop and implement a certification scheme for inspectors. This should include attendance at training/educational courses, and checks on the competence of prospective candidates and inspectors. This work should be under-taken on a pan-European basis.
Recommendation WG2 and 3.28
Work should be undertaken to check the consistency and reliability of structural assessments. It would also seem necessary to introduce a certification scheme for assessors: again, there is merit in a pan-European approach.
7.3 RECOMMENDATIONS FROM WORKING GROUPS 4 AND 5 (NUMERICAL TECHNIQUES, AND SAFETY AND SERVICEABILITY)
Recommendation WG4 and 5.1
Performing structural assessments is a necessary process as existing structures without an appar-ent problem may be inadequate due to the increased traffic weights and volumes or changed de-sign rules. Formal calculation based assessments are necessary to deal with risks associated with this.
Recommendation WG4 and 5.2
The absence of any apparent signs of distress in a structure does not mean that it is structurally adequate. When the failure mode is likely to be brittle, there may be no early warning signs. Cal-culation-based assessments should be done to gain assurance about the adequacy of the whole stock of highway structures.
COST 345 Final Report
147
Recommendation WG4 and 5.3
Design codes prescribe rules that are only valid within a certain context, including the long design life time. Especially, but not only, for older bridges the design should replace the assessment rules in order to avoid unnecessary rehabilitation measures.
Recommendation WG4 and 5.4
The design codes present safety margins that exceed those that are reasonable to accept for the assessment of existing structures. As the level of knowledge of existing structures and the actual traffic conditions can be determined with a greater degree of certainty, partial safety factors can be reduced while maintaining the same level of structural safety.
Recommendation WG4 and 5.5
Assessment of structures should be carried out at different levels of complexity. Only if a lower level analysis fails to prove sufficient safety, a higher level assessment is feasible. Five levels, with Level 1 being the simplest and Level 5 the most sophisticated, are generally accepted. Means for carrying out assessments at Levels 1 to 3 are generally available, while levels 4 and 5 involve struc-tural reliability calculations and are currently only used by experts.
Recommendation WG4 and 5.6
Experimental data are needed to form probabilistic distributions to describe mathematically the variables. The Bayesian approach is recommended to systematically incorporate new information into an existing model.
Recommendation WG4 and 5.7
Traffic data should be collected continuously in representative periods of time. The duration of recording depends upon time, budget, location and other factors. It is desirable to have as much data as possible, but at least 1 to 2 weeks of continuously recorded data in conjunction with the results of manual surveys is recommended.
Recommendation WG4 and 5.8
Traffic data modelling should incorporate a number of alternative scenarios for free flowing, jammed and mixed traffic.
Recommendation WG4 and 5.9
When calculating the maximum expected traffic loading it should be taken into account that the maximum static effects will not necessarily correspond to the maximum dynamic effects.
Recommendation WG4 and 5.10
Assessment of highway structures should incorporate accurate modelling of the resistance of their structural elements. This demands knowledge of the material properties, the structural di-mensions, the influences on the material properties and structural dimensions, time (i.e. the ex-tent and strength changes due to deterioration mechanisms such as fatigue and corrosion), fabri-cation methods and quality control measures.
Recommendation WG4 and 5.11
The statistical distributions selected to describe material properties should be updated when new information becomes available.
COST 345 Final Report
148
Recommendation WG4 and 5.12
When modelling concrete, if possible, the following characteristics should be accounted for: ba-sic compressive strength f ’c, changes with time, changes due to spatial variations, the degree of quality control, effect of speed of loading on concrete strength and concrete strength in tension.
Recommendation WG4 and 5.13
When determining the values of material properties to be used in the assessment of an existing structure, the difference between test values and in-situ material properties must be considered, as well as the effects of compliance controls.
Recommendation WG4 and 5.14
In general, the partial safety factors used in design should not be used for assessment in order to avoid conservatism.
Recommendation WG4 and 5.15
Methods of analysis for structural assessment should ideally take account of all the significant aspects of the structural response to loads and imposed displacements.
Recommendation WG4 and 5.16
Elastic methods of analysis should be used to determine internal forces and deformations. Plastic methods of analysis (e.g. plastic hinge methods for beams, or yield line methods for slabs) may be used when they model the combined local and global effects adequately.
Recommendation WG4 and 5.17
For accurate results, bridge decks with edge cantilevers, voided decks, cellular box or transverse diaphragms should be modelled in 3D, but these models are considerably more complex.
Recommendation WG4 and 5.18
For soft clays and sands, yield in shear should be included in the finite elements modelling the soil.
Recommendation WG4 and 5.19
When integrating field data into structural model, the structure dimensions should be measured with appropriate surveying equipment on site and in the case of observed deformations, the new profile should be considered in the analysis.
Recommendation WG4 and 5.20
When calibrating the structural model, data might be taken from design drawings but should be verified by in situ measurements, especially for critical members, before starting the optimisation procedure.
Recommendation WG4 and 5.21
Due to its complexity, an assessment associated with complex mathematical modelling should be used with considerable caution when interpreting the results.
COST 345 Final Report
149
Recommendation WG4 and 5.22
In contrast to codes for new structures, formats for assessment of existing structures should make allowance for matters such as the quality of inspection, the extent and quality of on-site measurements, potential failure modes and possible consequences of failure.
Recommendation WG4 and 5.23
Partial safety factors are designed to cover a large number of uncertainties and may therefore not be very representative for evaluating the reliability of a particular structure. If possible, they should be calibrated using probabilistic methods and idealised reliability formats.
7.4 RECOMMENDATIONS FROM WORKING GROUP 6 (REMEDIAL MEASURES)
Recommendation WG6.1 (c.f. Recommendations WG1.2, WG2 and 3.10, WG6.2, WG6.3 and AM.5) Detailed information on remedial measures used on structures should be collated by the highway organisations. This should include: the structural details; the extent of any deterioration; the pro-tective measures that have been in place, and their effectiveness, since the structure was erected; the scale of the works; the installation method; the cost of the measures; the service conditions and the time since any previous remedial measures were carried out.
Recommendation WG6.2 (c.f. Recommendations WG2 and 3.10, WG2 and 3.17, WG2 and 3.25, WG6.1, WG6.3 and AM.5) Structures should be monitored on a regular basis to determine, where possible, the service life of remedial measures.
Recommendation WG6.3 (c.f. Recommendations WG1.2, WG2 and 3.10, WG6.1, WG6.2 and AM.5) Case studies that demonstrate the effectiveness of remedial measures should be put in the public domain. The studies should include the detailed information listed in Recommendation WG6.1. Details of the performance should be updated on a regular basis.
Recommendation WG6.4 (c.f. Recommendation AM.2) The information collated by highway organisations should be analysed to identify poor details or practices that are responsible for the deterioration of structures. When appropriate, design codes should be amended accordingly.
Recommendation WG6.5 (c.f. Recommendation WG2 and 3.6) Where the benefits of new products cannot be demonstrated in current approval procedures, ad-ditional or more demanding procedures should be considered as a means of demonstrating the level of performance required to make the products cost-effective.
Recommendation WG6.6 (c.f. Recommendation WG2 and 3.6) The evaluation of new products should be encouraged in in-service trials in which the perform-ance of the new product can be compared with the performance of existing products.
Recommendation WG6.7 The information listed in Recommendations WG6.1 and WG6.2 should be analysed so the ser-vice life of remedial measures, protective treatments and repair materials in different service con-ditions can be estimated from the performance in service. Where the service life of new products
COST 345 Final Report
150
is not proven in service, guidance should be given to enable engineers to estimate the service life from approval tests.
Recommendation WG6.8 Guidance should be prepared to help engineers to select the most cost effective remedial meas-ure(s) for each application. This should take into account direct and indirect costs.
7.5 RECOMMENDATIONS ON ASSET MANAGEMENT (SEE ANNEX I)
Recommendation AM.1
The application of asset management systems to highway networks should be reviewed and, if appropriate, a generic model produced for use across Europe.
Recommendation AM.2 (c.f. Recommendation WG6.4)
The flow of information through an asset management system should be reviewed to ensure that essential data are collected and used to update records and procedures covering the design and maintenance of the infrastructure.
Recommendation AM.3
The need for a generic asset value model for highway networks should be investigated.
Recommendation AM.4
The use of net present value for highway works should be re- examined.
Recommendation AM.5 (c.f. Recommendations WG1.2, WG2 and 3.10, WG6.1, WG6.2 and WG6.3)
A highway management system should incorporate a standard method for reporting the success or failure of remedial works. Short reports should be provided for works costing in excess of, say, €25 000. The information from such works should be in a format that can be interrogated to as-sess the frequency of particular maintenance problems and the success of various remedial works.
Recommendation AM.6
The concept of design life and its application in the design and maintenance of a highway struc-ture should be reviewed.
Recommendation AM.7
The application of an outline risk assessment model for highway networks, and for key structural elements of such networks, should be investigated.
Recommendation AM.8
The incorporation of risk assessments into the inventory of a highway structure or network should be examined.
Recommendation AM.9
Prioritisation models should be developed to decide whether or not remedial works are required, and the details of such works; such models should take account of a wide range of issues, such as whole life costing, sustainability and environmental impact.
COST 345 Final Report
151
Chapter 8 References
Allen R T L, Edwards S C and Shaw J D N (1993). The repair of concrete structures. Blackie academic and professional, London.
Allen, D. E. (1972), “Statistical Study of the Mechanical Properties of Reinforcing Bars”, Building Research Note No. 85, Division of Building Research, National Research Council, Ottawa, Can-ada, April.
Allen, D.E. (1970), “Probabilistic Study of Reinforced Concrete Building” Technical Paper NRC 11139, National Research Council of Canada, Ottawa, Canada, Jan.
American Society for Testing Materials (1972), “Reinforcing bar test program”, ASTM A.01.05, ASTM Task Group 70-3, Philadelphia, Pa., November.
Ang, A.H-S. & Tang, W.H. (1975), Probability concepts in engineering planning and design, Vol. I – Basic Principles’, John Wiley and Sons, New York.
Ang, A.H-S., Tang, W. (1984), Probability Concepts in Engineering Planning and Design, Vol. II Deci-sion, Risk and Reliability. John Wiley & Sons, New York.
ASTM (2003). C803/C803M-03. Standard method for penetration resistance of hardened con-crete. ASTM International.
Augusti, G., Ciampoli, M. & Frangopol, D.M. (1998), “Probabilistic response of prestressed con-crete bridges to fatigue”, Engineering Structures, Vol. 20, No. 11, November, pp. 940-947.
BA 16/97 (1997), The assessment of highway bridges and structures. Design manual for roads and bridges. HMSO, London.
BA 79/98 (1998), The Management of Sub-Standard Highway Structure. Design Manual for Roads and Bridges, Vol. 3, Section 4, Part 18. HMSO, London.
Bailey, S. (1996), Basic Principles and Load Models for the Structural Safety Evaluation of Existing Road Bridges. These No. 1467, EPFL Lausanne.
Baker, M.J., Burgoyne, C.J. & Dowling, P.J. (1988), “New strategies for bridge assessment”, As-sessment of reinforced & prestressed concrete bridges, September, Published by the Institution of Structural Engineers, London, pp. 43-45.
Balaguru, P. (1995), “Comparison of Normal and Lognormal Frequency Distributions for Repre-senting Variations of Concrete Compressive Strength”, ACI Material Journal, Vol. 92, No. 5, March –April.
Bannister, J.L. (1968), “Steel Reinforcement and Tendons for Structural Concrete, Part 1: Steel for Reinforced Concrete”, Concrete, Vol. 2, No. 7, July, pp.295-306.
Barnard C P and Cuninghame J R (1997). Practical guide to the use of bridge expansion joints. TRL Application Guide 29. TRL Limited, Crowthorne, UK.
Bartlett, F.M. & MacGregor, J.G. (1996) “Statistical analysis of the concrete compressive strength of concrete structures”, ACI Materials Journal, Vol. 93, No. 2, pp.158-168.
Basma, Adnan A. & Abdel-Jawad, Yahia (1995), “Probability Model for the Drying Shrinkage of Concrete”, ACI Materials Journal, Vol. 92, No. 3, May-June.
BD 21/97 (1997), The Assessment of Highway Bridges and Structures. Design Manual for Roads and Bridges, Vol. 3, Section 4, Part 3. HMSO, London.
COST 345 Final Report
152
BD 21/97 (1997): The Assessment of Highway Bridges and Structures (DMRB Vol. 3, Section 4, Part 3)
BD 34. Implementation of the 15 year bridge rehabilitation programme - Stage 1 older short span bridges. Design manual for roads and bridges. HMSO, London.
BD 44/95 (1995), The Assessment of Concrete Highway Bridges and Structures. Design Manual for Roads and Bridge”, Vol. 3, Section 4, Part 14. HMSO, London.
BD 44/95 (1995): The Assessment of Concrete Highway Bridges and Structures (Vol. 3, Section 4, Part 14)
BD 46. Implementation of the 15 year bridge rehabilitation programme - Stage 2 modern short span bridges. De-sign manual for roads and bridges. HMSO, London.
BD 50. Implementation of the 15 year bridge rehabilitation programme - Stage 3 long span bridges. Design man-ual for roads and bridges. HMSO, London.
BD 56. The assessment of steel bridges. Design manual for roads and bridges. HMSO, London.
Bettelini M (2002). Mont Blanc fire safety. Tunnels and Tunnelling, June 2002, pp26-28. Bickel, J.O., Kuesel, T.R. & Elwin, H.H. (1996), Tunnel Engineering Handbook, 2nd Edition, Chap-
man & Hall. Bloem D.L. (1968), “Concrete Strength in Structures,” Proceedings of the American Concrete Institute,
Vol. 65, No.3, March, pp.178-197.
Bloom M (1999). Cost recovery and dedication of road user fees. PIARC Committee on Financing and Economic Evaluation (C9).
Borge and Castenheta (1971), Structural Safety, Laboratoria Nacional de Engenhera Civil, Lisbon
Bousquet F and Queiroz C (1996). Road financing systems: a cross-country comparison of typical issues and good practices. Proc Seminar G PTRC European Transport Forum, Brunel University, England. PTRC Education and Research Services Ltd.
Briaud J-L and Gibbens R (1999). Behaviour of five large spread footings in sand. Journ Geotechnical and Geoenvironmental Engineering (September), Vol 125, No 9, pp787-796.
BRIME "Bridge Management In Europe" (1999): Deliverable D1 - Review of current procedures for as-sessing load carrying capacity.
BRIME (2002). European Commission DG VII 4th Framework Programme. BRIdge Management in Europe. [Fourteen reports.] http:/www.trl.co.uk/brime/
British Standards Institution (1990), “BS 5400 Steel, Concrete and Composite Bridges”, Part 4: Code of Practice for Design of Concrete Bridges, UK.
Campbell R.H. & Tobin R.E. (1967), “Core and Cylinder Strengths of Natural and Lightweight Concrete”, Proceedings of the American Concrete Institute, Vol. 64, No 4, April, pp.190-195.
Canadian Standards Association (1990). Supplement No 1-1990. Existing bridge evaluation, to CSA Standard CAN/CSA-56-88 Design of highway bridges. Canadian Standards Association, Rexdale, Toronto.
Caprani, C.C. (2002b) Programs for the Site-Specific Analysis and Simulation of Free-Flowing Trucks on Bridges, Dept. Of Civil Engineering, University College Dublin.
Caprani, C.C., Grave, S.A., O’Brien E.J. & O’Connor, A.J. (2002), "Critical Loading Events for the Assessment of Medium span Bridges", First Symposium on Bridge Engineering Research Activity in Ireland, Eds. C. McNally and S. Brady, University College Dublin.
COST 345 Final Report
153
Casas, J.R. & Crespo-Minguillon, C.(1998), “Field load testing and reliability-based integrity as-sessment of segmental PC box girder bridges before opening to traffic”, Engineering Structures, Vol. 20, No. 11, November 1998, pp. 948-956.
Casciati F., Negri I. & Rackwitz, R. (1991), “Geometrical variability in structural members and systems”, JCCS Working Document, IABSE publication, January.
CEB-FIP (1990), Model Code for Concrete Structures, Committee Euro-International du Beton, Thomas Telford, London.
CEB-FIP (1991), Reliability of Concrete Structures, CEB bulletin 202.
Chase S B (1998). The bridge maintenance programme of the United States Federal Highway Administration. Proc Management of highway structures (Editor Das P C). Thomas Telford, London.
Cho, H., Choi, Y. & Sho, B. (1998), “Application of reliability analysis in bridge management”, Engineering Structures, Vol. 20, No. 11, November, pp. 957-959.
Christoffersen J, Hauge L. and Bjerrum J. (1999). Footbridge with carbon-fibre-reinforced polymers, Denmark. Structural Engineering International Vol 9, No 4/1999.
Cifuentes, A.O. (1989), “Dynamic response of a beam excited by a moving mass”, Finite Elements in Analysis and Design 5, Elsevier Science Publishers B.V., Amsterdam, pp. 237-246.
Commission of the European Communities (1998). White Paper: Fair Payment for Infrastructure Use: a phased approach to a common transport infrastructure charging framework in the EU. Brussels.
Construction Industry Research and Information Association (1997), Rationalisation of Safety and Serviceability Factors in Structural Codes, CIRIA Report 63, July.
COST (2004a). COST 345 Procedures required for assessing highway structures. Working Group 1 Report on the current stock of highway structures in European countries, the cost of their replacement and annual costs of maintaining, repairing and renewing them. TRL Limited, Crowthorne, UK.
COST (2004b). COST 345 Procedures required for assessing highway structures. Working Groups 2 and 3 Report on inspection and condition assessment. TRL Limited, Crowthorne, UK.
COST (2004c). COST 345 Procedures required for assessing highway structures. Numerical techniques for safety and serviceability assessment. Working Groups 4 and 5 Report on numerical techniques for safety and serviceability assessment. ZAG Ljubljana, Slovenia.
COST (2004d). COST 345 Procedures required for assessing highway structures. Working Group 6 Report on remedial measures for highway structures. TRL Limited, Crowthorne, UK.
Cremona, C. (1996), “Bridge fatigue damage evaluation and updating using non-destructive in-spections”, Engineering Fracture Mechanics, Vol. 53, No. 5, March, pp. 775-788.
CSS (2000). Funding for bridge maintenance. County Surveyors’ Society, Matlock, Derbyshire.
Cullington D W and Beales C (1994). Is your strengthening really necessary? Proc Conf Bridge Modification, London, March 1994 (Editor Prichard B). Thomas Telford, London.
Danish Road Directorate (Vejdirektoratet) (1996), “Rules for Determination of the Load Carry-ing Capacity of Existing Bridges”.
Das, P.C. (1997), Safety of bridges, Thomas Telford Publishing, London.
COST 345 Final Report
154
Das, P.C. (1998), “Probabilistic analysis of resistance degradation of reinforced concrete bridge beams under corrosion”, Engineering Structures, Vol. 20, No. 11, November, pp. 960-971.
Das, P.C. (1999), Maintenance of highway bridges, Thomas Telford Publishing, London.
Das, P.C. and Mičić T.V. (1999). Maintaining highway structures for safety, economy and sustainability. 8th International conference on extending the life of bridges, civil and building structures, July 1999. Engineering Technics Press.
Deger, Y., Felber, A., Cantieni, R. & De Smet, C.A.M. (1996), “Finite Element Model Optimisa-tion of a Large Bridge Based on Dynamic Testing”, Bridge Management Three, Inspection, Mainte-nance, Assessment and Repair, Edited by J.E. Harding, G.A.R. Parke & M.J. Ryall, pp. 343-351.
Department of the Environment, Transport and the Regions (DETR) (2000). Guidelines for environmental risk assessment and management – revised departmental guidance.
Ditlevsen, O. & Madsen, H.O. (1996), Structural Reliability Methods, John Wiley & Sons, Chichester. Ditlevsen, O. (1981), Uncertainty Modelling, McGraw-Hill, New York. Doebling, S.W. & Farrar, C.R. (Eds.) (1999), The State of the Art in Structural Identification of Con-
structed Facilities, ASCE Committee on Structural Identification of Constructed Facilities, Draft Report 28 June 1999, Los Alamos National Laboratory.
Eichinger, E. M, Wenighofer, W. & Kollegger, J. (2001), Zuverlaessigkeitsanalyse von zwei Stahlbeton-bruecken, Report No. 01/10, Institute for Structural Concrete, University of Technology, Vi-enna, Austria.
Ellingwood B., Galambos T., MacGregor J., & Cornell A. (1980), Development of a probability based load criterion for American national standards A58. Building code requirements for minimum design loads in buildings and other structures, NBS special publication 577, June.
EN 1990:2002 Eurocode 0 (2002). Basis of structural design Enevoldsen, I., von Scholten, C.T. & Lauridsen, J. (2000), “Probabilistic-based assessment of a
large steel bascule bridge and a concrete slab bridge”, Bridge Management Four, Inspection, Mainte-nance, Assessment and Repair, Thomas Telford Publishing, London, pp. 735-743.
Enright, M.P. & Frangopol D.M. (1998), “Optimal planning of retrofitting interventions on bridges in a highway network”, Engineering Structures, Vol. 20, No. 11, November, pp. 933-939.
Enright, M.P. & Frangopol, D.M. (1998a), “Bridge reliability experiences in Japan”, Engineering Structures, Vol. 20, No. 11, November, pp. 972-978.
European Commission (2000). EU transport in figures. Statistical Pocketbook 2000. Office for Official Publications of the European Communities, Luxembourg.
European Commission (2001). White Paper: European transport policy for 2010: time to decide. Luxembourg.
Eymard, R. & Jacob, B. (1989), Un nouveau logiciel : le programme CASTOR pour le Calcul des Actions et des Sollicitations do Traffic dans les Ouvrages Routiers, Bull. Liaison des LPC, No. 199, pp. 71-80.
Faber, M., Val D. & Stewart, M. (1998), “Target proof loads for bridge assessment”, University of New Castle Research Report ISBN 07259 10437.
FIP (1991). Repair and strengthening of concrete structures: guide to good practice. Thomas Telford, London, UK.
Furuta, H. (1998) “Bridge load and resistance models”, Engineering Structures, Vol. 20, No. 11, No-vember 1998, pp. 985-990.
Garas, F.K., Clarke, J.L. & Armer, G.S.T. (1987), Structural Assessment based on Full and Large Scale Testing, Butterworths, London.
COST 345 Final Report
155
Ghali, A. and Neville, A.M. (1989), Structural analysis: a unified classical and matrix approach, Chapman & Hall, London.
Gould, P.L. & Abu-Sitta, S.H. (1980), Dynamic Response of Structures to Wind and Earthquake Loading, Pentech Press Ltd.
Grave, S.A.J. (2001), Modelling of Site-Specific Traffic Loading on Short to Medium Span Bridges, PhD Thesis, Dept. of Civil Engineering, Trinity College Dublin.
Greeman A (2000). Operation Dartford. Tunnels and Tunnelling International 32, December, pp18-21.
Green, M. & Cebon, D. (1994), ‘Dynamic response of Highway Bridges to Vehicle Loads: The-ory and Experimental Validation’, Journal of Structural Engineering, ASCE, Vol. 121, No.2, Feb-ruary, pp. 272-282.
Gurney T (1992). TRL State of the Art Review 8: Fatigue of steel bridge decks. HMSO, London, UK.
nance, Assessment and Repair, Thomas Telford Publishing, London.
Healey T N (1999). Refurbishment of the Dartford East Tunnel. Proc Tunnel Construction and Piling 1999, pp358-369. Brintex Ltd, London.
Helgason T., Hanson J.M., Somes N.F., Corely W.G. & Hognestad E. (1975), Fatigue Stregnth of yield reinforcing bars, NCHRP Projects 4-7 and 4-7/1 Final report (Part 1 and 2), Research and Development, Construction Technology, Laboratories, Portland Cement Association, Skokie, Illinois, March.
Highways Agency, Scottish Development Department, National Assembly for Wales and De-partment for Regional Development, Northern Ireland. Design Manual for Roads and Bridges. The Stationery Office, London.
Highways Agency, SETRA, TRL and LCPC (1999). Post-tensioned concrete bridges. Anglo-French liaison report. Thomas Telford, London.
HM Treasury (2001). National Asset Register. CM No. 5221. The Stationery Office, London. Hover, K.C. (1996) “Reliability-based optimum design of reinforced concrete girders”, Structural
Safety, Vol. 18, No.s 2-3, 1996, pp. 239-258.
Hudson W R, Haas R and Uddin W (1997). Infrastructure Management. McGraw-Hill Inc. Institution of Structural Engineers (1989), Soil-Structure interaction, the real behaviour of structures,
March, Published by the Institution of Structural Engineers, London. International Organization for Standardization (1998). ISO 12491: Statistical methods for quality con-
trol of building materials and components. International Organization for Standardization, Geneva. International Organization for Standardization (1998). ISO 2394: General Principles on Reliability for
Structures, Second edition. International Organization for Standardization, Geneva. International Organization for Standardization (1999). ISO/CD 13822: Basis for Design of Struc-
tures – Assessment of Existing Structures. International Organization for Standardization, Geneva.
ISIS Canada (undated). Taylor Bridge, Manitoba. Informative material on website (www.isiscanada.com).
COST 345 Final Report
156
Jacob, B. (1998), “Applications of Weigh-in-motion Data to Fatigue of Road Bridges”, in Pre-proceedings of the 2nd European Conference on Weigh-In-Motion, eds. E.J. OBrien & B. Jacob, Lisbon, Portugal, pp. 219-230.
James J G (1972). Quantities and prices in new road construction, 1969. A brief analysis of 60 successful tenders. Laboratory Report LR513. TRL Limited, Crowthorne.
Johnson P E and Card G B (1998). The use of soil nails for the construction and repair of retaining walls. TRL Report 373. TRL Limited, Crowthorne, UK.
Johnson, J.W. (1928) “Relationships between Strength and Elasticity of Concrete in Tension and Compression”, Bulletin 90, Engineering Experimental Station, Iowa State College, Ames, Iowa, May.
Joint Committee on Structural Safety JCSS (2000) “Probabilistic Evaluation of Existing Structures”, RILEM Publications S.A.R.L.
Joint Committee on Structural Safety JCSS (2001), Probabilistic Model Code, Joint Committee on Structural Safety, Internet publication, www.jcss.ethz.ch.
Julian O.G. (1955) “Discussion of Strength Variations in Ready-Mixed Concrete by A.E. Cum-mings”, Proceedings of the American Concrete Institute, Vol. 63, No. 9, Sept., pp.772-4-772-8.
Julian O.G. (1957), “Synopsis of First Progress Report of Committee on Factors of Safety, Jour-nal of the Structural Division, ASCE, Vol. 83, No. ST4, Proceedings Paper 1216, July, pp.1316-1 to 1316-22.
Kai-Yung, L. & Frangopol, D.M (1995) “Reliability analysis for highway bridge deck assessment”, Structural Safety, Vol. 17, No. 3, October 1995, pp. 135-150, Abstract | Journal Format-PDF (767 K)
Kennedy, D.J.L. & Baker K.A. (1983) “Resistance factors for steel highway bridges”, Canadian Journal of Civil Engineering, Vol 11. pp 324-334.
Kerksen-Bradley, M. & Rackwitz, R. (1991), “Stochastic modelling of material properties and quality control”, JCCS Working Document, IABSE publication, March.
Komlos, K. (1970), “Comments on the Long Term Tensile Strength of Plain Concrete” Magazine of Concrete Research, Vol. 22, No. 73, Dec., pp.232-238.
Leendertse W and Oud H J C (1989). The Dutch experience with construction and repair of marine structures. Proc Ben Gerwick Symposium on International experience with durability of concrete in the marine environment, University of California at Berkley, pp147-156.
Liebenberg, A.C. (1992), “Concrete Bridges: Design and Construction”, Longman Group UK Limited. Madsen, H.O. & Bazant, Z.P. (1983) “Uncertainty analysis of creep and shrinkage effects in con-
crete structures”, ACI Journal, 80 2, 116-127. Madsen, H.O., Krenk, S. & Lind, N.C.: Methods of Structural Safety, Prentice-Hall, Englewood
Cliffs, 1987 Malhorta V.M. (1969), “Relations between Splitting-Tensile and Compressive Strength of Con-
crete”, Engineering Journal, Vol. 52, No. 5, May, pp.11-17.
Mallett G P (1994). TRL State of the Art Review: Repair of concrete bridges. HMSO, London, UK.
Mallett, G.P. (1994), State-of-the-Art Review, Repair of Concrete Bridges, Thomas Telford. Melchers, R.E. (1999), Structural Reliability Analysis and Prediction, 2nd ed., J. Wiley & Sons, Chiches-
ter
COST 345 Final Report
157
Melville B W and Coleman S E (2000). Bridge scour. Water Resources Publications, Colorado, USA.
Mičić, T.V., Chryssanthopoulos, M. K. & Baker, M. J. (1995) “Reliability analysis for highway bridge deck assessment”, Structural Safety, Vol. 17, No. 3, October 1995, pp. 135-150
Mičić, T.V.; Chryssanthopoulos, M.K. & Baker, M.J. (1994) “Reliability-based bridge design and life cycle management with Markov decision processes”, Structural Safety, Vol. 16, No. 1-2, Octo-ber 1994, pp. 111-132
Mirza, S.A. & MacGregor, J.G. (1979a) “Variability of mechanical properties of reinforcing bars”, Journal of the Structural division, Vol.105, No. ST5, May, pp.921-937.
Mirza, S.A., Hatzinikolas, M. & MacGregor, J.G. (1979b) “Statistical descriptions of strength of concrete”, Journal of the Structural division, Vol.105, No. ST6, June, pp.1021-1037.
Moses, F. (1979), "Weigh-in-motion System Using Instrumented Bridges", Transportation Engineer-ing Journal, ASCE, Vol. 105, TE3, pp. 223-249.
Moses, F. & Verma, D. (1987). Load Capacity Evaluation of Existing Bridges. National Cooperative Highway Research Program (NCHRP) Report 301. Washington DC.
MSC/NASTRAN for Windows (1997), Basic Dynamic Analysis User’s Guide Version 69, The MacNeal-Schwendler Corporation, USA.
Narasimhan S and Wallbank E J (1999). Bridge inspections – current thinking and regimes. 8th International conference on extending the life of bridges, civil and building structures, July 1999. Engineering Technics Press.
Neville, A.M. (1997) “Properties of Concrete”, fourth edition, John Wiley and Sons, New York, USA.
Newhook J, Mufti A, Bakht B and Tadros G (2001). Application of steel-free concrete deck slabs to rehabilitation projects. Proc Conf on Repairing the Buildings and Bridges of the Americas, April 2001. ASCE.
Nielsen, M.P. (1984), Limit Analysis and Concrete Plasticity, Prentice Hall. Nordic Committee on Building Regulations: Guidelines for Loading and Safety Regulations for Structural
Design, NKB Report No. 36, November 1978 Nordic Committee on Building Regulations: Guidelines for Loading and Safety Regulations for Structural
Design, NKB Report No. 55, June 1987 Nowak, A.S. & Szerszen, M.M. (1998) “Fatigue of existing reinforced concrete bridge deck
slabs”, Engineering Structures, Vol. 20, No. 11, November, pp. 991-998. Nowak, A.S., Yamani, A.S. & Tabsh S.W. (1994) “Probabilistic models for resistance of concrete
ing, Trinity College Dublin, Ireland. O’Connor, A.J., 2001, “Probabilistic Traffic Load Modelling for Highway Bridges”, PhD thesis, Depart-
ment of Civil Engineering, Trinity College Dublin. O’Connor, A.J., Jacob B. & O’Brien, E.J. (1998), "Effects of traffic loads on Road Bridges- Pre-
liminary studies for the Re-assessment of the traffic load model for Eurocode 1, Part 3", Pre-Proceedings of the second European Conference on Transport Research, Eds. E.J. O’Brien and B. Jacob, pp. 231-242
COST 345 Final Report
158
O’Reilly M P (2000). Research on masonry faced retaining walls: using pointing and grouting for their repair. TRL Unpublished Project Report PR/IS/95/00. TRL Limited, Crowthorne, UK.
O’Reilly M P, Bush D I, Brady K C and Powrie W (1999). The stability of drystone retaining walls on highways. Proc Instn Civ Engrs Mun Engr, Vol 133, June, pp101-107.
OECD (1992). Bridge management. OECD Road Transport Research, Paris. ISBN 92-64-13617-7.
OECD (1994). Road maintenance and rehabilitation: funding and allocation strategies. Road Transport Research, Organisation for Economic Co-operation and Development, Paris.
OECD (1997). Performance indicators for the road sector. Road Transport Research. Organisation for Economic Co-operation and Development, Paris.
Orr, D.M.F. (1960), “Deformation and Strength of Concrete Cylinders in Tension,” Civil Engineer-ing Transactions, Institution of Engineers, Australia, Vol. CE12, No.1, April, pp.26-29.
Page J (1996). A guide to repair and strengthening of masonry arch highway bridges. TRL Report 204. TRL Limited, Crowthorne, UK.
Pearson S and Patel R G (2002). Repair of concrete in highway bridges – a practical guide. TRL Application Guide 43. TRL Limited, Crowthorne, UK.
Petersons N. (1968), “Should Standard Cube Test Specimens Be Replaced by Test Specimens Taken from Structures”, Matériaux et Constructions, Réunion Internationale des Laboratoires d’Essai et de Recherche sur les Matériaux et les Constructions, Paris, France, Vol. 1, No.5, pp.425-435 (in French).
PIARC - World Road Association (2000), Reliability Based Assessment of Highway Bridges, PIARC Report of Committee C11-Road Bridges. PIARC Paris.
PIARC - World Road Association (2002). Use of innovating materials for bridge construction and repair. PIARC – World Road Association, La Defense, France.
Potts, D.M. (1992), ‘The analysis of earth-retaining structures’, in Proceedings of the conference Retain-ing Structures, Thomas Telford Services Ltd, Cambridge, pp. 167-186.
Pritchard B P and Smith A J (1991). Investigation of methods of achieving continuity in composite concrete bridge decks. TRL Contractor Report 247. TRL Limited, Crowthorne, UK
Queiroz C, Haas R and Cai Y (1994). National economic development and prosperity related to paved road infrastructure. Transportation Research Record 1455. Transportation Research Board, National Research Council, Washington D C. pp147-152.
Quilligan, M., Karoumi, R. & OBrien, E.J. (2002), Development and Testing of a 2-Dimensional Multi-Vehicle Bridge-WIM Algorithm”, Third International Conference on Weigh-in-motion (ICWIM3), Eds. B. Jacob, B. McCall & E. OBrien, Orlando, May, pp. 199-208.
Rackwitz R. (1983), “Predictive distribution of strength under control”, Materials and Structures, 16, 94, pp. 259-267.
Rackwitz, R. (1996), “Static properties of reinforced steel”, Working notes, JCCS Probabilistic Model Code, Part 3: Resistance models, Second Draft.
Ramesh C.K. & Chopra S.K. (1960), “Determination of Tensile Strength of Concrete and Mor-tar by the Split Test,” Indian Concrete Journal, Vol. 34, No.9 September, pp.354-357.
Royal Society (1992). Risk: analysis, perception, and management. Report of a Royal Society Study Group. The Royal Society, London.
Rüsch H., Sell. R. & Rackwitz R. (1969), “Statistical Analysis of Concrete Strength” Deutscher Ausschuss für Stahlbeton, Heft 206, Berlin, Germany, (in German).
COST 345 Final Report
159
Ryall M J, Parke G A R and Harding J E (2000). Manual of bridge engineering. The Institution of Civil Engineers, Thomas Telford, London, UK.
SAMARIS D30 (2006), Guidance for the optimal assessment of highway structures, European Commission DG TREN 6th Framework Programme, Final report of WP 15, samaris.zag.si.
Sarveswaran, V. & Roberts M.B. (1999), “Fatigue reliability of steel bridges”, Journal of Construc-tional Steel Research, Vol. 52, No. 1, October, pp. 83-92
Schläfli, M. & Brühwiler, E. (1998) “Reliability during temporary erection phases”, Engineering Structures, Vol. 20, No. 11, November, pp. 999-1003.
Schneider, J. (1997), Introduction to Safety and Reliability of Structures, IABSE Structural Engineering Documents, No. 5, Zurich.
Sexsmith, R.G. (1998), “Assessment of the reliability profiles for concrete bridges”, Engineering Structures, Vol. 20, No. 11, November 1998, pp. 1004-1009
Shalon R. & Reintz R.C. (1955), “Interpretation of Strengths Distribution Factor in Quality Con-trol of Concrete” Proceedings of the Reunion Internationale des Laboratories d’Essais et de Recherches sur les Materiaux et les Constructions, Symposium on the Observation of Substructures, Vol. 2, Labo-ratorio Naciano de Engenharia Civil, Lisbon, Portugal, pp.100-116.
Sivasundaram, V., Carette, G.G. & Malhorta, V.M., (1989), “Mechanical Properties, Creep and Re-sistance to Diffusion of Chloride Ions of Concretes Incorporating High Vol. of ASTM Class F Fly Ash from Different Sources”, MSL Division Report 89-126(J), Energy, Mines and Resources Canada, Ottawa, Ontario, Canada.
Sivasundaram, V., Carette, G.G. & Malhorta, V.M., (1989b), “Properties of Concrete Incorporat-ing Low Quantities of Cement and High Vol.s of Low Calcium Fly Ash”, ACI SP-114, Vol. 1, ed. V.M. Malhorta, American Concrete Institute, Farmington Hills, Michigan, USA.
STEP (1995). Timber engineering STEP1 and 2 (Eds. HJ Blass, P Aune, BS Choo, R Görlacher, DR Griffiths, BO Hilson, P Racher, G Steck). Centrum Hout, Almere, The Netherlands.
Stewart M. & Val, D. (1998), “Influence of proof loading and prior service loading on the reli-ability and assessment of existing bridges”, University of New Castle Research Report ISBN 07259 10348 Australia.
Stewart M.G. & Rosowsky, D.V. (1997), “Bridge fatigue damage evaluation and updating using non-destructive inspections”, International Journal of Fatigue, Vol. 19, No. 8-9, 10 September, p. 664.
Stewart, M.G. (1995), “Workmanship and its influence on probabilistic models of concrete com-pressive strength”, ACI Journal, Vol. 92, No. 4, July-August.
Szerszen, M.M., Nowak, A.S. & Laman, J.A. (1999), “Reliability-based condition assessment of deteriorating concrete bridges considering load redistribution”, Structural Safety, Volume 21, No. 2, June, pp. 159-195.
Tabsh, S.W. & Nowak, A.S. (1991), “Reliability of highway girder bridges”, Journal of Structural Engineering 117, No. 8, pp. 2373-2388.
Thoft-Christensen, P. & Baker, M.J. (1982), Structural Reliability Theory and its Applications, Springer, Berlin.
Thoft-Christensen, P. (1998), “Effect of reinforcement corrosion on reliability of highway bridges”, Engineering Structures, Vol. 20, No. 11, November, pp. 1010-1019.
Tilly G, Frost A and Wallsgrove J (2002). Conservation of Bridges. Spon Press, London.
Tunnels and Tunnelling International (2001). St Gotthard fire closes tunnel. November, p6.
COST 345 Final Report
160
Turkstra, C.J. & Madsen, H.O. (1980), “Load combinations in codified structural design”, Journal Structural Division ASCE, 106, ST. 12, pp. 2527 - 2543.
United Nations Economic Commission for Europe (UNECE) (2000). Recommendations of the group of experts on safety in road tunnels – final report. Trans/AC.7/9.
Vassie P R (1984). Reinforcement corrosion and the durability of concrete bridges. Proceedings of the Institution of Civil Engineers, Part 1, 76. Institution of Civil Engineers, London, UK.
Vu, K.A.T. & Stewart, M.G. (2000), “Structural reliability of concrete bridges including improved chloride-induced corrosion models”, Structural Safety, Vol. 22, No. 4, 2000, pp. 313-333.
Walker P J, Morel J C and Villemus B (2000). Outline of dry-stone retaining wall construction in Britain and France. Proc 12th International Brick/Block Masonry Conference, June 2000, Madrid.
Wallbank J (1989). The performance of concrete bridges. A survey of 200 highway bridges. HMSO, London.
Wallbank J, Tailor P and Vassie P R (1998). Strategic planning of future structures’ maintenance needs. Proc Management of Highway Structures (Editor Das P C). Thomas Telford, London.
WAVE "Weigh-in-motion of Axles and Vehicles for Europe" (2001), Work Package 1.2 - Bridge WIM systems (B-WIM), Editors: E. O'Brien, A. Žnidarič, University College Dublin.
WAVE "Weigh-in-motion of Axles and Vehicles for Europe" (2002), General Report, Laboratoire Central des Ponts et Chaussées, April.
Wiss, Janney & Elstner (1973), “Final Report on Bar Tests”, Committee of Concrete Reinforcing Bar Producers and American Iron and Steel Institute, Vol. 70, No.1, Jan, pp.31-35.
Woodward, R. & Bevc, L. (2003), COST 345 WG 2/3 report, http://cost345.zag.si/. Woodward, R.J. (1999), “Development of models (Loads and Strength)”, BRIME PL97-2220, De-
liverable D5. October. Woodward, R.J. (1999), “Experimental assessment methods and use of reliability techniques”,
BRIME PL97-2220, Deliverable D6. October 1999.
World Bank (1994). World development report 1994. Infrastructure for Development. Oxford University Press.
Wright, P.J.F. (1955), “Comments on an Indirect Tensile Test on Concrete Cylinders,” Magazine of Concrete Research, Vol.7, No. 20, July, pp.87-96.
Zhao, Z. & Haldar, A. (1996), “Reliability updating of welded joints damaged by fatigue”, Interna-tional Journal of Fatigue, Vol. 18, No. 8, November 1996, pp. 567-575.
Zhao, Z. & Haldar, A. (1996a), “Special problems in evaluating the safety of concrete bridges and concrete bridge components”, Construction and Building Materials, Vol. 10, No. 1, February 1996, pp. 39-43.
Žnidarič, A. & Baumgärtner, W. (1998), "Bridge Weigh-in-motion Systems - An Overview", Pre-Proceedings of the 2nd European Conference on Weigh-in-Motion, eds. E.J. OBrien & B. Jacob, Euro-pean Commission, Luxembourg, pp. 139-151.
Žnidarič, A. & Moses, F. (1997), Structural Safety of Existing Road Bridges. 7th International Confer-ence on Structural Safety and Reliability ICOSSAR '97, Kyoto, pp.1843-1850.
Zongwei, T., Corotis, R., Ellis, B. & Hugh, J. (1994), “System reliability and redundancy in struc-tural design and evaluation”, Structural Safety, Vol. 16, No. 1-2, October, pp. 47-71.
Annex I
161
Annex I Asset management
I.1 ROLE
An asset management system should form the centrepiece of a business plan or operating strat-egy for a highway authority as it can provide a means of: • determining the value of a network or parts of one, such as the stock of structures; • assessing the condition of the network and its rate of deterioration; • determining the expenditure needed to maintain the capability and value of the network; • prioritising actions and expenditure to maintain or improve the network; • supporting and formalising proposals for funding maintenance and improvements; • evaluating the risks associated with particular parts of the network and, from this, determin-
ing actions to mitigate such risks; • assessing performance against targeted values; and • developing policies and budgets for the operation and expansion of the network.
Assessing performance involves the following: • safety, such as an accident rate; • operational efficiency; • reliability and availability of service; • meeting statutory and regulatory obligations, including development, health and social issues; • economy in operation, such as a return on investment; • maintaining asset value; • sustainability; • environmental impact; and • customer, employee and shareholder/stakeholder satisfaction.
Targets for individual requirements would usually be stated in a business plan. A performance as-sessment might be required by various levels of government (such as by the EU with regard to Trans-European Road Network) or a private company (to satisfy internal requirements).
The complexity of an asset management system for a highway network depends on the types, number, and condition of the fixed assets along the network but, clearly, it can be complex. It is important that a highway organisation is encouraged, and able, to follow sound engineering and environmental practices. Their operations should not be circumscribed by inappropriate account-ing practices, and, on the other hand, resources should not be wasted on unnecessary or over-elaborate engineering works.
Although detailed discussion of these issues falls outside the remit of COST 345, some are touched upon below.
The use of asset management systems can be expected to increase as more highway owners and operators have to squeeze the maximum out of existing networks - and are able to show that they are doing so. Given that owners and operators face the same challenges in developing such sys-tems, it would seem worthwhile considering the development of a basic generic model for use across Europe. This model should include the best and essential features of existing systems.
Annex I
162
I.2 MANAGEMENT CYCLE
I.2.1 Basis
As shown in Figure 2-1, a management system largely comprises repetitive cycles of inspection and assessment, with occasional interventions for remedial measures. The time scale of the cycles and the type of inspection and assessment vary with the type of structure, and also for a particu-lar structure. For example, a special inspection might follow an unusual event, such as a flood or the passage of an exceptional load. According to the operational set-up, routine maintenance might be linked to the inspection cycle or it might be independent of it. Some form of numerical analysis is usually required to design repair and improvement works, and also for justifying de-commissioning and renewal works. Most of the above can be reasonably well standardised, in codes of practice for example.
I.2.2 Data collection, collation and feedback
The cycle generates regular reports from inspections and assessments, and occasional reports from repair and maintenance works. Such reports should form part of an ordered, continuously accumulated database. As-built drawings must form the foundation of this database, but these are not available for many old structures and this might influence the details of an inspection. The sheer size and complexity of the database can generate handling problems. Thus the various forms, the procedures for completing them and the decision-making processes should be simple, transparent and standardised. For practicality in the storage, retrieval and transfer of information, it would seem necessary for the database to be held in an electronic format. Where necessary, photographic records should be included in inspection reports.
Data should not be degraded or lost with the transfer of management or maintenance responsi-bility from one organisation to another. This is particularly important where the data can affect the safe or efficient operation of a facility or section of highway; for example, plant maintenance safety audits and records of hazardous incidents.
The information feedback loops regenerate the cycle and their importance should not be under-estimated. For example:
1. The results of an inspection or assessment can determine the frequency and detail of fur-ther inspections and assessments to (a) gather information on the rate of deterioration (b) determine the timing of remedial works, and (c) check the performance of remedial works.
2. Expenditure patterns can help identify ‘troublesome’ structural forms and details. This might prompt research into new techniques and materials and lead to changes in design standards and construction practices.
3. Information on the condition of the highway network is required to assess its value and rate of deterioration, and can be used to help set priorities for major renovation and im-provement works.
The effectiveness of an asset management system is governed by its weakest link: errors cannot be reversed by decisions or actions taken further down the chain. For example; • misinformation about the form of construction or type of material can lead to an inappro-
priate inspection procedure – this is particularly relevant to ageing structures where design and construction records are incomplete or missing altogether;
• failure to identify a problem in an inspection cannot be rectified by the subsequent condition assessment or structural analysis; and
Annex I
163
• misdiagnosis of a problem cannot be compensated, other than by good fortune, by repair works no matter how well such works are completed.
I.3 ASSET VALUE
The value of a highway network is made up of its fixed assets and the service it provides. The former might be measured in terms of the replacement value or cost. It is difficult to assess the value of a network in terms of the level of service it provides, and will provide in the future, but it could be based on actual or notional income. In the short-term, the two components are not inextricably linked. For example, the condition of part of a highway network might be allowed to deteriorate (so that the value of the fixed assets reduces) to maintain service: repairs might be de-layed pending the construction of a by-pass so that the works would be less disruptive.
The political and economic relations between the owner of a highway network and its operator will influence the procedures used to define the asset value of the network. Nonetheless, the use of asset value as a performance indicator could be expected to increase as owners look for a means of imposing commercial accounting procedures and competition into the operation of a highway network. Given the considerable value of a highway network, the sums of money spent on its upkeep and its required longevity, the introduction of such a performance indicator re-quires careful consideration and proving trials. The use of an independent expert body, well versed in engineering practice, should be considered when assessing the performance of a high-way organisation.
I.3.1 Asset value as a measure of performance
The use of asset value as an apparently simple means of measuring performance is attractive, but there are several factors that affect asset value and which are outside the control of owners and operators: indeed some are beyond the control of governments.
Firstly, the activities of highway authorities and agents are constrained by law and custom, which affect their working practices and expenditure. For example, the use of a single method of pro-curement, favoured or imposed by government, might not be the most efficient in all circum-stances: innovation can be stifled by the adoption of design-and-build contracts, and short fixed-term contracts might not be the most efficient for dealing with chronic maintenance problems or for ensuring continuity.
Another controlling factor is funding. Expenditure on a highway network might be driven by po-litical or public demands rather than engineering requirements. The former might affect the pri-ority for construction works in a particular constituency, and also limit annual expenditure such that operating efficiency cannot be optimised. Maintenance and replacement works might be postponed to fit spending limits fixed by Government. The competition for funding new works (to improve service) and remedial works (to maintain or upgrade the existing system) can also lead to conflict: there might be pressure to ‘mend-and-make-do’, when the best option is re-placement. The choice of whether to replace or repair an existing bridge affects the level of ser-vice, future maintenance expenditure and the level of traffic disruption on the network.
Other factors that affect the estimation of asset value include:
1. Uncertainties in the assessment of in-service condition, safety and rate of deterioration.
2. Changes in the ownership of the infrastructure or the agency responsible for its upkeep.
3. Variations in service conditions, such as traffic loading and climate change.
Annex I
164
4. Changes in the extent and complexity of a highway network, through the construction of new sections of road and the widening of existing ones.
5. Economic factors such as the rate of inflation, labour and material costs, and oil prices.
The problems might be formidable but they must be dealt with to provide a means of determin-ing asset value where it is to be used to assess (a) the operating efficiency and trading position of a highway organisation, and (b) the return on an investment in a highway network. An inappro-priate system of assessing value could be a bureaucratic nightmare and wasteful of resources. Further discussion is, however, outside the remit of this report.
I.4 NET PRESENT VALUE
To assess the effect of future expenditure and income it is necessary to relate these to a common time: this is usually done through the definition of the net present value (NPV). Such a calcula-tion requires a value for the investment and a discount rate. Because of the relatively long design life of most highway structures, future expenditure (on maintenance for example) and income (from notional or actual service charges) are both particularly sensitive to the assumed discount rate. The results of calculations using even relatively modest discount rates seem to show that it is better to delay expenditure as long as possible. That is, it is better to spend money on remedial works (or even replacement) than on building durable structures in the first place. It is difficult to counter the argument that investment in highways should be treated as any other business, but the approach described above has a number of obvious objections. For example it assumes that sufficient resources will be available at some time in the future to complete the delayed repair works. It also flies in the face of sustainability: because more resources are consumed it places a burden on future generations for development today. It could be argued from this basis that the maximum discount rate should be no more than zero. A lower rate than required for industrial or commercial investment might also be justified in view of the fact that highways provide a public service, and are supposed to do so for a particularly long-time.
I.5 WHOLE LIFE COSTING
Despite the inherent problems mentioned earlier, the total cost of building, repairing and main-taining a section of highway over its intended service life (its whole life cost) could be calculated and compared to the benefits (notional income) gained by its construction - for example a reduc-tion in the number of accidents. Whole life cost models are commonly used in industry and have been developed for particular types of structure such as bridges, tunnels and rock slopes.
The same type of investment analysis used to justify the construction of a new highway could be adopted to compare the costs and benefits of various options for repairing a particular highway structure. The effect of the discount rate might not dominate where the various repair options have much the same effective life. But assumptions about the rate of deterioration and residual life can be overturned by the development of new materials and construction techniques and also by changes in the service conditions and the required level of service. It is also necessary to take account of the fact that the failure of any one structure, such as a bridge, might lead to the loss of use of other structures along a route.
The reliability of a whole life cost model is ultimately dependent upon the input data, but often there is a paucity of data on the rate of degradation and the effectiveness of various remedial measures.
Annex I
165
I.5.1 The need for case studies
Methods for assessing the rate of degradation can be derived from the results of laboratory tests, but it is difficult to take account of different in-service conditions. Thus, as found by WG6, there is a need for well-documented case studies that: • describe the design approach and construction method used; • provide details of the costs of the site works; and • assess the level of success of the site works.
Many case studies describe the problem and the remedial works, but perhaps for commercial rea-sons, do not provide detailed information on costs. Thus it is difficult to judge the cost-effectiveness of different repair options.
Long-term site studies might be neglected because they (a) require continuity of staff (b) require the use of instrumentation, and (c) apparently provide little or no return on investment in the short-term.
As stated earlier, the results of a continuous series of inspection reports could be used to assess the rate of deterioration of particular structural elements or repaired areas. However, at present, it would seem that this source of information is not exploited fully. For little extra cost, the data pro-vided in such reports could be used to substantiate assumptions made in whole life cost models.
I.5.2 Design life
Design life can be defined in various ways, such as the time to the first substantial refurbishment works, but no matter how it is defined it affects the design values of live loads, such as wind, and the expected loss in performance of components that degrade with time, such as through fatigue and corrosion. Design life might best be viewed as a nominal period that defines a performance requirement, such as the return period for live loads. It should be as much concerned (if not more so) with durability, than with determining extreme load events for assessing the level of safety. It will be appreciated that structural failures are rare compared to the incidence of material degradation, and that the former might be triggered by the latter.
The design life of highway structures across Europe varies from State to State, but the introduc-tion of the suite of structural Eurocodes might standardise design life at 100 years. It might be difficult, administratively, to vary from the value specified in a standard or code, but it could be varied to: optimise cost-efficiency in construction and maintenance, through whole life costing; anticipate future requirements, such as widening works; and suit the probability and conse-quences of failure. For example, the construction of a highway tunnel or bridge in an urban area will lead to the development of other infrastructure that will severely restrict the options for con-structing a new adjacent parallel route should such a structure become unserviceable. On the other hand, a short span bridge in a rural area might be replaced with little disruption to the traf-fic. It would, therefore, seem sensible to adopt a much higher design life, and more demanding durability requirements, for the former than the latter.
Other issues to consider are:
1. Some masonry bridges and retaining walls have exceeded the current design life and con-tinue to provide perfectly adequate service, but more modern structures are being replaced. The durability of reinforced concrete bridges seems to vary according to the vintage of the design code or standard, the quality of the construction materials, and the effectiveness of inspection procedures - all of which have changed over the years.
Annex I
166
2. Changes in climate might overturn current assumptions on the return periods for wind loading, high intensity rainfall events, and the use of de-icing salts.
3. The durability and strength of some types of highway structure could be substantially im-proved at relatively low cost at the construction stage, whereas the cost of upgrading an ex-isting structure can be a significant proportion of its initial construction costs.
4. Remedial works might be designed to a particular design life, but just what value to take is open to question.
5. The operational life of most highways is not limited by the life (nominal or actual) of the structures along it because, in most cases, these can be replaced. The concept of the ‘life’ of a transport route might be useful when assessing asset value, whole life costs, risks to the operation of the highway network, and forward investment and planning strategies.
6. The influence of design life on the acceptable level of probability of failure.
I.6 RISK
Risk can be defined in various ways, such as the combination of the likelihood of a hazard (fail-ure state) occurring and the consequences of its occurrence: these include financial, safety and political issues. It might be expressed mathematically as the product of the probability of occur-rence and the economic cost of occurrence; see Royal Society (1992). Formalised systems are be-coming more commonly used for assessing the impact of industry and construction on the envi-ronment - see, for example, DETR (2000).
Standardising the process can help qualify or quantify both engineering judgement and uncertain-ties, and thereby aid decision-making. However, standard procedure is merely a tool and not a re-placement for engineering judgement. Many different methods are used to assess and manage risks, ranging from detailed probabilistic methods to observational ones. Where there is consider-able uncertainty in quantifying the likelihood and consequences of a hazard it would be inappro-priate to express risk in absolute terms: a qualitative appraisal is sufficient in such cases. Some of the literature distinguishes between a risk analysis (a quantitative, probabilistic-based approach) and a risk assessment (a qualitative approach): however, for brevity, herein risk assessment is used to cover both.
Whatever approach is used, it should be clear and concise and be appropriate to the job at hand: specifiers and users should be aware of the twin perils of over elaboration and delusions of accu-racy. Account should also be taken of the fact that the perception of engineers and society at large might be quite different.
Of particular importance is how risk is shared between an owner or agent and a third party en-gaged to undertake inspections and assessments. The issues to be considered here include: • the financial and professional liabilities of all concerned; • the reliability of the methods used to define and assess safety and serviceability; and • the minimum levels of safety and serviceability deemed appropriate; these might vary with
society at large and also with time.
There is a price to pay for shifting risk from an owner or agent to a third party: freedom from risk is costly. An over-cautious approach will be expensive to follow, and it will probably leave owners with in-service structures that, according to their own system, are sub-standard. On the other hand, a non-conservative approach will be accompanied by the failure of structures in ser-
Annex I
167
vice. Getting the balance right is difficult, but an asset management system should help rather than inconvenience its owner.
I.6.1 Cycle
An asset management cycle is driven by considerations of risk, even though the various risks might not be quantified particularly well, if at all. For example, the frequency and detail of an in-spection should be set to ensure that a dangerous deterioration in condition will not occur be-tween successive inspections. Similarly, remedial works should be scheduled to ensure that the condition of a structure does not reach a dangerous state. The results of a risk analysis can be used to assign priorities to renewal and remedial works for a particular structure or between dif-ferent structures.
The sequence of an analysis could be expressed in line with the management cycle.
1. Quantification of size and value of the asset (e.g. a structure or series of structures.
2. Identification of operational hazards as related to the prescribed performance criteria and condition of the asset. In most cases, risk objectives can be derived from the stated per-formance criteria of the asset. The events or hazards that might prevent these criteria from being met can be identified: these might be described by the various limit modes of failure considered at the design stage.
3. Assessment of the likelihood of failure. This might be judged by experience of similar structures (age, size and environment), by assigning a condition or failure grade (based on well-defined categories), or from a calculated level of safety, perhaps derived using statisti-cal methods. Performance or condition might, therefore, be expressed qualitatively or quantitatively. For consistency, and to eliminate bias, a qualitative assessment must be based on well-defined categories. The appropriate method depends on the type and detail of the data used to define the probability or consequences of the hazard, or both of these, and on whether or not more than one hazard is being considered at a time.
4. Determination of the consequences of failure. In many cases this can be graded according to pre-determined criteria: for example using the simple matrix arrangement shown in Fig-ure I-1. Mathematical modelling might be required in more complex cases. It might be ad-vantageous to formalise the process so that a reasonably consistent approach is adopted for different types of structure along a section of highway.
5. Implementation. Having defined the risks, it is necessary to decide what remedial works if any are required and when they should be undertaken. This requires consideration of the residual life and standard of service of the asset, whether or not remedial works are under-taken, and the residual risk associated with the treated asset. Although the design of the remedial works might be straightforward, it can be difficult to decide when such works should be carried out. The consequences of failure, budget restraints, ease of access, weather, the current condition and the rate of deterioration might all affect the timing of the works. For economy, it might be necessary to postpone renewal or repair works for as long as is practicable; in such cases monitoring the condition of the structure might help pinpoint the best time for such works. But where the consequences of failure are high it might be necessary to install instrumentation and have detailed contingency plans in place.
6. Review of the action taken. For example, where remedial works have been postponed this will involve further inspections and appraisals of the condition of the structure, and where works have been undertaken, it should involve inspections of the repaired sites. Unfortu-nately, this stage is often overlooked.
Annex I
168
Probability of hazard occurring
Low Medium High Low
(i.e. no risk to peo-ple or property)
Negligible risk Routine inspection
Low risk Routine inspection
Medium risk Increased frequency and/or detail of in-
spection Medium
(i.e. minimal risk to people, but high
cost of disruption)
Medium risk Routine inspection
Medium risk Increased frequency and/or detail of in-
spection
High risk Assessment required
Con
seq
uen
ce
High (i.e. high risk to
people or property, and high costs of repair or disrup-
tion)
Medium risk Routine inspection
High risk Assessment re-
quired
Unacceptable risk Assessment and miti-
gation required
Figure I-1 Simple qualitative risk analysis
I.6.2 Strategic and tactical level assessments
Risk assessments can be undertaken at a strategic level for a particular highway (or a substantial length of one), or at a tactical level for a particular structure.
At a strategic level the systematic application of a structured approach can provide a risk register or risk profile for a highway network. This will log the risks (that is, the probability and conse-quences of the hazards) and the options for mitigating or eliminating the risk (in terms of costs for example). It is necessary to define the residual risk for each mitigation option. A tactical level analysis will contain much the same information but the data will be site- or structure-specific and likely to be more detailed. A tactical analysis need not be undertaken for all structures, just those identified as posing a high risk. Some sort of risk analysis could be undertaken as part of the routine programme of inspection and assessment.
A tactical level assessment can be used to establish a risk register for a particular highway struc-ture, whilst a strategic level assessment can provide a register for a series of structures or a high-way network (other terms, such as risk profiles and catalogues, are also used).
I.6.3 Risk register
A risk register can be used to: • quantify the current level of risk for a particular structure, or network; • identify common or chronic hazards and risks; • determine future inspection and assessment requirements; • prioritise remedial works; and • set maintenance budgets.
It should be updated as: • information is obtained from inspections and assessments;
Annex I
169
• new hazards are identified, such as a previously unrecorded or undetected failure mode; • there is a change in the probability of a hazard occurring; • there is a change in the consequences of a particular hazard occurring; • the required performance criteria of the asset(s) change; and • remedial works are implemented.
Some of the data required to derive and update a register can be obtained from routine inspec-tions and assessments. On some occasions, a series of special inspections has followed the failure of a particular structure. It is, therefore, necessary to continually review the reliability of the suite of documents covering the design, construction and maintenance of highway structures in the light of in-service experience, particularly ‘failures’ of structures, materials and components.
Clearly, it is essential that particular construction features or components can be identified from the inventory of structures. (Much as a manufacturer, or chain of suppliers, is able to recall a par-ticular model of vehicle following the discovery of safety hazard.) It would, therefore, seem rea-sonable for a risk register to form an integral part of the inventory of structures, or at least for them to be linked together in some way. For a particular structure this could be done through a ‘logbook’. In addition to providing information on the design, construction and maintenance of a structure, this could also identify potential hazards and failure modes, and appropriate identifi-cation, inspection and assessment procedures for them. It should consider the means by which the service and safety of the structure might be compromised; this should not be restricted to the limit states considered in design. In this way an inspection might be better directed to those fea-tures that could affect the use of the structure and the highway network. It is worth noting here that about 70% of bridge ‘failures’ occur because the failure mode had been overlooked in de-sign: see Schneider (1998).
I.7 BUSINESS CASE
It seems almost inevitable that there will be insufficient funds to satisfy all the demands for re-newal and remedial works for any substantial highway network. In this competitive world it is necessary for an owner or operators to prioritise expenditure. A risk assessment is an essential part of the business case or bid for renewal or repair funds. Cases can be worked up for stretches of a highway network or for individual structures. To satisfy the twin goals of economy and safety, the owners or their agents should ensure that the risk assessments undertaken for different parts of the infrastructure are reasonably compatible, because otherwise there is the danger that some elements of a network (such as the road pavements) will be unnecessarily upgraded whilst others (such as the bridge stock) will fall into disrepair.
The decision to proceed with remedial works might be simply based on the ratio of (a) the sum of the economic benefits expected to accrue from such works and the losses likely to be incurred if the works are not undertaken and (b) the cost of the works. However, not all the benefits and losses might be easily expressible in monetary terms, and there might be a conflict or trade-off between the benefits of construction and the negative impact of the works on the environment. Decisions might, therefore, be influenced by government or company policy.
I.8 RESEARCH AND DEVELOPMENT
It is prudent for governments and highway authorities to protect their long-term interests and in-vestments by investigating improvements in the upgrading and maintenance of a highway net-work. It should be clear from the foregoing that there is a need to continually assess and update
Annex I
170
information and procedures on the processes that constitute an asset management system. This will help ensure that the system is up to date, satisfies the desire for continuous improvement in operations, and accords with the current interest in sustainability.
I.8.1 Organisation
In many States, and within the EU, funds for highway research are available from several spon-sors and agencies with overlapping areas of interest. For example, within the UK, there are sev-eral agencies responsible for (a) various parts of the road network, (b) research and development (R&D), per se, and (c) promoting and developing industry. Various departments and divisions of these agencies have different clients, priorities and research needs. The dangers of this prolifera-tion and competition are: • a confusion of objectives; • the rejection of a bid on the grounds that it should be dealt with elsewhere; • that progress is piecemeal and faltering; • that low-profile, low-technology is rejected in favour of ‘big science’ and the newsworthy; • too narrowly-focused projects; and • an abundance of duplication - although some is, by itself, not necessarily a bad thing.
In an ideal world, the activities of all potential funding agencies for highway research would be dovetailed but, to satisfy the different interests and needs of those involved, in practice co-ordination would have to be a rather loose arrangement. No matter how it is organised, it is im-portant that a co-ordinating body does not just become another layer of bureaucracy.
What is acceptable, in terms of managing research and development (R&D), will vary according to national and local arrangements for managing the network, and for supporting industry and research bodies. The setting up of an overarching body, such as a Ministry or Department of Sci-ence and Research, with overall responsibility might not be acceptable in some States, particularly those where much of the public services have been privatised. Nonetheless, even in these cases, where the different classes of road are managed by different bodies, the management of a coher-ent R&D programme might fall within the remit of a regulatory body.
The role of EU organisations for co-ordinating R&D activities in transportation should be con-sidered. The benefits of such a review include: • ensuring sufficient funding is provided to maintain centres of excellence across the EU; • a reduction in bureaucracy and the turn-round time of projects; • enabling a group of States to contribute and exploit the results of particularly large projects
that could not be afforded by a single State; and • providing a means of disseminating good practice and technology across the EU - with the
likely eastward expansion of the EU this is particularly important.
All the above would help maintain and improve the competitiveness of the transport industries across the EU. Further discussion of how best to manage a programme of R&D falls outside the remit of this COST Action but, given the essential social and economic importance of transpor-tation, it is clear that government(s) must play a pivotal role.
I.8.2 Funding
What constitutes a sufficient level of R&D funding will vary according to the size and responsi-bilities of the highway organisation. Such a level might be pegged according to (a) the value or
Annex I
171
turnover of the ‘business’ or (b) a small percentage of a measure such as the asset value, current expenditure on new works, or annual maintenance expenditure. Because of the long lead-in time required for new construction forms and materials it might be better fixed as a percentage of the annual maintenance budget. What is clear is that left to their own devices private industry will not provide sufficient funds for a comprehensive coherent programme of R&D into public high-ways: that obligation, with all its opportunities and challenges, rests with the owners of the infra-structure.
Funds should be directed towards the development of novel construction forms and materials but, given that the annual expenditure on new works is small compared to the value of the exist-ing infrastructure, the lion’s share should be spent on (a) updating advice on design and detailing practice to ensure durability, (b) determining in-service conditions and performance, and (c) methods of rehabilitation and improvement. These three areas should be the mainstays of na-tional research programmes, but that has not always been the case.
I.8.3 Management
The difficulties of managing a programme of R&D should not be underestimated. Some of the essential requirements for an effective and productive programme are described below.
1. The client should have clear-sighted goals (both short- and long-term) and retain in-house expertise for assessing bids, managing what will be quite a disparate set of projects, and implementing the results of the work. The running of a highway network demands a multi-disciplinary approach and so it is important that R&D projects can be managed across ad-ministrative boundaries within an organisation.
2. An effective means of trawling for, submitting and assessing research bids from within the client’s organisation, and from industry and research contractors. Bid forms, and the like, should be clear and concise. It should be noted that the blanket use of a cost-benefit analy-sis would rule out speculative bids. Issuing target areas will help focus bids. New initiatives will emerge from time to time and can be accommodated within a portfolio of projects, but sudden shifts in priorities, to perhaps satisfy political needs, will generate confusion and inefficiency.
3. Because of the long design life of highway structures, and the even longer life of a highway network, it is essential to support long-term projects. This should not be compromised by an over-emphasis on ‘quick wins’. It will be appreciated that chronic under-investment in research and wide variations in annual expenditure will severely restrict the development of centres of excellence.
4. An integrated approach involving managers, administrators, engineers and scientists, in a climate where change is seen as an opportunity for improvement rather than a threat to the existing culture. The distancing of practitioners from researchers for, for example, adminis-trative or trading convenience should be avoided because it runs the risk that the results of R&D will not be of much practical value.
5. An understanding of the difference between consultancy and research work, and what can be achieved with either: the latter might be subdivided into projects aimed at (a) well-defined problems, and (b) more speculative investigations. A research project should pro-vide new information and not be merely a review of current practice; that said, repackaging exercises are often dressed up as research.
6. The availability of different contractual arrangements. The type and terms of a contract should reflect the targets and the uncertainties in the project. For example, whereas consul-
Annex I
172
tancy-type work could be let as fixed price contracts, such an arrangement, competitively tendered, is unlikely to provide best value for money where there is a substantial element of research. It might not be possible or desirable to derive a tightly written specification where there is a good deal of uncertainty in the method of working or in the likely out-come of the work. In such cases a flexible approach is necessary and the client must be closely involved with the progress of the work and be able to change its direction when necessary: partnering arrangements should prove productive here.
7. A workable system for assessing the outcome of a project: again, the method should suit the type of project. It can be difficult to determine the tangible and intangible benefits of a research project, particularly where the specification and method of working changed through its course. Late completion and cost over-runs are commonplace with research projects, particularly those involving site experiments. Such problems can be better antici-pated and mitigated in well-managed co-ordinated projects. However, it must be under-stood by all parties that, by its very nature, not all research work will provide solutions to the question originally posed; but this is difficult to reconcile in a bureaucracy where suc-cess/failure is determined by accountancy procedures and where ‘failure’ requires the ap-portioning of blame.