26
Cost and Supply of Geothermal Power Susan Petty Black Mountain Technology
| Date post: | 22-Dec-2015 |
| Category: |
Documents |
| Upload: | maud-gibbs |
| View: | 213 times |
| Download: | 0 times |
Cost and Supply of Geothermal PowerCost and Supply of Geothermal Power
Susan PettyBlack Mountain Technology
The Geothermal Resource BaseThe Geothermal Resource Base
USGS Circular 790Released in 1979Based on data from 1950’s-1978
Bonneville Power Authority Pacific Northwest onlyMore detail for Northwest resources
State Geothermal Resource MapsAll states with geothermal resourcesMaps don’t evaluate resource potential
US Geothermal Resource EstimatesUS Geothermal Resource Estimates
USGS Circular 790Estimates recoverable heat and potential power outputIdentifies resources on basis of surface manifestations23,000 MWe from identified hydrothermal resourcesNo assumptions about cost to produce powerEnhancing permeability of identified resources a possibilityDoes not include hot dry rockCuts off electric power generation at 150°C
US Geothermal Resource EstimatesUS Geothermal Resource Estimates
BPA Northwest Resource Evaluation More detailed estimates for Washington, Oregon, Idaho and MontanaAdds ~3500 MWe to USGS estimates for areaDoes not rely solely on presence of hot springs Considers cost in ranking resources for development

Other Geothermal Resource DataOther Geothermal Resource Data
State geothermal resource mapsCurrently being updated by INL and some state geological surveys or universitiesIncludes areas of high heat flow, surface manifestations and wells
Geothermal Map of the USRecently updatedBased on heat flow calculated from shallow and deep well temperature measurementsData available on web
Thermal Springs Map of the USSprings with measured temperatures above regional groundwater temperature
USGS Updated Basin and Range Temperature Gradient DatabaseNow available on web from http://pubs.usgs.gov/of/1999/of99-425/webmaps/home.html. Includes data from industry exploration
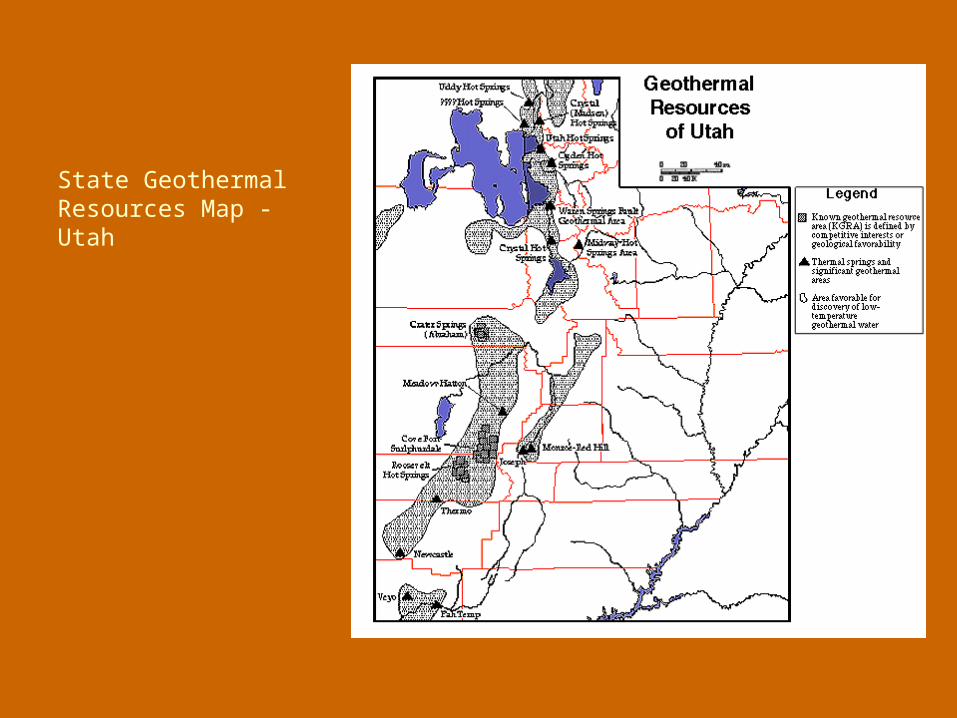
State Geothermal Resources Map - Utah
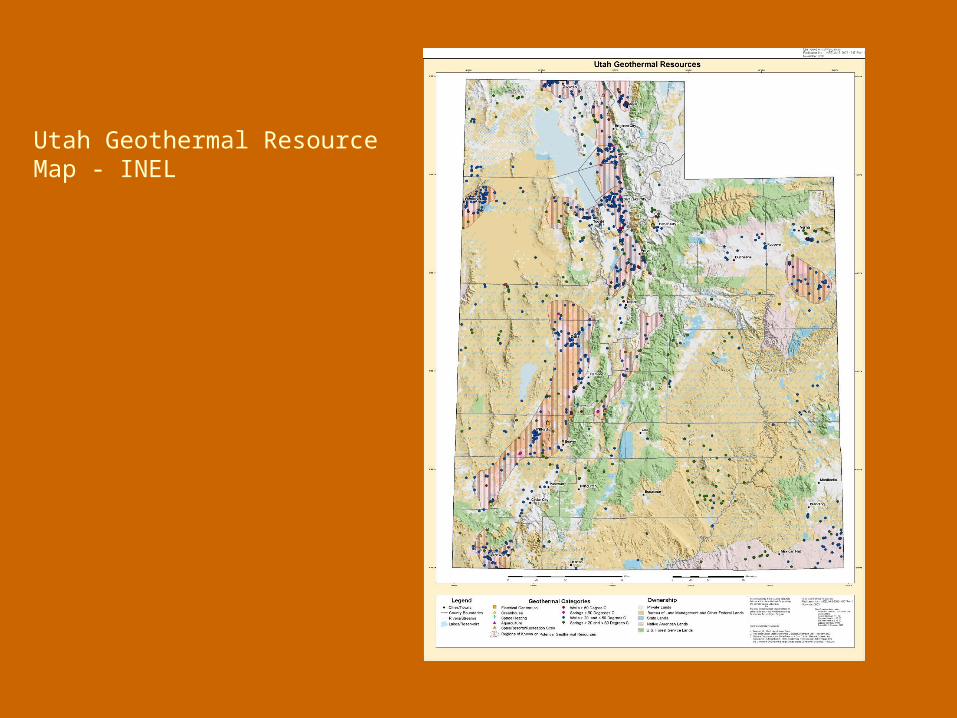
Utah Geothermal Resource Map - INEL
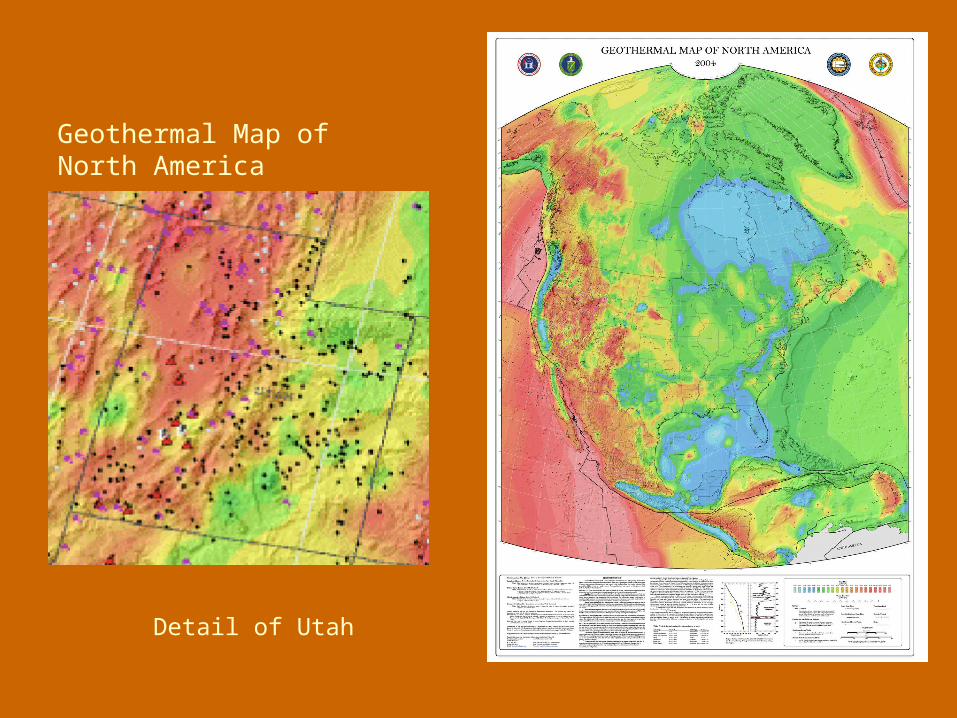
Geothermal Map of North America
Detail of Utah

Temperatures at Depth for Continental US

Temperature at 6 km
With depth to bedrock

Resource From Heat MiningResource From Heat Mining
Area in Utah that is above 240°C at 6 km
Total heat in place converted to electricity - 136,000 MWe for 1000 years
Recoverable heat at 20% recovery – 27,000 MWe

Thermal Spring Map - Western US
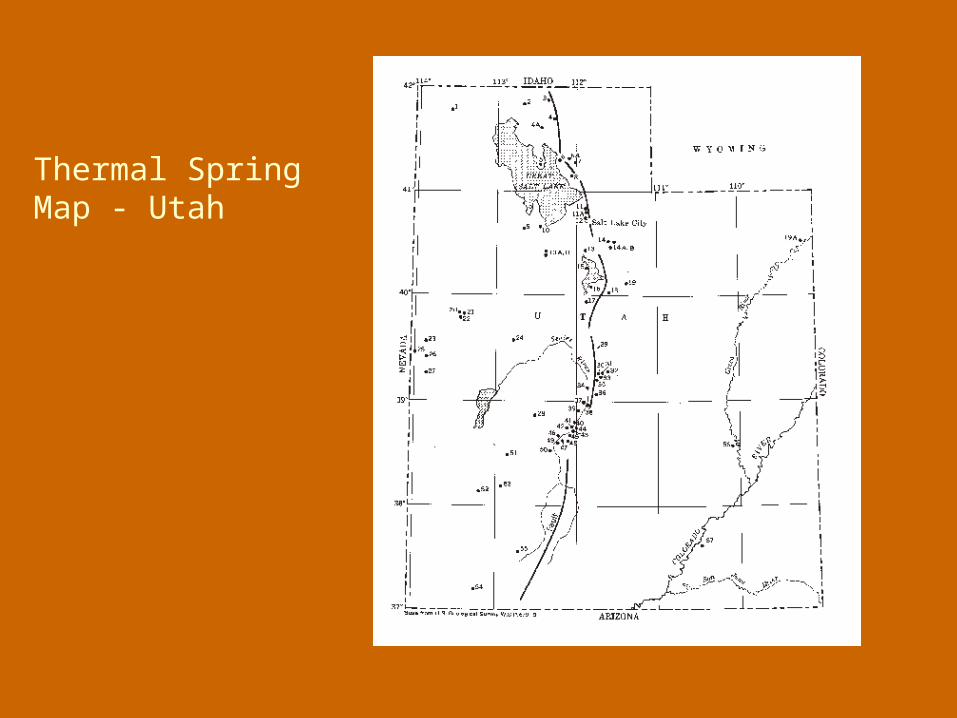
Thermal Spring Map - Utah
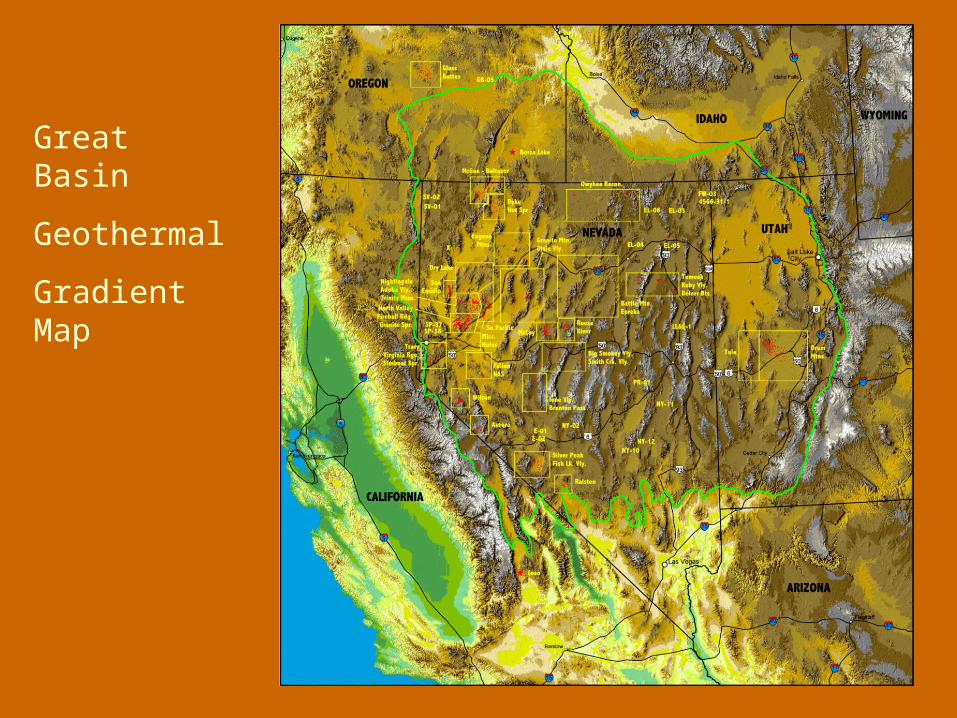
Great Basin
Geothermal
Gradient Map

Cost of Geothermal PowerCost of Geothermal Power
Sandia – Petty, et al, Impact of Technology on Cost of Geothermal PowerEPRI – Brugman, et al, Next Generation Geothermal Power Plants - 1996Renewable Northwest Project: Geothermal Power - 2002
ResourceCapitalCost ($US1999/kW)
Geothermal $1,150–$3,000
Hydropower27 $735–$4,778
Coal28 $1,070–$1,410
Nuclear29 $1,500–$4,000

Modeling Cost of Geothermal PowerModeling Cost of Geothermal Power
IM-GEO – Impact of Technology on Cost of Geothermal Power – Completed 1990, Updated – 1994
Used to build supply curves – 1992Input for NEMS modeling by EIAEIA currently using this study escalated to current $
GETEM – Geothermal Energy Technology Enhancement Model
In Beta testingBased on drilling costs from Sandia study 2004Plant capital costs from reports by Ormat and Power Engineers and on EPRI 1996 study.

Modeling Data RequirementsModeling Data Requirements
Resource DataTemperature DepthFlow per wellSize of resourceTemperature/Pressure decline rateDrilling difficulty – geologyExploration success rateConfirmation success rate
Plant DataBinary or FlashSize of plantNumber of unitsBinary or flashPumped or Self FlowO&M as % of cost
Economic DataFixed Charge RateUtilization Factor %Contingency %
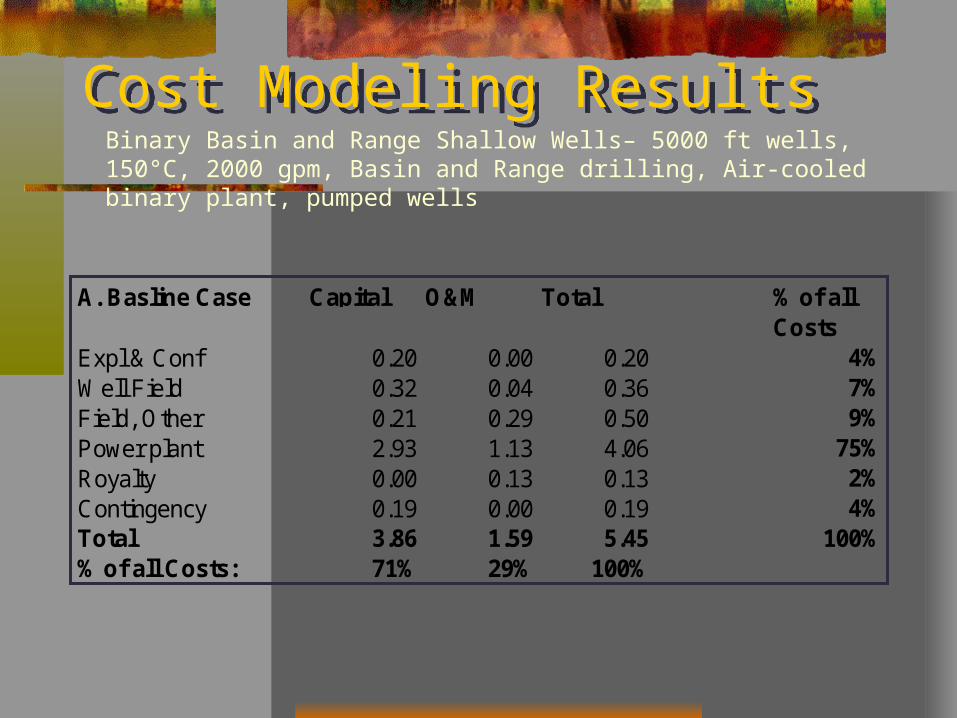
Cost Modeling ResultsCost Modeling ResultsBinary Basin and Range Shallow Wells– 5000 ft wells, 150°C, 2000 gpm, Basin and Range drilling, Air-cooled binary plant, pumped wells
A. Basline Case Capital O&M Total % of allCosts
Expl & Conf 0.20 0.00 0.20 4%Well Field 0.32 0.04 0.36 7%Field, Other 0.21 0.29 0.50 9%Power plant 2.93 1.13 4.06 75%Royalty 0.00 0.13 0.13 2%Contingency 0.19 0.00 0.19 4%Total 3.86 1.59 5.45 100%% of all Costs: 71% 29% 100%

Break Down of Geothermal Power CostBreak Down of Geothermal Power Cost
Binary Basin and Range Shallow Wells – 2000 ft wells, 150°C, 2000 gpm, Basin and Range drilling, Air-cooled binary plant, pumped wells
Cost Centers as Percentage of LCOE
4% 7%
9%
74%
2%
4%
Expl & Conf
Well Field
Field, Other
Power plant
Royalty
Contingency
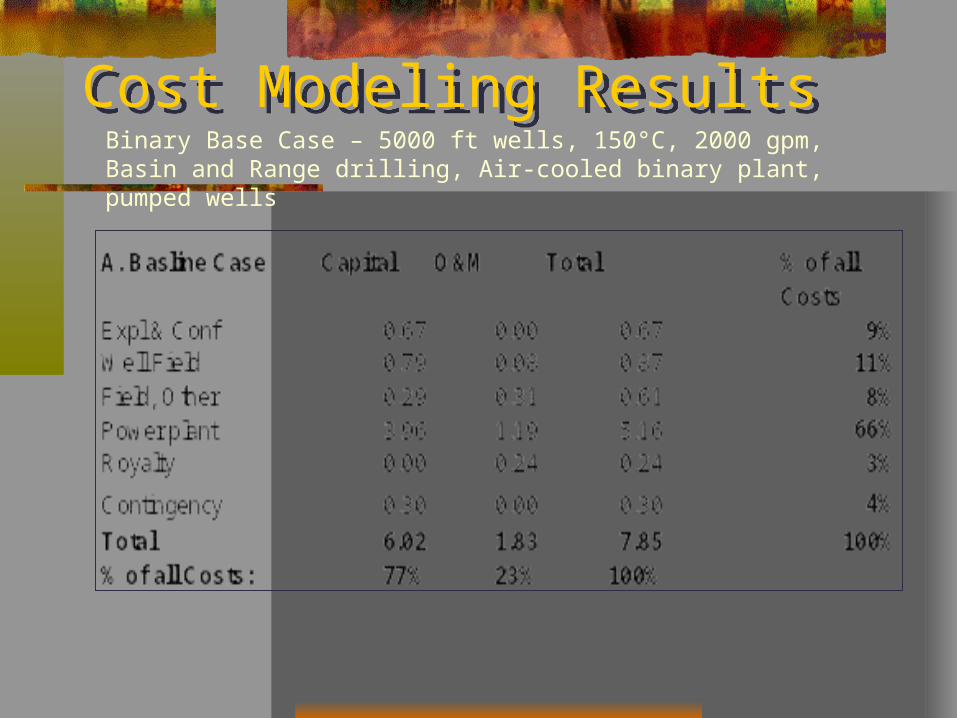
Cost Modeling ResultsCost Modeling ResultsBinary Base Case – 5000 ft wells, 150°C, 2000 gpm, Basin and Range drilling, Air-cooled binary plant, pumped wells

Break Down of Geothermal Power CostBreak Down of Geothermal Power Cost
Binary Base Case – 5000 ft wells, 150°C, 2000 gpm, Basin and Range drilling, Air-cooled binary plant, pumped wells
Cost Centers as Percentage of Total LCOE
8.6%
11.1%
7.7%
65.7%
3.1%
3.8%
Expl & Conf
Well Field
Field, Other
Power plant
Royalty
Contingency7.85 ¢/kW-hr
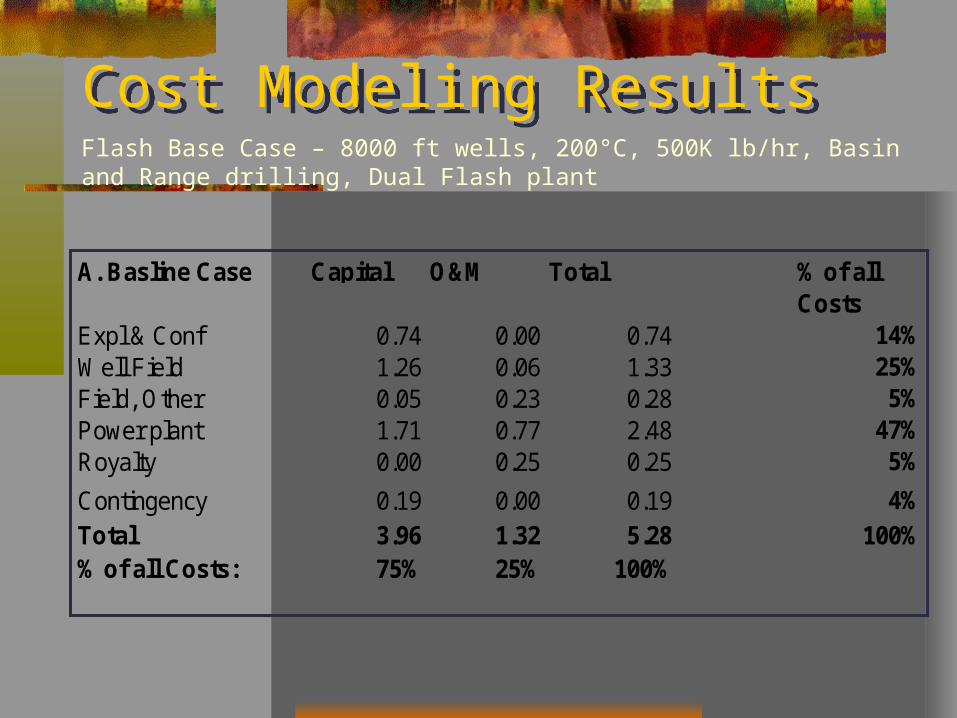
Cost Modeling ResultsCost Modeling ResultsFlash Base Case – 8000 ft wells, 200°C, 500K lb/hr, Basin and Range drilling, Dual Flash plant
A. Basline Case Capital O&M Total % of allCosts
Expl & Conf 0.74 0.00 0.74 14%Well Field 1.26 0.06 1.33 25%Field, Other 0.05 0.23 0.28 5%Power plant 1.71 0.77 2.48 47%Royalty 0.00 0.25 0.25 5%
Contingency 0.19 0.00 0.19 4%Total 3.96 1.32 5.28 100%% of all Costs: 75% 25% 100%

Break Down of Geothermal Power CostBreak Down of Geothermal Power Cost
Flash Base Case – 8000 ft wells, 200°C, 500K lb/hr, Basin and Range drilling, Dual Flash plant
Cost Centers as Percentage of LCOE
14.1%
25.2%
5.4%
46.9%
4.8%
3.6%
Expl & Conf
Well Field
Field, Other
Power plant
Royalty
Contingency
5.28 ¢/kW-hr

Cost Modeling ResultsCost Modeling Results
A. Basline Case Capital O&M Total
Expl & Conf 1.60 0.00 1.60Well Field 10.88 0.97 11.85Field, Other 1.29 3.81 5.10Power plant 2.02 1.11 3.13Royalty 0.00 1.94 1.94
Contingency 0.85 0.00 0.85Total 16.65 7.82 24.47% of all Costs: 68% 32% 100%
EGS High Temperature Case - 240°C at 6 km, pumped wells, 395 gpm
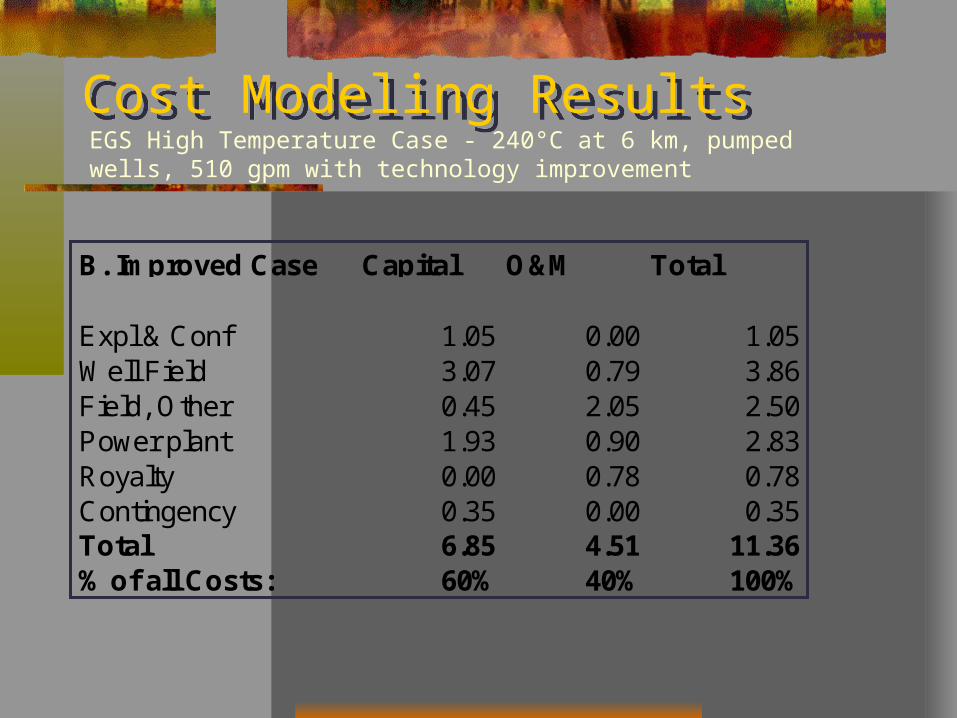
Cost Modeling ResultsCost Modeling ResultsEGS High Temperature Case - 240°C at 6 km, pumped wells, 510 gpm with technology improvement
B. Improved Case Capital O&M Total
Expl & Conf 1.05 0.00 1.05Well Field 3.07 0.79 3.86Field, Other 0.45 2.05 2.50Power plant 1.93 0.90 2.83Royalty 0.00 0.78 0.78Contingency 0.35 0.00 0.35Total 6.85 4.51 11.36% of all Costs: 60% 40% 100%

Break Down of Geothermal Power CostBreak Down of Geothermal Power Cost
EGS High Temperature Case - 240°C at 6 km, pumped wells, 510 gpm, with technology improvement
Cost Centers as Percentage of LCOE
9.3%
33.9%
22.0%
24.9%
6.8%
3.1%
Expl & Conf
Well Field
Field, Other
Power plant
Royalty
Contingency11.36 ¢/kW-hr


