COST-BENEFIT ANALYSIS FOR NATURAL RESOURCE MANAGEMENT IN THE PACIFIC A GUIDE Aaron Buncle; Adam Daigneault; Paula Holland; Anna Fink; Scott Hook; and Marita Manley December 2013 Landcare Research Manaaki Whenua
Transcript
COST−BENEFIT ANALYSIS FOR NATURAL RESOURCE MANAGEMENT IN THE PACIFIC: A GUIDE COST−BENEFIT ANALYSIS FOR NATURAL RESOURCE MANAGEMENT IN THE PACIFIC: A GUIDE
1
COST-BENEFIT ANALYSIS FOR NATURAL RESOURCE MANAGEMENT IN THE PACIFIC
A GUIDE
Aaron Buncle; Adam Daigneault; Paula Holland; Anna Fink; Scott Hook; and Marita Manley
December 2013
Landcare ResearchManaaki Whenua
COST−BENEFIT ANALYSIS FOR NATURAL RESOURCE MANAGEMENT IN THE PACIFIC: A GUIDE
Aaron Buncle Secretariat of the Pacific Regional Environment Programme www.sprep.orgAdam Daigneault Landcare Research, New Zealand www.landcareresearch.co.nzPaula Holland Secretariat of the Pacific Community www.spc.intAnna Fink Secretariat of the Pacific Community www.spc.intScott Hook Pacific Island Forum Secretariat www.forumsec.orgMarita Manley Gesellschaft für Internationale Zusammenarbeit www.giz.de/en
DISCLAIMER
While care has been taken in the collection, analysis, and compilation of the data, it is supplied on the condition that the Secretariat of the Pacific Regional Environment Programme (SPREP), the Secretariat of the Pacific Community (SPC), the Pacific Island Forum Secretariat (PIFS), Landcare Research and Gesellschaft für Internationale Zusammenarbeit (GIZ) shall not be liable for any loss or injury whatsoever arising from the use of the data.
Published by: SPREP/ SPC/ PIFS/ Landcare Research and GIZ (2013)
Cover design by: Sailesh Kumar Sen SPC-SOPAC Division
Cover photos: Adam Daigneault
Layout by: Sailesh Kumar Sen SPC-SOPAC Division
Printed by: Quality Print Suva Fiji
The views and opinions expressed in this publication are those of the authors and do not necessarily reflect the policies or views of their respective organisations.
COST−BENEFIT ANALYSIS FOR NATURAL RESOURCE MANAGEMENT IN THE PACIFIC: A GUIDE
Aaron Buncle; Adam Daigneault; Paula Holland; Anna Fink; Scott Hook; and Marita Manley
COST-BENEFIT ANALYSIS FOR NATURAL RESOURCE MANAGEMENT IN THE PACIFIC
A GUIDE
December 2013
COST−BENEFIT ANALYSIS FOR NATURAL RESOURCE MANAGEMENT IN THE PACIFIC: A GUIDECOST−BENEFIT ANALYSIS FOR NATURAL RESOURCE MANAGEMENT IN THE PACIFIC: A GUIDE
i
COST−BENEFIT ANALYSIS FOR NATURAL RESOURCE MANAGEMENT IN THE PACIFIC: A GUIDE
CONTENTS Preface........................................................................................................................................................... iii
Acknowledgements........................................................................................................................................ iv
Glossary.......................................................................................................................................................... v
Overview of cost-benefit analysis................................................................................................................... 2
When is CBA used?......................................................................................................................................... 3
The CBA process............................................................................................................................................. 4
Step 1. Determine the objective of the CBA................................................................................................... 5
The underlying problem, and links with the project........................................................................................ 6
Defining the CBA objective............................................................................................................................... 6
Step 2. Identify the costs and benefits for each option................................................................................... 9
Identify costs and benefits............................................................................................................................... 11
Step 3. Value the costs and benefits............................................................................................................... 13
Economic value versus market price.............................................................................................................. 13
Data collection................................................................................................................................................. 14
Step 4. Aggregate the costs and benefits....................................................................................................... 16
Discount benefits and costs to obtain present values..................................................................................... 16
Calculate the NPV of each option..................................................................................................................... 17
Mapping the costs and benefits....................................................................................................................... 21
Weighting the costs and benefits..................................................................................................................... 22
Step 7. Prepare recommendations and write the report................................................................................ 23
Writing the CBA report..................................................................................................................................... 24
COST−BENEFIT ANALYSIS FOR NATURAL RESOURCE MANAGEMENT IN THE PACIFIC: A GUIDECOST−BENEFIT ANALYSIS FOR NATURAL RESOURCE MANAGEMENT IN THE PACIFIC: A GUIDE
ii
COST−BENEFIT ANALYSIS FOR NATURAL RESOURCE MANAGEMENT IN THE PACIFIC: A GUIDE
AppendicesAppendix 1. Recent cost−benefit analyses in the Pacific............................................................................................... 29
Appendix 2. Cost−benefit analysis work planning.......................................................................................................... 31
Appendix 3. Generic terms of reference for a cost−benefit analysis consultancy........................................................ 35
Appendix 4. Methods for valuing costs and benefits in economic analyses.................................................................. 38
Appendix 5. Alternative efficiency measures................................................................................................................. 40
Appendix 6. Tips for cost−benefit analysis..................................................................................................................... 42
TablesTable 1. Present values of $100 over five years using discount rates of 0%, 5% and 10%...................................... 17
Boxes Box 1. Situation, problem statement and project objectives for coastal management and aggregate supply in Kiribati (the ‘ESAT’ project).......................................................................................................... 7
Box 2. Objective of the ESAT CBA........................................................................................................................... 8
Box 3. Without-project and with-project scenarios for the ESAT project in Kiribati............................................. 11
Box 4. Identifying costs and benefits for the ESAT project in Kiribati................................................................... 12
Box 5. Valuing costs and benefits of the ESAT project in Kiribati.......................................................................... 15
Box 6. Calculation of NPV for the ESAT project in Kiribati.................................................................................... 18
Box 7. Sensitivity results for the ESAT project in Kiribati...................................................................................... 19
Box 8. Distribution of benefits and costs from the ESAT project in Kiribati.......................................................... 20
Box 9. Benefit and cost mapping for the ESAT project in Kiribati......................................................................... 21
Box 10. A hypothetical example of weighting........................................................................................................... 22
Box 11. Recommendations for the ESAT project in Kiribati.................................................................................... 23
FiguresFigure 1. Cost−benefit analysis in the project cycle................................................................................................... 4
Figure 2. Key steps of the CBA process...................................................................................................................... 5
Figure 3. Dynamic change and ‘with’ and ‘without’ analysis...................................................................................... 9
Figure 4. Methods to value costs and benefits........................................................................................................... 14
COST−BENEFIT ANALYSIS FOR NATURAL RESOURCE MANAGEMENT IN THE PACIFIC: A GUIDE
iii
COST−BENEFIT ANALYSIS FOR NATURAL RESOURCE MANAGEMENT IN THE PACIFIC: A GUIDE COST−BENEFIT ANALYSIS FOR NATURAL RESOURCE MANAGEMENT IN THE PACIFIC: A GUIDE
PREFACE There has been an increased interest in the use of cost−benefit analysis (CBA) in the Pacific in recent years. Accompanying this has been an increased demand for expertise to carry out the analysis, and many requests for training to increase national and sectoral staff skills. In the last 12 months regional training activities in CBA have, for example, been delivered to support natural resource projects aimed at invasive species management, climate change mitigation and adaptation, environmental conservation and food security.
There is a wide variety of guides and manuals on CBA across the globe. However, up to now there has been no published document that brings together the steps of CBA with an emphasis on the Pacific region. This guide is intended to fill that gap. It aims to support Pacific government and non-governmental organisations in their CBA activities, and to support training and capacity development in this area. The guide is also intended to standardise approaches to CBA by the agencies involved − SPC, SPREP, PIFS, USP, GIZ, UNDP − so that practitioners receive consistent advice and support.
The guide has been written from the perspective of supporting decisions in natural resource management sectors, but the principles apply broadly to all sectors of the economy and society.
COST−BENEFIT ANALYSIS FOR NATURAL RESOURCE MANAGEMENT IN THE PACIFIC: A GUIDECOST−BENEFIT ANALYSIS FOR NATURAL RESOURCE MANAGEMENT IN THE PACIFIC: A GUIDE COST−BENEFIT ANALYSIS FOR NATURAL RESOURCE MANAGEMENT IN THE PACIFIC: A GUIDE
iv
ACKNOWLEDGEMENTSSpecial thanks are extended to Dr Padma Narsey Lal (consultant), Dr Netatua Pelesikoti (SPREP), and Simalua Enele (Ministry of Finance and Economic Development, Government of Tuvalu) for reviewing and commenting on draft versions of this guide.
Thanks are also extended to the following partner organisations and programmes for supporting this initative:
• The Pacific Resource and Environment Economics Network (PREEN);
• Commonwealth Secretariat (ComSec);
• Pacific Adaptation to Climate Change (PACC) Programme;
• Pilot Program for Climate Resilience (PPCR) – Pacific Regional Track;
• Critical Ecosystem Partnership Fund (CEPF);
• Climate and Development Knowledge Network (CDKN);
• SPC/GIZ Coping with Climate Change in the Pacific Island Region (CCCPIR).
COST−BENEFIT ANALYSIS FOR NATURAL RESOURCE MANAGEMENT IN THE PACIFIC: A GUIDE
v
COST−BENEFIT ANALYSIS FOR NATURAL RESOURCE MANAGEMENT IN THE PACIFIC: A GUIDE COST−BENEFIT ANALYSIS FOR NATURAL RESOURCE MANAGEMENT IN THE PACIFIC: A GUIDE
GLOSSARYBaseline A measurement or description of a scenario used as a basis for comparison. In CBA,
the baseline represents the best assessment of the world in the absence of the action (including government policies or regulations) proposed for assessment. This is sometimes referred to as the ‘without’ scenario
Benefit Monetary or non-monetary gain received because of an action taken or a decision made
Benefit-cost ratio (BCR)
The ratio of the present value of benefits from an activity, expressed in monetary terms, relative to the present value of its costs
Cost-benefit analysis (CBA)
A systematic process for assessing, calculating and comparing the advantages (benefits) and disadvantages (costs) of an activity. This includes those costs and benefits that cannot be quantified in monetary terms but are nonetheless valued by society, for example those relating to the environment, safety and nature.
Cost-effectiveness analysis (CEA)
A systematic method to find the lowest cost of accomplishing a desired objective
Cost Monetary or non-monetary loss due to an action taken or decision made
Discount rate (r) The rate at which future values of benefits or costs are adjusted to express them in present day values
Discounting A method whereby the value of future benefits and or costs is expressed as present day values
Ex-ante CBA A CBA undertaken while a project is still under consideration, before it is implemented
Ex-post CBA A CBA undertaken at the end of the project period to evaluate its performance
Externality A cost or benefit from an activity that affects other parties without this being reflected in the cost of the goods or services involved
Market An institution in which goods and services are bought and sold
Net present value (NPV)
Sum of the discounted stream of benefits and costs over time
Non-market benefits and costs
Benefits or costs arising from the production or consumption of goods or services that are not traded in markets and either have no monetary price or whose price does not reflect all the benefits and or costs
Opportunity cost The economic cost of a resource, measured as the cost of giving up the nearest alternative use; in other words, the value of the next best option that must be surrendered when scarce resources are used for one purpose instead of another
Sensitivity analysis
An assessment of how different values for one (independent) variable will impact a particular dependent variable under a given set of assumptions
Project cycle Standardised process that project managers use to design and implement evidence-based projects
Willingness to pay The maximum amount a person would be willing to pay, forego or exchange in order to receive a good or service or to avoid something undesired
Weighting Allowance or adjustment made to values to take account of certain circumstances
With-and-without analysis
Comparison of benefits and costs ‘without’ the proposed activity (what would happen in any event) and benefits and costs ‘with’ the activity (which would cause some change)
With scenario The best assessment of the situation if the action proposed for assessment is pursued
Without scenario No change option. This the best assessment of the situation in the absence of the action proposed
COST−BENEFIT ANALYSIS FOR NATURAL RESOURCE MANAGEMENT IN THE PACIFIC: A GUIDECOST−BENEFIT ANALYSIS FOR NATURAL RESOURCE MANAGEMENT IN THE PACIFIC: A GUIDE COST−BENEFIT ANALYSIS FOR NATURAL RESOURCE MANAGEMENT IN THE PACIFIC: A GUIDE
1
INTRODUCTION The importance of natural resources to the economy of the Pacific island region cannot be overstated. Island communities have unsurprisingly relied heavily on ocean resources for sustenance and economic activities, such as fishing and transport. Land-based resources are also vital at subsistence level, and are providing increasing development opportunities, for example through forestry and mineral mining.
At the regional level, the Pacific is the most important tuna fishing ground in the world, with commercial fisheries including exports worth an estimated US$2 billion in 2007 (SPC Oceanic Fisheries Program cited in Bell et al., 2011). At the national level, primary industries such as agriculture, forestry, fishing and minerals constitute as much as a quarter of the GDP in Kiribati and one-third of the GDP for the Solomon Islands1. Natural resources also contribute to economic development through secondary and territory sectors (such as tourism, manufacturing and processing).
The traditional reliance of Pacific island nations on natural resources is also recognised as a critical component of social development, supporting national identity and culture. At the same time, the cash economy has become more important in most communities over the last century, with the shift from a largely subsistence-based economy to an increasingly market-oriented one. Access to better technology and increased trade with the outside world have, in many cases, resulted in higher income levels and generally improved health and life prospects. However, development in many Pacific island countries has come at the cost of increased (often unsustainable) production and consumption, resulting in increasing resource scarcity, degradation and pollution problems (Lal and Holland, 2010). Climate change impacts are compounding these natural resource management challenges.
In response to these challenges, an increasing number of development projects are being developed in the region that target the environment, natural resources and/or climate change adaptation. The success of these projects, however, has been chequered. As a result, there has been a call to include economic analysis of projects to improve their efficiency and effectiveness (see, for example, SPREP (1999, 2001), Lal and Keen (2002) and Manley (2013)).
Countries also recognise the need for improved transparency and accountability in government decisions, including evidence-based choice of projects, policies and initiatives. The Forum Compact2, for example, recognises that improved governance and service delivery are essential to achieve more efficient and effective development.
In response, there has been a significant increase in the cost−benefit analysis (CBA) of natural resource management projects in the last 5–10 years, addressing a variety of natural resource management sectors (see Appendix 1 for examples). However, the use of CBA to inform decisions and actions within government and non-governmental organisations is often not institutionalised or applied systematically. This can lead to confusion about how and when to use CBA.
Numerous guides already exist to support the systematic application of CBA (for example, Mishan, 1988; Hanley and Spash, 1993; Wills, 1997; European Commission, 1997; HM Treasury, 2003; Boardman, 2006; Tietenberg, 2006; OECD, 2006; Australian Government Department of Finance, 2006; UNECE, 2007; USEPA, 2010). However, none include local case studies that are relevant
1 Data available at www.spc.int/prism2 Developed by Forum Leaders and implemented by Economic Ministers.
COST−BENEFIT ANALYSIS FOR NATURAL RESOURCE MANAGEMENT IN THE PACIFIC: A GUIDE
2
COST−BENEFIT ANALYSIS FOR NATURAL RESOURCE MANAGEMENT IN THE PACIFIC: A GUIDE COST−BENEFIT ANALYSIS FOR NATURAL RESOURCE MANAGEMENT IN THE PACIFIC: A GUIDE
to decision makers in the Pacific. There have therefore been many requests to SPC, SPREP and other agencies in the region to produce a guide, with regional examples, to help countries plan and deliver CBA of their development activities (for example, Buncle, 2013).
The purpose of this document is therefore to support economic analysis in Pacific island countries (government and non-government organisations) by:
• illustrating the various steps involved in conducting a CBA using examples that are familiar to Pacific Islanders in context, content and challenges;
• providing practical tools to support local CBA; and
• promoting a consistent approach to CBA.
In light of the many existing guidebooks already available to support CBA, this document is intended only as an introductory guide with a focus on the practical application of CBA in the Pacific. It indicates key questions and issues to address but it does not explain the theoretical concepts underpinning CBA. Readers are encouraged to refer to the many CBA texts referred to above for more information on these theoretical areas.
The document is divided into several sections. The next section provides an overview of the purpose of CBA, some of its key features, and describes where CBA can be used in project planning and evaluation. It then sets out CBA as a seven-step process, starting from the determination of the objective of the CBA through to preparation of recommendations. Each of the seven steps is then described in more detail in the following sections. These sections also illustrate key points with the use of a case study example of the application of CBA to a coastal project in Kiribati.
A series of appendices at the end of this document provide supporting material and tools.
OVERVIEW OF COST−BENEFIT ANALYSISCost−benefit analysis (CBA) is a systematic process for identifying, valuing, and comparing costs and benefits of a project1.
The primary objective of CBA is to determine whether the benefits of a project outweigh its costs, and by how much relative to other alternatives. The purpose of this is to:
• determine whether the proposed project is (or was) a sound decision or investment; and/or
• compare alternative project options, and make a decision on the preferred option.
Ultimately, CBA aims to help inform decisions about whether to proceed with a project or not, and to choose which project option to implement, where there are several options. It is one of several tools that can be used to help inform decision-making.
The CBA process is based on the fundamental principles of welfare economics (that is, economics that consider the well-being of society). There is general agreement on the application of CBA as part of public decision-making processes.
1 In this report a project is a catch-all term for major activity, policy intervention, or response/solution to an identified problem.
COST−BENEFIT ANALYSIS FOR NATURAL RESOURCE MANAGEMENT IN THE PACIFIC: A GUIDECOST−BENEFIT ANALYSIS FOR NATURAL RESOURCE MANAGEMENT IN THE PACIFIC: A GUIDE COST−BENEFIT ANALYSIS FOR NATURAL RESOURCE MANAGEMENT IN THE PACIFIC: A GUIDE
3
The key features of a CBA are:
• All related costs (losses) and benefits (gains) of an project are considered, including potential impacts on human lives and the environment;
• Costs and benefits are assessed from a whole-of-society perspective1, rather than from one particular individual or interest group (that is, a public and not a private perspective is taken);
• Costs and benefits are expressed as far as possible in monetary terms2 as the basis for comparison; and
• Costs and benefits that are realised in different time periods in the future are aggregated to a single time dimension (discounting).
Today, CBA is commonly used in countries across the globe to assess a wide range of projects. In the Pacific, CBA has also been applied to a variety of sectors (see Appendix 1).
When is CBA used?CBA may be used at a number of points during the life of a project, or the ‘project cycle’. A project cycle is a standardised process that project managers follow in designing and implementing evidence-based projects (Lal and Holland, 2010).
An example of a project cycle is illustrated in Figure 1. The figure shows the stages of the project cycle at which CBA can be applied. These are ex-ante (before project implementation), mid-term, and ex-post (after project implementation). Applied at the different stages, CBA can serve slightly different functions.
An ex-ante CBA is undertaken while a project is still under consideration, typically before a decision is made (by a government or external donors) to support it. Ex-ante CBAs are primarily done to appraise whether a project is worthwhile or feasible, which project option out of several is best, and to inform adjustments to project design.
A mid-term CBA is carried out mid-way through a project to check that the project is on track and to inform any design refinements or adjustments for the remainder of the project period.
An ex-post CBA is undertaken at the end of the project period to evaluate the performance of the project. This can support transparency and accountability in reporting on how well public funds have been spent. In this way the CBA can inform the merits of investing in such areas again in the future, as well as the design of specific projects. This is especially useful for projects that seek to demonstrate or trial a particular approach or technology.
The ‘best’ time to conduct a CBA depends on what you want to do with the findings. For example, a CBA will be most informative about project design if it is carried out before implementation (ex-ante), but the values estimated can only ever be projections. For certainty about actual achievements, an ex-post CBA would be needed. However, this will come too late to influence the design of the finished work (although it can inform future work).
1 For this reason, some people refer to CBA as social CBA. 2 Note that costs and benefits that cannot be quantified in monetary terms are still considered during decison
making.
4
COST−BENEFIT ANALYSIS FOR NATURAL RESOURCE MANAGEMENT IN THE PACIFIC: A GUIDE COST−BENEFIT ANALYSIS FOR NATURAL RESOURCE MANAGEMENT IN THE PACIFIC: A GUIDE
Figure 1. Cost-benefit analysis in the project cycle.
Source: Adapted from Lal and Holland (2010).
The CBA processThe CBA process follows a logical and systematic sequence. This Guide presents this sequence as seven key steps (Figure 2).
The sequence of steps presented is not necessarily rigid. CBA analysts often find it necessary to return to previous steps as more data or information becomes available and the nature of the problem they are investigating becomes clearer. This means that planning and organising a CBA become critical to process. Suggestions for how to establish a work for a CBA are provided in Appendix 2. Generic terms of reference for an economic consultant are also provided in Appendix 3.
Situationanalysis
Ex-post CBA
Mid-term CBA
Ex-ante CBA
Start here
End here
Identification of possible
solutions or options
Project evacuation
Project monitoring
Problem analysis
Project feasibility
Project design
Project implementation
Analysis and appraisal
Implementation
Monitoring and Evaluation
COST−BENEFIT ANALYSIS FOR NATURAL RESOURCE MANAGEMENT IN THE PACIFIC: A GUIDE COST−BENEFIT ANALYSIS FOR NATURAL RESOURCE MANAGEMENT IN THE PACIFIC: A GUIDE
5
1. Determine the objective of the cost-benefit analysisClarify the questions the analysis seeks to answer. What decision does it seek to inform?
2. Identify the costs and benefitsClarify the potential impact of the activity and the type of costs and benefits it would generate
3. Value the costs and benefitsExpress (as far as possible) the value of benefits and costs in monetary terms.
Which of these can be valued and how?
4. Aggregate the costs and benefitsSum costs and benefits over time
5. Perform sensitivity analysisAssess the importance of major uncertainties associated with the analysis and activity
6. Consider distributional impactsConsider who will incur the costs and benefits and what impact this might have on the activity
7. Prepare recommendationsSummarise how to proceed from here. Which option should be chosen and why?
Figure 2. Key steps of the CBA process.
The following sections of this document describe the seven basic steps in detail. A case study from Kiribati, in which CBA is applied to coastal management and aggregate supply, is used to illustrate the key points of each step.
Step 1. Determine the objective of the CBAThe first step of the process is to determine the objectives of the CBA. This involves: (a) confirming the underlying problem and links with the proposed project options; and (b) clarifying what decision the CBA will inform, and therefore what we want to know as a result of the analysis.
6
COST−BENEFIT ANALYSIS FOR NATURAL RESOURCE MANAGEMENT IN THE PACIFIC: A GUIDE COST−BENEFIT ANALYSIS FOR NATURAL RESOURCE MANAGEMENT IN THE PACIFIC: A GUIDE
The underlying problem, and links with the projectAs illustrated in Figure 1, a substantial amount of planning and assessment work is normally undertaken by a government department or agency before a project begins. An important first activity of the CBA is to review and summarise these assessments, which will already have been completed. The purpose of this activity is to check that the nature and causes of the project problem are well understood and that the identified options clearly link to the causes of the problem (that is, confirm that the identified project responses make sense). This activity should be undertaken in partnership with relevant technical experts from the sector or discipline as well as the government officials responsible for managing the project.
During this step the following questions should be answered:
What is the problem?
• What is the nature of the problem? What is the magnitude of the problem? What is the evidence for this? Is the source of this information reliable?
• Who is affected? How many people are affected? Over what geographical area? Is this situation expected to change over time? If so, how?
• What are the causes and drivers of the problem? Have all causes and drivers of the problem been identified? Are these causes and drivers well understood? What is the relative importance of each of the identified causes and drivers of the problem? Is the proposed project appropriate to address these causes of the problem?
What is the project aim?
• What is the stated aim of the project? Does this aim directly link to one or more of the identified causes of the problem?
• Can the stated aim be made more specific or clearer?
What are the alternative project options?
• What options have been identified? How were these options identified? Was this a thorough process, including review of what has been done in other parts of the country and the broader Pacific region? Were consultations conducted with communities? Was particular attention paid to ensuring that all community members (men, women, youth, children, elderly and those living with disabilities) had the opportunity to feed into project option identification?
• Do these options clearly align with the project aim (and hence causes/drivers of the problem)?
• Are there any financial or budget constraints which may restrict which options can be considered further? Are there any other obvious constraints which may affect the feasibility of identified options?
• If projects similar to the identified options have been implemented previously or elsewhere in the region, were they successful? What were the enablers and challenges? Was a formal evaluation report prepared for these projects and if so, has this been reviewed?
• Are the number of alternative options identified sufficient to provide the decision-maker with real scope for exercising choice? Are alternatives clearly distinguishable from one another?
COST−BENEFIT ANALYSIS FOR NATURAL RESOURCE MANAGEMENT IN THE PACIFIC: A GUIDE COST−BENEFIT ANALYSIS FOR NATURAL RESOURCE MANAGEMENT IN THE PACIFIC: A GUIDE
7
In practice, the assessment work undertaken by a government department or agency prior to starting a project may not be sufficient to provide answers to all of these questions. This is often the case for projects in the Pacific region which proceed straight to the project options without a detailed situational, problem, and options analysis. Similarly, donor-financed projects often experience significant lag times between project planning (i.e. the first five steps of the project cycle) and actual implementation of the project, which means that some of the analyses used to inform the project design become outdated. In these situations, it is up to the CBA analyst to ask relevant stakeholders and experts for the needed information; to check original situational, problem and options analyses are still accurate; and to undertake any further literature research.
Essentially, the CBA analyst should be clear about the nature and causes of the problem and linkages with the proposed project options. This understanding is needed to properly define the CBA objective and correctly identify benefits and costs related to the project (Step 2).
Box 1 describes the project situation, the problem, and the project aim for the coastal management and aggregate supply case study in Kiribati.
Box 1. Situation, problem statement and project objectives for coastal management and aggregate supply in Kiribati (the ‘ESAT’ project)
Situation
For Kiribati, a combination of growing population, migration from outer islands, and development investment has resulted in the rapid growth of its capital, which is located on the small atoll of Tarawa. Growth has resulted in an increase in residential developments as well as larger developments such as hospitals, schools and government buildings. The construction of these developments requires ‘aggregates’ – sand, gravel, rip rap or rocks used for construction.
Problem
Aggregates on Tarawa have conventionally been sourced from the the coastline by families (by hand), businesses and the government (using machinery). However, there is only a limited amount of aggregates available and removing too much can contribute to coastal erosion and coastal inundation. This is an increasing concern given sea level rise due to climate change.
To minimise the impacts of beach mining, the government has placed restrictions on where miners can operate. However, these rules are not always observed. This may be due to ignorance of the rules, or attitudes to land (the land on which some families illegally mine is perceived as their own). Many families mine aggregates to sell to supplement their incomes and these families have little incentive to reduce mining.
The supply of aggregates from the beach is sometimes supplemented by imports. However, this is costly and therefore not a feasible source for most development needs. Furthermore, importation brings quarantine risks.
For Tarawa to address its development needs, it requires a supply of aggregates that is both safe and affordable, does not exacerbate the threat of coastal erosion and inundation, and does not harm the needs of the local community.
It is now recognised that a substantial supply of naturally occurring aggregates exists in the local lagoon. The government has thus proposed the Environmentally Safe Aggregates in Tarawa (ESAT) project to open up access to these aggregates to help meet the growing
8
COST−BENEFIT ANALYSIS FOR NATURAL RESOURCE MANAGEMENT IN THE PACIFIC: A GUIDE COST−BENEFIT ANALYSIS FOR NATURAL RESOURCE MANAGEMENT IN THE PACIFIC: A GUIDE
demand for building materials in Tarawa, while also limiting coastal threats in the face of climate change.
Project aim
The overall aim of the ESAT project is to secure a sustainable and affordable source of aggregates to underpin economic development in Kiribati in the face of vulnerability and climate change.
Option
• Providing a supply of appropriately sourced material to meet South Tarawa’s growing aggregate demand through two interconnected components:
- The establishment of a self-sustaining aggregate company and environmentally safe lagoon-dredging operations to supply aggregate;
- Effective control of beach mining.
Defining the CBA objectiveOnce the underlying problem and links with the proposed project options have been confirmed, the next step is to clarify what decision the CBA will inform and therefore what we want to know as a result of the analysis.
The most common decisions or questions for which CBA are employed are:
• Will the proposed project be a worthwhile investment? (ex-ante CBA)
• Which project option is preferred? (ex-ante CBA)
• Was the proposed project a worthwhile investment? (ex-post CBA).
Another reason for undertaking a CBA is to inform refinements or modifications to the design of a project option. This usually focuses on a particular aspect of project design such as modifications to proof against disaster and climate risk.
CBA objectives should be specified clearly and all parties involved should agree on these. The CBA team should play an active role in determining the CBA objectives.
Box 2 gives the CBA objective statement of the case study ESAT project in Kiribati.
Box 2. Objective of the ESAT CBA
To assess the economic feasibility of dredging aggregate from within the lagoon as an alternative source to coastal mining, and to assess the implications of the proposed accompanying ban on coastal mining.
COST−BENEFIT ANALYSIS FOR NATURAL RESOURCE MANAGEMENT IN THE PACIFIC: A GUIDE COST−BENEFIT ANALYSIS FOR NATURAL RESOURCE MANAGEMENT IN THE PACIFIC: A GUIDE
9
Step 2. Identify the costs and benefits for each optionStep 2 of the CBA procedure is to identify the costs and benefits for each option under consideration. To do this we first assess what would happen if the project was not implemented (‘without-project’ scenario), and then compare this to what would happen if we were to implement each of the proposed options (‘with-project’ scenario(s)). This ‘with-and-without’ analysis allows the changes (benefits or costs) resulting from a project to be identified.
With-and-without analysisThe without-project scenario provides the baseline from which the changes or impacts resulting from a project can be identified and measured. The intention of this with-and-without analysis is to identify only the changes that are clearly associated with the project options, and not include changes that would have occurred anyway (Brouwer and Pearce, 2005).
With-and-without analysis should not be confused with ‘before-and-after’ comparisons. Before-and-after comparisons compare the change between two single points in time, i.e. before the project is implemented and after it has been completed. The with-and-without analysis measures change for every year (or other time increment) across the life of the project. This difference matters because many natural systems are dynamic so the without situation itself will change over time, irrespective of whether a project is implemented.
For example, coastal erosion and inundation risk in Kiribati is a result of beach mining activity, sea level rise, and a number of other factors. Based on sea levels and beach mining today, an assessment of coastal inundation would reflect the current risk. However, after 10 years, with continued beach mining and on-going sea level rise, the inundation risk would be expected to be higher. These changes to inundation risk that occur over time without the project need to be captured in order to accurately assess the risk reduction benefits attributable to the project.
The difference between ‘without’ and ‘before’ situations may be represented visually (Figure 3).
Figure 3. Dynamic change and ‘with’ and ‘without’ analysis.
Source: Lal and Holland (2010).
Coastal inundation without project
Inun
dati
on r
isk
Time
Coastal inundation with project
10
COST−BENEFIT ANALYSIS FOR NATURAL RESOURCE MANAGEMENT IN THE PACIFIC: A GUIDE COST−BENEFIT ANALYSIS FOR NATURAL RESOURCE MANAGEMENT IN THE PACIFIC: A GUIDE
To identify the types of costs and benefits, the with-and-without analysis is performed in qualitative (non-monetary) terms in the first instance. However, any quantitative (descriptive) information that is readily available should also be included as this will later be used to quantify the costs and or benefits.
The items to consider in the without-and-without analysis should reflect the inputs (e.g. labour, materials), outputs (e.g. total production) and outcomes (e.g. reduced public health problems) associated with a project. This may be usefully presented in a with-and-without-project table, as illustrated in Box 3 for the Kiribati case study.
The with-and-without-project table summarises the present situation, the future situation without the project, and the future situation if the project options are implemented.
For the present situation column, recall that this may not be fixed but may be dynamic and change naturally over time. This column thus describes the present outputs (e.g. production levels, pollution levels) from which to consider what may happen in the future.
The without-project column of the table describes what inputs, outputs and outcomes relevant to the project problem are expected to arise without any project options being implemented. Again, these may be different to the present situation inputs, outputs and outcomes because they will need to take into account any on-going trends that affect outcomes (e.g. beach mining activity, sea level rise). Consequently, in this column analysts need to forecast the likely level of inputs, outputs and outcomes over time1. This column therefore describes what would likely happen if no intervention took place, taking into consideration any on-going trends that would likely affect relevant outcomes.
The with-project columns of the table (one for each option) describe the outputs and outcomes/impacts for the project scenario under the different project options − that is, they describe the changes in outputs and outcomes that would be expected to occur because of the project activities. These columns also include the additional inputs required to implement the project options. These are the up-front (i.e. capital investment and establishment) and operational costs of the project option.
It is important to properly apply the qualitative with-and-without analysis during this step, and to do this, a thorough understanding of the chain of causation of the project is needed as was outlined in the previous section. If the with-and-without analysis is not done properly and instead a simplistic ‘before-and-after’ approach is undertaken – whereby impacts and outcomes are measured just prior to project implementation and presumed to remain constant at that level over the lifespan of the proposed project − then this will likely overlook some costs and benefits, and may underestimate or overestimate the true value of identified costs and benefits. This in turn may lead to major errors in the analysis.
1 The analyst will need to consider the timeframe that the CBA will reflect. Regardless of whether the CBA is intended to reflect values over 1, 10 or 50 years, the same timeframe will need to applied for each column.
COST−BENEFIT ANALYSIS FOR NATURAL RESOURCE MANAGEMENT IN THE PACIFIC: A GUIDE COST−BENEFIT ANALYSIS FOR NATURAL RESOURCE MANAGEMENT IN THE PACIFIC: A GUIDE
11
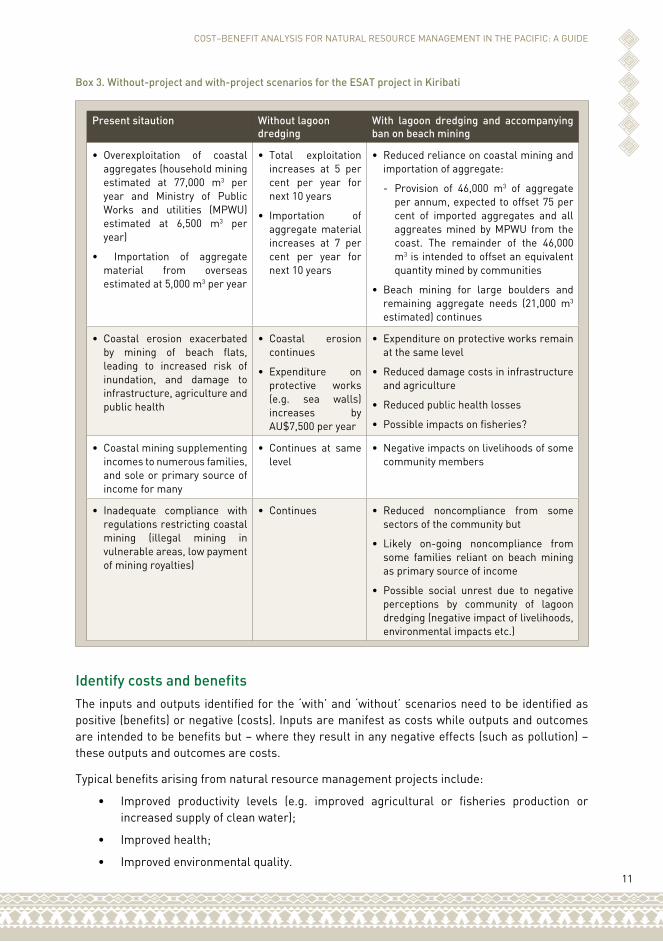
Box 3. Without-project and with-project scenarios for the ESAT project in Kiribati
Present sitaution Without lagoon dredging
With lagoon dredging and accompanying ban on beach mining
• Overexploitation of coastal aggregates (household mining estimated at 77,000 m3 per year and Ministry of Public Works and utilities (MPWU) estimated at 6,500 m3 per year)
• Importation of aggregate material from overseas estimated at 5,000 m3 per year
• Total exploitation increases at 5 per cent per year for next 10 years
• Importation of aggregate material increases at 7 per cent per year for next 10 years
• Reduced reliance on coastal mining and importation of aggregate:
- Provision of 46,000 m3 of aggregate per annum, expected to offset 75 per cent of imported aggregates and all aggreates mined by MPWU from the coast. The remainder of the 46,000 m3 is intended to offset an equivalent quantity mined by communities
• Beach mining for large boulders and remaining aggregate needs (21,000 m3 estimated) continues
• Coastal erosion exacerbated by mining of beach flats, leading to increased risk of inundation, and damage to infrastructure, agriculture and public health
• Coastal erosion continues
• Expenditure on protective works (e.g. sea walls) increases by AU$7,500 per year
• Expenditure on protective works remain at the same level
• Reduced damage costs in infrastructure and agriculture
• Reduced public health losses
• Possible impacts on fisheries?
• Coastal mining supplementing incomes to numerous families, and sole or primary source of income for many
• Continues at same level
• Negative impacts on livelihoods of some community members
• Inadequate compliance with regulations restricting coastal mining (illegal mining in vulnerable areas, low payment of mining royalties)
• Continues • Reduced noncompliance from some sectors of the community but
• Likely on-going noncompliance from some families reliant on beach mining as primary source of income
• Possible social unrest due to negative perceptions by community of lagoon dredging (negative impact of livelihoods, environmental impacts etc.)
Identify costs and benefitsThe inputs and outputs identified for the ‘with’ and ‘without’ scenarios need to be identified as positive (benefits) or negative (costs). Inputs are manifest as costs while outputs and outcomes are intended to be benefits but – where they result in any negative effects (such as pollution) – these outputs and outcomes are costs.
Typical benefits arising from natural resource management projects include:
• Improved productivity levels (e.g. improved agricultural or fisheries production or increased supply of clean water);
• Improved health;
• Improved environmental quality.
12
COST−BENEFIT ANALYSIS FOR NATURAL RESOURCE MANAGEMENT IN THE PACIFIC: A GUIDE COST−BENEFIT ANALYSIS FOR NATURAL RESOURCE MANAGEMENT IN THE PACIFIC: A GUIDE
Typical costs include:
• Up-front costs:
- research, design and development costs;
- capital expenditure;
- labour;
- use of government owned land, facilities, or machinery.
• Operating and maintenance costs for the entire expected economic life of the project
- costs of regular inputs (fuel, materials, manufactured goods, transport and storage, etc.);
- on-going labour.
• Any unintended negative impacts arising from the project, e.g. health effects or environmental damage.
Health, social and environmental benefits or costs are commonly not marketed (that is, these items are not purchased or sold in markets) or are characterised by prices that reflect less than their full value. Market prices will therefore unlikely reflect the value of these types of impacts from a project. Nonetheless, it is important that these items are included in the analysis. At a minimum, they should be discussed and described in qualitative terms.
The types of costs and benefits identified for the case study ESAT project in Kiribati are shown in Box 4.
Box 4. Identifying costs and benefits for the ESAT project in Kiribati
From Box 3, several benefits can be expected from coastal management associated with lagoon dredging. These are:
• An increase in supply of locally produced aggregates, offsetting some coastal mining and imports. This would reduce costs in:
- maintenance and replacement costs for infrastructure;
- loss of agriculture production;
- public health.
On the other hand, some negative impacts (costs) of lagoon dredging may be expected:
• Possible impacts on fisheries;
• Possible negative impacts on the livelihoods of community members might result in negative perceptions of the project and obstruction. These distributional issues will be considered in Step 6;
• Standard costs associated with dredging include the cost to build a barge to extract and transport the aggregates to shore, fuel and labour to run the barge, and costs of sorting the aggregate collected.
COST−BENEFIT ANALYSIS FOR NATURAL RESOURCE MANAGEMENT IN THE PACIFIC: A GUIDE COST−BENEFIT ANALYSIS FOR NATURAL RESOURCE MANAGEMENT IN THE PACIFIC: A GUIDE
13
Step 3. Value the costs and benefitsAs far as possible, the costs and benefits identified under the different project options should be valued in monetary terms. This allows a direct comparison of the different costs and benefits under each option.
Building on the with-and-without analysis carried out in the previous step, the next step is to quantify the inputs (the physical amounts, e.g. number of water tanks) and outputs (e.g. litres of water available each year) for each of the project options. The costs and benefits quantified in this way must be those that would result from the project activities.
After the inputs and outputs have been quantified, dollar figures should be assigned to them. Ideally, all benefits and costs should be quantified and reflected in dollar terms unless it is impractical to do so. Situations where it may be impractical to value in monetary terms include:
• When physical or monetary values cannot be reliably measured or established;
• When cost or benefit items are not significant to the analysis;
• When it is judged that the cost of attempting to value them outweighs the benefit of including them in the analysis.
Omitting values from a CBA is not ideal. However in some cases it may be possible to determine the way forward even though some values are missing1. Items that are not quantified in a CBA should nonetheless always be listed and described, so that they are not completely excluded from the decision-making process.
Economic value versus market priceCBA uses willingness to pay to measure benefits and opportunity cost to measure costs. The opportunity cost of resources is their value in the alternative use to which they would have been put (Harrison, 2010).
Where an active and effective market exists for an item (such as a water tank or fence), the market price for those items provides an indication of willingness to pay and their opportunity cost. Market price information is publicly available and is therefore usually easy to access.
However market prices may not always reflect the true economic value of an item accurately and, in some cases, do not exist at all. This occurs where markets do not function properly (or at all), or where goods and services are subsidised or taxed. In these cases adjustments will be needed identify the true economic value.
In practice, the two items that most often need adjustment in pricing in the Pacific are family or community labour, and goods or services that are taxed or subsidised:
• Family or community members frequently provide their labour for free in development projects. At first glance, this would suggest that there is no cost for labour. In fact, these same individuals could otherwise be engaged in alternative productive activities such as cooking, gardening or fishing, or working for a salary. The opportunity cost of their labour can be estimated by considering what income they would generate if they were doing something else. Does this value matter? Imagine that the family members were suddenly unable to help in the project and the government had to pay someone to fill their places.
1 For example, imagine the benefits of a $0.5 million water improvement project include $10 million in health benefits. To determine whether the project is worthwhile, it would not be critical to value the benefits to marine ecosystems as well.
14
COST−BENEFIT ANALYSIS FOR NATURAL RESOURCE MANAGEMENT IN THE PACIFIC: A GUIDE COST−BENEFIT ANALYSIS FOR NATURAL RESOURCE MANAGEMENT IN THE PACIFIC: A GUIDE
Or imagine that this same development project was to be replicated in a place where family labour was not available. In these cases, money would need to be spent to secure the labour input. The true economic value of the inputs (in this case, labour) to the project needs to be properly costed to determine the value of the project.
• Items that are taxed become more expensive to buy than they actually cost to produce. The opportunity cost of the items can be estimated by removing the value of the tax from their market price.
• Items that are subsidised appear to be cheaper than they really are (like family labour in the example above). The opportunity cost of subsidised items can be estimated by removing the value of the subsidy from their market price. That is, using the market cost faced by the buyers plus adding back the value of the subsidy. As an example, in many countries water supply is subsidised by the government. The cost to the public to buy the water will appear low but this is only because the government is footing the remainder of costs. Likewise, land or facilities may be provided by the government ‘for free’. These resources could have been used equally (or more) productively elsewhere instead and the benefits they could have generated elsewhere are foregone.
Common approaches to putting a monetary value on costs and benefits are illustrated in Figure 4. A short description of these methods, together with examples of their use and the relative level of effort (time and/or money) they require, is provided in Appendix 4 and standard CBA texts.
Figure 4. Methods to value costs and benefits.
Source: Based on Emerton and Bos (2004).
Data collection Data collection for CBAs can be time-consuming and costly. For some costs and benefits it may not be worth the effort and expense to collect the empirical data needed for an accurate estimation of the values. The CBA analyst needs to make a judgement about this.
There are no hard and fast rules for determining the accuracy of cost and benefit estimation and hence the data that is needed. A general rule of thumb is that the detail and accuracy of cost and benefit valuations should be commensurate with the size and importance of the project proposal. It is also useful to ask: Is the cost or benefit item a significant or important part of the analysis? Can conclusions and recommendations be made without undertaking a detailed and accurate monetary estimation of this cost or benefit item − is this information actually needed?
Market price
Cost-based approaches
Mitigative and avertive expenditure
Damage costs
Replacement costs
Change in production
Travel costs
Hedonic pricing
Contingent valuation
Choice modelling
Production function
approach
Surrogate market
approaches
Stated preference approaches
HighTypical cost and level of effort to conduct
COST−BENEFIT ANALYSIS FOR NATURAL RESOURCE MANAGEMENT IN THE PACIFIC: A GUIDE COST−BENEFIT ANALYSIS FOR NATURAL RESOURCE MANAGEMENT IN THE PACIFIC: A GUIDE
15
Box 5. Valuing costs and benefits of the ESAT project in Kiribati.
With lagoon dredging Cost or benefit
Valuation method
Operation of the dredge (and its accompanying ban and reduced reliance on coastal mining and importation of aggregate)
Cost Use market prices to estimate costs of dredging
Adust market price of labour to 75% of average wage rate to reflect true economic costs of labour (limited employment opportunities in Kiribati)
Adjust market price of fuel costs to reflect long-run untaxed fuel price (based on World Bank forecasts)
Avoided cost of aggregate production from household beach mining and MPWU beach mining; as well as avoided costs of imports
Benefit Use market prices to estimate costs of production for household mining, MPWU beach mining; and market prices for imported aggregate
Adjust market price of labour to 75% of average wage rate to reflect true economic costs of labour (limited employment opportunities in Kiribati)
Adjust market price of fuel costs to reflect long-run untaxed fuel price (based on World Bank forecasts)
Reduced damage costs in infrastructure
- avoided expenditures on protective works
- avoided costs
Benefit Use market prices to estimate the value of costs avoided or to estimate expenditures that would need to be avoid to preventative costs (mitigative and avertive expenditure method):
• Estimate value of loss in infrastructure that would otherwise have to be protected by coast. Cost of replacing costal protection = price of seawall x length of seawall needed
• Loss of land, buildings, personal property, damage to utilities − telephone, electricity, water supply and sewage, roads etc. would continue. Cost of damage avoided = annual estimated costs x expected increase in costs avoided
Reduced damage costs in agriculture
Reduce public health losses
Possible impacts on fisheries?
Benefit
Benefit
Cost
Described, not valued
Described, not valued
Described, not valued
Negative impacts on livelihoods of some community members (reduced access to aggregates for sale)
Cost Described, not valued
Reduced non-compliance from some sectors of the community but
• likely on-going non-compliance from families reliant on beach mining for primary sources of income
• Possible social unrest due to negative perceptions by community of lagoon dredging (negative impact of livelihoods, environmental impacts etc.)
Benefit
Cost
Cost
Described, not valued
16
COST−BENEFIT ANALYSIS FOR NATURAL RESOURCE MANAGEMENT IN THE PACIFIC: A GUIDE COST−BENEFIT ANALYSIS FOR NATURAL RESOURCE MANAGEMENT IN THE PACIFIC: A GUIDE
As we have already indicated, where it is not possible or practical to quantify key costs or benefits in monetary terms with accuracy, or where it is decided that the effort and expense to do a detailed valuation is not worth it, it is important to at least undertake a qualitative evaluation of these costs and benefits. In the CBA report, indicate the uncertainties associated with the key values, state the assumptions made, and describe any costs and benefits that have not been included so that policy makers can see the limitations to the assessment. Also, where possible, undertake a sensitivity analysis of key variables where quantified estimates are highly uncertain (Step 5).
The methods used for valuing costs and benefits for the ESAT project in Kiribati are shown in Box 5.
InflationCosts and benefits should be valued in real terms (constant prices) over time, rather than in nominal terms (prices at the time the goods or services were provided). In other words, the impact of inflation should be removed from the CBA (for example by using the same nominal price over the course of the assessment) so the costs and benefits are measured in a common money value over time. Prices and costs should only be adjusted over time if the price of a particular good or service is expected to increase or decrease relative to all other goods and services. For example, if a project was expected to flood the market with fish and cause the price of fish to fall next year, the price of fish this year should not be used to estimate the economic value of the fish produced. In this case, a lower value would be used. Generally speaking, activities in the Pacific that dramatically affect the economic value of goods or services in this way are not common.
Step 4. Aggregate the costs and benefits Step 4 of the CBA process is to aggregate the costs and benefits. Aggregation refers to bringing together all the different costs and benefits over the life of the project, and presenting them as one number (value or ratio). The purpose of this step is to facilitate comparison of the different options.
Aggregating costs and benefits is done in two parts: (a) present costs and benefits realised over time in present day values (discounting); and (b) sum present values of each cost and benefit category into a single metric known as net present value (NPV).
Discount benefits and costs to obtain present valuesThe lifetime of projects can stretch over many years. This affects how values are summed because people typically place more weight on those costs and benefits that accrue earlier in the life of a project than those that occur later. To convert the benefits and costs achieved over time to an equivalent or comparable value, ‘discounting’ is conducted. This renders benefits and costs occurring in different time periods to present-day terms.
Discounting is done by multiplying future values by a discount factor 1/(1+r)t. That is:
, where PV = present value FV=futurevalueofbenefitsorcosts r=discountrate t = time period
19
Step 4. Aggregate the costs and benefits Step 4 of the CBA process is to aggregate the costs and benefits. Aggregation refers to bringing together all the different costs and benefits over the life of the project, and presenting them as one number (value or ratio). The purpose of this step is to facilitate comparison of the different options. Aggregating costs and benefits is done in two parts: (a) present costs and benefits realised over time in present day values (discounting); and (b) sum present values of each cost and benefit category into a single metric known as net present value (NPV). Discount benefits and costs to obtain present values The lifetime of projects can stretch over many years. This affects how values are summed because people typically place more weight on those costs and benefits that accrue earlier in the life of a project than those that occur later. To convert the benefits and costs achieved over time to an equivalent or comparable value, ‘discounting’ is conducted. This renders benefits and costs occurring in different time periods to present-day terms. Discounting is done by multiplying future values by a discount factor 1/(1+r)t. That is:
(1 )tFVPV r=
+ , where PV = present value FV = future value of benefits or costs r = discount rate t = time period
The present value of costs and benefits can vary significantly depending on the chosen discount rate, r (see Table 1). The choice of discount rate in the Pacific is challenging for two reasons. First, there is still considerable debate in the economics community about how to select a discount rate (see Harrison (2010) for more information). Second, in the Pacific there is no standard discount rate available to follow. Some Pacific Ministries of Finance, e.g. Samoa, publish their preferred discount rate; others do not have an official rate. Appendix 1 indicates discount rates used in some recent studies conducted in the Pacific. Many of these studies use an initial rate of 7–10%. Table 1. Present values of $100 over five years using discount rates of 0%, 5% and 10% Discount rate (r) Year 0 (today) Year 1 Year 2 Year 3 Year 4 Year 5 0% $100 $100 $100 $100 $100 $100 5% $100 $ 95 $ 91 $ 86 $ 82 $ 78 10% $100 $ 91 $ 83 $ 75 $ 68 $ 62 It is ultimately up to the analyst to choose a discount rate that is appropriate and can be backed it up with a logical explanation. It should be recognised that the discount rate used will affect the assessed feasibility of a project. This is because using a high discount rate significantly reduces the magnitude of the present value calculated for impacts that are realised in the longer term. Thus, some projects with large benefits forecasted over the long run (e.g. habitat protection) might be rendered infeasible if the discount rate is high.
COST−BENEFIT ANALYSIS FOR NATURAL RESOURCE MANAGEMENT IN THE PACIFIC: A GUIDE COST−BENEFIT ANALYSIS FOR NATURAL RESOURCE MANAGEMENT IN THE PACIFIC: A GUIDE
17
The present value of costs and benefits can vary significantly depending on the chosen discount rate, r (see Table 1). The choice of discount rate in the Pacific is challenging for two reasons. First, there is still considerable debate in the economics community about how to select a discount rate (see Harrison (2010) for more information). Second, in the Pacific there is no standard discount rate available to follow. Some Pacific Ministries of Finance, e.g. Samoa, publish their preferred discount rate; others do not have an official rate.
Appendix 1 indicates discount rates used in some recent studies conducted in the Pacific. Many of these studies use an initial rate of 7–10%.
Table 1. Present values of $100 over five years using discount rates of 0%, 5% and 10%
Discount rate (r)
Year 0 (today)
Year 1 Year 2 Year 3 Year 4 Year 5
0% $100 $100 $100 $100 $100 $100
5% $100 $ 95 $ 91 $ 86 $ 82 $ 78
10% $100 $ 91 $ 83 $ 75 $ 68 $ 62
It is ultimately up to the analyst to choose a discount rate that is appropriate and can be backed it up with a logical explanation. It should be recognised that the discount rate used will affect the assessed feasibility of a project. This is because using a high discount rate significantly reduces the magnitude of the present value calculated for impacts that are realised in the longer term. Thus, some projects with large benefits forecasted over the long run (e.g. habitat protection) might be rendered infeasible if the discount rate is high.
Alternative discount rates can be used in a sensitivity analysis (see Step 5) to assess to what extent this changes the assessed feasibility of the project or the rank of options under consideration.
A CBA should always use the same discount rate for both benefits and costs and for different project options, in order to maintain the objectivity of the analysis.
Calculate the NPV of each optionOnce costs and benefits accruing in different time periods are discounted to their present value, they can be aggregated to a single metric, the NPV. This is done for each option.
The NPV of a project option equals the difference between the present value of benefits and the present value of costs, summed over the lifetime of the project:
20
Alternative discount rates can be used in a sensitivity analysis (see Step 5) to assess to what extent this changes the assessed feasibility of the project or the rank of options under consideration. A CBA should always use the same discount rate for both benefits and costs and for different project options, in order to maintain the objectivity of the analysis. Calculate the NPV of each option Once costs and benefits accruing in different time periods are discounted to their present value, they can be aggregated to a single metric, the NPV. This is done for each option. The NPV of a project option equals the difference between the present value of benefits and the present value of costs, summed over the lifetime of the project:
0
( )T
tt
NPV PV Benefits Costs=
= −∑
A project with an NPV greater than zero provides net economic benefits to society. This means that overall − i.e. from a whole-of-society perspective − the gains generated from the project outweigh the losses incurred. Conversely, a project with an NPV less than zero means that the project will generate a net loss for society − that is, the losses incurred outweigh the gains generated. Further, the greater the NPV, the more efficient the outcome, meaning the more benefits are generated from the costs of the resources used. Economic efficiency, as reflected in the NPV, is the principal decision criterion used in CBA for project appraisal or evaluation. In general: For a single project option to the without-project scenario, a project should be
recommended if its NPV is positive. For multiple alternative options to the without-project scenario the alternative with the
highest NPV should be recommended, providing it is higher than 0. For multiple options that affect each other, the combination of options that maximises
NPV should be recommended, subject to any given budget constraint. A simplified calculation of the NPV for the ESAT case study in Kiribati is presented in Box 6. For precise calculations of the NPV for this project, see Greer (2007).
Anne 11/18/13 10:31 AMComment [1]: In equation below, is cap T correct or should it be lower case? If cap, does it need defining? SHOULD BE LOWER CASE ‘t’. Aaron I CANNOT EDIT THIS. CAN YOU
A project with an NPV greater than zero provides net economic benefits to society. This means that overall − i.e. from a whole-of-society perspective − the gains generated from the project outweigh the losses incurred. Conversely, a project with an NPV less than zero means that the project will generate a net loss for society − that is, the losses incurred outweigh the gains generated. Further, the greater the NPV, the more efficient the outcome, meaning the more benefits are generated from the costs of the resources used.
18
COST−BENEFIT ANALYSIS FOR NATURAL RESOURCE MANAGEMENT IN THE PACIFIC: A GUIDE COST−BENEFIT ANALYSIS FOR NATURAL RESOURCE MANAGEMENT IN THE PACIFIC: A GUIDE
Economic efficiency, as reflected in the NPV, is the principal decision criterion used in CBA for project appraisal or evaluation. In general:
• For a single project option to the without-project scenario, a project should be recommended if its NPV is positive.
• For multiple alternative options to the without-project scenario the alternative with the highest NPV should be recommended, providing it is higher than 0.
• For multiple options that affect each other, the combination of options that maximises NPV should be recommended, subject to any given budget constraint.
A simplified calculation of the NPV for the ESAT case study in Kiribati is presented in Box 6. For precise calculations of the NPV for this project, see Greer (2007).
Box 6. Calculation of NPV for the ESAT project in Kiribati
Economic results (2006AU$)
Lagoon dredging and strengthened regulations of mining in beach flat areas
(1) Present value of costs at 10% discount rate
Production costs of dredging 21,431,732
Environmental impacts Not valued
Total costs 21,431,732
(2) Present value of benefits at 10% discount rate
Avoided costs of production of hand excavation, mechanical excavation and imported aggregates
21,842,497
Avoided expenditures on protective works 678,237
Avoided damages to infrastructure and property 226,076
Avoided losses to agriculture Not valued
Avoided health impacts Not valued
Total benefits 22,746,813
(3) NPV
= (2) - (1) 1,315,081
Other indicators of economic efficiency are also sometimes presented from a CBA. These include the benefit−cost ratio (dollars’ worth of benefits gained for each dollar cost), the internal rate of return (the discount rate that renders the net present value of all cash flows to zero), and the cost-effectiveness of an activity. More information on these measures is provided in Appendix 5.
The distribution of costs and benefits between different stakeholder groups may also be an important consideration when appraising projects. This is discussed further in Step 6.
COST−BENEFIT ANALYSIS FOR NATURAL RESOURCE MANAGEMENT IN THE PACIFIC: A GUIDE COST−BENEFIT ANALYSIS FOR NATURAL RESOURCE MANAGEMENT IN THE PACIFIC: A GUIDE
19
Step 5. Perform sensitivity analysisHow do we ensure our results are robust? How do we account for the uncertainty about some of the values in the analysis? The fifth step of the CBA process is sensitivity analysis, which addresses these issues.
Sensitivity analysis shows how sensitive or robust results are to changes in key assumptions (about uncertain parameters), and thus how confident we can be in the results of the CBA, and making recommendations about the project based on these results.
Uncertainty arises because it is often difficult to forecast how costs and benefits estimated in a CBA will accrue over time − even where there is good data available. Uncertainty also arises where empirical data are missing and best ‘guesstimates’ and assumptions have to be used instead. The sensitivity analysis provides information on whether the results and conclusions of the analysis hold under these estimates and assumptions.
There are three key stages to conducting a sensitivity analysis:
• Identify the key parameters that are uncertain.
• Determine alternative values for these parameters. A simple way to do this is to determine feasible upper and lower limits for the parameter.
• Calculate the impact that a change in the value of each parameter would have on the project’s NPV.
Box 7 shows the results of a sensitivity analysis performed for the Kiribati ESAT case study on: (i) the cost of producing aggregate from dredging the lagoon (an increase in the unit cost of dredging by 10% was modelled); and (ii) the extent to which the lagoon aggregate will substitute for imported aggregate (a reduction in the percentage of imports from 75% to 50% was modelled). As can be seen in the table, the sensitivity results highlight that the dredging operation may not be feasible (negative NPV of − AU$724,515) if the real cost of production is 10% higher than estimated by the project team.
Box 7. Sensitivity results for the ESAT project in Kiribati
Assumption Primary NPV results (2006AU$)
Sensitivity test results (2006AU$)
(i) Production costs of dredging is 10% higher
1,315,081 −724,515
(ii) Percentage of imports that are substituted by dredge material is lower (50% instead of 75%)
1,315,081 68,221
20
COST−BENEFIT ANALYSIS FOR NATURAL RESOURCE MANAGEMENT IN THE PACIFIC: A GUIDE COST−BENEFIT ANALYSIS FOR NATURAL RESOURCE MANAGEMENT IN THE PACIFIC: A GUIDE
Step 6. Consider distributional impactsThe basic measure of economic social benefit in a CBA (NPV) reflects economic efficiency, that is, the net gain (or loss) to society. However, it does not take into account who incurs the costs and who enjoys the benefits. Step 6 of the CBA process considers the distributional impacts of the proposed project.
The distribution of costs and benefits of a project is important in CBA for two main reasons:
• Distribution can impact project feasibility. For example, we have seen in the analysis of the ESAT project in Kiribati that banning coastal mining could make some families worse off because they would be unable to generate income from selling hand mined aggregates. As ‘losers’ of the project, their incentive to cooperate with the new regulations might be low (Box 8) and this could potentially jeopardise the realisation of the project’s benefits and the project’s success.
• Decision-makers may want to achieve, or contribute to, certain equity objectives through the proposed project. Decision makers may have priorities to direct benefits to (or divert costs from) certain groups − categorised by income, ethnicity, geographical location, etc. This is especially common in the Pacific context where tax-welfare systems tend to be weak. The distribution of benefits and costs from a project may therefore be as important to governments and societies as the total size of those potential benefits (efficiency).
Box 8 summarises some of the distribution-related issues for the ESAT project in Kiribati.
Box 8. Distribution of benefits and costs from the ESAT project in Kiribati.
The distributional implications of the ESAT project initially posed feasibility risks. The project involves establishing aggregate mining from the lagoon while banning beach mining. At the time the project was being developed, approximately 1,200 households in South Tarawa were estimated to engage in mining at least once a week, often for supplementary income, with around 150 households relying entirely on selling aggregates for their livelihood. Banning household mining would reduce aggregates sourced in this way by around 30,000 m3 per annum, valued at approximately AU$1.5 million, meaning an average loss of AU$1,250 per year for each of the 1,200 households for whom mining was currently a major source of income.
This would have represented a major redistribution of benefits from the domestic household economy to a government-owned business. Such a redistribution would have created disincentives for households to comply with the ban on beach mining. Furthermore, non-compliance would mean that the lagoon mining company would have to compete for business and might not achieve the sales needed to ensure on-going production. Consequently, the cost to mining households would have had the potential to undermine the feasibility of the project.
In order to address this, the CBA report recommended that steps be taken to redistribute some of the gains of the project back to the mining households, by for example:
• Providing assistance to mining households to develop alternative income-generating activities within agriculture and fishing;
• Providing small retailers, families and on-sellers with dredged aggregate at a subsidised rate so that they can resell the aggregate and secure earnings.
COST−BENEFIT ANALYSIS FOR NATURAL RESOURCE MANAGEMENT IN THE PACIFIC: A GUIDE COST−BENEFIT ANALYSIS FOR NATURAL RESOURCE MANAGEMENT IN THE PACIFIC: A GUIDE
21
Consideration of who gains the benefits from the project and who bears the costs needed to secure those benefits is therefore a key part of CBA. In the Pacific, two simple ways are commonly used to do this:
• Mapping out the distribution of costs and benefits between stakeholders;
• Weighting the costs and benefits according to social priorities.
Mapping the costs and benefitsThe distributional impact of a project can be laid out to clarify who experiences the benefits from a project and who foots the costs. This can be done in a matrix that links benefits and costs to different affected groups. A simplified example of a matrix is provided for the Kiribati ESAT project in Box 9 below.
Box 9. Benefit and cost mapping for the ESAT project in Kiribati.
Stakeholder Costs description
Value of costs
(2006AU$)
Benefit description
Value of benefits
(2006AU$)
Net benefit (2006AU$)
Households that carry out beach mining
Lost income from sale of aggregates
15,754,912 Avoided cost of mining
11,816,184 - 3,938,728
Households that participate in fishing
Environmental impact of dredging on fishery - lost fishery harvest
Unknown Unknown
Households that participate in agricultural activities
Avoided damage and loss to agriculture
Unknown Unknown
Households located in erosion/coastal inundation hazard zone
Avoided damages and loss to (private and public) infrastructure
226,079 226,079
Government of Kiribati
Additional costs of producing aggregate
17,253,131 Additional income from sale of aggregates
Avoided imports of aggregate
Avoided expenditures on public works
Avoided damages to (private and public) infrastructure
4,912
5,847,711
678,237
This benefit has been allocated to households located in erosion hazard zone but is partly attributable here
5,027,730
Impacts on community Impacts on government
22
COST−BENEFIT ANALYSIS FOR NATURAL RESOURCE MANAGEMENT IN THE PACIFIC: A GUIDE COST−BENEFIT ANALYSIS FOR NATURAL RESOURCE MANAGEMENT IN THE PACIFIC: A GUIDE
Stating the expected equity and feasibility concerns of a project through a distributional matrix enables decision makers to make an informed choice. They can then decide between efficiency and equity considerations in line with social and political priorities.
In practice, it is not always possible to perfectly identify the winners and losers from a project. In some cases impacted parties may not belong to distinct groups and may be dispersed between different social and economic groups. Equally, the benefits or costs of a project may be difficult to value (for example, the health-related impacts of a pollution project) so that it is tricky to prove that one group substantially gains more benefits or foots more costs than another. Nevertheless, the principle still stands that impacts on key groups should at least be described.
Weighting the costs and benefitsIf governments have a commitment to target the well-being of specific groups in society, the costs or benefits estimated in a CBA could be weighted in favour of these groups.
Weighting means scaling up or down the value of costs and benefits affecting a specific group, which therefore changes the NPV, and ultimately may change the decision on whether the project is still socially beneficial.
Examples of how to conduct weighting for social reasons can be found in European Commission (2008a) and Evans et al. (2005); and a hypothetical illustration is provided in Box 10.
Box 10. A hypothetical example of weighting.
Imagine a government wished to weight the benefits or costs affecting low income families. It would need to choose weights that reflect how importantly it valued changes in that group. It might, for example, refer to its own income tax rates and note that a high income person faced a tax rate of $0.50 on the last dollar of income earned while a low income person faces a tax rate of $0.25 on the last dollar earned. The government might then infer that an additional $0.25 for a low income person is worth the same as an additional $0.50 for a high income person. In other words, it chooses to value additional income for low income people at twice that of a high income person. In this way, government weights income gains or losses for low income people as twice those for high income people.
This example is purely for illustration. In practice, tax rates are not set purely according to social priorities of wealth redistribution but can also reflect other priorities such as encouraging business growth or employment.
Unlike mapping which is an objective exercise that uses logic to deduce where costs and benefits are expected to fall, weighting of costs and benefits for specific groups is a subjective exercise, based on a society’s (government’s) judgement of the needs of different groups. Because weighting is subjective, reaching agreement on what the weights should be can be challenging. There should always be a strong case for any weights assigned, and both the weighted and unweighted results should be presented.
COST−BENEFIT ANALYSIS FOR NATURAL RESOURCE MANAGEMENT IN THE PACIFIC: A GUIDE COST−BENEFIT ANALYSIS FOR NATURAL RESOURCE MANAGEMENT IN THE PACIFIC: A GUIDE
23
Step 7. Prepare recommendations and write the report
RecommendationsThe rationale for recommending the preferred option should be clear and defensible. There should be sufficient evidence for the reason a given option is selected.
Box 11. Recommendations for the ESAT project in Kiribati.
The results of the CBA indicated that the lagoon dredging project and strengthened beach mining regulations would likely generate a net benefit for the South Tarawa community. As shown in Box 6, NPV was estimated to be significantly positive (AU$1,315,081), and this result did not include potentially significant benefits of avoided health impacts.
The positive NPV result was robust to changes in assumptions about the extent to which dredging aggregate would substitute for imported aggregate. However the analysis showed that the Kiribati community would incur a net loss if the real cost of aggregate production using lagoon dredging increased substantially, say, by 10%. Therefore it was recommended that further research on the cost of producing aggregate using dredging techniques be undertaken before implementation started.
An important qualification was that potential environmental impacts of the dredging operation were not captured in the quantitative analysis − although an environmental impact assessment conducted did indicate that this impact was likely to be minor provided appropriate management measures are implemented. It would be prudent however to closely monitor environmental impacts of the operation and take an adaptive management approach.
Another important consideration for this project was the loss of income for households from beach mining of aggregates. At the time of the CBA, around 1,200 households around South Tarawa were supplementing their incomes from mining activities and a further 150 households − mostly in the villages of South Tarawa Temaiku and Bonriki − were relying entirely on selling aggregates for their livelihood. If the social consequences of this loss of livelihood were not properly considered and addressed, then it is likely that households would not comply with the ban on beach mining. Non-compliance would also mean that the company running the offshore mining operation would have to compete for business and might not achieve the sales needed to enable on-going production.
A key recommendation of this analysis was therefore that steps be taken to address this distribution issue, and also to introduce a public awareness plan to increase people’s knowledge and awareness about the environmental consequences of beach mining and the need to develop and use alternative supplies of sand and aggregate. Steps to address distributional issues could include, but are not limited to, assistance to affected families to help them develop alternative livelihoods; and/or access to aggregates at an affordable (subsidised) rate.
Providing (i) some further research was undertaken to confirm costs of production, (ii) environmental impacts of the dredging operation were closely monitored and (iii) steps were taken to address distributional issues, it was recommended that the Kiribati Government progresses the project to dredge aggregate from the lagoon and strengthen beach mining regulations.
24
COST−BENEFIT ANALYSIS FOR NATURAL RESOURCE MANAGEMENT IN THE PACIFIC: A GUIDE COST−BENEFIT ANALYSIS FOR NATURAL RESOURCE MANAGEMENT IN THE PACIFIC: A GUIDE
From an economic efficiency perspective, the project (or option within a project) that is the most desirable and should be selected is that which offers the highest NPV (refer Step 4). In cases where most or all of the costs and benefits have been quantified in the CBA, the most desirable option (or combination of options) is relatively straightforward to identify.
In other cases, some costs or benefits (such as environmental change) may not have been quantified and so are not reflected in the calculated NPV. Here, the project that is most desirable is that which appears to offer the most valuable combination of quantified (NPV) and unquantified (qualitatively described) benefits.
Importantly, a project which has the highest NPV in the central analysis but is highly risky may not in fact be an efficient use of resources − i.e. it may not actually deliver the NPV estimated in the CBA. Here risk refers to major findings from a sensitivity analysis (refer Step 5) and/or any major threats arising from significant inequalities/distributional implications (refer Step 6). In these situations, decision makers will need to be presented with information on the nature and extent of any risks associated with an option or options.
Recommendations should thus highlight:
• The project (or combination of projects) with the highest apparent NPV, highlighting any important non-quantified benefits or costs. Specific reasons why the quantitative findings from the CBA have been overridden or vice versa need to be made clear;
• Any major threats or assumptions that may affect the success of the project;
• Any major distributional issues; and − in light of this −
• Recommendations for next steps (such as potential changes to the project design etc.).
Recommendations for the Kiribati ESAT project based on the CBA are summarised in Box 11.
Writing the CBA reportBelow is a sample structure for a report on the CBA process and conclusions which may be prepared for decision makers. You may wish to also use additional products and modalities to communicate the results and findings of the CBA, for example, policy briefs, presentations, and cabinet submissions.
Executive summary. This provides:
• An outline of the outcome sought (that is, the CBA objective statement);
• A summary of options considered;
• Details of the recommended option, with the key supporting findings.
Objectives of the analysis. This section outlines:
• The problem identification;
• The policy intention, in terms of the Government’s priorities;
• Targets and intended outcomes which are specific, measurable, achievable and relevant;
• The reasons for government intervention to achieve the objective (i.e. why the project is required, and how this project addresses the problem).
COST−BENEFIT ANALYSIS FOR NATURAL RESOURCE MANAGEMENT IN THE PACIFIC: A GUIDE COST−BENEFIT ANALYSIS FOR NATURAL RESOURCE MANAGEMENT IN THE PACIFIC: A GUIDE
25
Summary of options. This section summarises:
• Each option assessed in detail, including how each option would address the outcome sought;
• Key assumptions common to all options, or specific to an individual option; and
• How the project would be implemented, including:
- the option recommended (e.g. whether a single option should proceed or which offers the highest potential net benefits);
- project accountability and management;
- consultation process for key stakeholders; and
- key dates and milestones for project implementation.
Data compilation and analysis. This section provides comparative data on the options (including the baseline), and details of the CBA analysis, in sufficient detail to allow decision makers to compare the options, including reasons for not preferring some options. At a minimum, this information should include:
• The results in summary form of the cost, benefit and risk analysis undertaken to arrive at the present value of each option;
• Assumptions and other information used to estimate the costs and benefits of each option;
• A description of non quantified factors;
• Sensitivity of the outcomes to changes in key assumptions;
• A matrix showing who receives the benefits from the project and who incurs the costs.
Summary of evaluation. This section summarises the key results of the CBA for each option, including some text outlining positive and negative factors for each option. It should include:
• The impact of sensitivity analysis on the results for each option;
• The risks associated with each option, measures to address these risks, and how the risks have been reflected in the values of the costs and benefits considered in the financial and economic analyses.
Conclusion and recommendations. This section identifies, from the evaluation, the option/s which would meet the outcome sought, and achieve a positive economic NPV. The reasons for recommending the preferred option are also set out in this section.
26
COST−BENEFIT ANALYSIS FOR NATURAL RESOURCE MANAGEMENT IN THE PACIFIC: A GUIDE COST−BENEFIT ANALYSIS FOR NATURAL RESOURCE MANAGEMENT IN THE PACIFIC: A GUIDE
REFERENCES Ambroz A. (2009) An economic feasibility assessment of lagoon dredging in Funafuti, Tuvalu. SOPAC Technical
Report ER137. SOPAC, Fiji.
Ambroz A. (2011) Niue Technical Report: least-cost analysis of water supply options in Niue. SOPAC Technical Report. SOPAC, Fiji.
Australian Government Department of Finance (2006) Handbook of Cost–Benefit Analysis. AGPS, Canberra, Australia.
Bell J., Johnson J., and Hobday A. (2011) Vulnerability of Tropical Pacific Fisheries and Aquaculture to Climate Change, Secretariat of the Pacific Community, Noumea, New Caledonia.Boardman N. (2006) Cost−Benefit Analysis, Concepts and Practice, 3rd edn. Prentice Hall, Upper Saddle River, NJ.
Bower J. (2012) Fairtrade certification of sugar cane in Vanua Levu, Fiji: an economic Assessment. SPC, Fiji.
Brouwer R. and Pearce D.W. (2005) Cost−Benefit Analysis and Water Resources Management. Edward Elgar, Cheltenham, UK.
Buncle A. (2013) Informing climate-resilient development: the application of cost–benefit analysis (CBA) in the Pacific Adaptation to Climate Change (PACC) programme Experiences and lessons learned on capacity building. PACC Technical Reports Nos 1 and 2. SPREP, Samoa. http://www.pacificclimatechange.net/index.php/eresources/documents?task=showCategory&catid=121
Daigneault A., Brown P., Greenhalgh S., Boudjelas S., Mather J., Nagle W., Aalbersberg W. (2013) Valuing the impact of selected invasive species in the Polynesia hotspot. Landcare Research Technical Report LC 1227 for Critical Ecosystem Partnership Fund. http://www.isinz.com/documents/CEPF-valuing-invasives.pdf
Emerton L. and Bos E. (2004) Value – counting ecosystems as an economic part of water infrastructure. IUCN, Gland, Switzerland and Cambridge, UK.
European Commission (1997) Manual: Financial and Economic Analysis of Development Projects: Methods and Instruments for Project Cycle Management. European Commission, Brussels, Belgium.
European Commission (2008a) Guide to Cost−Benefit Analysis of Investment Projects: Structural Funds, Cohesion Fund and Instrument for Pre-Accession. http://ec.europa.eu/regional_policy/sources/docgener/guides/cost/guide2008_en.pdf.
European Commission (2008b) European Community – Pacific Region: regional strategy paper and Regional Indicative Programme 2008–2013. http://ec.europa.eu/development/icenter/repository/scanned_r6_rsp-2007-2013_en.pdf (accessed 22 August 2012).
Evans, D., Kula, E., and Sezer, H. (2005) Regional welfare weights for the UK: England, Scotland, Wales and Northern Ireland, Regional Studies, 39(7): 923−937.
Gerber F. (2010) An economic assessment of drinking water safety planning Koror-Airai, Palau. SOPAC Technical Report 440. SOPAC, Fiji.
Gerber F. (2011) A preliminary economic assessment of integrated water resources management. Laura, Republic of the Marshall Islands.
Gerber F., Holland P. and Lal, P. (2011) The DCCEE-IUCN Project: assessing the social and economic value of climate change adaptation in the Pacific Region. Case study: water quality, quantity and sanitation improvements as an adaptation to climate change. Tuvalu – a preliminary assessment. Prepared for the Australian Department of Climate Change and Energy Efficiency (DCCEE). IUCN, Suva, Fiji.
Greer Consulting Services (2007) Economic analysis of aggregate mining on Tarawa – technical report. EU SOPAC Report 71a. SOPAC, Fiji.
Hajkowicz S., Tellames K. and Aitaro J. (2005) Economic cost scenarios for solid waste-related pollution in Palau. International Waters Project Palau, Koror, Palau.
COST−BENEFIT ANALYSIS FOR NATURAL RESOURCE MANAGEMENT IN THE PACIFIC: A GUIDE COST−BENEFIT ANALYSIS FOR NATURAL RESOURCE MANAGEMENT IN THE PACIFIC: A GUIDE
27
Hanley N. and Spash C. (1993) Cost−Benefit Analysis and the Environment. Edward Elgar, Cheltenham, UK.
Harrison M. (2010) Valuing the Future: the Social Discount Rate in Cost−Benefit Analysis. Productivity Commission, Canberra.
HM Treasury (2003) The Green Book: Appraisal and Evaluation in Central Government: Treasury Guidance, London. http://www.hm-treasury.gov.uk/data_greenbook_index.htm (accessed 28 August 2012).
Holland P. (2008) An economic analysis of flood warning in Navua. EU-SOPAC Project Report 122. SOPAC, Fiji.
International Waters Programme Kiribati and PCU (2005) Tarawa green bag scheme – Progress to date. International Waters Project, Kiribati.
Jacobs (2004) Economic valuation of coral reefs and adjacent habitats in American Samoa: Final Report. US Department of Commerce.
Lal P. and Cerelala A. (2005) Financial and economic analysis of wild harvest and cultured live coral and live rock in Fiji: a report prepared for the Foundation of the Peoples of the South Pacific International, Republic of Fiji Islands, the South Pacific Regional Environment Programme, Samoa and the Department of Environment, Ministry of Lands and Mineral Resources, Republic of Fiji Islands.
Lal P. and Fakau L. (2006) Economics of waste management in Tonga. A report prepared for the Tongan Government and IWP SPREP, Suva, Nukualofa and Apia.
Lal P. and Holland P. (2010) Economics of resource and environmental project management in the Pacific. IUCN and SOPAC, Gland, Switzerland and Suva, Fiji.
Lal P. and Keen M. (2002) Economic considerations in community-based project planning and implementation. International Waters Programme Technical Programme Technical Report No. 2002/05. SPREP, Samoa.
Lal P., Saloa K. and Uili L. (2007) Economic cost of liquid waste management in Funafuti, Tuvalu. IWP Pacific Technical Report No. 36. Apia, Samoa.
Lal P., Rita R. and Khatri N. (2009) Economic costs of the 2009 floods on the sugar belt. IUCN, Gland, Switzerland.
Manley M. (2013) Needs Assessment for CBA. GIZ (unpublished).
McGregor A, Kaoh P., Mariner L., Lal P. and Taylor M. (2011) Assessing the social and economic value of germplasm and crop improvement as a climate change adaptation strategy: Samoa and Vanuatu case studies. A background case study prepared for IUCN’s report, Climate Change Adaptation in the Pacific: Making Informed Choices, prepared for the Australian Department of Climate Change and Energy Efficiency (DCCEE). IUCN, Suva, Fiji.
Mishan E. (1988) Cost Benefit Analysis. London, Allen and Unwin.
OECD (2006) DAC guidelines and reference series applying strategic environmental assessment. Available online at: http://www.oecd.org/environment/environment-development/37353858.pdf
Pascal N. (2011) Cost−Benefit Analysis of community-based marine protected areas: 5 case studies in Vanuatu, South Pacific. Research report, CRISP–CRIOBE (EPHE/CNRS), Moorea, French Polynesia.
Pesce F. and Lal P. (2004) The profitability of forest certification in tropic hardwood plantation: a case study of the Kolambagarra Forest Products Ltd. from the Solomon Islands, EMD Discussion Paper 5. Economic Management and Development, Crawford School of Economics and Government, Canberra, Australia.
Sharp M. (2011) The benefits of fish aggregating devices in the Pacific. SPC Fisheries Newsletter, 135: 28–36.
Sinden J. and Thampapillai D. (1995) Introduction to Benefit–Cost Analysis. Longman, Melbourne, Australia.
SPREP (1999) Market report: SPREP honey bee project in a conservation area, Uafato village, Upolu, Samoa, August. Report prepared by Bioglobal Pacific Consultancy, Apia, Samoa.
SPREP (2001) Strategic Action Programme (SAP) for the international waters of the Pacific small Island Developing States, Inception report. SPREP project no. RAS/98/G32. SPREP, Apia, Samoa.
28
COST−BENEFIT ANALYSIS FOR NATURAL RESOURCE MANAGEMENT IN THE PACIFIC: A GUIDE COST−BENEFIT ANALYSIS FOR NATURAL RESOURCE MANAGEMENT IN THE PACIFIC: A GUIDE
Talagi D. (2011) An economic assessment of water safety planning. Niue, SOPAC Technical Report 443. SOPAC, Fiji.
Tietenberg T. (2006) Environment and Natural Resource Economics, 5th edn. Addison-Wesley Longman, Reading, MA, USA.
UNECE (2007) Final draft resource manual to support application of the UNECE Protocol on Strategic Environmental Assessment.
USEPA (2010) Guidelines for preparing economic analyses. Washington DC, Office of the Administrator. Report, EPA 240-R-10-001.
Vunisea A. (2005) Benefits and costs of the tuna industry: the case of the Marshall Islands. SPC Women in Fisheries Information Bulletin, 15: 3–6.
Wills I. (1997) Economics and the Environment: A Signalling Approach. Allen and Unwin, Sydney, Australia.
Woodruff A. (2007) Economic analysis of flood risk reduction measures for the lower Vaisigano Catchment Area, Samoa. EU EDF- SOPAC Report 69g. SOPAC, Fiji.
Zieroth G., Gaunavinaka L. and Forstreuter W. (2007) Biofuel from coconut resources in Rotuma: a feasibility study on the establishment of an electrification scheme using local energy resources. PIEPSAP, SOPAC, Fiji.
COST−BENEFIT ANALYSIS FOR NATURAL RESOURCE MANAGEMENT IN THE PACIFIC: A GUIDE COST−BENEFIT ANALYSIS FOR NATURAL RESOURCE MANAGEMENT IN THE PACIFIC: A GUIDE
COST−BENEFIT ANALYSIS FOR NATURAL RESOURCE MANAGEMENT IN THE PACIFIC: A GUIDE COST−BENEFIT ANALYSIS FOR NATURAL RESOURCE MANAGEMENT IN THE PACIFIC: A GUIDE
COST−BENEFIT ANALYSIS FOR NATURAL RESOURCE MANAGEMENT IN THE PACIFIC: A GUIDE COST−BENEFIT ANALYSIS FOR NATURAL RESOURCE MANAGEMENT IN THE PACIFIC: A GUIDE
31
APPENDIx 2. COST−BENEFIT ANALYSIS WORK PLANNING To help organise a CBA it is recommended to first prepare a work plan. CBA work plans essentially map out the types of information and that need to be collected, where the information will be collected from, and the timeline for undertaking the activities and preparing the report. CBA work plans are also a good way to facilitate inter-disciplinary involvement and input in the CBA process, which in turn helps to ensure all relevant information and data are included. This also promotes ownership and understanding of the CBA results and thus helps ensure that the CBA results and findings effectively inform decision-making.
If a consultant is being engaged to carry out the technical elements of the CBA, it is recommended that the project management team first develops the CBA work plan. This will clarify for managers the types of information and issues that should be considered in the consultancy and promote ownership of expected outcomes.
A template for developing a CBA work plan is provided below.
1. Determine the objectives of the CBA
Problem Write a short description of the problem that the project is trying to address. This should include information on the nature and extent of the problem, making sure to reference sources of this information.
• Causesoftheproblem
- Typically, there are multiple causes and drivers contributing to a given problem. List the main causes and drivers of the problem under consideration and include a preliminary appraisal of the relative importance of each of these causes and drivers.
- The changing frequency and intensity of climate variables (e.g. rainfall, cyclone) should be included here as one of the potential drivers of the problem (i.e. climate change risk considerations). This may be a large or small part of the problem at hand.
• Aimoftheproject
- Write a short statement of the project aim. If possible, this aim should be specific and directly linked to one or more of the causes of the problem.
- were identified through a thorough process, including review of what has been done in other parts of the country and the broader Pacific region as well as consultations with communities;
32
COST−BENEFIT ANALYSIS FOR NATURAL RESOURCE MANAGEMENT IN THE PACIFIC: A GUIDE COST−BENEFIT ANALYSIS FOR NATURAL RESOURCE MANAGEMENT IN THE PACIFIC: A GUIDE
- clearly align with the project aim (and causes/drivers of the problem);
- are feasible given the budget constraint for the project (if applicable);
- options are clearly distinguishable from one another;
- there are enough options identified to provide the decision maker with real scope for exercising choice.
For most CBAs, the primary objective is to determine whether the benefits of a project option outweigh its cost and by how much relative to other alternative options. The purpose of this is to: (i) determine whether the proposed project is (or was) a sound investment; and/or (ii) compare between alternative project options (by ranking and prioritising the options).
There may also be other objectives of the CBA that are specific to the problem or project options under consideration, which should also be incorporated. For example, the party commissioning the analysis may also be interested in understanding potential environmental impacts of a project proposal and, if substantial, what design modifications can be made or complementary measures introduced to improve the project.
The objectives of the CBA should be clearly and correctly specified at the outset, and all parties involved should agree on them. This provides the direction for the analysis work.
2. Identify the costs and benefits – with-and-without analysisThis section lists the various costs and benefits that need to be considered for each of the options identified to achieve the stated project objective (and thus address the identified problem). Importantly, one of the options should be the status quo or baseline scenario (i.e. costs and benefits that will be experienced if none of the project options is implemented − the without-project scenario).
Summarise this information in a with-and-without analysis table:
The left hand column of this table qualitatively describes what inputs, outputs, and outcomes/impacts relevant to the project problem are expected to be experienced without any project options being implemented. That is, what would likely happen if we just followed ‘business as usual’ taking into consideration any trends observed for the relevant impacts/outcomes, trends observed for the identified causes and drivers of the problem including population growth, and whether any other activities are planned which seek to address the same or similar problems in the same area.
COST−BENEFIT ANALYSIS FOR NATURAL RESOURCE MANAGEMENT IN THE PACIFIC: A GUIDE COST−BENEFIT ANALYSIS FOR NATURAL RESOURCE MANAGEMENT IN THE PACIFIC: A GUIDE
33
The right hand columns of the table describe these same inputs, outputs and outcomes/impacts for the scenario where the proposed project options are implemented relative to the without-project scenario (i.e. what changes the project will result in against ‘business as usual’). The right hand columns also include the additional inputs required to implement the project options. These are the up-front (i.e. capital) and operational costs of the project option.
The right hand columns further include any other outcomes or impacts associated with the project options that are either not the intended focus of the project or are experienced by third party stakeholder groups. These can be either positive (a benefit) or negative (a cost).
3. Measure and value the costs and benefits This section should detail the data or information needed to estimate each of the costs and benefits identified in the with-and-without analysis, and list where this data or information can be sourced. It should also state the intended method that will be used to value each of the cost and benefit items identified.
Summarise this information in a table like the one below.
Project option 1
Cost/benefit Valuation method Data required Source of data
Cost 1
Cost 2
Benefit 1
Benefit 2
Note that, some cost and benefit items may be too abstract to measure or too small a consideration to justify going to the effort of collecting data and undertaking valuation analysis. For these such items, the table should list ‘qualitatively describe and discuss’ and briefly outline the reasons why this item will not be valued in monetary terms.
4. Aggregate the costs and benefitsThis section details how costs and benefits will be aggregated over time. Key points include:
• the choice of discount rate;
• the (economic efficiency) measures that will be estimated (most commonly for government projects this is net present value (NPV) and benefit−cost ratio (BCR)); and
• how options with different life-spans will be compared.
34
COST−BENEFIT ANALYSIS FOR NATURAL RESOURCE MANAGEMENT IN THE PACIFIC: A GUIDE COST−BENEFIT ANALYSIS FOR NATURAL RESOURCE MANAGEMENT IN THE PACIFIC: A GUIDE
5. Conduct a sensitivity analysis• List key parameters (e.g. length of drought period) where there is a significant amount of
uncertainty;
• Describe how these uncertainties will be tested through a sensitivity analysis, e.g. through testing of upper and lower bound values of these parameters;
• Outline the basis for selecting values used in the sensitivity analysis.
6. Consider equity and distributional implicationsIdentify which stakeholder groups will incur costs and which stakeholder groups will accrue benefits for each major cost and benefit category.
Summarise this information in a table like the one below.
Cost/benefit Stakeholder group 1 Stakeholder group 2 Stakeholder group 3
Cost 1
Cost 2
Benefit 1
Benefit 2
Comment/assess whether impacts on certain stakeholder groups may merit special consideration (e.g. costs borne by low socio-economic groups).
Further comment on whether distributional effects will likely cause political or other issues that may threaten the successful implementation of the project, and could benefit from refinements to project design.
Timeline
Action Date Responsibility
Data collection
Data analysis
Draft CBA report
Peer review
Final CBA report
Briefing paper on CBA report
Presentation on CBA report to xyz
Incorporation of CBA report results and findings in project proposal and cabinet submission
COST−BENEFIT ANALYSIS FOR NATURAL RESOURCE MANAGEMENT IN THE PACIFIC: A GUIDE COST−BENEFIT ANALYSIS FOR NATURAL RESOURCE MANAGEMENT IN THE PACIFIC: A GUIDE
35
APPENDIx 3. GENERIC TERMS OF REFERENCE FOR A COST−BENEFIT ANALYSIS CONSULTANCY TERMS OF REFERENCECost-BenefitAnalysisoftheproject:
The [country] Government seeks to hire an Economist to undertake a cost−benefit analysis (CBA) of [project/options]. This is to be done in collaboration with a team of [country] Government officials.
Background:
Describe background of project here.
Approachtocost−benefitanalysis:
The [country] Government is developing capacity in the use of CBA to help improve the quality of project proposals and related investment decisions.
An inter-disciplinary team has been formed to conduct a CBA of the [project] proposal. A draft work plan has also been developed by the ‘[project] CBA team’ to help do this. A copy of this draft CBA work plan is in Attachment 1.
TheintentionoftheCBAworkplanisto:
• ensure there is agreement amongst the [project] CBA team on key elements of the analysis − for example, objective) of CBA and valuation technique used;
• facilitate engagement of the [project] CBA team in the conduct of the [project] CBA and thereby contributing to CBA capacity building objectives;
• ensure all relevant information and data is inputted to the analysis;
• ensure timely delivery of analysis; and
• maximise understanding and ownership of CBA findings by the [project] CBA team and thus the usefulness of the CBA for informing decision making.
Objectivesandpurposeoftheassignment:
The main purpose of this assignment is to assist the [project] CBA team and the [country] Government to conduct a CBA of options identified for the [project] proposal. This assignment is to build on the draft CBA work plan already developed for the [project].
• building capacity in [country] Government to conduct CBAs;
• completing good quality CBAs, needed to inform selection/design/evaluation of [project] option(s).
• [also list any other objectives of the CBA]
36
COST−BENEFIT ANALYSIS FOR NATURAL RESOURCE MANAGEMENT IN THE PACIFIC: A GUIDE COST−BENEFIT ANALYSIS FOR NATURAL RESOURCE MANAGEMENT IN THE PACIFIC: A GUIDE
Keyactivitiestobecarriedout:
The overarching activity is to assist and advise the [project] CBA team in implementing the draft CBA work plan.
Key activities under the draft CBA work plan include to:
• Revise and finalise the CBA work plan1;
• Prepare a draft CBA report;
• Prepare a final CBA report;
• Prepare a PowerPoint presentation summarising the CBA report and key insights;
• [optional] Prepare a Ministerial Briefing summarising the CBA method, results, and recommendations/conclusions;
• [optional] Prepare a Cabinet Submission for the project proposal, incorporating key CBA information; and
• [optional] Prepare a donor proposal for the project, incorporating key CBA information.
CBA reports are not expected to be extensive − approximately 15 pages, excluding annexes. Reports should be clear and succinct, and use simple and understandable language.
Qualificationsofexperts:
A consultant with the following qualifications and experience shall be engaged to undertake the assignment:
• International/regional/local consultants with academic and professional competencies in the economics and fields related to [sector/issue/problem];
• Over 7 years of experience in assessing and supporting community-based development and related institutional processes;
• Familiarity and experience with the challenges that developing countries and small island states face in [sector/field];
• Very good knowledge of [country] and preferably have worked in [country] and understand physical/geological, social and economic situations; and
• Excellent written and oral communication skills.
Reporting:
The consultant will, in collaboration with the [project] CBA team, prepare and submit/present the following to [lead Government agency/contract manager]:
• A presentation to key government and non-government stakeholders at the start of the country visit. This will outline the purpose of the CBA exercise and the planned activities to complete it, including stakeholder consultation activities [date];
• A revised CBA work plan [date];
1 The final CBA work plan should be sufficiently developed such that the nature and extent of the problem the project is trying to address is clearly demonstrated; the causes and drivers of the problem are well-understood; the objective(s) of the project is clear and specific; and the options identified are appropriate. It should also specify data collection needs, sources of this data, and valuation techniques to be used and justifications for this, among other things.
COST−BENEFIT ANALYSIS FOR NATURAL RESOURCE MANAGEMENT IN THE PACIFIC: A GUIDE COST−BENEFIT ANALYSIS FOR NATURAL RESOURCE MANAGEMENT IN THE PACIFIC: A GUIDE
37
• A second presentation to key government and non-government stakeholders at the end of the country visit. This will outline preliminary findings of the CBA and remaining steps to complete the CBA and the process to be followed for using CBA findings to inform decision making [date];
• A draft CBA report [date];
• A final CBA report [date];
• A presentation summarising the final CBA report [date].
Proposedschedule:
The assignment will be initiated by [date]. It will be for a period up to [number] days and will comprise:
• [number] days background research pre-country visit;
• [number] days in-country collaborating with the [project] CBA team. This will be some time between [date] and [date];
• [number] days travel to and from [country];
• [number] days post-country visit to finalise report [date];
• [number] days for any unexpected work tasks (to be agreed by contract manager).
38
COST−BENEFIT ANALYSIS FOR NATURAL RESOURCE MANAGEMENT IN THE PACIFIC: A GUIDE COST−BENEFIT ANALYSIS FOR NATURAL RESOURCE MANAGEMENT IN THE PACIFIC: A GUIDE
AP
PEN
DIx
4. M
ETH
OD
S FO
R V
ALU
ING
CO
STS
AN
D B
ENEF
ITS
IN
ECO
NO
MIC
AN
ALY
SES
Ass
essm
ent a
ppro
ach
Met
hod
Des
crip
tion
Exam
ple
Mar
ket
pric
e us
ed t
o es
timat
e va
lue
whe
re i
nput
s an
d ou
tput
s ar
e re
adily
ava
ilabl
e in
a m
arke
t se
ttin
g, s
uch
as
taro
or
bana
nas
prod
uced
dur
ing
an a
gric
ultu
re p
roje
ct.
Mar
ket
pric
es
are
gene
rally
ap
plie
d to
ta
ngib
le
good
s an
d se
rvic
es.
Labo
ur w
ages
and
cap
ital
cost
s ca
n al
so b
e de
term
ined
from
mar
ket p
rice
s.
Mar
ket p
rice
The
amou
nt i
t co
sts
to b
uy,
or w
hat
it is
w
orth
to s
ell a
goo
d or
ser
vice
in a
mar
ket
The
pric
e of
tar
o or
ban
anas
at
the
loca
l m
arke
t
Cos
t ba
sed
appr
oach
es e
stim
ate
the
valu
e of
goo
ds a
nd
serv
ices
tha
t m
ay b
e ha
rmed
by
a pr
opos
ed a
ctiv
ity.
That
is
, the
cos
t to
acq
uire
the
ser
vice
s A
ny s
ome
othe
r m
eans
in
dica
tes
the
valu
e of
the
ben
efits
(lo
st)
from
the
ser
vice
. Th
is i
s do
ne b
y as
sess
ing
the
cost
of
othe
r pr
oduc
ts,
infr
astr
uctu
re
or
tech
nolo
gies
th
at
wou
ld
need
to
be
ac
quir
ed to
rep
lace
thos
e go
ods
and
serv
ices
.
Miti
gativ
e an
d av
ertiv
e ex
pend
iture
s
The
cost
to
miti
gate
or
aver
t ec
onom
ic
loss
es r
esul
ting
from
the
loss
of a
spe
cific
go
od o
r se
rvic
e
Hou
seho
ld s
urve
ys o
n tim
e an
d m
oney
sp
ent f
or h
ealt
hcar
e
Dam
age
cost
sTh
e va
lue
a go
od o
r se
rvic
e pr
ovid
es b
y re
duci
ng th
e da
mag
e th
at w
ould
oth
erw
ise
have
oc
curr
ed
unde
r an
al
tern
ativ
e sc
enar
io
Red
uced
dam
age
to c
rop
yiel
ds b
y in
vasi
ve
spec
ies
as a
res
ult
of a
nint
egra
ted
pest
co
ntro
l pro
gram
me
Rep
lace
men
t co
sts
The
valu
e of
a g
ood
or s
ervi
ce is
det
erm
ined
by
es
timat
ing
the
cost
of
m
an-m
ade
prod
ucts
, in
fras
truc
ture
or
te
chno
logi
es
that
cou
ld r
epla
ce a
non
-mar
ket
good
or
serv
ices
The
cost
of
a se
awal
l is
use
d as
a p
roxy
to
est
imat
e th
e be
nefit
of
man
grov
es f
or
coas
tal p
rote
ctio
n
Pro
duct
ion
func
tion
ap
proa
ches
es
timat
e th
e va
lue
of
good
s an
d se
rvic
es a
ffec
ted
by a
n ac
tivity
by
draw
ing
on th
e co
st o
f mar
kete
d ac
tiviti
es th
at h
ave
sim
ilar
effe
cts.
Pro
duct
ion
func
tion
The
rela
tions
hip
betw
een
chan
ges
in t
he
qual
ity o
r qu
antit
y of
a p
artic
ular
goo
d or
se
rvic
e w
ith c
hang
es i
n th
e m
arke
t va
lue
of p
rodu
ctio
n
Valu
e of
ad
ditio
nal
clea
n w
ater
to
a
com
mun
ity
estim
ated
fr
om
the
cost
of
co
nstr
uctin
g ra
inw
ater
tank
s
Trav
el c
ost
met
hod
Surv
ey
or
obse
rvat
ions
ar
e us
ed
to
calc
ulat
e th
e va
lue
of
a re
crea
tiona
l ex
peri
ence
from
trip
s to
a p
artic
ular
site
How
muc
h vi
sito
rs a
re w
illin
g to
pay
for
ac
cess
to
a re
sour
ce,
cons
ider
ing
trav
el
time,
fuel
, lod
ging
, and
ent
ry fe
es
COST−BENEFIT ANALYSIS FOR NATURAL RESOURCE MANAGEMENT IN THE PACIFIC: A GUIDE COST−BENEFIT ANALYSIS FOR NATURAL RESOURCE MANAGEMENT IN THE PACIFIC: A GUIDE
39
Surr
ogat
e m
arke
t app
roac
hes
draw
on
the
valu
e of
(rel
ated
) go
ods
that
are
mar
kete
d to
est
imat
e th
e va
lue
of t
he n
on-
mar
kete
d go
ods.
Hed
onic
pr
icin
gM
arke
t tr
ansa
ctio
ns
are
com
pare
d fo
r go
ods
or
serv
ices
th
at
diff
er
prim
arily
be
caus
e of
the
infl
uenc
e of
the
non-
mar
ket
good
or
serv
ice
that
is o
f int
eres
t
Sale
s pr
ices
of
si
mila
r ho
mes
co
uld
be
com
pare
d w
here
so
me
over
look
a
heal
thy
salt
mar
sh a
nd o
ther
s do
not
. Thi
s co
mpa
riso
n co
uld
estim
ate
the
valu
e of
th
e sa
lt m
arsh
to
the
mar
ket
valu
e of
the
ho
mes
that
sur
roun
d it
Stat
ed
pref
eren
ce
appr
oach
es
typi
cally
su
rvey
-bas
ed
appr
oach
es w
here
sta
keho
lder
s ar
e as
ked
to s
tate
the
ir
pref
eren
ces
for
trad
ing
off
cost
s an
d be
nefit
s fo
r w
ell-
defin
ed s
cena
rios
or
activ
ities
. The
app
roac
h ca
n si
mul
ate
a m
arke
t by
estim
atin
g a
cons
umer
’s w
illin
gnes
s to
pay
for
a go
od o
r se
rvic
e or
thei
r w
illin
gnes
s to
acc
ept c
ompe
nsat
ion
to to
lera
te a
neg
ativ
e or
bad
eco
nom
ic o
utco
me.
Con
tinge
nt
valu
atio
nSu
rvey
s ar
e us
ed
to
help
re
spon
dent
s es
timat
e pe
rson
al w
illin
gnes
s to
pay
for
no
n-m
arke
t goo
ds o
r se
rvic
es
Pho
ne
surv
ey
on
will
ingn
ess
to
pay
to
prot
ect n
ativ
e fo
rest
Cho
ice
expe
rim
ents
Stak
ehol
ders
ar
e gi
ven
a se
ries
of
al
tern
ativ
e op
tions
, ea
ch
of
whi
ch
is
defin
ed
by
vari
ous
attr
ibut
es
incl
udin
g pr
ice,
am
eniti
es, a
nd q
ualit
y
In-p
erso
n su
rvey
on
will
ingn
ess
to p
ay fo
r va
riou
s de
gree
s of
wat
er q
ualit
y
Ben
efit
tran
sfer
Estim
ate
of v
alue
der
ived
fro
m a
stu
dy o
f on
e ar
ea c
an b
e ad
apte
d fo
r us
e in
ano
ther
ar
ea
The
valu
e of
fis
hing
tha
t w
ill r
esul
t fr
om
the
rest
orat
ion
of f
ishe
ries
in
Nad
i co
uld
be
estim
ated
us
ing
stud
ies
of
sim
ilar
fishe
ries
nea
r La
utok
a (b
oth
in w
este
rn
Viti
Levu
, Fiji
)
40
COST−BENEFIT ANALYSIS FOR NATURAL RESOURCE MANAGEMENT IN THE PACIFIC: A GUIDE COST−BENEFIT ANALYSIS FOR NATURAL RESOURCE MANAGEMENT IN THE PACIFIC: A GUIDE
APPENDIx 5. ALTERNATIVE EFFICIENCY MEASURES There are several different methods that can be used to compare relative costs and benefits besides using NPV. Three common alternatives are the benefit-cost ratio (BCR), the internal rate of return (IRR), and cost-effectiveness analysis (CEA).
BCR is the ratio of the NPV of benefits associated with an activity, relative to the NPV of the costs of the same activity. The ratio indicates the benefits expected for each dollar of costs. This ratio is not an indicator of the magnitude of net benefits though, as two projects with the same BCR can have vastly different estimates of benefits and costs. In general, any project with a BCR greater than 1 should be considered a viable alternative.
The IRR is the maximum discount rate that could be applied to all monetised costs and benefits for a project that would still allow for it to break even (i.e. to have an NPV of zero). In the case study example for calculating NPV, we saw that the project with an assumed discount rate of 8% yielded a net benefit of $44,100. Calculating the IRR for that same project would reveal that the discount rate would have to be about 35% for the activity to break even, or yield no net benefits. Because the IRR is estimated to be quite high, it reinforces that this option should be preferred over the do-nothing scenario.
CEA is an approach often used to rank intervention options when one cannot derive monetary benefits from key categories in a given project. In this approach, monetary costs of options are typically compared with physical changes (benefits). Examples of when CEA could be used include:
• Health benefits: cost per lives saved from hazard mitigation (e.g. flood control);
• Environmental benefits: cost per unit reduction of pollution (e.g. GHG emissions);
• Conservation: cost per species or geographic area protected (e.g. native birds, conservation park).
Cost-effectiveness is estimated by dividing the NPV of the costs of an intervention by a non-monetised benefit category to estimate the average cost per unit of the benefit created from a given intervention. This ratio can then be used to rank options in terms of cost per physical unit of benefit. This is expressed mathematically as:
0
T
( )
Benefit
T
tt
PV CostsCE
0
T
( )
Benefit
T
tt
PV CostsCE
0
T
( )
Benefit
T
tt
PV CostsCE
Where CE is the cost-effectiveness of the project option, PV is discounted (present day) monetised values over the lifetime of the project. The smaller the CE ratio, the greater is the cost-effectiveness of an intervention.
CEA is different from CBA in various ways. First, the benefits are expressed in physical units and not monetary units. Second, the need to divide by a physical unit means that the options being assessed must be similar in nature. Third, the theory of discounting is only applied to the monetary cost component of the estimate. This means that the effectiveness component of the calculation for each option must be consistently estimated at the same point in time.
COST−BENEFIT ANALYSIS FOR NATURAL RESOURCE MANAGEMENT IN THE PACIFIC: A GUIDE COST−BENEFIT ANALYSIS FOR NATURAL RESOURCE MANAGEMENT IN THE PACIFIC: A GUIDE
41
An example of how to use CEA to assess two options for a forest conservation project is shown in the box.
Estimating the most cost-effective option for forest conservation
Consider the following example where two specific areas in two forests are being considered for forest conservation and species protection. One is 17 hectares and the other is 10 hectares. Option 1 produces an annual stream of timber that creates an NPV of $2,000 over the next 30 years. Option 2 produces an annual stream of timber that creates an NPV of $3,000 over the next 30 years. Protecting the forest would remove the timber from production and hence be considered a cost.
Activity NPV ($) Area protected (ha) Cost-effectiveness ($/ha)
Option 1 2000 10 200
Option 2 3000 17 176
Despite the impact on the local economy, the government still sees a benefit from protecting the forest and is willing to compensate landowners for their loss in production. In many cases, analysts will not have the data to put a non-market value on the benefit of protecting the forest, so they must resort to a CEA to guide their decision making. However, their budget of $3000 is only large enough to implement one of the projects. Option 1 costs $200 per ha protected, while Option 2 costs $176 per ha. Based purely on cost-effectiveness, Option 2 is the preferred option.
COST−BENEFIT ANALYSIS FOR NATURAL RESOURCE MANAGEMENT IN THE PACIFIC: A GUIDE
42
COST−BENEFIT ANALYSIS FOR NATURAL RESOURCE MANAGEMENT IN THE PACIFIC: A GUIDE
APPENDIx 6. TIPS FOR COST−BENEFIT ANALYSIS Common misconceptions
False Fact
Discounting is done to remove inflation Discounting is conducted to reduce all money values to a single point in time
Because CBA puts everything in $$ terms, it doesn’t capture important environmental and social factors
A CBA framework should consider all costs and benefits. Valuing social and environmental costs and benefits may be more difficult but all benefits and costs should at least be described in a CBA. That way even those that are not valued in money terms can be considered.
Important values can also be weighted where valuation is not possible to ensure that they are given appropriate consideration in decision-making
Only economists are involved in conducting a CBA
A good CBA should involve a multi-disciplinary team since they will act as key sources of data. The analysis will only be as good as the technical data and information underpinning it
Include or exclude?
Benefits Include all benefits in the year they occur
Costs Include all costs in each year they occur (capital, labour, operating, maintenance, training and all other input costs)
Environmental and other externality costs Include
Capital (credit) costs Include when capital is invested
Depreciation Exclude (because these are accounting charges)
Taxes Generally exclude
Subsidies on production cost Generally exclude
Government or donor costs Include
Family labour Include as opportunity cost
Unpriced benefits and costs Include
Environmental and health costs Include
Source: Adapted from Australian Government Department of Finance (2006), Sinden and Thampapillai (1995, p. 61).
COST−BENEFIT ANALYSIS FOR NATURAL RESOURCE MANAGEMENT IN THE PACIFIC: A GUIDECOST−BENEFIT ANALYSIS FOR NATURAL RESOURCE MANAGEMENT IN THE PACIFIC: A GUIDE
44
COST−BENEFIT ANALYSIS FOR NATURAL RESOURCE MANAGEMENT IN THE PACIFIC: A GUIDE COST−BENEFIT ANALYSIS FOR NATURAL RESOURCE MANAGEMENT IN THE PACIFIC: A GUIDE