1 Investing in Agriculture: Queensland Scenario 1 Cost-benefit analysis of current and proposed dams in GBR catchments 1. Introduction The recently released Agricultural Competiveness Green Paper outlines the policies, investment priorities and other options the Australian Government will consider introducing to achieve its goal of boosting the competiveness and profitability of Australia’s agricultural sector. Among other necessary infrastructure, the Green Paper states that boosting agricultures competiveness and profitability is dependent on improved access to reliable water supplies, which could be achieved by using existing water resources more efficiently or by developing new water supply infrastructure such as dams. To accelerate the development of new water supply infrastructure, the Minister for Agriculture’s working group has identified a number of water infrastructure projects across the country, which it recommends the Australian Government should consider funding. In Queensland, the Minister’s working group has identified nine potential water supply infrastructure projects; five of which are located within the Great Barrier Reef Catchment Area (GBRCA). Of the proposed water supply projects in the GBRCA, Nathan Dam on the Dawson River in the Fitzroy Basin has been prioritized as warranting future consideration of possible capital investment by the Australian Government, whilst the proposed Connors River Dam, Lower Fitzroy River Infrastructure, Raising Burdekin Falls, Urannah Dam and Water For Bowen projects have been identified as being likely to be suitable for further consideration for possible assistance provided by the Australian Government to accelerate feasibility studies, cost benefit analysis or design. Alongside the Australian Governments initiatives to boost agriculture, the Queensland Government is currently developing and implementing measures to achieve its election commitment of doubling agricultural production across the state by 2014. 2. Lessons from the past When considering new water supply infrastructure, it is essential that lessons and experiences from the past must inform future decisions. For example, key issues arising from existing water supply infrastructure that must be considered when considering new proposals include:
Transcript
1
Investing in Agriculture: Queensland Scenario 1
Cost-benefit analysis of current and proposed
dams in GBR catchments
1. Introduction The recently released Agricultural Competiveness Green Paper outlines the
policies, investment priorities and other options the Australian Government will
consider introducing to achieve its goal of boosting the competiveness and
profitability of Australia’s agricultural sector.
Among other necessary infrastructure, the Green Paper states that boosting
agricultures competiveness and profitability is dependent on improved access to
reliable water supplies, which could be achieved by using existing water
resources more efficiently or by developing new water supply infrastructure
such as dams.
To accelerate the development of new water supply infrastructure, the Minister for Agriculture’s working group has identified a number of water infrastructure projects across the country, which it recommends the Australian Government should consider funding. In Queensland, the Minister’s working group has identified nine potential water supply infrastructure projects; five of which are located within the Great Barrier Reef Catchment Area (GBRCA).
Of the proposed water supply projects in the GBRCA, Nathan Dam on the Dawson River in the Fitzroy Basin has been prioritized as warranting future consideration of possible capital investment by the Australian Government, whilst the proposed Connors River Dam, Lower Fitzroy River Infrastructure, Raising Burdekin Falls, Urannah Dam and Water For Bowen projects have been identified as being likely to be suitable for further consideration for possible assistance provided by the Australian Government to accelerate feasibility studies, cost benefit analysis or design.
Alongside the Australian Governments initiatives to boost agriculture, the Queensland Government is currently developing and implementing measures to achieve its election commitment of doubling agricultural production across the state by 2014.
2. Lessons from the past When considering new water supply infrastructure, it is essential that lessons and experiences from the past must inform future decisions. For example, key issues arising from existing water supply infrastructure that must be considered when considering new proposals include:
2
Whether existing water supply schemes are financially viable
Whether projected economic benefits have been achieved
Have the costs of mitigating resulting environmental impacts been adequately incorporated within the construction and operating costs of existing water supply infrastructure
To provide an example, WWF-Australia recently commissioned a consultant to
undertake basic economic analysis of two existing water supply infrastructure
(Burdekin Falls and Paradise Dams) and two proposed water supply
infrastructure projects (Nathan and Urannah Dams) located within the Great
Barrier Reef Catchment Area (GBRCA).
3. Economic analysis approach The approach taken to ascertain the broad costs and benefits associated with existing and proposed water supply infrastructure utilises a benefit costs analysis framework over a 30-year timeframe, which includes:
The economic viability from the point of a commercial investment in a farm (i.e. would it make sense for a farmer to invest in a new irrigation enterprise?). This includes covering all water charges including a rate of return on the assets.
A broader assessment of the costs of externalities, particularly those impacting on the GBR. These can be determined by utilising estimated TSS and DIN loads from agriculture production multiplied by the costs of avoided abatement if the agricultural expansion did not proceed. Abatement costs utilised in our analysis are based on Australian Government 2014 figures (cost/tonne of sediment is between $42 and $2,600 and cost/tonne of DIN is between $22,000 to $117,000)
It should be noted that the outcomes of our analysis is based on extremely
limited publicly available information and therefore should be considered as
purely indicative only. However, the findings of our analysis clearly
demonstrates the critical need that robust, transparent and independent analysis
of proposed water supply infrastructure is conducted to ensure that informed
decisions can be made.
4. Impacts of agriculture development and dams Excessive vegetation clearing and catchment hydrological changes that has occurred since European settlement as a result of agriculture and other development activities has caused terrestrial and marine water quality to decline, which in turn has severely degraded the ecological health of the GBR.
Notwithstanding recent modest improvements, the causes of adverse impacts to
terrestrial and marine water quality from agricultures existing extent and
current practices within the GBRCA remain largely unresolved.
3
As the adverse impacts caused to the GBR by agriculture’s existing scale and
practices have not been fully resolved, increasing the extent of agricultural
production and the development of new water supply infrastructure will further
degraded the ecological condition and resilience of the GBR unless new
agricultural development and water supply infrastructure are properly planned,
regulated and utilise leading edge best management practices.
In addition to environmental impacts, increasing agricultural production and
developing new water supply infrastructure in the GBRCA can also cause a range
of adverse economic and financial impacts. To ensure adverse economic and
financial impacts are avoided, new water supply infrastructure is required to
comply with Queensland Treasury Guidelines and COAG Water Resource Policy
Principles.
3. Queensland Treasury Guidelines Introduced in 2000, the Queensland Treasury for the Financial and Economic Evaluation of New Water Infrastructure requires that both a financial and economic assessment be conducted for water supply infrastructure projects to ascertain whether the proposed project is economically viable and to also determine the cost recovery terms and community services obligations attached to the project.
4. COAG Water Resource Policy Principles
Under section 3(a)(i) of the Water Resource Policy established under the 1994
National Water Reform Framework, the Council of Australian Governments
(COAG) agreed to adopt a national water pricing framework based on principles
of consumption based pricing, full-cost recovery and removal of cross-subsidies
that hinder efficient and effective service delivery and use. If they continue,
remaining cross-subsidies must be transparent.
To comply with COAG requirements, all costs associated with constructing and
operating any new water supply infrastructure must be fully recovered from the
beneficiaries of the project.
5. Economic analysis of existing water supply infrastructure
5.1 Paradise Dam Completed in late 2005, Paradise Dam located on the Burnett River near
Bundaberg is the last dam constructed in Queensland outside of the SEQ region.
Commissioned by the Queensland Government at a cost of $240million, the
purpose of Paradise dam was to stimulate the region’s economy by improving
the reliability of existing water allocations and provide additional water to
enable increasing agricultural production and other economic development
opportunities across the region.
4
At Full Supply Level (FSL), Paradise Dam has a storage capacity of 300,000ML,
which yields 20,000 ML of High Priority allocations and 124,000 ML of Medium
Priority allocations.
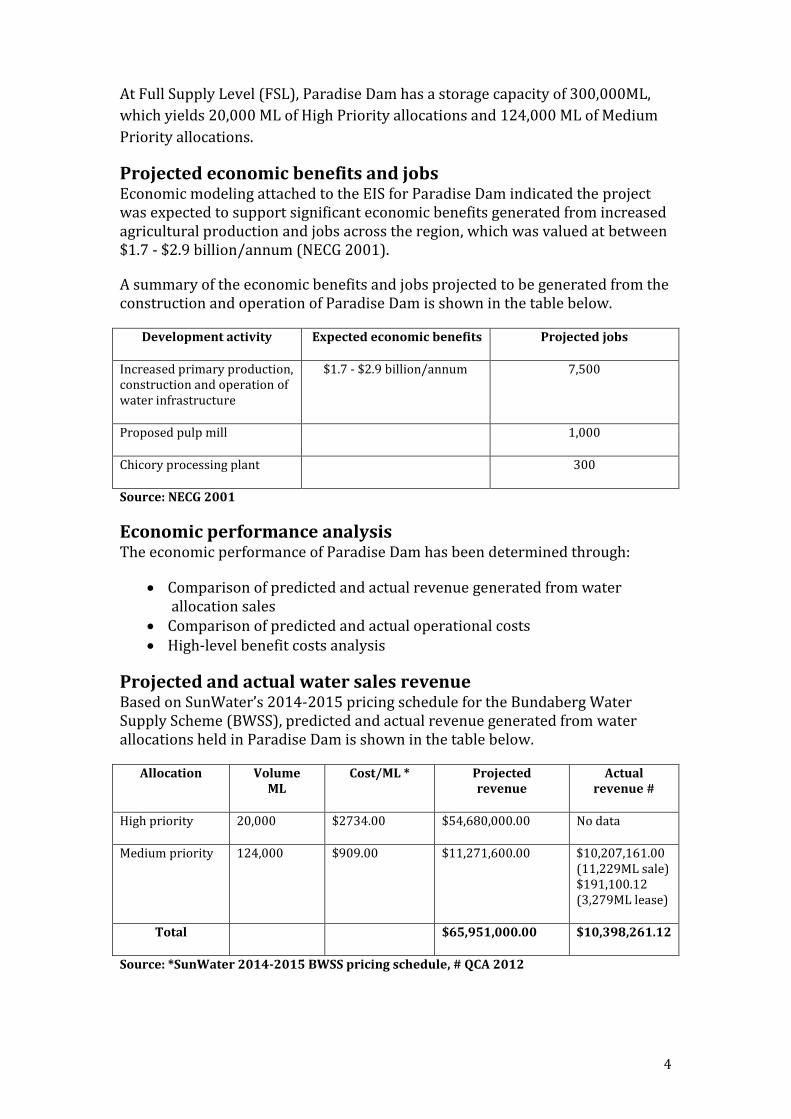
Projected economic benefits and jobs Economic modeling attached to the EIS for Paradise Dam indicated the project was expected to support significant economic benefits generated from increased agricultural production and jobs across the region, which was valued at between $1.7 - $2.9 billion/annum (NECG 2001).
A summary of the economic benefits and jobs projected to be generated from the construction and operation of Paradise Dam is shown in the table below.
Development activity Expected economic benefits Projected jobs
Increased primary production, construction and operation of water infrastructure
$1.7 - $2.9 billion/annum 7,500
Proposed pulp mill 1,000
Chicory processing plant 300
Source: NECG 2001
Economic performance analysis The economic performance of Paradise Dam has been determined through:
Comparison of predicted and actual revenue generated from water allocation sales
Comparison of predicted and actual operational costs High-level benefit costs analysis
Projected and actual water sales revenue Based on SunWater’s 2014-2015 pricing schedule for the Bundaberg Water Supply Scheme (BWSS), predicted and actual revenue generated from water allocations held in Paradise Dam is shown in the table below.
Allocation Volume ML
Cost/ML *
Projected revenue
Actual revenue #
High priority 20,000 $2734.00 $54,680,000.00 No data
Estimated and actual operational costs Annual estimated operational costs for Paradise Dam contained in the NECG Economic Impact Assessment (2001) are shown in the table below.
Year 2005 2006 2007 2008 2009 2010 2011 2012
Estimated operational costs *
$870, 000
$870, 000
$870, 000
$870, 000
$870, 000
$870, 000
$870, 000
$870, 000
Actual operational costs #
No data
No data
$406, 371.53
$1,036, 286.75
$1,716, 798.77
$2,510, 270.52
$2,751, 441.63
$2,544, 666.71
Source: *NEGC 2001, # Sunwater data obtained through a 2012 RTI request
Comparison of estimated and actual operational costs A comparison of the projected and actual annual costs associated with operating and maintaining Paradise Dam is shown below.
Source: Sunwater data obtained through a 2012 RTI request
High–level costs benefits analysis Our high-level benefit costs analysis is based on the following assumptions and
facts:
Storage capacity of 300,000 ML, which yields 20,000 ML/a of high priority allocations and 124,000 ML/a of medium priority allocations
A 30-year analysis timeframe with a 7.7% real risk discount rate applied to water supply infrastructure costs and externalities and a 13.1% discount rate applied to operating surpluses accruing to farmers.
Sugarcane production is the dominant regional crop. Based on an irrigation supplement rate of 4/ml/ha, dam yields would enable an additional 31,000 hectares of cane.
6
Based on industry information (BRIG), a gross margin of $1,250/ha is assumed, which includes all water charges.
DIN discharges to waterways based on cane production assumed at 7.2/kg/ha/a. Abatement costs assumed at lowest end of Reef Rescue estimates
Benefit cost analysis based on the above facts and assumptions is shown in the
below table.
Benefit / cost Present value ($)
Gross margin to farmers (incorporates all water charges) $288,437,383
Costs
Capital cost - dam $300,000,000
Capital cost - roads $49,800,000
Capital costs to farmers $323,175,000
Cost of externalities (abatement) $56,667,112
Total costs $729,642,112
Net benefits -$441,204,729
BCR 0.40
Source: MainStream Economics and Policy 2014
Indicative findings The indicative findings of our analysis based on the above assumptions and
scenario for Paradise Dam shows the following:
With only a BCR of 0.40, the net present value of Paradise Dam is
negative. To be economically viable, it should have a BCR of at least 1
Farmer’s current gross margins are approximately $290 million. For it to
be viable, farmers gross margins need to be at least $3,200/ha
Present cost of impacts to the GBR valued at approximately $57 million. If
a mid-point of Reef Rescue abatement costs is used, estimated cost of
impacts to the GBR is almost $180 million. Furthermore, if cost of indirect
externality from water us (i.e. DIN discharges) was incorporated into
water prices, water charges would increase by at least $40 and around
$125/ML if the mid-point of abatement costs was used.
7
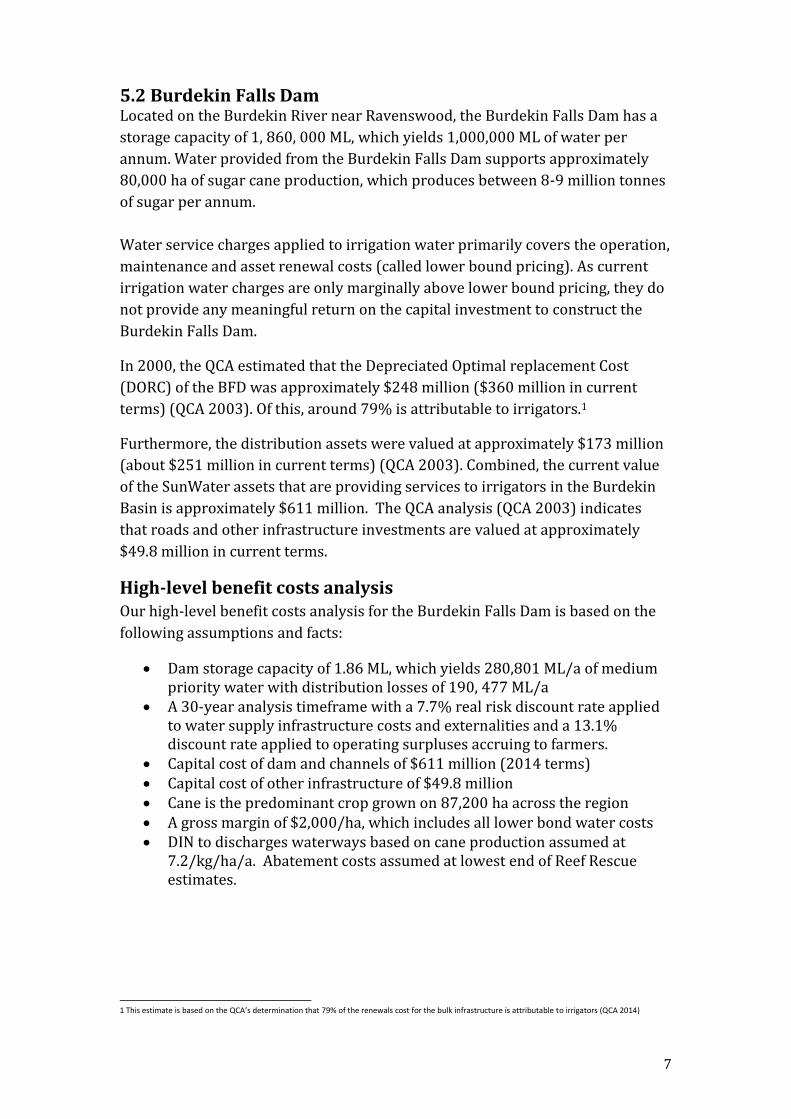
5.2 Burdekin Falls Dam Located on the Burdekin River near Ravenswood, the Burdekin Falls Dam has a
storage capacity of 1, 860, 000 ML, which yields 1,000,000 ML of water per
annum. Water provided from the Burdekin Falls Dam supports approximately
80,000 ha of sugar cane production, which produces between 8-9 million tonnes
of sugar per annum.
Water service charges applied to irrigation water primarily covers the operation,
maintenance and asset renewal costs (called lower bound pricing). As current
irrigation water charges are only marginally above lower bound pricing, they do
not provide any meaningful return on the capital investment to construct the
Burdekin Falls Dam.
In 2000, the QCA estimated that the Depreciated Optimal replacement Cost
(DORC) of the BFD was approximately $248 million ($360 million in current
terms) (QCA 2003). Of this, around 79% is attributable to irrigators.1
Furthermore, the distribution assets were valued at approximately $173 million
(about $251 million in current terms) (QCA 2003). Combined, the current value
of the SunWater assets that are providing services to irrigators in the Burdekin
Basin is approximately $611 million. The QCA analysis (QCA 2003) indicates
that roads and other infrastructure investments are valued at approximately
$49.8 million in current terms.
High-level benefit costs analysis
Our high-level benefit costs analysis for the Burdekin Falls Dam is based on the
following assumptions and facts:
Dam storage capacity of 1.86 ML, which yields 280,801 ML/a of medium priority water with distribution losses of 190, 477 ML/a
A 30-year analysis timeframe with a 7.7% real risk discount rate applied to water supply infrastructure costs and externalities and a 13.1% discount rate applied to operating surpluses accruing to farmers.
Capital cost of dam and channels of $611 million (2014 terms) Capital cost of other infrastructure of $49.8 million Cane is the predominant crop grown on 87,200 ha across the region A gross margin of $2,000/ha, which includes all lower bond water costs DIN to discharges waterways based on cane production assumed at
7.2/kg/ha/a. Abatement costs assumed at lowest end of Reef Rescue estimates.
1 This estimate is based on the QCA’s determination that 79% of the renewals cost for the bulk infrastructure is attributable to irrigators (QCA 2014)
8
Benefit cost analysis based on above facts and assumptions is shown in the
below table.
Benefit / cost Present value ($)
Gross margin to farmers (incorporates all water charges) $1,298,154,312
Costs
Capital cost - dam $611,000,000
Capital cost - roads $49,800,000
Capital costs to farmers $909,060,000
Cost of externalities (abatement) $412,805,738
Total costs $1,982,665,738
Net benefits -$684,511,427
BCR 0.65
Source: MainStream Economics and Policy 2014
Indicative findings
The indicative findings of our analysis based on the above assumptions and
scenario for the Burdekin Falls Dam shows the following:
With a benefit cost ratio (BCR) of 0.65, the net present value of BFD is
negative. For it be economically viable, the BCR should be at least 1
Farmer’s current gross margins are approximately $1.3 billion. For the
BFD to be economically viable, farmers gross margins need to be at least
$3,000/ha
Present value of GBR impact costs is approximately $410 million. If a mid-
point of the range of Reef Rescue abatement costs is used, the estimated
cost to the GBR is almost $1.3 billion in present value terms. Furthermore,
if the cost of the indirect externality from the use of the water (i.e. DIN
discharges) was incorporated into the price of water, water charges
would increase by at least $40, and around $125/ML if the mid-point of
abatement costs was used.
The QCA have determined the appropriate WACC for SunWater is around
7.7% (real). If this rate of return were applied equally to all irrigation
infrastructure and systems, then charges for irrigation water would
potentially increase by around $47 million across the region. Based on
submissions to the QCA during the last pricing review (QCA 2012b), there
is a general consensus amongst stakeholders that applying upper bound
costs to the Burdekin Water Supply Scheme would make irrigators less
economically viable.
9
6. Cost benefit analysis of proposed water supply infrastructure
6.1 Nathan Dam Located on the Dawson River near Taroom in the Fitzroy Basin, the proposed
Nathan Dam has been identified in the Agricultural Competiveness Green Paper
as “warranting future consideration of possible capital investment by the
Australian Government”.
If constructed, the dam will inundate approximately 13,508 ha and store 888,000 ML of water, which will yield 66,000 ML of high priority water per annum for mining, industrial and urban development in the southern Bowen and Surat Basins.
While building a dam on the Dawson River to support agriculture has been proposed since the 1920’s, the purpose of the current Nathan Dam and Pipeline proposal is to provide high priority water allocations to support mining, industrial and urban expansion in the southern Bowen and Surat Basins.
As the mining industry is projected to require between 70,000 and 100,000 ML of water per annum, the demand for high priority water in the Bowen Basin will place a significant price pressure on water for irrigation purposes. This is likely to mean that there will be relatively little water actually available for agriculture under the current proposal for the dam (SKM, 2012).
Given the current purpose for building Nathan Dam is to provide high priority water allocations to support mining, industrial and urban expansion, the business case for the project is based on the ability to fully recover construction and operational costs of the project from high priority water allocation holders.
However due to the significant recent downturn of global coal prices, many of the proponents of mining development projects dependent on water provided from Nathan Dam have delayed commencing their projects, which has caused the existing business case for the Nathan Dam and Pipeline Project to collapse.
Potential adverse impacts If constructed, the dam will potentially cause a wide range of adverse economic,
social and environmental impacts, which includes:
Economic
o Inundating in excess of 13,000 ha of productive grazing land
o Reducing the reliability of downstream water user’s allocations
o Potential downturn of tourism due to degradation of the GBRWHA
caused by increased sediment and agricultural pollution loads
Social o Inundating important indigenous cultural sites o Potentially flooding the Taroom aboriginal cemetery
10
Environmental o Severely modify flow regimes in the lower Dawson River o Inundating habitat of the critically endangered Boggomoss Snail o Increasing sediment and agricultural pollutants entering the GBR o Inundating approximately 4,000 ha of vegetation o Severely disrupting fish and amphibian migration o Generating 113 tonnes of GHG emissions/a released from the
decaying vegetation that has been inundated
Potential agriculture development According to studies conducted in the 1990’s, a dam on the Dawson River would support approximately 30,000 ha of additional irrigated cotton production in the lower Dawson Valley. Based on current practices, increased TSS and DIN loads generated from converting existing grazing land use to cotton production in the lower Dawson Valley is shown in the table below.
Activity TSS/annum DIN/annum Converting 30,000 ha of grazing land to cotton production
Additional 420 tonnes Additional 3 tonnes
High-level benefit costs analysis Our high-level benefit costs analysis for the proposed Nathan Dam is based on
the following assumptions and facts:
Dam storage capacity of 888,000 ML, which will yield 66,000 ML/a of high
priority water allocations
A 30-year analysis timeframe with a 7.7% real risk discount rate applied to water supply infrastructure costs and externalities and a 13.1% discount rate applied to operating surpluses accruing to farmers.
Potential volume of water available for irrigation is 190,000 ML
Area potentially irrigated is 30,000 ha (cotton). Purchase and
establishment cost is assumed at $6,000/ha
TSS loads estimated at 420 t/a, DIN loads estimated at 3 t/a
Based on potential water allocations, cost attributable to irrigation
estimated at $77 million
Capital costs estimated at $361.3 million (2013)
A gross margin of $800/ha is assumed and this includes all lower bond water service provision charges (White et al 2012)
DIN discharges to waterways based on cotton production assumed at 0.1/kg/ha/a. Abatement costs assumed at lowest end of Reef Rescue estimates
11
Benefit cost analysis is shown in the below table.
Benefit / cost Present value ($)
Gross margin to farmers (incorporates all water charges) $178,645,089
Costs
Capital cost - dam $77,305,180
Capital cost - roads $0
Capital costs to farmers $180,000,000
Cost of externality $180,000,000
Total costs $437,305,180
Net benefits -$258,660,091
BCR 0.41
Source: MainStream Economics and Policy 2014
Indicative findings The indicative findings of our analysis based on the above assumptions and
scenario for the proposed Nathan Dam shows the following:
With an estimated benefit cost ratio (BCR) of approximately 0.40, the net
present value of the proposed Nathan Dam is negative. For it to
economically and financially viable, it should have a BCR of at least 1
The present value of benefits to farmers based on gross margins is around
$180 million. For the project to be viable, gross margins would need to be
approximately $2,000/ha
The present value of cost of the damage to the reef (based on a cost of
abatement) is around $180 million, even where the most efficient
abatement costs are used. In effect, under the assumptions used, the
damage to the environment could be almost equal to the gross margins
received by farmers. Note: this excludes any capital costs.
12
6.2 Urannah Dam Located on the Broken River near Collinsville in the Burdekin Basin, the proposed dam would store 1.5 million ML and yield 176,900 ML of water per annum if constructed. Urannah Dam has been identified in the Agricultural Competiveness Green Paper as a project ‘being likely to be suitable for further consideration for possible assistance provided by the Australian Government to accelerate feasibility studies, cost benefit analysis or design’.
The proposed purpose of the dam is to provide water for agricultural
development in the Burdekin Basin, industrial and agricultural development in
the Bowen region (via a channel from Clare Weir) and mining development in
the northern Bowen and Galilee Basins.
Potential adverse impacts
If constructed, the dam will potentially cause a wide range of adverse economic,
social and environmental impacts, which includes:
Economic
o Inundating approximately 5000 ha of productivity grazing land
o Further degrading the GBRWHA from increased sediment and
agricultural pollution caused by expansion of primary production
Social o Inundating important indigenous cultural sites o Inundate land that has been returned to Traditional Owners under
a successful Native Title claim
Environmental o Severely modify flow regimes in the lower Broken River o Inundating habitat of the critically endangered Erwins turtle o Increased sedimentation of waterways and wetlands o Inundating approximately 4000 ha of endangered vegetation o Severely disrupting fish and amphibian migration o Increased GHG emissions from decaying inundated vegetation
Potential agricultural development According to its 2002 report, the Bowen Collinsville Enterprise Group estimated that Urannah Dam would potentially support approximately 28,600 ha of irrigated agriculture in the lower Broken River Catchment, which includes:
16,730 ha of sugar cane 8,210 ha of cotton 1,460 ha of horticulture 1,600 ha of peanuts, legumes and maize 90 ha Lucerne 510 ha of Red-claw crayfish
Source: Bowen Collinsville Enterprise Group
13
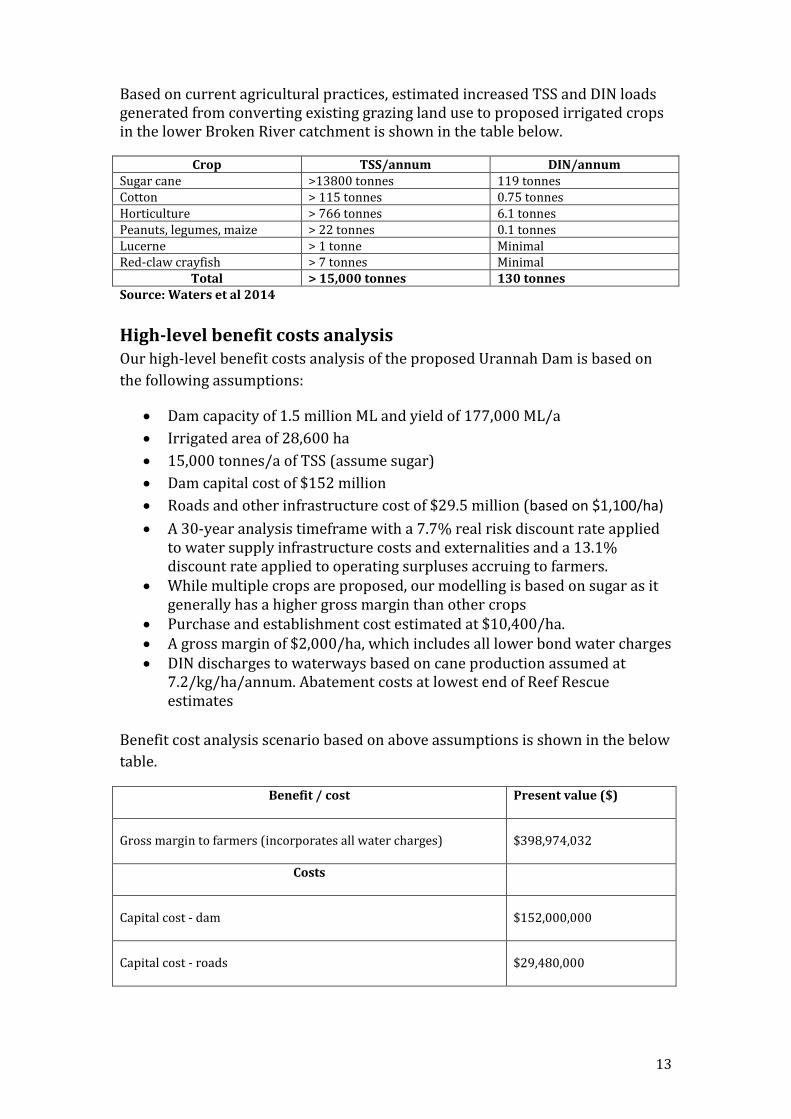
Based on current agricultural practices, estimated increased TSS and DIN loads generated from converting existing grazing land use to proposed irrigated crops in the lower Broken River catchment is shown in the table below.
Total > 15,000 tonnes 130 tonnes Source: Waters et al 2014
High-level benefit costs analysis
Our high-level benefit costs analysis of the proposed Urannah Dam is based on
the following assumptions:
Dam capacity of 1.5 million ML and yield of 177,000 ML/a
Irrigated area of 28,600 ha
15,000 tonnes/a of TSS (assume sugar)
Dam capital cost of $152 million
Roads and other infrastructure cost of $29.5 million (based on $1,100/ha)
A 30-year analysis timeframe with a 7.7% real risk discount rate applied to water supply infrastructure costs and externalities and a 13.1% discount rate applied to operating surpluses accruing to farmers.
While multiple crops are proposed, our modelling is based on sugar as it generally has a higher gross margin than other crops
Purchase and establishment cost estimated at $10,400/ha. A gross margin of $2,000/ha, which includes all lower bond water charges DIN discharges to waterways based on cane production assumed at
7.2/kg/ha/annum. Abatement costs at lowest end of Reef Rescue estimates
Benefit cost analysis scenario based on above assumptions is shown in the below
table.
Benefit / cost Present value ($)
Gross margin to farmers (incorporates all water charges) $398,974,032
Costs
Capital cost - dam $152,000,000
Capital cost - roads $29,480,000
14
Capital costs to farmers $279,390,000
Cost of externality $126,871,488
Total costs $587,741,488
Net benefits -$188,767,457
BCR 0.68
Source: MainStream Economics 2014
Indicative findings Findings from our benefit costs analysis based on above assumptions and
scenario for the proposed Urannah Dam shows the following:
With a benefit cost ratio (BCR) of approximately 0.7, the net present value
of the proposed Urannah Dam would negative. The project should have a
BCR of at least 1 for it to be economically and financially viable.
The present value of benefits to farmers based on gross margins is around
$400 million under the base case scenario and assumptions. For the
project to be viable, gross margins ($/ha) would need to be
approximately $3,000.
The present value of cost of the damage to the GBR based on Reef Rescue
abatement is approximately $125 million
7. Conclusion It is clear from our analysis that existing water supply infrastructure located in
GBR catchments are not economically or financially viable and are therefore not
compliant with either COAG, NWI or Queensland Treasury requirements.
As our analysis shows that proposed new water supply infrastructure will also
potentially be economically and financial unviable, governments should
therefore prioritise investment in optimising the efficiency and productivity of
existing agricultural development, which will deliver a range of other benefits
such as reducing impacts to the GBR caused by agricultural pollution.