Benefits and costs of strengthening Bangladesh’s VAT structure COST-BENEFIT ANALYSIS: STRENGTHENING THE TAX BASE IN BANGLADESH BIPLOB KUMAR NANDI, SENIOR LECTURER, DEPARTMENT OF ECONOMICS, EAST WEST UNIVERSITY BAZLUL HAQUE KHONDKER, PROFESSOR, DEPARTMENT OF ECONOMICS, UNIVERSITY OF DHAKA
Transcript
Benefits and costs of strengthening Bangladesh’s VAT structure
COST-BENEFIT ANALYSIS: STRENGTHENING THE TAX BASE IN BANGLADESH
BIPLOB KUMAR NANDI, SENIOR LECTURER, DEPARTMENT OF ECONOMICS, EAST WEST UNIVERSITYBAZLUL HAQUE KHONDKER, PROFESSOR, DEPARTMENT OF ECONOMICS, UNIVERSITY OF DHAKA
Cost-Benefit Analysis: Strengthening the Tax Base in Bangladesh
Bangladesh Priorities
Biplob Kumar Nandi Senior Lecturer, Department of Economics, East West University
Bazlul Haque Khondker Professor, Department of Economics, University of Dhaka
Bangladesh Priorities project was supported by a grant from the C&A Foundation. Working paper as of March 21, 2016
This work is available under the Creative Commons Attribution 4.0 International license (CC BY 4.0). Under the Creative Commons Attribution license, you are free to copy, distribute, transmit, and adapt this work, including for commercial purposes, under the following conditions:
Attribution Please cite the work as follows: #AUTHOR NAME#, #PAPER TITLE#, Bangladesh Priorities, Copenhagen Consensus Center, 2016. License: Creative Commons Attribution CC BY 4.0.
Third-party-content Copenhagen Consensus Center does not necessarily own each component of the content contained within the work. If you wish to re-use a component of the work, it is your responsibility to determine whether permission is needed for that re-use and to obtain permission from the copyright owner. Examples of components can include, but are not limited to, tables, figures, or images.
INTRODUCTION AND BACKGROUND................................................................................................................ 2
OVERVIEW OF THE VAT STRUCTURE IN BANGLADESH ..................................................................................... 5
DESCRIPTION OF POLICY INTERVENTIONS: STRENGTHENING OF VAT BASE ..................................................... 8
DATA AND METHODOLOGY ........................................................................................................................... 10
REVENUE GAINS FROM PROPOSED INTERVENTIONS ..................................................................................... 12
TARIFF VALUE ELIMINATION .......................................................................................................................... 12
REVENUE GAIN FROM VAT AUTOMATION ..................................................................................................... 12
COST IMPLICATION OF THE INTERVENTION ................................................................................................... 14
DIRECT COST FROM TAX ADMINISTRATION ................................................................................................................. 14
INDIRECT COST FROM PRICE DISTORTION ..................................................................................................... 15
ESTIMATED BENEFIT OF THE INTERVENTIONS................................................................................................ 18
BENEFITS FROM SAVINGS OF COMPLIANCE COSTS ........................................................................................................ 18
BENEFITS FROM ENHANCED INVESTMENT................................................................................................................... 19
APPENDIX-1: REVENUE CALCULATION FROM REMOVAL OF TARIFF VALUES .................................................. 24
APPENDIX 2: INPUT-OUTPUT MODEL ........................................................................................................................ 29
INVERSE MATRIX (SOLUTION OF AN INPUT-OUTPUT MODEL) .......................................................................................... 31
2
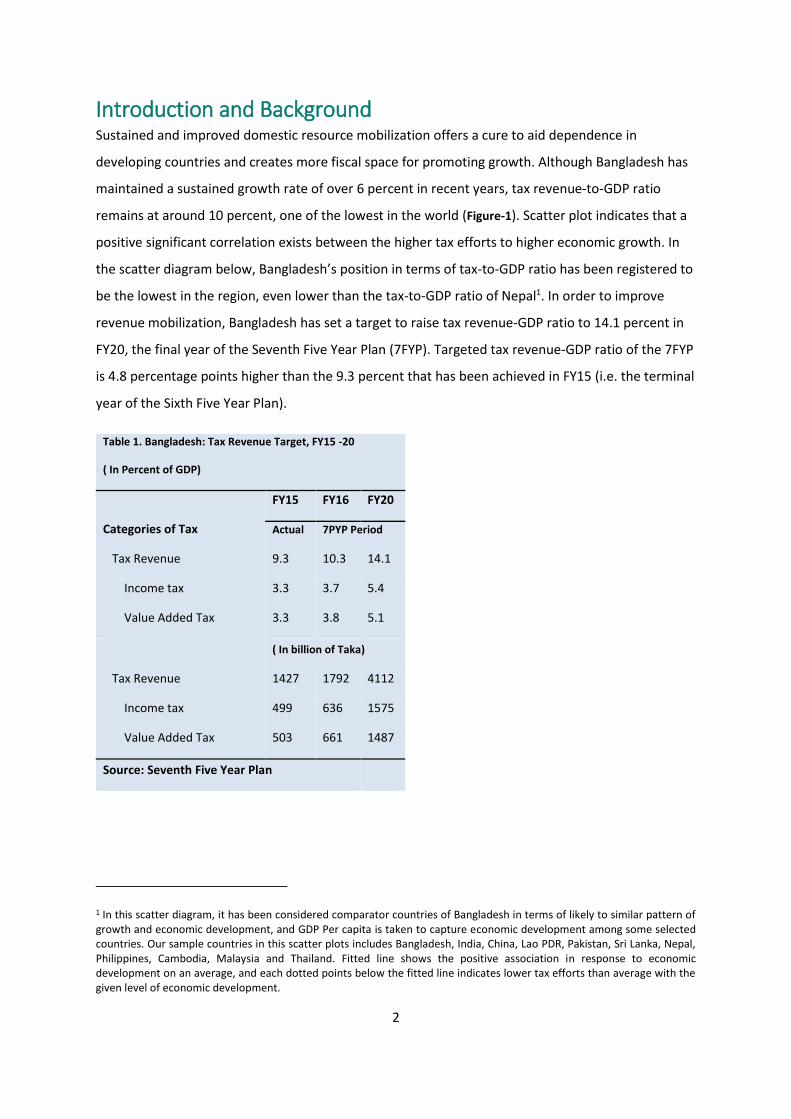
Introduction and Background Sustained and improved domestic resource mobilization offers a cure to aid dependence in
developing countries and creates more fiscal space for promoting growth. Although Bangladesh has
maintained a sustained growth rate of over 6 percent in recent years, tax revenue-to-GDP ratio
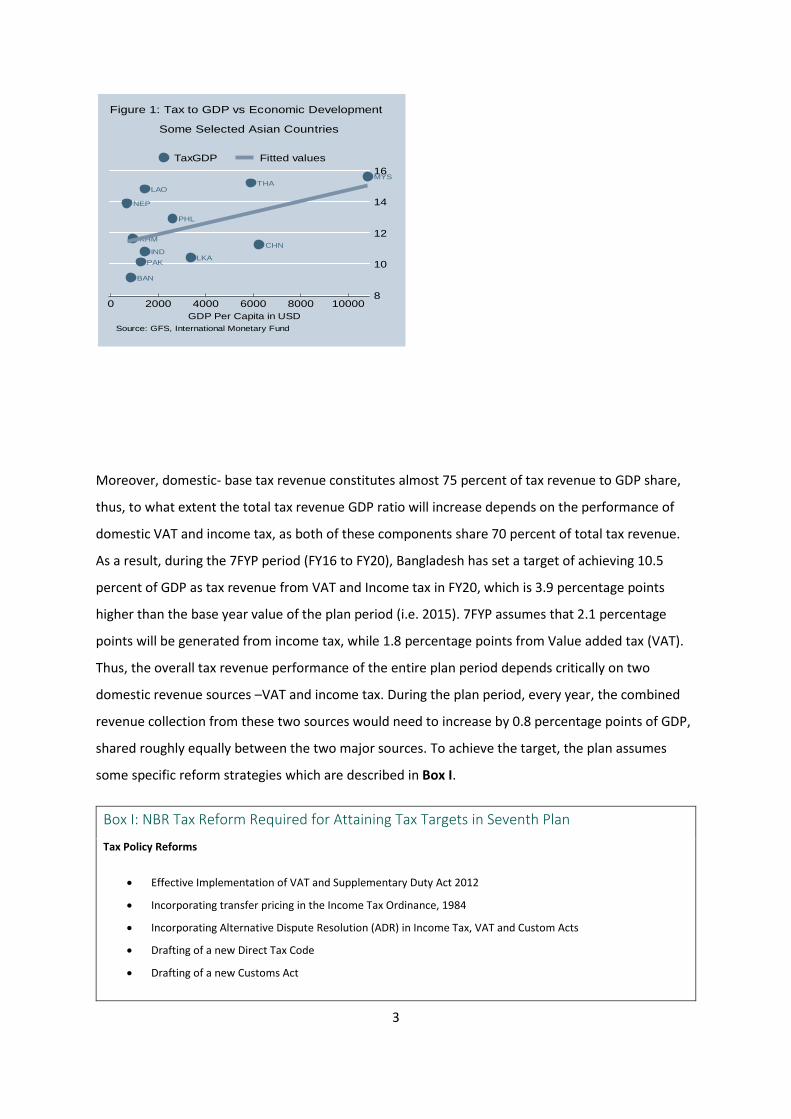
remains at around 10 percent, one of the lowest in the world (Figure-1). Scatter plot indicates that a
positive significant correlation exists between the higher tax efforts to higher economic growth. In
the scatter diagram below, Bangladesh’s position in terms of tax-to-GDP ratio has been registered to
be the lowest in the region, even lower than the tax-to-GDP ratio of Nepal1. In order to improve
revenue mobilization, Bangladesh has set a target to raise tax revenue-GDP ratio to 14.1 percent in
FY20, the final year of the Seventh Five Year Plan (7FYP). Targeted tax revenue-GDP ratio of the 7FYP
is 4.8 percentage points higher than the 9.3 percent that has been achieved in FY15 (i.e. the terminal
year of the Sixth Five Year Plan).
1 In this scatter diagram, it has been considered comparator countries of Bangladesh in terms of likely to similar pattern of growth and economic development, and GDP Per capita is taken to capture economic development among some selected countries. Our sample countries in this scatter plots includes Bangladesh, India, China, Lao PDR, Pakistan, Sri Lanka, Nepal, Philippines, Cambodia, Malaysia and Thailand. Fitted line shows the positive association in response to economic development on an average, and each dotted points below the fitted line indicates lower tax efforts than average with the given level of economic development.
Table 1. Bangladesh: Tax Revenue Target, FY15 -20
( In Percent of GDP)
Categories of Tax
FY15 FY16 FY20
Actual 7PYP Period
Tax Revenue 9.3 10.3 14.1
Income tax 3.3 3.7 5.4
Value Added Tax 3.3 3.8 5.1
( In billion of Taka)
Tax Revenue 1427 1792 4112
Income tax 499 636 1575
Value Added Tax 503 661 1487
Source: Seventh Five Year Plan
3
Moreover, domestic- base tax revenue constitutes almost 75 percent of tax revenue to GDP share,
thus, to what extent the total tax revenue GDP ratio will increase depends on the performance of
domestic VAT and income tax, as both of these components share 70 percent of total tax revenue.
As a result, during the 7FYP period (FY16 to FY20), Bangladesh has set a target of achieving 10.5
percent of GDP as tax revenue from VAT and Income tax in FY20, which is 3.9 percentage points
higher than the base year value of the plan period (i.e. 2015). 7FYP assumes that 2.1 percentage
points will be generated from income tax, while 1.8 percentage points from Value added tax (VAT).
Thus, the overall tax revenue performance of the entire plan period depends critically on two
domestic revenue sources –VAT and income tax. During the plan period, every year, the combined
revenue collection from these two sources would need to increase by 0.8 percentage points of GDP,
shared roughly equally between the two major sources. To achieve the target, the plan assumes
some specific reform strategies which are described in Box I.
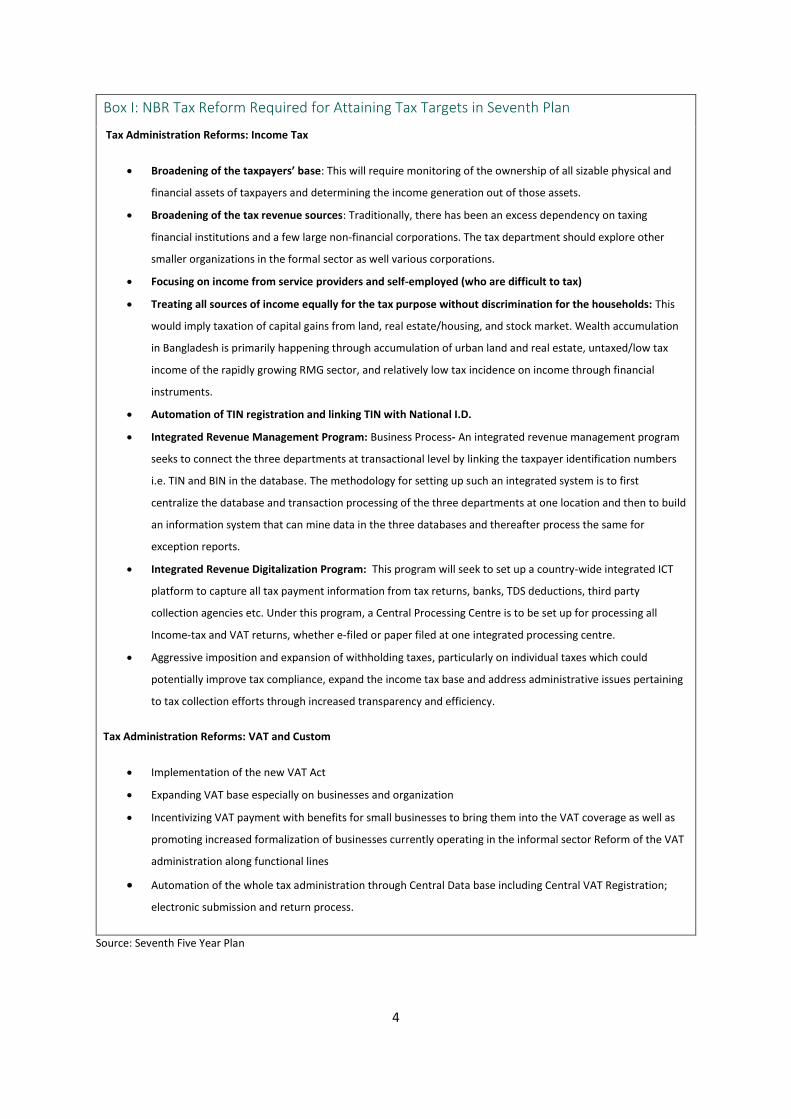
Box I: NBR Tax Reform Required for Attaining Tax Targets in Seventh Plan
Tax Policy Reforms
Effective Implementation of VAT and Supplementary Duty Act 2012
Incorporating transfer pricing in the Income Tax Ordinance, 1984
Incorporating Alternative Dispute Resolution (ADR) in Income Tax, VAT and Custom Acts
Drafting of a new Direct Tax Code
Drafting of a new Customs Act
BAN
CHNIND
LAO
KHM
MYS
NEP
PAK
PHL
LKA
THA
8
10
12
14
16
0 2000 4000 6000 8000 10000
GDP Per Capita in USD
TaxGDP Fitted values
Source: GFS, International Monetary Fund
Some Selected Asian Countries
Figure 1: Tax to GDP vs Economic Development
4
Box I: NBR Tax Reform Required for Attaining Tax Targets in Seventh Plan
Tax Administration Reforms: Income Tax
Broadening of the taxpayers’ base: This will require monitoring of the ownership of all sizable physical and
financial assets of taxpayers and determining the income generation out of those assets.
Broadening of the tax revenue sources: Traditionally, there has been an excess dependency on taxing
financial institutions and a few large non-financial corporations. The tax department should explore other
smaller organizations in the formal sector as well various corporations.
Focusing on income from service providers and self-employed (who are difficult to tax)
Treating all sources of income equally for the tax purpose without discrimination for the households: This
would imply taxation of capital gains from land, real estate/housing, and stock market. Wealth accumulation
in Bangladesh is primarily happening through accumulation of urban land and real estate, untaxed/low tax
income of the rapidly growing RMG sector, and relatively low tax incidence on income through financial
instruments.
Automation of TIN registration and linking TIN with National I.D.
Integrated Revenue Management Program: Business Process- An integrated revenue management program
seeks to connect the three departments at transactional level by linking the taxpayer identification numbers
i.e. TIN and BIN in the database. The methodology for setting up such an integrated system is to first
centralize the database and transaction processing of the three departments at one location and then to build
an information system that can mine data in the three databases and thereafter process the same for
exception reports.
Integrated Revenue Digitalization Program: This program will seek to set up a country-wide integrated ICT
platform to capture all tax payment information from tax returns, banks, TDS deductions, third party
collection agencies etc. Under this program, a Central Processing Centre is to be set up for processing all
Income-tax and VAT returns, whether e-filed or paper filed at one integrated processing centre.
Aggressive imposition and expansion of withholding taxes, particularly on individual taxes which could
potentially improve tax compliance, expand the income tax base and address administrative issues pertaining
to tax collection efforts through increased transparency and efficiency.
Tax Administration Reforms: VAT and Custom
Implementation of the new VAT Act
Expanding VAT base especially on businesses and organization
Incentivizing VAT payment with benefits for small businesses to bring them into the VAT coverage as well as
promoting increased formalization of businesses currently operating in the informal sector Reform of the VAT
administration along functional lines
Automation of the whole tax administration through Central Data base including Central VAT Registration;
electronic submission and return process.
Source: Seventh Five Year Plan
5
As indicated in Box I, significant progress is being made on the VAT front in terms of the new VAT
Law, which has already been enacted in December 2012, and administrative restructuring and
modernization of VAT administration. Many of these initiatives should be in place before the
introduction of the new VAT Law, effective from July 2016. Moreover, the Bangladesh government
focuses more in case of direct tax base strengthening through enacting automation procedure in the
direct tax system.
In this paper, we will focus on two VAT related reforms to assess their revenue generation potential
and cost of generating additional revenue. These are: (i) removal of tariff values currently applicable
on some domestically produced items and replacing them with actual market prices and (ii)
automation in the VAT system through registration and VAT return in the online system.
The rest of the paper is composed of seven more sections. An overview of the VAT structure in
Bangladesh has been presented in section two. Section three provides description of the proposed
interventions. Data and Methodology is discussed in section four. Section five presents revenue
gains from proposed interventions. Cost implication and benefits are analyzed in section six and
seven respectively. Benefit-cost assessments are presented in the final section.
Overview of the VAT Structure in Bangladesh Like many other developing countries, during the first two decades, trade-based taxes dominated
the tax structure in Bangladesh with customs duties alone accounting for about a third of tax
revenue. However, the scenario started to change after the introduction of VAT2. The share of VAT
revenue has continued to increase; it recorded from 23.6 % during the period 1990-95 to 36.8 % in
2011-15. A more dramatic change is observed for custom duties with its share declining to 12.6
percent of the total NBR revenue in 2011-15. The reduced share of trade-based taxes in Bangladesh
also reflects a better integration of Bangladesh with the global economy through the removal of
trade barriers. Since early 1990s, the Bangladesh economy experienced a process of integration with
the global economy resulting in a more open economy and reduced tariff barriers. Revenue loss
from the trade-based taxes has mainly been compensated through the expansion of VAT coverage to
many services, wholesale and retail, as well as the continued increased share from direct tax.
2At the beginning of July, 1991 sales and excise taxes were replaced by Value Added Tax system. Initially, VAT system is
engaged to mainly in manufacturing sectors, also, exits numerous exemptions, reduced rates and cascading problems. While,
agriculture sector was fully VAT exempted.
6
Though the VAT base compared to the income tax base has expanded at a faster rate; both income
tax and VAT bases still suffer due to the lack of coverage, numerous exemptions, prevailing reduced
rates and some implemented unequal treatments in case of income tax and VAT collections.
Meanwhile, reforms in VAT have been attributed to greater domestic and import-stages VAT
revenue performances in recent periods, but still now VAT productivity is lower than its potential,
while both direct and indirect tax systems are more buoyant. Mansur, Yunus and Nandi (2011)
conducted research to evaluate the tax system of Bangladesh. Using cross-country panel analysis to
estimate the VAT efforts against VAT potentiality, they pointed out that performance of the VAT
system in terms of efficiency indicators (tax base and administrative indicators such as government
effectiveness and institutional quality) is not impressive. The coefficient of the VAT base indicators
such as industry value addition is not significant at the 5 percent level, which reflects the prevalence
of a narrow base and different exemptions. Additionally, the coefficient of tax administration
indicators is also insignificant, indicating weak administration capability of the current VAT system.
They also calculated the VAT and income tax efforts index are significantly lower than unity which
are also low compared to other comparators. This implies that Bangladesh has huge tax potential in
terms of both income tax and domestic VAT; and further reforms in both domestic VAT and income
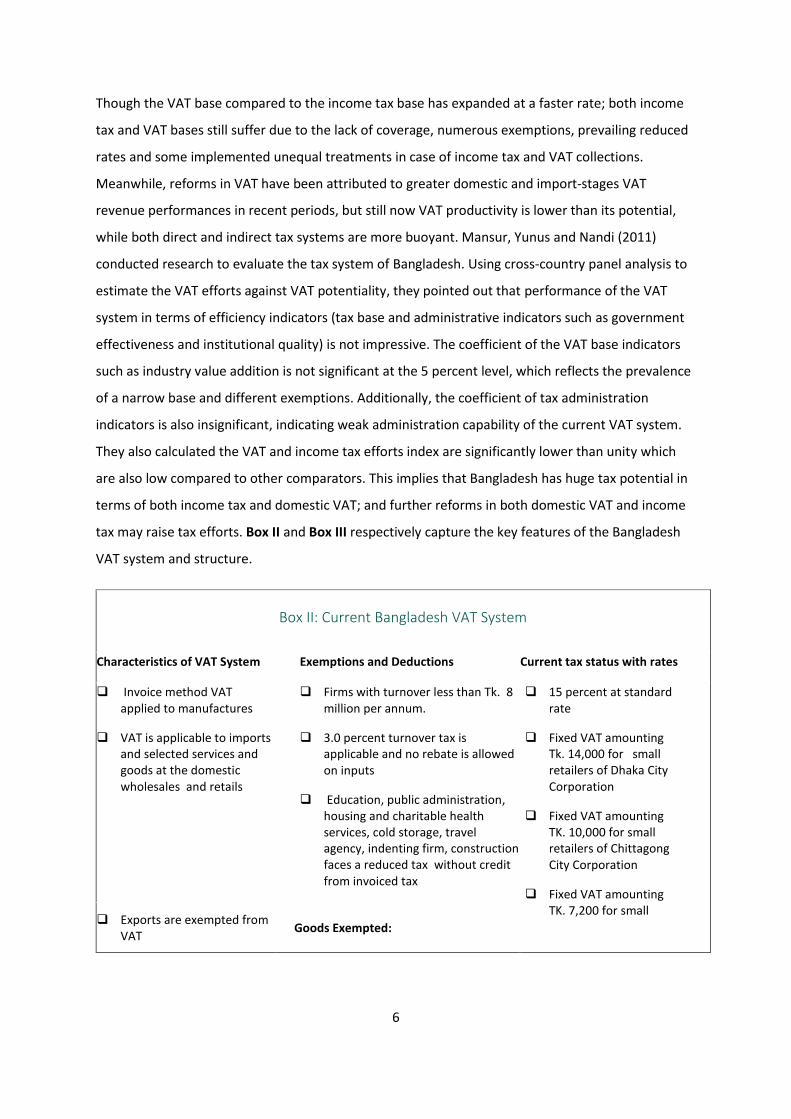
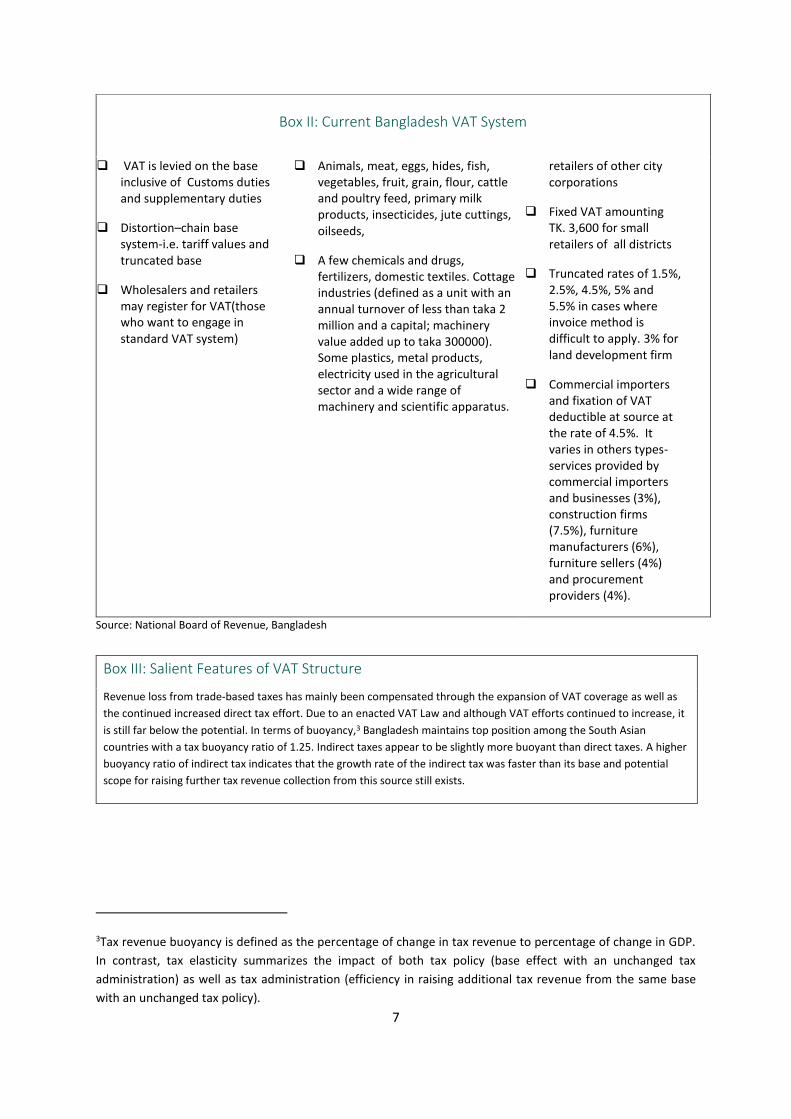
tax may raise tax efforts. Box II and Box III respectively capture the key features of the Bangladesh
VAT system and structure.
Box II: Current Bangladesh VAT System
Characteristics of VAT System Exemptions and Deductions Current tax status with rates
Invoice method VAT applied to manufactures
VAT is applicable to imports and selected services and goods at the domestic wholesales and retails
Firms with turnover less than Tk. 8 million per annum.
3.0 percent turnover tax is applicable and no rebate is allowed on inputs
Education, public administration, housing and charitable health services, cold storage, travel agency, indenting firm, construction faces a reduced tax without credit from invoiced tax
15 percent at standard rate
Fixed VAT amounting Tk. 14,000 for small retailers of Dhaka City Corporation
Fixed VAT amounting TK. 10,000 for small retailers of Chittagong City Corporation
Fixed VAT amounting TK. 7,200 for small
Exports are exempted from VAT
Goods Exempted:
7
Box II: Current Bangladesh VAT System
VAT is levied on the base inclusive of Customs duties and supplementary duties
Distortion–chain base system-i.e. tariff values and truncated base
Wholesalers and retailers may register for VAT(those who want to engage in standard VAT system)
A few chemicals and drugs, fertilizers, domestic textiles. Cottage industries (defined as a unit with an annual turnover of less than taka 2 million and a capital; machinery value added up to taka 300000). Some plastics, metal products, electricity used in the agricultural sector and a wide range of machinery and scientific apparatus.
retailers of other city corporations
Fixed VAT amounting TK. 3,600 for small retailers of all districts
Truncated rates of 1.5%, 2.5%, 4.5%, 5% and 5.5% in cases where invoice method is difficult to apply. 3% for land development firm
Commercial importers and fixation of VAT deductible at source at the rate of 4.5%. It varies in others types-services provided by commercial importers and businesses (3%), construction firms (7.5%), furniture manufacturers (6%), furniture sellers (4%) and procurement providers (4%).
Source: National Board of Revenue, Bangladesh
Box III: Salient Features of VAT Structure
Revenue loss from trade-based taxes has mainly been compensated through the expansion of VAT coverage as well as
the continued increased direct tax effort. Due to an enacted VAT Law and although VAT efforts continued to increase, it
is still far below the potential. In terms of buoyancy,3 Bangladesh maintains top position among the South Asian
countries with a tax buoyancy ratio of 1.25. Indirect taxes appear to be slightly more buoyant than direct taxes. A higher
buoyancy ratio of indirect tax indicates that the growth rate of the indirect tax was faster than its base and potential
scope for raising further tax revenue collection from this source still exists.
3Tax revenue buoyancy is defined as the percentage of change in tax revenue to percentage of change in GDP.
In contrast, tax elasticity summarizes the impact of both tax policy (base effect with an unchanged tax
administration) as well as tax administration (efficiency in raising additional tax revenue from the same base
with an unchanged tax policy).
8
A cross-country comparison shows that tax-to-GDP and VAT productivity in Bangladesh is significantly lower than other
countries with similar levels of socioeconomic development4. The fitted relationship is positive and statistically
significant, suggesting that as the efficiency of VAT collection increases so does the tax-to-GDP ratio.
Contrary to these conditions, multiplicity of tax rates as well as the prevalence of widespread exemptions, tariff values
eroded the efficiency of the VAT system in Bangladesh. Thus, Bangladesh’s relatively low VAT-to-GDP ratio is mainly
characterized by a low level of domestic taxes and high statutory nominal VAT rate.
Description of Policy Interventions: Strengthening of VAT Base
As mentioned above, VAT productivity in Bangladesh is lower compared to other countries in the
region, suggesting that VAT productivity is below its potential and mainly due to narrower base.
Moreover, it is possible to significantly boost VAT productivity through lowering exemptions,
broadening the base and increasing administrative reforms. Accordingly, in this paper the following
two policy interventions have been proposed.
4 The estimated regression is tax-to-GDP ratio = 3.11 + 4.84*VAT productivity, R2 = 0.81 with a calculated t ratio
of 2.9 on the estimated coefficient of VAT productivity ratio. Where, VAT productivity is simply the ratio of VAT
to GDP to standard VAT rate for each country (Source: Mansur, Yunus and Nandi, 2011, “An evaluation of
Bangladesh tax system” IGC Working Paper).
9.711.9
20.6
32.6
23.6
28.1
36.835.4 32.6
16.8
12.614.5
11.6
0
5
10
15
20
25
30
35
40
1973-80 1981-90 1991-95 1995-00 2001-10 2011-15
% of NBR Revenue
Figure-2. Bangladesh : Tax Structure during Pre and Post VAT Regime
Income Tax VAT Custom Duty Sales tax
Source: National Borad of Revenue, data base, Bangladesh
0.0
1.0
2.0
3.0
4.0
5.0
6.0
FY06 FY07 FY08 FY09 FY10 FY11 FY12 FY13 FY14
Figure-3.Bangladesh: Actual vs Potential VAT (As % of GDP)
Potential VAT to GDP Actual VAT to GDP
Source: Authors' Estimates
BAN
INDCHN
IDN
NEPPHLP
KOR
SRL
THA
VNM
10
15
20
25
.2 .3 .4 .5 .6 .7VAT Productivity
Taxgdp Fitted values
Source: GFS, International Monetary Fund
Some Selected Asian Countries
Figure-4: VAT Productivity vs Tax toGDP
BAN
IND
CHN
IDN NEPPHLP
KOR
SRL
THAVNM
.2
.3
.4
.5
.6
.7
5 10 15 20VAT rate
VAT Productivity Fitted values
Source: GFS, International Monetary Fund
Some Selected Asian Countries
Figure-5: VAT Productivity vs VAT rate
9
TABLE 2: SUMMARY OF THE PROPOSED POLICY INTERVENTIONS
Name of Intervention Description of Intervention Objective of Intervention Expected Outcome
(A) Elimination of all
Tariff Values on
selected commodities.
o All tariff values/1 in the
commodities will be replaced
by current market value of
commodities.
o Broadening the domestic
VAT base
o Reduce cascading problems
in the existing VAT system.
Revenue to GDP is
expected to rise by
about 0.6 to
0.7percent.
(B) Automation of VAT
tax system under VAT
Online Program (VOP)
project
o All registration process for
VAT tax payers of the
current system will be
replaced by on-line system
o Enhancing the skill of tax
administrators through
developing new ICT system
for VAT collection
o Increase the number of active
registered VAT tax payers
from 50,000 in 2014-15 to
85,000 in 2018-19.
o Improve transparency in the
VAT administration
o Ensuring to provide better
services with the minimum
level of administrative costs
for tax payers, and to raise
awareness the need to
register and file to VAT.
Revenue to GDP is
expected to rise by 1
percentage point.
Note /1& Note /2: See tariff values in Box IV
Since the inception of VAT in 1991, NBR has introduced various ad hoc measures in the VAT system
which is only specific to Bangladesh. Since such specificity also includes tariff value further explanation
may be warranted. This is briefly discussed below.
Box IV: Tariff Value in the VAT System of Bangladesh
o Tariff values or administered value as tax bases for certain notified products. Tax base (i.e. in this case tariff
value) is composed Q and P. Assuming that Q is known, NBR essentially uses administered prices (P) which are
lower than market prices to derive the product specific tariff values. For example, market price of refined edible
oil in Bangladesh equals to 113,400 taka per metric ton; and a trader purchases an amount of 10 metric tons for
selling to the end customers. Thus, according to the VAT rule, the VAT base of refined soybean oil should be
(113,400 x 10). However, NBR uses the tariff value for per metric ton soybean as 4,110 taka. Given the same
quantity, the VAT base of refined soybean oil under the tariff value system will be (4,110 x 10). Thus, in this
manner the VAT bases have been truncated compared to the actual market price of specific commodities and
services that are not exempted in the VAT system.
10
Box IV: Tariff Value in the VAT System of Bangladesh
o It has been argued that use of lower than market prices for a number of products helped safeguard revenue as
well as to lessen the impact on domestic prices. Revenue collection from tariff value items in FY13-14 was Tk.
69.8 billion or 16% of total domestic indirect collected tax revenue (i.e. Tk. 429 billion).
Source: NBR VAT Structure, Bangladesh
Data and Methodology The analysis presented in the report is very data intensive, primarily based on secondary data
available from various official sources for recent years and using FY14 as the base. Import Values
with VAT, SD, and other different types of taxes and duties levied on imports such as customs duty
(CD), and regulatory duty (RD) have been collected from the ASYCUDA Plus/World system. This is
operated by the Customs Wing of the National Board of Revenue (NBR).Tariff Values set by the NBR
for various goods for the latest years (i.e. FY12 to FY14) have been generated from the information
contained in various budget documents. However, since this data set does not indicate the current
market prices for the products subject to tariff value, to overcome this information gap, interviews
have been conducted with key informants/market participants to gather market prices for the
relevant tariff value items. The aforementioned data has been used to estimate potential revenue
gains from the replacement of the tariff values in the VAT system.
However, additional data has been used to estimate the benefit from the second intervention –
automation in the VAT system under the VOP project5. Recently, 35,000 VAT tax payers have
maintained their VAT return on regular basis (active VAT payers), but National Board of
Revenue(NBR) notes about 600,000 listed VAT registered entities. In general, entities in the
5 VAT Online Program Project will introduce automation, including on-line VAT taxpayer services, and improve transparency in the VAT administration system. The project will support the government to implement the new VAT law which comes into effect in 2015, aims to reduce administrative costs, and seek to increase the number of active registered taxpayers from 35,00 to 85,000 in 2018-19.
automation system enjoy benefit to save the compliance cost that includes the cost relating to tax
accounting, preparing tax returns, submissions, settlements and dispute resolutions, covering both
in house and outsourcing. Because in an automated system each tax payers reduce compliance cost
to submit their return through the online. Thus, the savings of compliance cost from the VOP
program project will be considered as a benefit from this second intervention. To calculate the
benefit from the savings of an entity’s compliance cost, we use the survey data on Tax Perception
and Compliance Cost of the formal firms conducted by International Finance Corporation (IFC) in
April, 2013.6
There may be two types of costs: (i) direct cost of revenue mobilization; and (ii) indirect cost to
society – imposing taxes distort prices and resource allocation. Different types of tax expenditure
data have been collected from the Medium-term-Budgetary Framework (MTBF, 2014-15) to
calculate direct costs for tax collection. Moreover, we also use the VOP project’s costs from the
World Bank as another direct cost for the intervention of VAT automation. Information on the value
of Marginal Cost of Funding (i.e. raising tax revenue, MCF) has been obtained from various reports
on MCF calculations for the VAT of Bangladesh7. To assess the probable impact on welfare loss from
the expansion of VAT base, it has been used the MCF value of VAT that ranges from 1.07 to 1.18 as a
measure of the indirect cost of tax collection. If the MCF value exceeds unity, it indicates the welfare
loss. We use the highest possible value of the MCF based on different reports conducted to calculate
the MCF value of VAT or indirect taxes, to quantify indirect costs from distortion. Empirical evidence
suggests that replacing a cascading VAT system with a uniform base and reduction in the
exemptions, yields to less distortion and a lower level of welfare loss (Auriol & Warlters, 2009).
Though our proposed interventions expand the VAT bases that subsides the impact of tax distortion,
we also consider the highest value of MCF to estimate the maximum loss, which may actually be
lower than our calculations.
6 The survey of formal firms was carried out with 1000 firms to quantify the compliance costs for businesses registered with NBR (formal firms). This survey gathered information about the time and financial costs of complying with tax obligations and to help measure “non-traditional payments’. Databases of different business chambers was collected and used to develop a population frame of 6,933 formal firms, and finally survey was carried out 1000 firms as a sample. 7MCF value indicates the deadweight loss due to distortion from after taxation. MCF shows the changes in welfare loss due
to any incremental change in tax revenue from reforms. In this study it has been taken MCF values to estimate deadweight loss from the studies of Suithwart-Narueput&Thierfelder (2002) and Devaranjan et al (2001). Basically, they calculate the different MCF values to measure welfare loss based on Computed General Equilibrium (CGE) model for some selected developing countries. MCF technically corresponds to the “Equivalent Variation”.
12
There is no readily available method to estimate the benefit of additional revenue. It is assumed that
the additional revenue would be used as investment, leading to further income generation. We have
used an Input-Output model to assess the benefit of additional revenue gain, assuming that the
resource has been implemented efficiently.
Revenue Gains from Proposed Interventions Tariff value Elimination
Under the proposed intervention, existing tariff values have been replaced by market values to
determine the true VAT bases for the tariff value items. As mentioned above, tax base is defined as
Value = Q x P.NBR data shows revenue(R) against tariff value items. Assuming P as unity (P=1),
product specific tariff value is divided by product specific revenue to derive implicit quantities (Q) for
each tariff value item. After that, actual market prices8 are then used along with the estimated
quantities to derive actual tax bases for all tariff values. Finally, revenue gains from tariff value
elimination intervention have been estimated by imposing 15% VAT rate on the derived tax bases
(See detail in Appendix-1).
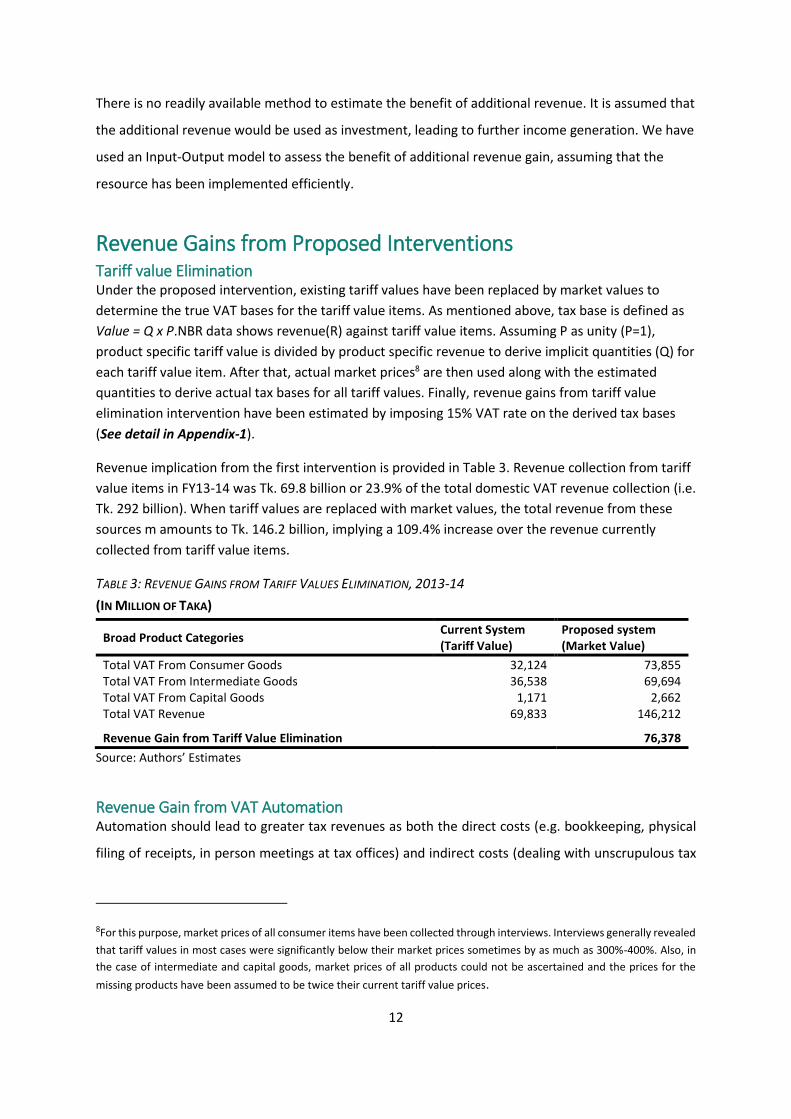
Revenue implication from the first intervention is provided in Table 3. Revenue collection from tariff
value items in FY13-14 was Tk. 69.8 billion or 23.9% of the total domestic VAT revenue collection (i.e.
Tk. 292 billion). When tariff values are replaced with market values, the total revenue from these
sources m amounts to Tk. 146.2 billion, implying a 109.4% increase over the revenue currently
collected from tariff value items.
TABLE 3: REVENUE GAINS FROM TARIFF VALUES ELIMINATION, 2013-14
(IN MILLION OF TAKA)
Broad Product Categories Current System (Tariff Value)
Proposed system (Market Value)
Total VAT From Consumer Goods 32,124 73,855 Total VAT From Intermediate Goods 36,538 69,694 Total VAT From Capital Goods 1,171 2,662 Total VAT Revenue 69,833 146,212
Revenue Gain from Tariff Value Elimination 76,378
Source: Authors’ Estimates
Revenue Gain from VAT Automation
Automation should lead to greater tax revenues as both the direct costs (e.g. bookkeeping, physical
filing of receipts, in person meetings at tax offices) and indirect costs (dealing with unscrupulous tax
8For this purpose, market prices of all consumer items have been collected through interviews. Interviews generally revealed
that tariff values in most cases were significantly below their market prices sometimes by as much as 300%-400%. Also, in
the case of intermediate and capital goods, market prices of all products could not be ascertained and the prices for the
missing products have been assumed to be twice their current tariff value prices.
13
officials) of tax compliance are reduced. This line of reasoning builds upon standard economic models
of criminal behavior, (e.g. Becker 1974), where an individual weighs off the benefits of committing the
crime, against the risk of getting caught and the costs of punishment, if caught. In this case, by reducing
compliance costs, the benefits of tax avoidance are lower, and at the margin should lead to increased
compliance and revenue generation.
India provides an example of the benefits of automating tax compliance. At the beginning of the
century, India underwent a number of tax reforms, including automation, which collectively raised the
tax-to-GDP ratio from 14% in 2001 to 20% in 2009 (Ernst and Young, 2011, Mansur and Yunus, 2012).
In terms of estimating the revenue gain in the Bangladesh context, the World Bank targets 50,000
more VAT payers and tax-to-GDP ratio increase of 1% (World Bank, 2015). Due to the absence of
specific data, we assume that each new tax payer is willing to pay 75% of the direct compliance cost
avoided by automation (Table 4 for the costs of compliance). This implies that each tax payer pays
about 480,000 taka per year in VAT, significantly less than the current average VAT payer liability of
approximately 1,000,000 taka.
Table 4: Revenue Gains from VAT Automation Under VOP Project
Components of Compliance Issue 2013-14 2018-19**
No. of active registered VAT Payers 35000 85000
Willingness to payment per VAT payers under VOP project1 479,745
Revenue Gain per year ((50,000 x 479,745)/ 5), In billions of Taka 24.0
Compliance Costs to VAT revenue ratio2 11.6 7.0
Assumptions:
Marginal reduction of compliance cost of per VAT payer*** 0 666,153
No of total VAT payers including active and non-active registered 113113 144364
No of non-active VAT payers 78113 59364 Source: Author’s Own estimates
** Indicates the end period of VOP Projects *** Marginal reduction of compliance cost equals to zero in 2013-14 because of no automation during this period.
/1 we consider that without any incentive new VAT payer will try to evade tax return if automation
reduces to compliance cost zero. In this line, any incentive is needed for new VAT payer. Here, we
assume the incentive for tax return as the positive gap between maximum benefits (Marginal
reduction of compliance cost per VAT payer) and the actual tax payment. Thus, tax return for each
new VAT payer must below the marginal reduction of compliance cost.
/2 compliance cost to VAT declines, but not zero because we consider only additional 50,000 non-
active registered VAT payers are involved in automation. This implies that a VAT payer in the
automation bears zero compliance cost.
14
It is estimated that the total revenue gain from VAT automation will amount to 24 billion taka per year
(0.18% of GDP) or 121.2 billion taka total over five years until the end of the VOP program project.
Thus, overall revenue gains from these two interventions amounts to 100.4 billion taka during 2013-
14 or 0.75 % of GDP.
Cost Implication of the Intervention Direct Cost from Tax Administration The previously discussed cost associated with the proposed interventions can be attributed to two
categories, i.e. direct administrative cost to collect revenue and the cost of the VOP projects for
automation in the VAT system and indirect cost which may generate from price distortion and welfare
or dead-weight loss due to the expansion of overall VAT base. The cost of the VOP projects for
automation in the VAT system and the administrative cost for revenue collection are found in the form
of material cost and manpower cost, i.e. staff salaries, infrastructure costs, training and capacity
development costs.
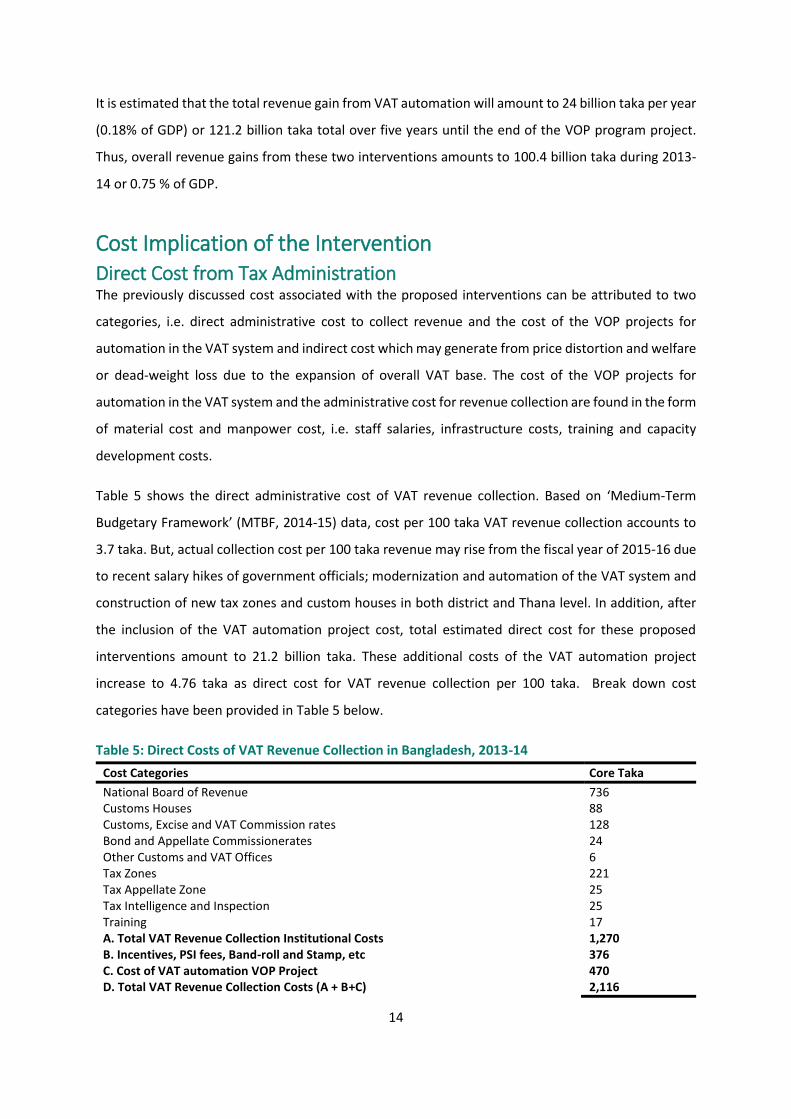
Table 5 shows the direct administrative cost of VAT revenue collection. Based on ‘Medium-Term
Budgetary Framework’ (MTBF, 2014-15) data, cost per 100 taka VAT revenue collection accounts to
3.7 taka. But, actual collection cost per 100 taka revenue may rise from the fiscal year of 2015-16 due
to recent salary hikes of government officials; modernization and automation of the VAT system and
construction of new tax zones and custom houses in both district and Thana level. In addition, after
the inclusion of the VAT automation project cost, total estimated direct cost for these proposed
interventions amount to 21.2 billion taka. These additional costs of the VAT automation project
increase to 4.76 taka as direct cost for VAT revenue collection per 100 taka. Break down cost
categories have been provided in Table 5 below.
Table 5: Direct Costs of VAT Revenue Collection in Bangladesh, 2013-14
Cost Categories Core Taka
National Board of Revenue 736 Customs Houses 88 Customs, Excise and VAT Commission rates 128 Bond and Appellate Commissionerates 24 Other Customs and VAT Offices 6 Tax Zones 221 Tax Appellate Zone 25 Tax Intelligence and Inspection 25 Training 17 A. Total VAT Revenue Collection Institutional Costs 1,270 B. Incentives, PSI fees, Band-roll and Stamp, etc 376 C. Cost of VAT automation VOP Project 470 D. Total VAT Revenue Collection Costs (A + B+C) 2,116
15
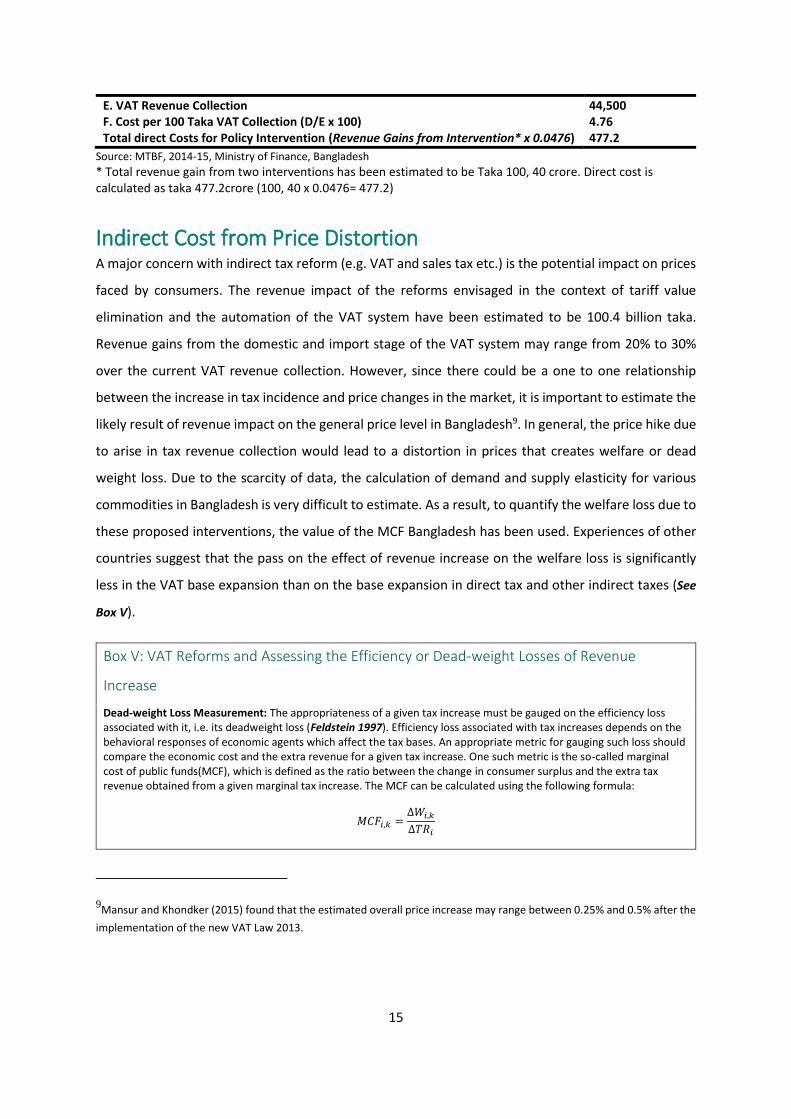
E. VAT Revenue Collection 44,500 F. Cost per 100 Taka VAT Collection (D/E x 100) 4.76 Total direct Costs for Policy Intervention (Revenue Gains from Intervention* x 0.0476) 477.2
Source: MTBF, 2014-15, Ministry of Finance, Bangladesh
* Total revenue gain from two interventions has been estimated to be Taka 100, 40 crore. Direct cost is calculated as taka 477.2crore (100, 40 x 0.0476= 477.2)
Indirect Cost from Price Distortion A major concern with indirect tax reform (e.g. VAT and sales tax etc.) is the potential impact on prices
faced by consumers. The revenue impact of the reforms envisaged in the context of tariff value
elimination and the automation of the VAT system have been estimated to be 100.4 billion taka.
Revenue gains from the domestic and import stage of the VAT system may range from 20% to 30%
over the current VAT revenue collection. However, since there could be a one to one relationship
between the increase in tax incidence and price changes in the market, it is important to estimate the
likely result of revenue impact on the general price level in Bangladesh9. In general, the price hike due
to arise in tax revenue collection would lead to a distortion in prices that creates welfare or dead
weight loss. Due to the scarcity of data, the calculation of demand and supply elasticity for various
commodities in Bangladesh is very difficult to estimate. As a result, to quantify the welfare loss due to
these proposed interventions, the value of the MCF Bangladesh has been used. Experiences of other
countries suggest that the pass on the effect of revenue increase on the welfare loss is significantly
less in the VAT base expansion than on the base expansion in direct tax and other indirect taxes (See
Box V).
Box V: VAT Reforms and Assessing the Efficiency or Dead-weight Losses of Revenue
Increase
Dead-weight Loss Measurement: The appropriateness of a given tax increase must be gauged on the efficiency loss associated with it, i.e. its deadweight loss (Feldstein 1997). Efficiency loss associated with tax increases depends on the behavioral responses of economic agents which affect the tax bases. An appropriate metric for gauging such loss should compare the economic cost and the extra revenue for a given tax increase. One such metric is the so-called marginal cost of public funds(MCF), which is defined as the ratio between the change in consumer surplus and the extra tax revenue obtained from a given marginal tax increase. The MCF can be calculated using the following formula:
𝑀𝐶𝐹𝑖,𝑘 =∆𝑊𝑖,𝑘
∆𝑇𝑅𝑖
9Mansur and Khondker (2015) found that the estimated overall price increase may range between 0.25% and 0.5% after the
implementation of the new VAT Law 2013.
16
Where, ∆𝑊𝑖,𝑘 is the welfare loss due to the increase of tax k in a country i and is calculated as the change in consumer
indirect utility function. ∆𝑇𝑅𝑖 indicates the change in tax revenue due to any reform. This technically corresponds to the equivalent variation. Therefore, MCF provides a metric for the loss in welfare per unit of tax revenue gain. If the MCF value equals one, the tax is merely a lump-sum transfer from households to government with distortion. Typically, however, the MCF is greater than one, so that MCF = 1 +α, with α>0 representing the cost of distortion. This means that for every taka that goes into the government’s purse, the economy pays an efficiency cost of α taka. Thus, the higher value of MCF, the larger the distortive cost associated with the tax revenue gains.
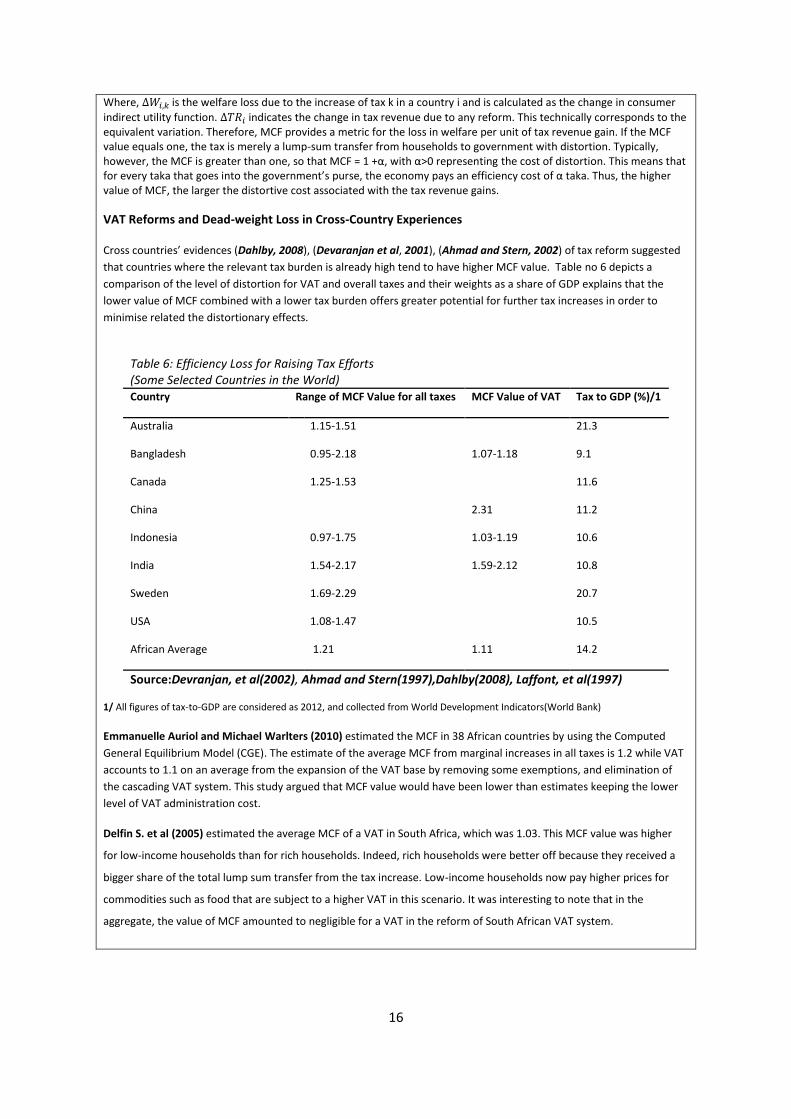
VAT Reforms and Dead-weight Loss in Cross-Country Experiences
Cross countries’ evidences (Dahlby, 2008), (Devaranjan et al, 2001), (Ahmad and Stern, 2002) of tax reform suggested
that countries where the relevant tax burden is already high tend to have higher MCF value. Table no 6 depicts a
comparison of the level of distortion for VAT and overall taxes and their weights as a share of GDP explains that the
lower value of MCF combined with a lower tax burden offers greater potential for further tax increases in order to
minimise related the distortionary effects.
Table 6: Efficiency Loss for Raising Tax Efforts (Some Selected Countries in the World) Country Range of MCF Value for all taxes MCF Value of VAT Tax to GDP (%)/1
Australia 1.15-1.51 21.3
Bangladesh 0.95-2.18 1.07-1.18 9.1
Canada 1.25-1.53 11.6
China 2.31 11.2
Indonesia 0.97-1.75 1.03-1.19 10.6
India 1.54-2.17 1.59-2.12 10.8
Sweden 1.69-2.29 20.7
USA 1.08-1.47 10.5
African Average 1.21 1.11 14.2
Source:Devranjan, et al(2002), Ahmad and Stern(1997),Dahlby(2008), Laffont, et al(1997)
1/ All figures of tax-to-GDP are considered as 2012, and collected from World Development Indicators(World Bank)
Emmanuelle Auriol and Michael Warlters (2010) estimated the MCF in 38 African countries by using the Computed
General Equilibrium Model (CGE). The estimate of the average MCF from marginal increases in all taxes is 1.2 while VAT
accounts to 1.1 on an average from the expansion of the VAT base by removing some exemptions, and elimination of
the cascading VAT system. This study argued that MCF value would have been lower than estimates keeping the lower
level of VAT administration cost.
Delfin S. et al (2005) estimated the average MCF of a VAT in South Africa, which was 1.03. This MCF value was higher
for low-income households than for rich households. Indeed, rich households were better off because they received a
bigger share of the total lump sum transfer from the tax increase. Low-income households now pay higher prices for
commodities such as food that are subject to a higher VAT in this scenario. It was interesting to note that in the
aggregate, the value of MCF amounted to negligible for a VAT in the reform of South African VAT system.
17
Since VAT and related revenues are essentially consumption tax paid by the final consumers, any
increase in revenue from these sources would need to be paid by the consumers. In other words,
consumers would be required to pay this additional amount in the form of higher prices. Thus, taxes
are distortionary, inducing changes in private sector behavior that are adverse to efficiency, and
impose a deadweight burden. In consequence, the MCF will typically be greater than one (Bevan. D,
2012). Overall deadweight loss also highly depends on the tax system in an economy. A poorly
designed tax system may actually reduce existing deadweight losses by accidentally offsetting a
distortion created elsewhere in the tax system. Thus, to test the effectiveness of any tax reform-either
direct or indirect taxes – it is logical to evaluate the estimated deadweight losses from reforms in
various tax categories.
One recommended approach is to estimate the impact on deadweight loss as a result of the
intervention or reform. In general, the estimation of MCF value by using the general equilibrium
framework (CGE) has been treated as a well-known approach to quantify deadweight loss due to
reforms in VAT10. But estimating the impact of these interventions is taken as reforms in VAT on
deadweight loss is beyond the scope of this paper. However, while assessing the revenue and welfare
or deadweight loss impacts of the VAT for developing countries, Devaranjan, Suthiwart-
Narueput&Thierfelder (2001) found that the estimated overall the marginal cost of VAT revenue fund
increase for Bangladesh ranged between 1.07 and 1.18 Bevan. D (2012), however, found that the
estimated overall marginal cost of the entire tax revenue fund increase for Bangladesh ranged
between 0.95 and 2.18. Obviously, the welfare loss of VAT reform is lower than the reforms in direct
and other import-base taxes (See Box-V).
Moreover, the range of estimated MCF value (1.07 to 1.18) of Bangladesh has been considered to
estimate the deadweight loss due to these VAT interventions. Thus, distortions faced by consumers
due to these interventions may have less deadweight loss. If we consider the lower bound of MCF
equals to 1.07, which implies that a 1 taka increase in VAT revenue yields 0.07 taka of deadweight loss,
while considering the upper bound of the MCF value of VAT deadweight loss per taka may amount to
0.18 taka in Bangladesh. Total revenue gain under the two interventions has been estimated to be
100.4 billion taka. Deadweight loss from price distortions has estimated from these interventions
amounts to 7 billion taka from the lower bound of MCF value, while, it increases to 18.1 billion taka in
10See details in Devaranjan et al (2001), Suithwart et al (2002), Auriol&Warlters (2009).
18
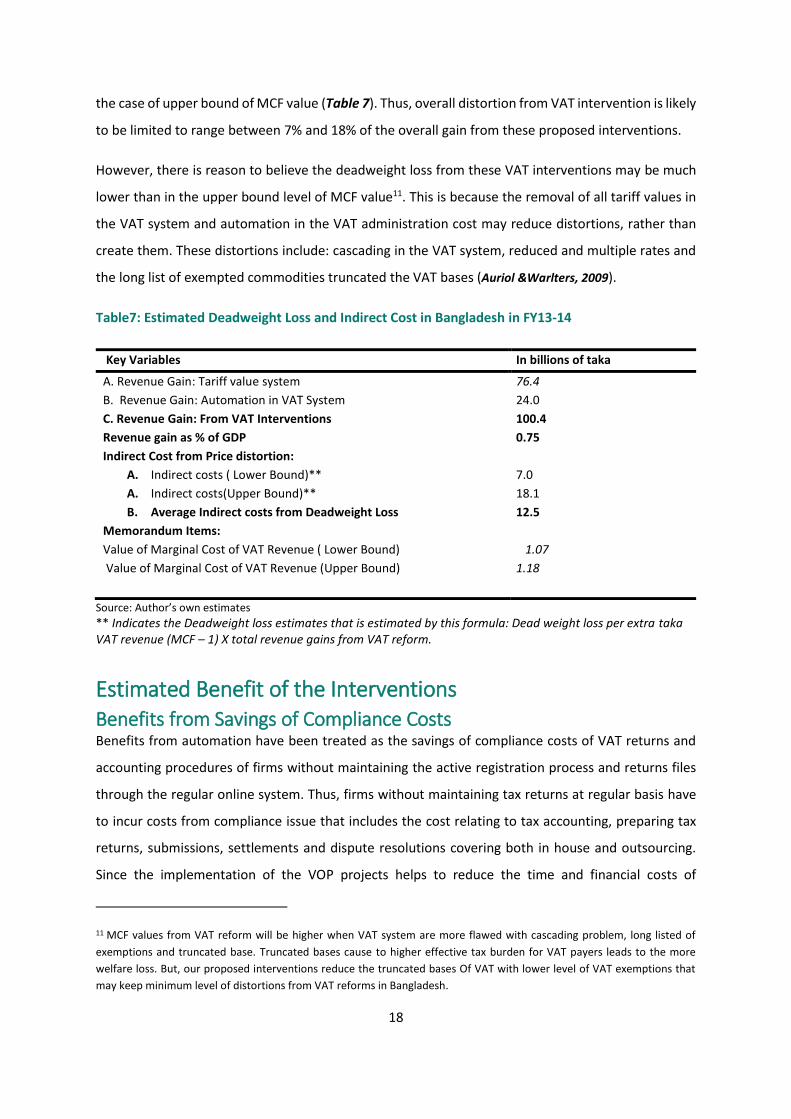
the case of upper bound of MCF value (Table 7). Thus, overall distortion from VAT intervention is likely
to be limited to range between 7% and 18% of the overall gain from these proposed interventions.
However, there is reason to believe the deadweight loss from these VAT interventions may be much
lower than in the upper bound level of MCF value11. This is because the removal of all tariff values in
the VAT system and automation in the VAT administration cost may reduce distortions, rather than
create them. These distortions include: cascading in the VAT system, reduced and multiple rates and
the long list of exempted commodities truncated the VAT bases (Auriol &Warlters, 2009).
Table7: Estimated Deadweight Loss and Indirect Cost in Bangladesh in FY13-14
Key Variables In billions of taka
A. Revenue Gain: Tariff value system 76.4
B. Revenue Gain: Automation in VAT System 24.0
C. Revenue Gain: From VAT Interventions 100.4
Revenue gain as % of GDP 0.75
Indirect Cost from Price distortion:
A. Indirect costs ( Lower Bound)** 7.0
A. Indirect costs(Upper Bound)** 18.1
B. Average Indirect costs from Deadweight Loss 12.5
Memorandum Items:
Value of Marginal Cost of VAT Revenue ( Lower Bound) 1.07
Value of Marginal Cost of VAT Revenue (Upper Bound) 1.18
Source: Author’s own estimates
** Indicates the Deadweight loss estimates that is estimated by this formula: Dead weight loss per extra taka VAT revenue (MCF – 1) X total revenue gains from VAT reform.
Estimated Benefit of the Interventions Benefits from Savings of Compliance Costs Benefits from automation have been treated as the savings of compliance costs of VAT returns and
accounting procedures of firms without maintaining the active registration process and returns files
through the regular online system. Thus, firms without maintaining tax returns at regular basis have
to incur costs from compliance issue that includes the cost relating to tax accounting, preparing tax
returns, submissions, settlements and dispute resolutions covering both in house and outsourcing.
Since the implementation of the VOP projects helps to reduce the time and financial costs of
11 MCF values from VAT reform will be higher when VAT system are more flawed with cascading problem, long listed of
exemptions and truncated base. Truncated bases cause to higher effective tax burden for VAT payers leads to the more
welfare loss. But, our proposed interventions reduce the truncated bases Of VAT with lower level of VAT exemptions that
may keep minimum level of distortions from VAT reforms in Bangladesh.
19
complying with tax obligations, the newly targeted 50,000 firms under VOP projects through
automation save their non-traditional payments (compliance costs) from the time of VAT returns.
Based on the Survey on Tax Perception and Compliance Cost of the Formal Sector, it has been
calculated that the total benefits or the total firms’ cost savings from compliance cost after
implementation of VOP projects. This benefit is calculated by using the formula given below:
(Number of active registered VAT payers in 2018-19 – Number of active registered VAT payers in
2013-14) x (Average reduction of marginal compliance costs for each firm in automation system)
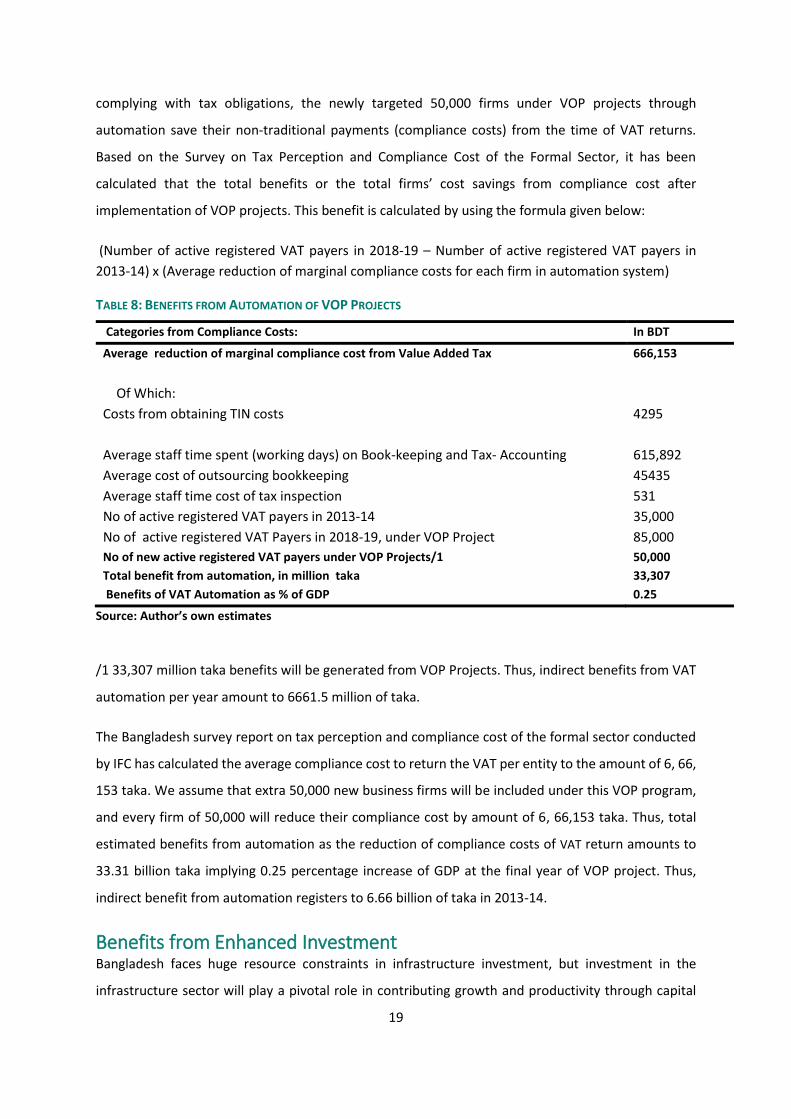
TABLE 8: BENEFITS FROM AUTOMATION OF VOP PROJECTS
Categories from Compliance Costs: In BDT
Average reduction of marginal compliance cost from Value Added Tax 666,153
Of Which:
Costs from obtaining TIN costs 4295
Average staff time spent (working days) on Book-keeping and Tax- Accounting 615,892
Average cost of outsourcing bookkeeping 45435
Average staff time cost of tax inspection 531
No of active registered VAT payers in 2013-14 35,000
No of active registered VAT Payers in 2018-19, under VOP Project 85,000
No of new active registered VAT payers under VOP Projects/1 50,000
Total benefit from automation, in million taka 33,307
Benefits of VAT Automation as % of GDP 0.25
Source: Author’s own estimates
/1 33,307 million taka benefits will be generated from VOP Projects. Thus, indirect benefits from VAT
automation per year amount to 6661.5 million of taka.
The Bangladesh survey report on tax perception and compliance cost of the formal sector conducted
by IFC has calculated the average compliance cost to return the VAT per entity to the amount of 6, 66,
153 taka. We assume that extra 50,000 new business firms will be included under this VOP program,
and every firm of 50,000 will reduce their compliance cost by amount of 6, 66,153 taka. Thus, total
estimated benefits from automation as the reduction of compliance costs of VAT return amounts to
33.31 billion taka implying 0.25 percentage increase of GDP at the final year of VOP project. Thus,
indirect benefit from automation registers to 6.66 billion of taka in 2013-14.
Benefits from Enhanced Investment Bangladesh faces huge resource constraints in infrastructure investment, but investment in the
infrastructure sector will play a pivotal role in contributing growth and productivity through capital
20
accumulation. Based on the World Bank report, Bangladesh needs to invest as much as 471 billion
taka per year to reach the investment target of 4.1– 5.5 trillion taka for transport, electricity and WSS
by 202012. In the context of Bangladesh, Annual Development Programs (ADP) has been used for
capital formation. A review of ADP allocations against the targets set out by World Bank suggests that
there are huge gaps between them. For instance, in FY14 ADP allocation to these sectors increased
only by 72 billion taka against the estimated requirements of 471 billion taka (the lower bound case)
and 634 billion taka (the upper bound case (Table-9). Given the extent of gaps, the additional revenues
are most likely to be allocated for investment in infrastructure.
Table-9. Bangladesh: Infrastructure Gaps and Investment Requirements
In billion of Taka
Categories of Investment: 2013-14 2014-15
Actual allocation in ADP
Transport 154 194
Electricity 91 93
WSS 55 105
Sub total 299 392
Allocation Increase, per year 72 93
Actual Requirement to fill Infrastructure Gap, per year/1 471 471
Actual Requirement to fill Infrastructure Gap, per year/2 634 634
Shortage of investment to fill Gap, per year/1 399 378
Shortage of investment to fill Gap, per year/2 562 541
Source: Authors own estimates. 1/ indicates lower bound case and 2/ indicates upper bound case
The additional revenue gain may be invested to generate income. We converted the Input-output
Table 2012 into an Input-output model to assess the total impact of additional investment. The total
revenue gain has been estimated at 100.4 billion taka. The additional revenue may be allocated to the
‘Annual Development Program (ADP), boosting productive capacity and income. However, funds
allocated for ADP are not entirely used for gross capital formation. It has been found that a significant
part of ADP has been used for salary and wages of project staff, maintenance and purchase of office
equipment, stationery etc. Although BBS in a dated study found the proportion of ADP allocation used
for non capital formation purpose is as high as 37%, no recent estimate is available. In this exercise
we have retained the 37% as non-capital formation expenditure. 63.24 billion taka would be available
for investment (i.e. 100.40 – 37.16 = 63.24 taka). Thus, 63.24 billion taka has been injected into the
Input-output model to determine the total benefit of additional investment. Estimated benefit has
12See Andres et al. (2013) for the description on the methodology for computing these estimates. World Bank estimates to
$59 billion of investment requirement in lower bound and $79.5 billion of investment requirement in upper bound for electricity, transports and WSS to mitigate investment gaps of these sectors.
21
been found to be 121 billion taka from additional investment. Table 9 shows that Bangladesh needs
471 billion to 634 billion taka per year for investments to close infrastructure gap. The Annual
Development Program (ADP) is the main source to fill up this gap. Though Bangladesh has become
able to increases allocation in ADP per year, this progress in ADP implementation seems to be
negligible in reducing the huge infrastructure gap. Thus, this additional 100.4 billion taka revenue gain
from these proposed interventions will be an additional source of financing for the government of
Bangladesh to finance in the various infrastructure projects.
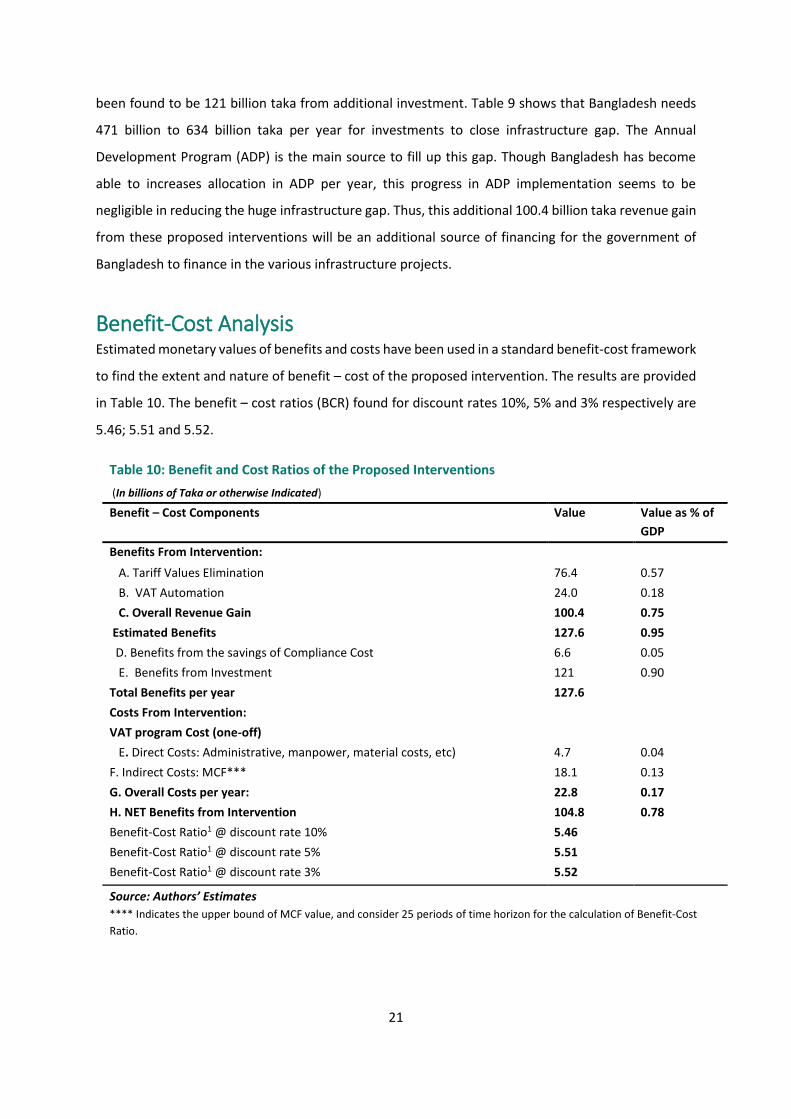
Benefit-Cost Analysis Estimated monetary values of benefits and costs have been used in a standard benefit-cost framework
to find the extent and nature of benefit – cost of the proposed intervention. The results are provided
in Table 10. The benefit – cost ratios (BCR) found for discount rates 10%, 5% and 3% respectively are
5.46; 5.51 and 5.52.
Table 10: Benefit and Cost Ratios of the Proposed Interventions
(In billions of Taka or otherwise Indicated)
Benefit – Cost Components Value Value as % of
GDP
Benefits From Intervention:
A. Tariff Values Elimination 76.4 0.57
B. VAT Automation 24.0 0.18
C. Overall Revenue Gain 100.4 0.75
Estimated Benefits 127.6 0.95
D. Benefits from the savings of Compliance Cost 6.6 0.05
E. Benefits from Investment 121 0.90
Total Benefits per year 127.6
Costs From Intervention:
VAT program Cost (one-off)
E. Direct Costs: Administrative, manpower, material costs, etc) 4.7 0.04
F. Indirect Costs: MCF*** 18.1 0.13
G. Overall Costs per year: 22.8 0.17
H. NET Benefits from Intervention 104.8 0.78
Benefit-Cost Ratio1 @ discount rate 10% 5.46
Benefit-Cost Ratio1 @ discount rate 5% 5.51
Benefit-Cost Ratio1 @ discount rate 3% 5.52
Source: Authors’ Estimates **** Indicates the upper bound of MCF value, and consider 25 periods of time horizon for the calculation of Benefit-Cost
Ratio.
22
Reference Auriol, E. M. Warlters (2012) “The Marginal Cost of Public Funds and Tax Reform in Africa” Journal of
Development Economics, 97, 58-72
Becker, Gary S. (1974), "Crime and punishment: an economic approach", in Becker, Gary S., Essays in
the economics of crime and punishment, New York: National Bureau of Economic Research
distributed by Columbia University Press, pp. 1–54
Bevan, D. (2012) “Fiscal Policy Issues for Tanzania” IGC Working Paper 10/0875
Dahlby, B. (2008), “The Marginal Cost of Public Funds: Theory and Applications”, The MIT Press,
Cambridge, Massachusetts and London, England
David Newhouse and Daria Zakharova, 2007, “Distributional Implications of the VAT Reform in the
Philippines” IMF Working Paper, WP/07/153
Devarajan, S., Suthiwart-Narueput, S. &Thierfelder, K. E. (2001), “The marginal cost of public funds in
developing countries, in ‘Policy Evaluations with Computable General Equilibrium Models’, Rutledge
Press, London and New York
Dinwiddy C., Teal F, “Principles of cost-benefits analysis for developing countries” Cambridge
University Press, 1996
Duanjie Chen, 2015, “The Framework for Assessing Tax Incentives: A Cost- Benefit Analysis
Approach”Workshop on Tax Incentives and Base Protection New York, 23-24 April 2015
El-Said, Moataz, and Robert Gillingham, 2005, “Uganda: Distributional Effects of Alternative Indirect
Tax Reforms,” Aide-Mémoire, May (Washington: International Monetary Fund).
Ernst and Young, 2011, ‘India, a new dawn’, EY Report available at:
Justin Tyson, January, 2014, “Reforming Tax Expenditures in Italy: What, Why, and How?” IMF
Working Paper, WP/14/7
Kay, J. A. and Davis, E. H. (1990). ‘The VAT and Services’ in Gillis, Malcolm, Carl S. Shoup, and Gerardo
P. Sicat (1990) (ed.). Value Added Taxation in Developing Countries. A World Bank Symposium, The
World Bank, Washington D.C., pp. 72-82
Kirkpatrick, C., Weiss, J., 2004, Cost-benefit Analysis and Project Appraisal in Developing Countries,
Elgar, Cheltenham
“Macroeconomic Outlooks for the Seventh Five Year Plan (2016-2020”, Ministry of Planning,
Bangladesh, January, 2015,
Mansur H. A., Yunus. Md and Nandi.K.B 2011, “An Evaluation of the Bangladesh Tax System”
International Growth Center (IGC), WP: 12, December, 2011.
23
Medium Term Budgetary Framework, 2014-15, Ministry of Finance, Bangladesh
NBR Annual Report, 2013-14, National Board of Revenue, Bangladesh.
“Revenue, Price and Protection Impacts of the New VAT Law” Working Paper: 2015, Policy Research Institute (PRI), Bangladesh.
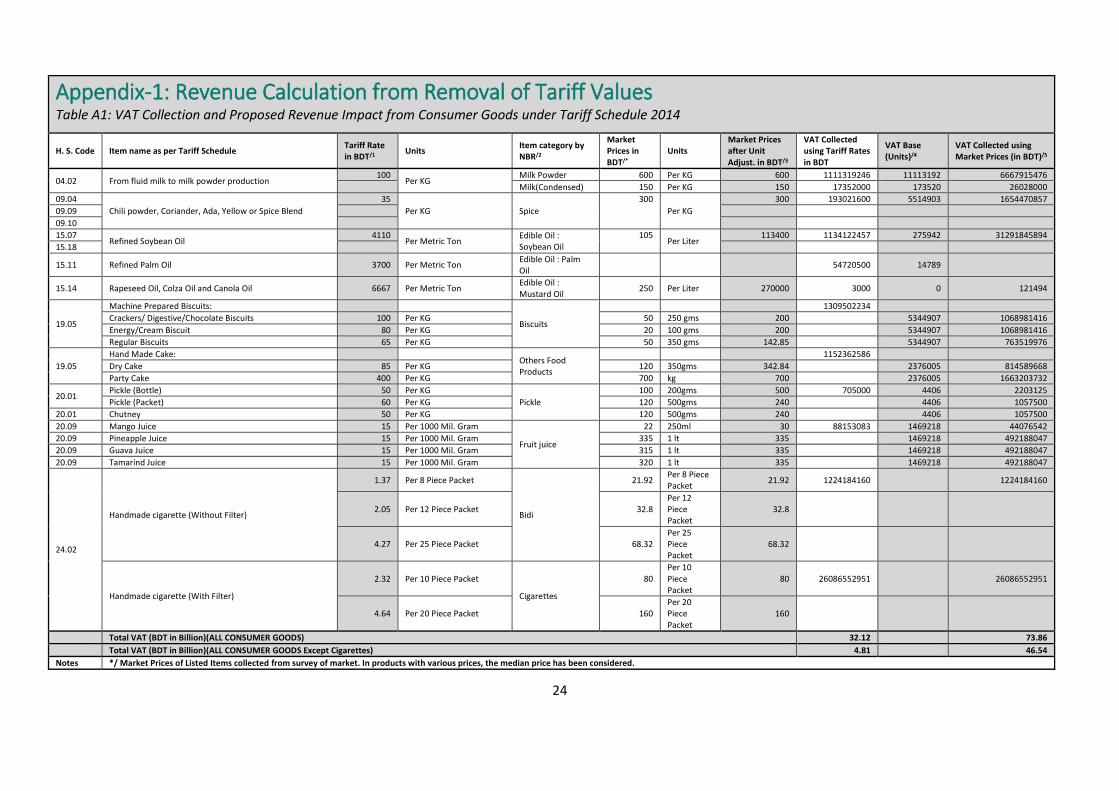
24
Appendix-1: Revenue Calculation from Removal of Tariff Values Table A1: VAT Collection and Proposed Revenue Impact from Consumer Goods under Tariff Schedule 2014
H. S. Code Item name as per Tariff Schedule Tariff Rate in BDT/1
Units Item category by NBR/2
Market Prices in BDT/*
Units Market Prices after Unit Adjust. in BDT/3
VAT Collected using Tariff Rates in BDT
VAT Base (Units)/4
VAT Collected using Market Prices (in BDT)/5
04.02 From fluid milk to milk powder production 100
Per KG Milk Powder 600 Per KG 600 1111319246 11113192 6667915476
Milk(Condensed) 150 Per KG 150 17352000 173520 26028000
09.04
Chili powder, Coriander, Ada, Yellow or Spice Blend
35
Per KG Spice
300
Per KG
300 193021600 5514903 1654470857
09.09
09.10
15.07 Refined Soybean Oil
4110 Per Metric Ton
Edible Oil : Soybean Oil
105 Per Liter
113400 1134122457 275942 31291845894
15.18
15.11 Refined Palm Oil 3700 Per Metric Ton Edible Oil : Palm Oil
54720500 14789
15.14 Rapeseed Oil, Colza Oil and Canola Oil 6667 Per Metric Ton Edible Oil : Mustard Oil
250 Per Liter 270000 3000 0 121494
19.05
Machine Prepared Biscuits:
Biscuits
1309502234
Crackers/ Digestive/Chocolate Biscuits 100 Per KG 50 250 gms 200 5344907 1068981416
Energy/Cream Biscuit 80 Per KG 20 100 gms 200 5344907 1068981416
Regular Biscuits 65 Per KG 50 350 gms 142.85 5344907 763519976
19.05
Hand Made Cake: Others Food Products
1152362586
Dry Cake 85 Per KG 120 350gms 342.84 2376005 814589668
Party Cake 400 Per KG 700 kg 700 2376005 1663203732
20.01 Pickle (Bottle) 50 Per KG
Pickle
100 200gms 500 705000 4406 2203125
Pickle (Packet) 60 Per KG 120 500gms 240 4406 1057500
20.01 Chutney 50 Per KG 120 500gms 240 4406 1057500
20.09 Mango Juice 15 Per 1000 Mil. Gram
Fruit juice
22 250ml 30 88153083 1469218 44076542
20.09 Pineapple Juice 15 Per 1000 Mil. Gram 335 1 lt 335 1469218 492188047
20.09 Guava Juice 15 Per 1000 Mil. Gram 315 1 lt 335 1469218 492188047
20.09 Tamarind Juice 15 Per 1000 Mil. Gram 320 1 lt 335 1469218 492188047
24.02
Handmade cigarette (Without Filter)
1.37 Per 8 Piece Packet
Bidi
21.92 Per 8 Piece Packet
21.92 1224184160 1224184160
2.05 Per 12 Piece Packet 32.8 Per 12 Piece Packet
32.8
4.27 Per 25 Piece Packet 68.32 Per 25 Piece Packet
68.32
Handmade cigarette (With Filter)
2.32 Per 10 Piece Packet
Cigarettes
80 Per 10 Piece Packet
80 26086552951 26086552951
4.64 Per 20 Piece Packet 160 Per 20 Piece Packet
160
Total VAT (BDT in Billion)(ALL CONSUMER GOODS) 32.12 73.86
Total VAT (BDT in Billion)(ALL CONSUMER GOODS Except Cigarettes) 4.81 46.54
Notes */ Market Prices of Listed Items collected from survey of market. In products with various prices, the median price has been considered.
25
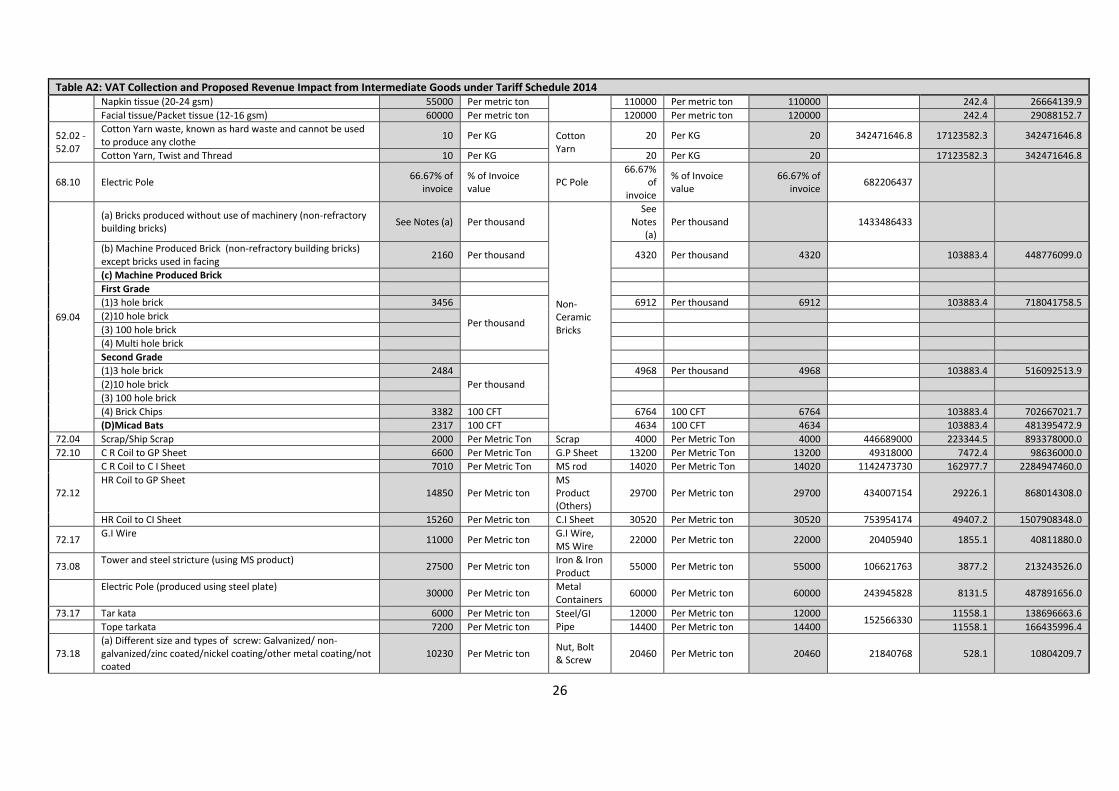
Table A2: VAT Collection and Proposed Revenue Impact from Intermediate Goods under Tariff Schedule 2014
H. S. Code
Item name as per Tariff Schedule Tariff Rate in BDT/1
Units Item category by NBR/2
Market Prices in BDT/*
Units
Market Prices after Unit Adjustment in BDT/3
VAT Collected using Tariff Rates in BDT
VAT Base (Units)/4
VAT Collected using Market Prices (in BDT)/5
27.01 Coal from Bara Pukiria Coal Mine $10 Per Metric Ton POL Products
$20 Per Metric Ton $20 10529606169 13162007.7 21059212338.0
72.04 Scrap/Ship Scrap 2000 Per Metric Ton Scrap 4000 Per Metric Ton 4000 446689000 223344.5 893378000.0
72.10 C R Coil to GP Sheet 6600 Per Metric Ton G.P Sheet 13200 Per Metric Ton 13200 49318000 7472.4 98636000.0
72.12
C R Coil to C I Sheet 7010 Per Metric Ton MS rod 14020 Per Metric Ton 14020 1142473730 162977.7 2284947460.0
HR Coil to GP Sheet 14850 Per Metric ton
MS Product (Others)
29700 Per Metric ton 29700 434007154 29226.1 868014308.0
HR Coil to CI Sheet 15260 Per Metric ton C.I Sheet 30520 Per Metric ton 30520 753954174 49407.2 1507908348.0
72.17 G.I Wire
11000 Per Metric ton G.I Wire, MS Wire
22000 Per Metric ton 22000 20405940 1855.1 40811880.0
73.08 Tower and steel stricture (using MS product)
27500 Per Metric ton Iron & Iron Product
55000 Per Metric ton 55000 106621763 3877.2 213243526.0
Electric Pole (produced using steel plate)
30000 Per Metric ton Metal Containers
60000 Per Metric ton 60000 243945828 8131.5 487891656.0
73.17 Tar kata 6000 Per Metric ton Steel/GI Pipe
12000 Per Metric ton 12000 152566330
11558.1 138696663.6
Tope tarkata 7200 Per Metric ton 14400 Per Metric ton 14400 11558.1 166435996.4
73.18 (a) Different size and types of screw: Galvanized/ non-galvanized/zinc coated/nickel coating/other metal coating/not coated
10230 Per Metric ton Nut, Bolt & Screw
20460 Per Metric ton 20460 21840768 528.1 10804209.7
27
Table A2: VAT Collection and Proposed Revenue Impact from Intermediate Goods under Tariff Schedule 2014
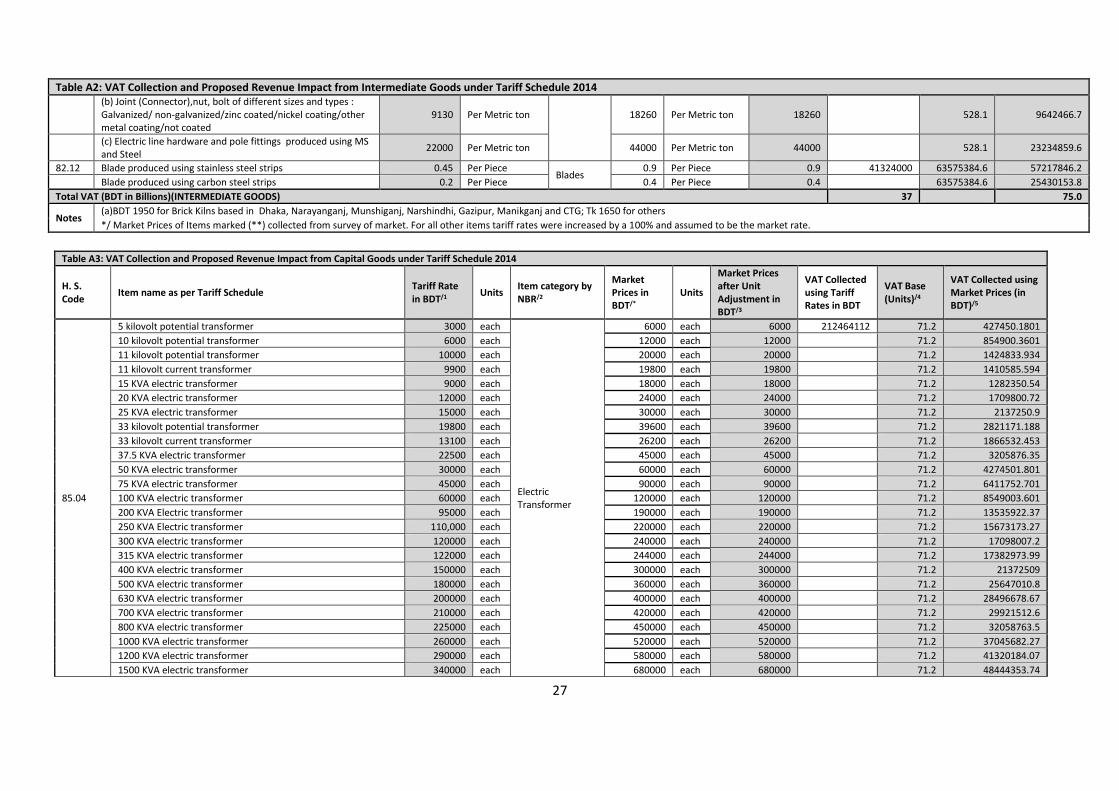
(b) Joint (Connector),nut, bolt of different sizes and types : Galvanized/ non-galvanized/zinc coated/nickel coating/other metal coating/not coated
9130 Per Metric ton 18260 Per Metric ton 18260 528.1 9642466.7
(c) Electric line hardware and pole fittings produced using MS and Steel
22000 Per Metric ton 44000 Per Metric ton 44000 528.1 23234859.6
82.12 Blade produced using stainless steel strips 0.45 Per Piece Blades
0.9 Per Piece 0.9 41324000 63575384.6 57217846.2
Blade produced using carbon steel strips 0.2 Per Piece 0.4 Per Piece 0.4 63575384.6 25430153.8
Total VAT (BDT in Billions)(INTERMEDIATE GOODS) 37 75.0
Notes (a)BDT 1950 for Brick Kilns based in Dhaka, Narayanganj, Munshiganj, Narshindhi, Gazipur, Manikganj and CTG; Tk 1650 for others
*/ Market Prices of Items marked (**) collected from survey of market. For all other items tariff rates were increased by a 100% and assumed to be the market rate.
Table A3: VAT Collection and Proposed Revenue Impact from Capital Goods under Tariff Schedule 2014
H. S. Code
Item name as per Tariff Schedule Tariff Rate in BDT/1
Units Item category by NBR/2
Market Prices in BDT/*
Units
Market Prices after Unit Adjustment in BDT/3
VAT Collected using Tariff Rates in BDT
VAT Base (Units)/4
VAT Collected using Market Prices (in BDT)/5
85.04
5 kilovolt potential transformer 3000 each
Electric Transformer
6000 each 6000 212464112 71.2 427450.1801
10 kilovolt potential transformer 6000 each 12000 each 12000 71.2 854900.3601
11 kilovolt potential transformer 10000 each 20000 each 20000 71.2 1424833.934
11 kilovolt current transformer 9900 each 19800 each 19800 71.2 1410585.594
15 KVA electric transformer 9000 each 18000 each 18000 71.2 1282350.54
20 KVA electric transformer 12000 each 24000 each 24000 71.2 1709800.72
25 KVA electric transformer 15000 each 30000 each 30000 71.2 2137250.9
33 kilovolt potential transformer 19800 each 39600 each 39600 71.2 2821171.188
33 kilovolt current transformer 13100 each 26200 each 26200 71.2 1866532.453
37.5 KVA electric transformer 22500 each 45000 each 45000 71.2 3205876.35
50 KVA electric transformer 30000 each 60000 each 60000 71.2 4274501.801
75 KVA electric transformer 45000 each 90000 each 90000 71.2 6411752.701
100 KVA electric transformer 60000 each 120000 each 120000 71.2 8549003.601
200 KVA Electric transformer 95000 each 190000 each 190000 71.2 13535922.37
250 KVA Electric transformer 110,000 each 220000 each 220000 71.2 15673173.27
300 KVA electric transformer 120000 each 240000 each 240000 71.2 17098007.2
315 KVA electric transformer 122000 each 244000 each 244000 71.2 17382973.99
400 KVA electric transformer 150000 each 300000 each 300000 71.2 21372509
500 KVA electric transformer 180000 each 360000 each 360000 71.2 25647010.8
630 KVA electric transformer 200000 each 400000 each 400000 71.2 28496678.67
700 KVA electric transformer 210000 each 420000 each 420000 71.2 29921512.6
800 KVA electric transformer 225000 each 450000 each 450000 71.2 32058763.5
1000 KVA electric transformer 260000 each 520000 each 520000 71.2 37045682.27
1200 KVA electric transformer 290000 each 580000 each 580000 71.2 41320184.07
1500 KVA electric transformer 340000 each 680000 each 680000 71.2 48444353.74
28
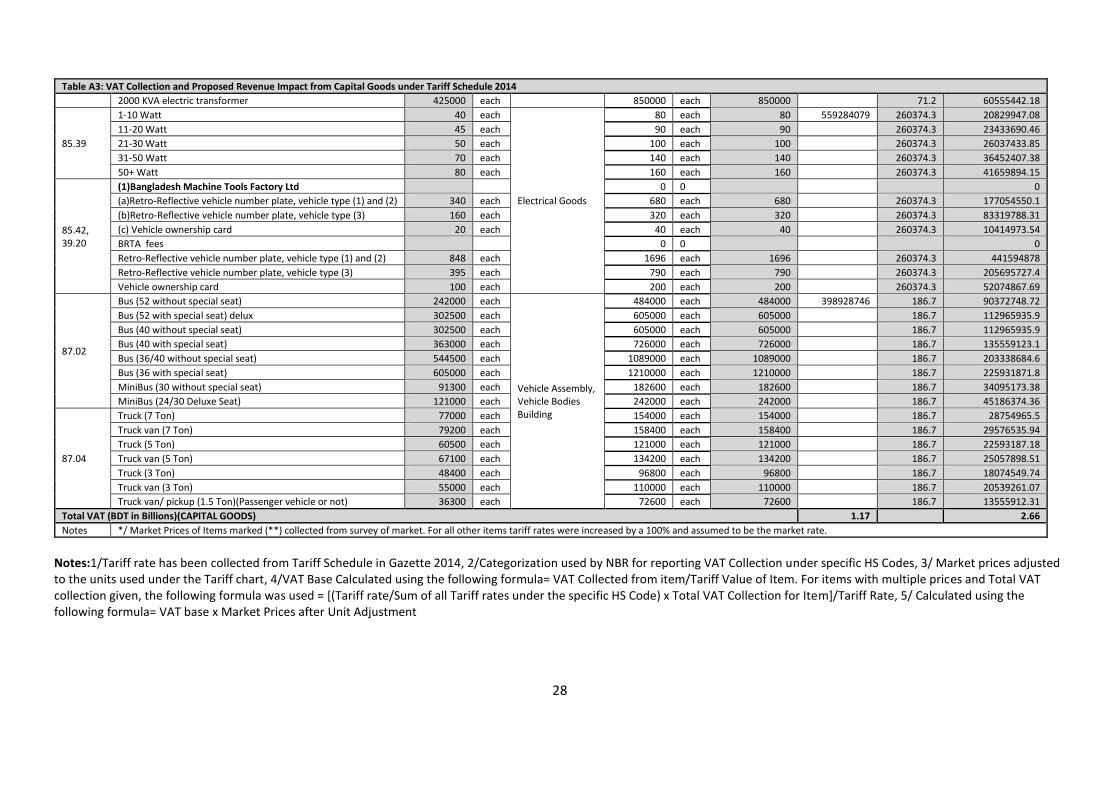
Table A3: VAT Collection and Proposed Revenue Impact from Capital Goods under Tariff Schedule 2014
2000 KVA electric transformer 425000 each 850000 each 850000 71.2 60555442.18
85.39
1-10 Watt 40 each
Electrical Goods
80 each 80 559284079 260374.3 20829947.08
11-20 Watt 45 each 90 each 90 260374.3 23433690.46
21-30 Watt 50 each 100 each 100 260374.3 26037433.85
31-50 Watt 70 each 140 each 140 260374.3 36452407.38
50+ Watt 80 each 160 each 160 260374.3 41659894.15
85.42, 39.20
(1)Bangladesh Machine Tools Factory Ltd 0 0 0
(a)Retro-Reflective vehicle number plate, vehicle type (1) and (2) 340 each 680 each 680 260374.3 177054550.1
(b)Retro-Reflective vehicle number plate, vehicle type (3) 160 each 320 each 320 260374.3 83319788.31
(c) Vehicle ownership card 20 each 40 each 40 260374.3 10414973.54
BRTA fees 0 0 0
Retro-Reflective vehicle number plate, vehicle type (1) and (2) 848 each 1696 each 1696 260374.3 441594878
Retro-Reflective vehicle number plate, vehicle type (3) 395 each 790 each 790 260374.3 205695727.4
Vehicle ownership card 100 each 200 each 200 260374.3 52074867.69
87.02
Bus (52 without special seat) 242000 each
Vehicle Assembly, Vehicle Bodies Building
484000 each 484000 398928746 186.7 90372748.72
Bus (52 with special seat) delux 302500 each 605000 each 605000 186.7 112965935.9
Bus (40 without special seat) 302500 each 605000 each 605000 186.7 112965935.9
Bus (40 with special seat) 363000 each 726000 each 726000 186.7 135559123.1
Bus (36/40 without special seat) 544500 each 1089000 each 1089000 186.7 203338684.6
Bus (36 with special seat) 605000 each 1210000 each 1210000 186.7 225931871.8
MiniBus (30 without special seat) 91300 each 182600 each 182600 186.7 34095173.38
MiniBus (24/30 Deluxe Seat) 121000 each 242000 each 242000 186.7 45186374.36
87.04
Truck (7 Ton) 77000 each 154000 each 154000 186.7 28754965.5
Truck van (7 Ton) 79200 each 158400 each 158400 186.7 29576535.94
Truck (5 Ton) 60500 each 121000 each 121000 186.7 22593187.18
Truck van (5 Ton) 67100 each 134200 each 134200 186.7 25057898.51
Truck (3 Ton) 48400 each 96800 each 96800 186.7 18074549.74
Truck van (3 Ton) 55000 each 110000 each 110000 186.7 20539261.07
Truck van/ pickup (1.5 Ton)(Passenger vehicle or not) 36300 each 72600 each 72600 186.7 13555912.31
Total VAT (BDT in Billions)(CAPITAL GOODS) 1.17 2.66
Notes */ Market Prices of Items marked (**) collected from survey of market. For all other items tariff rates were increased by a 100% and assumed to be the market rate.
Notes:1/Tariff rate has been collected from Tariff Schedule in Gazette 2014, 2/Categorization used by NBR for reporting VAT Collection under specific HS Codes, 3/ Market prices adjusted to the units used under the Tariff chart, 4/VAT Base Calculated using the following formula= VAT Collected from item/Tariff Value of Item. For items with multiple prices and Total VAT collection given, the following formula was used = [(Tariff rate/Sum of all Tariff rates under the specific HS Code) x Total VAT Collection for Item]/Tariff Rate, 5/ Calculated using the following formula= VAT base x Market Prices after Unit Adjustment
29
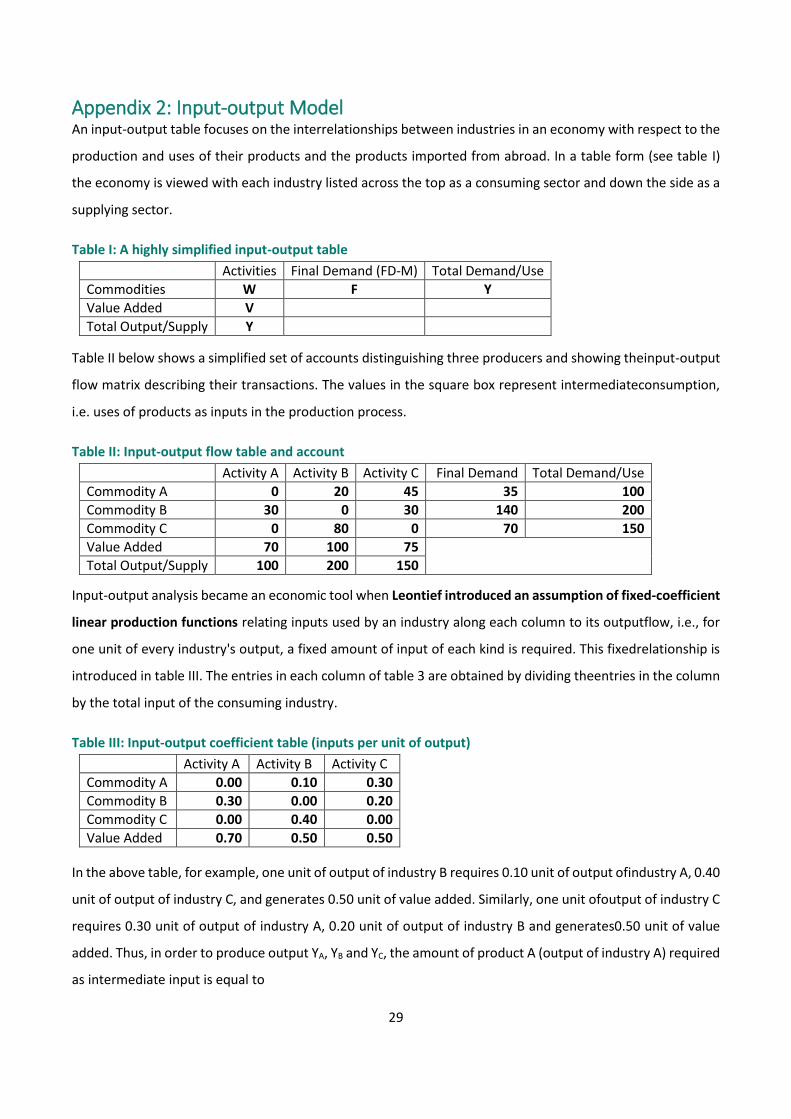
Appendix 2: Input-output Model An input-output table focuses on the interrelationships between industries in an economy with respect to the
production and uses of their products and the products imported from abroad. In a table form (see table I)
the economy is viewed with each industry listed across the top as a consuming sector and down the side as a
supplying sector.
Table I: A highly simplified input-output table
Activities Final Demand (FD-M) Total Demand/Use
Commodities W F Y
Value Added V
Total Output/Supply Y
Table II below shows a simplified set of accounts distinguishing three producers and showing theinput-output
flow matrix describing their transactions. The values in the square box represent intermediateconsumption,
i.e. uses of products as inputs in the production process.
Table II: Input-output flow table and account
Activity A Activity B Activity C Final Demand Total Demand/Use
Commodity A 0 20 45 35 100
Commodity B 30 0 30 140 200
Commodity C 0 80 0 70 150
Value Added 70 100 75
Total Output/Supply 100 200 150
Input-output analysis became an economic tool when Leontief introduced an assumption of fixed-coefficient
linear production functions relating inputs used by an industry along each column to its outputflow, i.e., for
one unit of every industry's output, a fixed amount of input of each kind is required. This fixedrelationship is
introduced in table III. The entries in each column of table 3 are obtained by dividing theentries in the column
by the total input of the consuming industry.
Table III: Input-output coefficient table (inputs per unit of output)
Activity A Activity B Activity C
Commodity A 0.00 0.10 0.30
Commodity B 0.30 0.00 0.20
Commodity C 0.00 0.40 0.00
Value Added 0.70 0.50 0.50
In the above table, for example, one unit of output of industry B requires 0.10 unit of output ofindustry A, 0.40
unit of output of industry C, and generates 0.50 unit of value added. Similarly, one unit ofoutput of industry C
requires 0.30 unit of output of industry A, 0.20 unit of output of industry B and generates0.50 unit of value
added. Thus, in order to produce output YA, YB and YC, the amount of product A (output of industry A) required
as intermediate input is equal to
30
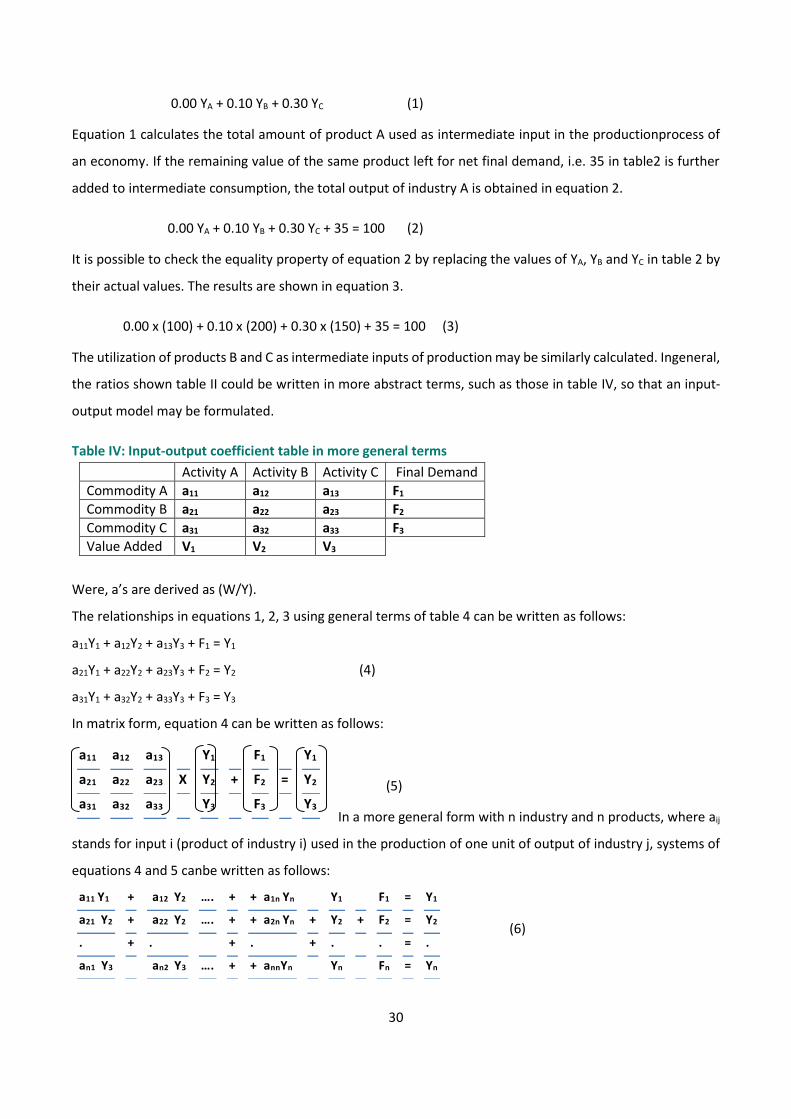
0.00 YA + 0.10 YB + 0.30 YC (1)
Equation 1 calculates the total amount of product A used as intermediate input in the productionprocess of
an economy. If the remaining value of the same product left for net final demand, i.e. 35 in table2 is further
added to intermediate consumption, the total output of industry A is obtained in equation 2.
0.00 YA + 0.10 YB + 0.30 YC + 35 = 100 (2)
It is possible to check the equality property of equation 2 by replacing the values of YA, YB and YC in table 2 by
their actual values. The results are shown in equation 3.
0.00 x (100) + 0.10 x (200) + 0.30 x (150) + 35 = 100 (3)
The utilization of products B and C as intermediate inputs of production may be similarly calculated. Ingeneral,
the ratios shown table II could be written in more abstract terms, such as those in table IV, so that an input-
output model may be formulated.
Table IV: Input-output coefficient table in more general terms
Activity A Activity B Activity C Final Demand
Commodity A a11 a12 a13 F1
Commodity B a21 a22 a23 F2
Commodity C a31 a32 a33 F3
Value Added V1 V2 V3
Were, a’s are derived as (W/Y).
The relationships in equations 1, 2, 3 using general terms of table 4 can be written as follows:
a11Y1 + a12Y2 + a13Y3 + F1 = Y1
a21Y1 + a22Y2 + a23Y3 + F2 = Y2 (4)
a31Y1 + a32Y2 + a33Y3 + F3 = Y3
In matrix form, equation 4 can be written as follows:
(5)
In a more general form with n industry and n products, where aij
stands for input i (product of industry i) used in the production of one unit of output of industry j, systems of
equations 4 and 5 canbe written as follows:
(6)
a11 a12 a13 Y1 F1 Y1
a21 a22 a23 X Y2 + F2 = Y2
a31 a32 a33 Y3 F3 Y3
a11 Y1 + a12 Y2 …. + + a1n Yn Y1 F1 = Y1
a21 Y2 + a22 Y2 …. + + a2n Yn + Y2 + F2 = Y2
. + . + . + . . = .
an1 Y3 an2 Y3 …. + + annYn Yn Fn = Yn
31
And in matrix form,
(7)
The computation of the coefficient matrix can be described in the following mathematical form:
aij= 𝑊𝑖𝑗
𝑌𝑗
Where Wij stands for an element of the flow table as described in table 1. Equation 7 is usually written in
matrix form, as
AX + Y = X (8)
Relationship 8 is the basic input-output system of equations. Matrix A is called the input-outputcoefficient
matrix, vector X is the vector of output and vector Y is the vector of net final demand. Thedimension (size) of
matrix A is constrained only by the statistical information on inputs and outputsavailable to statisticians since
some countries have constructed input-output tables of up to almost 500industries.
Inverse Matrix (Solution of an input-output model) Equations in the form of equation 8 are much more suitable to model-building or analysis. If thevalues of the
coefficients and of net final demand are known, then it is possible to solve this set ofsimultaneous equations
in order to find the level of output of various industries necessary to satisfy thespecified level of net final
demand.
Mathematically, the vector of output X in the system of equation 8 can be solved as follows:
X - AX = Y
(I - A)X = Y (9)
X = (I - A)-1 Y
Where, I stand for the identity matrix which is a square matrix where all the diagonal elements are equal to1
and all other elements are equal to zero. (I - A)-1 is the Leontief inverse which can be calculated.
Bangladesh, like most nations, faces a large number of challenges. What should be the top priorities for policy makers, international donors, NGOs and businesses? With limited resources and time, it is crucial that focus is informed by what will do the most good for each taka spent. The Bangladesh Priorities project, a collaboration between Copenhagen Consensus and BRAC, works with stakeholders across Bangladesh to find, analyze, rank and disseminate the best solutions for the country. We engage Bangladeshis from all parts of society, through readers of newspapers, along with NGOs, decision makers, sector experts and businesses to propose the best solutions. We have commissioned some of the best economists from Bangladesh and the world to calculate the social, environmental and economic costs and benefits of these proposals. This research will help set priorities for the country through a nationwide conversation about what the smart - and not-so-smart - solutions are for Bangladesh's future.
For more information vis it w ww .Bangladesh -Prior it ies.com
C O P E N H A G E N C O N S E N S U S C E N T E R Copenhagen Consensus Center is a think tank that investigates and publishes the best policies and investment opportunities based on social good (measured in dollars, but also incorporating e.g. welfare, health and environmental protection) for every dollar spent. The Copenhagen Consensus was conceived to address a fundamental, but overlooked topic in international development: In a world with limited budgets and attention spans, we need to find effective ways to do the most good for the most people. The Copenhagen Consensus works with 300+ of the world's top economists including 7 Nobel Laureates to prioritize solutions to the world's biggest problems, on the basis of data and cost-benefit analysis.