Cost-Benefit Approach to Public Support of Private R&D Activity Bettina Peters Centre for European Economic Research (ZEW) [email protected]DIMETIC Doctoral European Summer School Pecs, July 14, 2010
Transcript
Cost-Benefit Approach to
Public Support of Private
R&D Activity
Bettina Peters Centre for European Economic Research (ZEW)
■ Striking empirical evidence that innovation is a key driver for productivity and employment growth
■ Concern: Level of R&D investments in the economy might be suboptimal (low) due to three main reasons:
● Financial constraints• Market failure due to asymmetric information between borrowers and
lenders( especially for young and small firms)
● Investment under uncertainty• Uncertainty impedes access to external finance • Firms may delay investment in R&D projects due to outcome uncertainty
(real option theory)
● Positive external effects of R&D• Market failure due to imperfect appropriability of returns (knowledge
spillovers)
Motivation
■ I will focus only on the third argument: Do such spillovers exist and if yes to what extent?
lecture today: part I: Estimating spillovers
■ Negative investment effects due to spillovers may be mitigated by innovation policies such as public R&D subsidies or by introducing IPR‘s
● Public subsidies reduce private cost of R&D and therefore close the gap between social and private equilibrium
Motivation
■ Lisbon-Agenda (2010) & EU2020-Agenda
● Stimulating growth and competitiveness through R&D and innovation (R&D&I)
● Supporting industrial R&D
• R&D Tax credits
• Technology-specific R&D programmes
● Supporting basic research (allocating more funds to universities, introduction of ERC, etc.)
● Beyond (traditional) R&D policy: Using other instruments to stimulate R&D and innovation
• at EU level: Structural/regional funds & EIB
• at national level: stimulating VC investment + technology transfer
● EU2020: broader focus, but one aim is still to foster smart growth through R&D&I
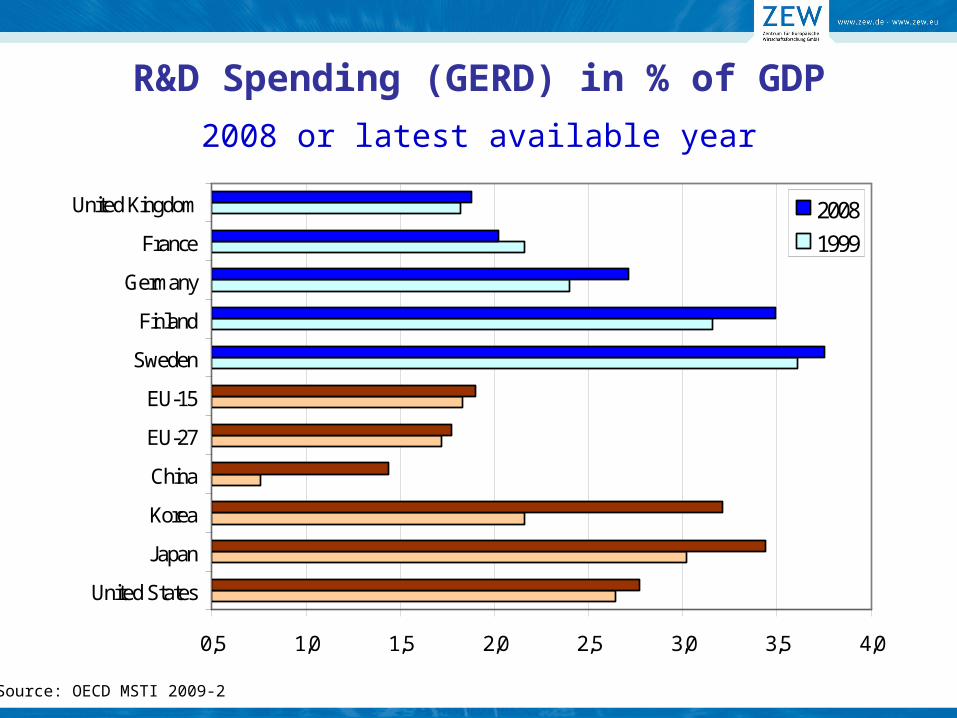
R&D Spending (GERD) in % of GDP
0,5 1,0 1,5 2,0 2,5 3,0 3,5 4,0
United States
Japan
Korea
China
EU-27
EU-15
Sweden
Finland
Germany
France
United Kingdom 20081999
Source: OECD MSTI 2009-2
2008 or latest available year
GERD financed by Private Sector in % of GDP
0,0 0,5 1,0 1,5 2,0 2,5 3,0
United States
Japan
Korea
China
EU-27
EU-15
Sweden
Finland
Germany
France
United Kingdom 20081999
Source: OECD MSTI 2009-2
2008 or latest available year
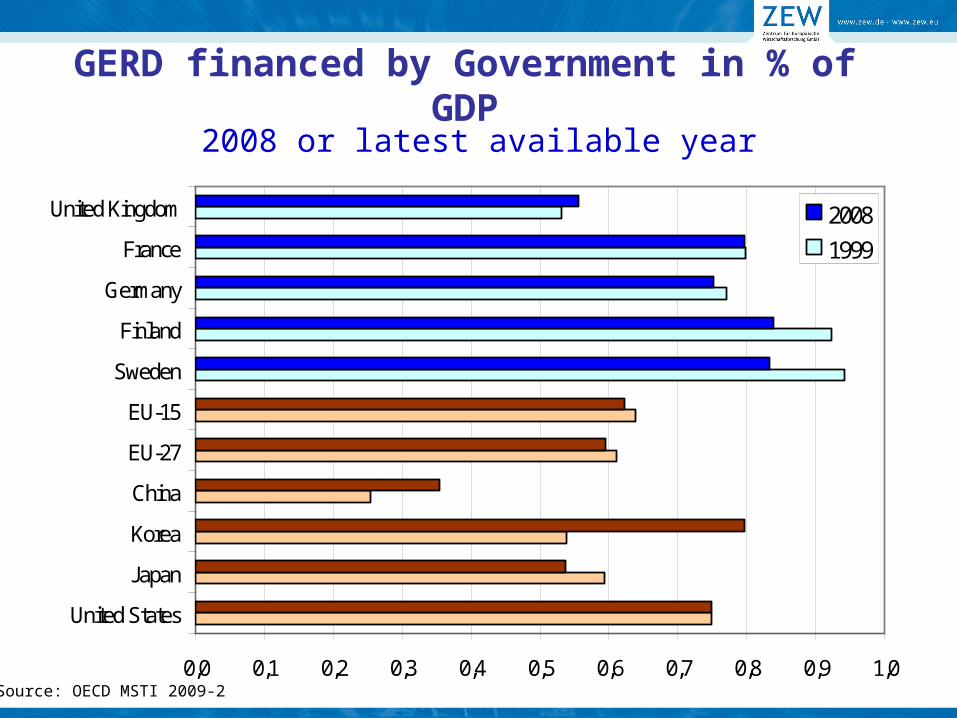
GERD financed by Government in % of GDP
0,0 0,1 0,2 0,3 0,4 0,5 0,6 0,7 0,8 0,9 1,0
United States
Japan
Korea
China
EU-27
EU-15
Sweden
Finland
Germany
France
United Kingdom 20081999
Source: OECD MSTI 2009-2
2008 or latest available year
Motivation
■ Problem of public R&D subsidies: crowding-out of privately financed R&D investments may occur!
■ Evaluation of crowding out effects of R&D subsidies is necessary
lecture tomorrow, part II:
Econometrics of Evaluation of Public Funding Programmes
■ The existence of social returns to R&D, however, are only a necessary but not sufficient condition. Public R&D programmes are always associated with costs which go beyond the pure amount of subsidy.
lecture tomorrow, part III:
A Simple Example of a Cost-Benefit Approach to Public Support of Private R&D Activity
Part I:
Estimating Spillovers
(Social Returns to R&D)
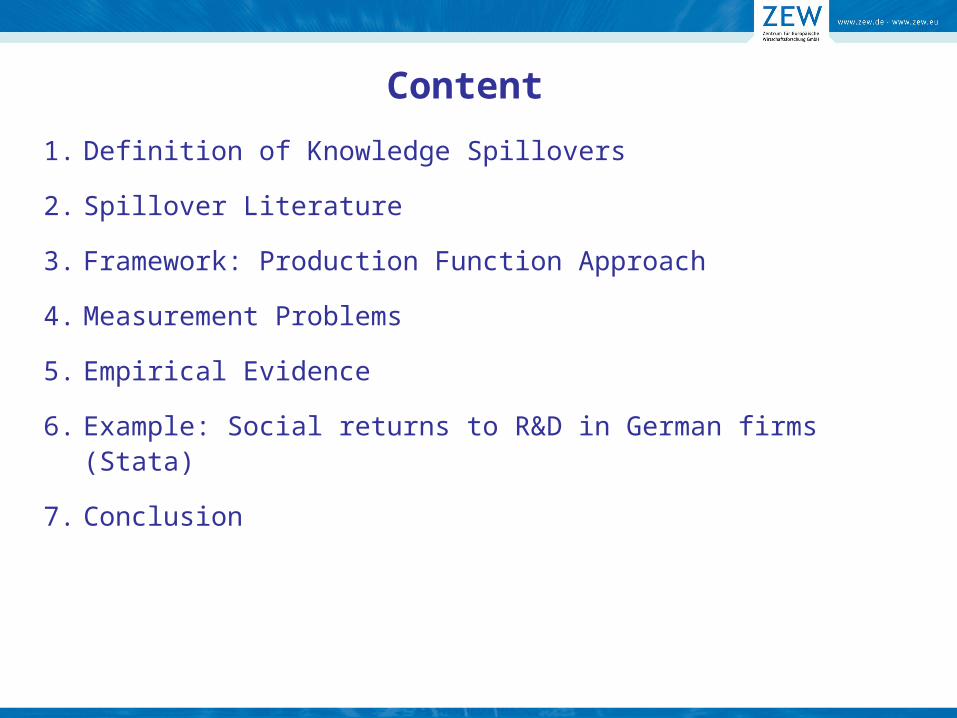
Content
1. Definition of Knowledge Spillovers
2. Spillover Literature
3. Framework: Production Function Approach
4. Measurement Problems
5. Empirical Evidence
6. Example: Social returns to R&D in German firms (Stata)
7. Conclusion
What a spillover is?
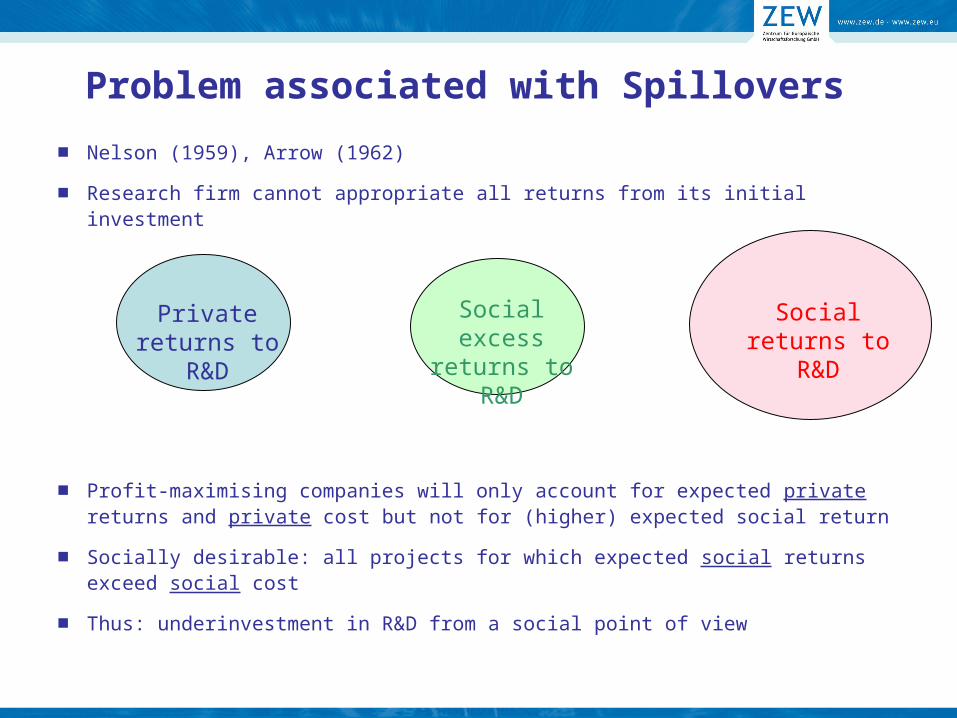
■ Knowledge as a public good (Nelson 1959, Arrow 1962):
● non-excludable
• R&D produces knowledge and something intangible as knowledge cannot be kept secret.
• Knowledge will always spill over to third parties, so that many more agents will benefit from an R&D investment – not only the initial inventor
● no rivalry in consumption
• Knowledge can be used by many firms at the same time without getting less (but economic value of knowledge might decrease)
■ Spillover is a positive externality due to the public nature of knowledge.
■ Spillovers arise if firm A can benefit from firm‘s B R&D activity without sharing the R&D costs of B (Branstetter 1998)
What a spillover is?
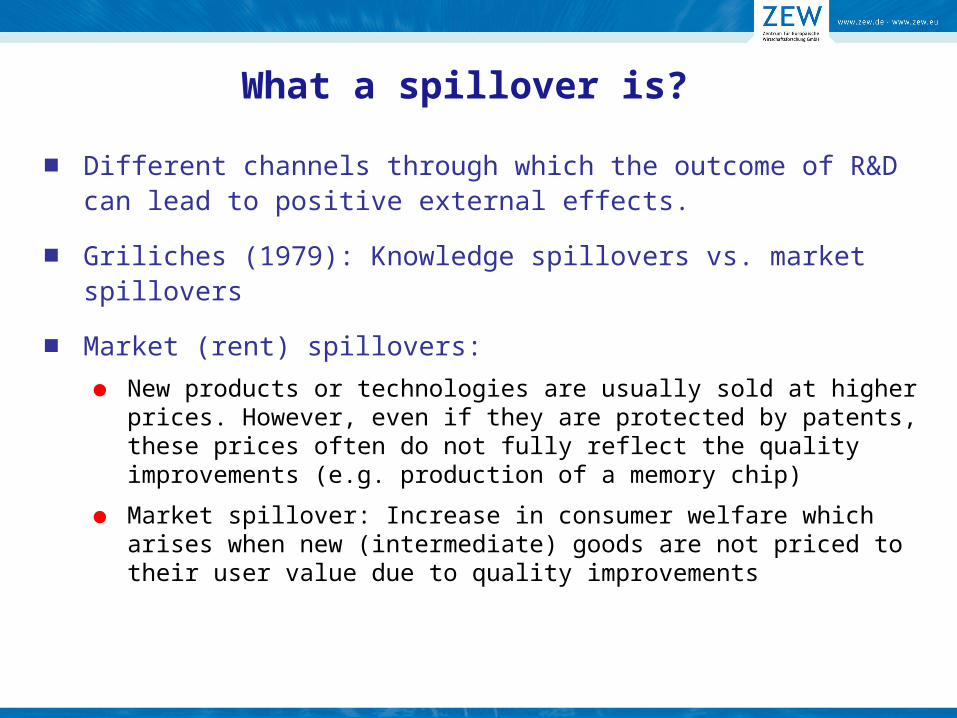
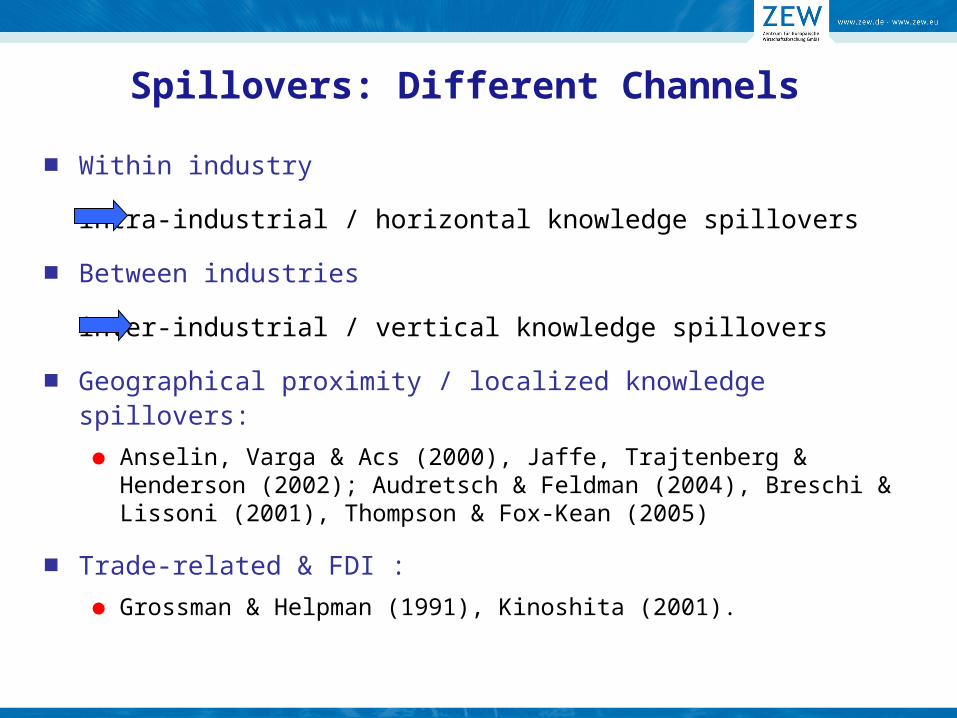
■ Different channels through which the outcome of R&D can lead to positive external effects.
■ Griliches (1979): Knowledge spillovers vs. market spillovers
■ Market (rent) spillovers:
● New products or technologies are usually sold at higher prices. However, even if they are protected by patents, these prices often do not fully reflect the quality improvements (e.g. production of a memory chip)
● Market spillover: Increase in consumer welfare which arises when new (intermediate) goods are not priced to their user value due to quality improvements
What a spillover is?
■ Knowledge (technological) spillovers:
● View of sender:
• The non-appropriable part of knowledge produced by a firm’s innovation effort can be regarded as (outgoing) knowledge spillover.
● View of receiver:
• “By technological (or R&D) spillovers we mean that a firm can acquire information created by others without paying for that in a market transaction” (Grossman & Helpman, 1991)
■ Knowledge spillovers can be used to simply imitate new products (if it is not protected), to invent around or as input for further own product or technology developments.
■ More subtile form of knowledge spillovers: e.g. if a market leader abandon its research in a specific area and therefore signals to others that this research strand is not promising (Jaffe 1998).
What a spillover is?
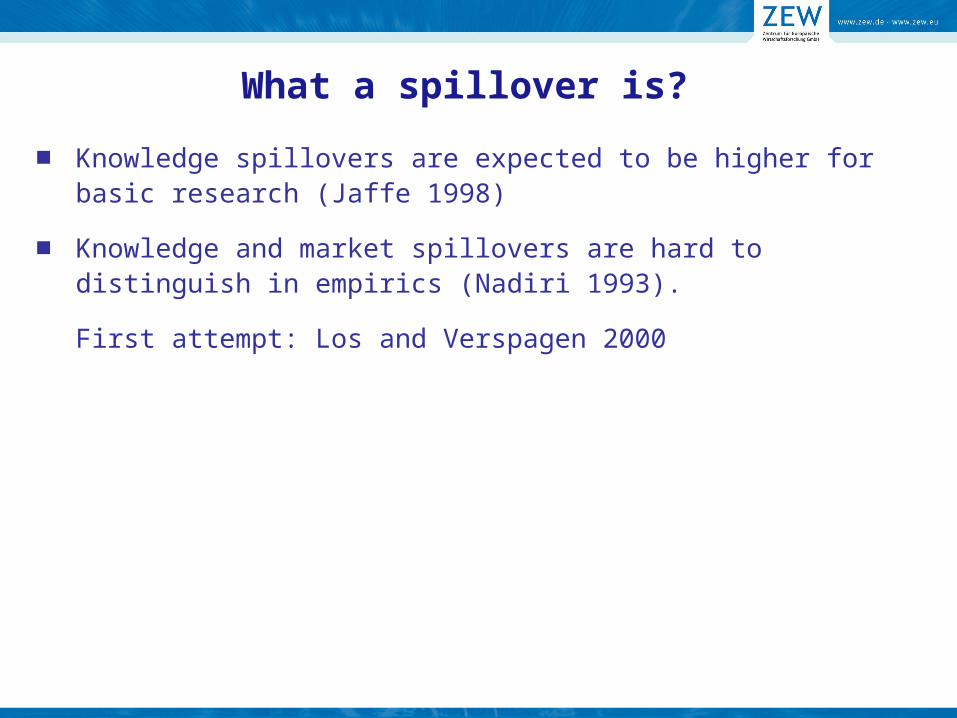
■ Knowledge spillovers are expected to be higher for basic research (Jaffe 1998)
■ Knowledge and market spillovers are hard to distinguish in empirics (Nadiri 1993).
■ Research firm cannot appropriate all returns from its initial investment
+ =
■ Profit-maximising companies will only account for expected private returns and private cost but not for (higher) expected social return
■ Socially desirable: all projects for which expected social returns exceed social cost
■ Thus: underinvestment in R&D from a social point of view
Private returns to R&D
Social excess returns to R&D
Social returns to R&D
Solutions■ Solutions, e.g.:
● Public subsidies
● Tax credits
● Fostering formation of R&D cooperations
■ Reduce private cost of R&D and therefore close the gap between social and private equilibrium
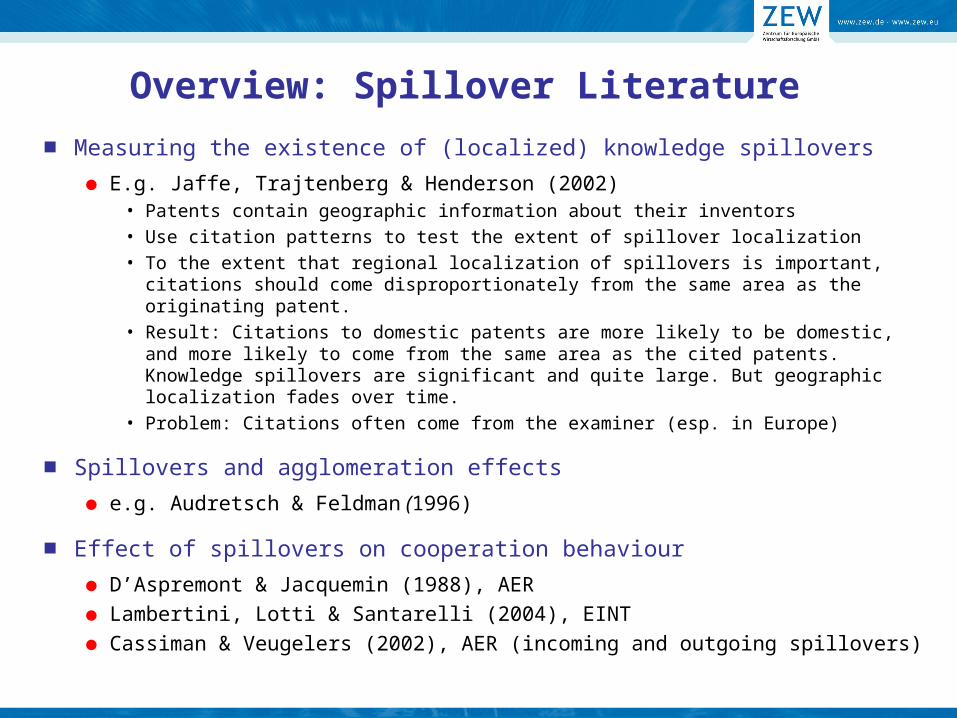
Overview: Spillover Literature
■ Measuring the existence of (localized) knowledge spillovers
● E.g. Jaffe, Trajtenberg & Henderson (2002)• Patents contain geographic information about their inventors• Use citation patterns to test the extent of spillover localization• To the extent that regional localization of spillovers is important, citations should
come disproportionately from the same area as the originating patent.• Result: Citations to domestic patents are more likely to be domestic, and more likely
to come from the same area as the cited patents. Knowledge spillovers are significant and quite large. But geographic localization fades over time.
• Problem: Citations often come from the examiner (esp. in Europe)
■ Spillovers and agglomeration effects
● e.g. Audretsch & Feldman (1996)
■ Effect of spillovers on cooperation behaviour
● D’Aspremont & Jacquemin (1988), AER
● Lambertini, Lotti & Santarelli (2004), EINT
● Cassiman & Veugelers (2002), AER (incoming and outgoing spillovers)
Overview: Spillover Literature
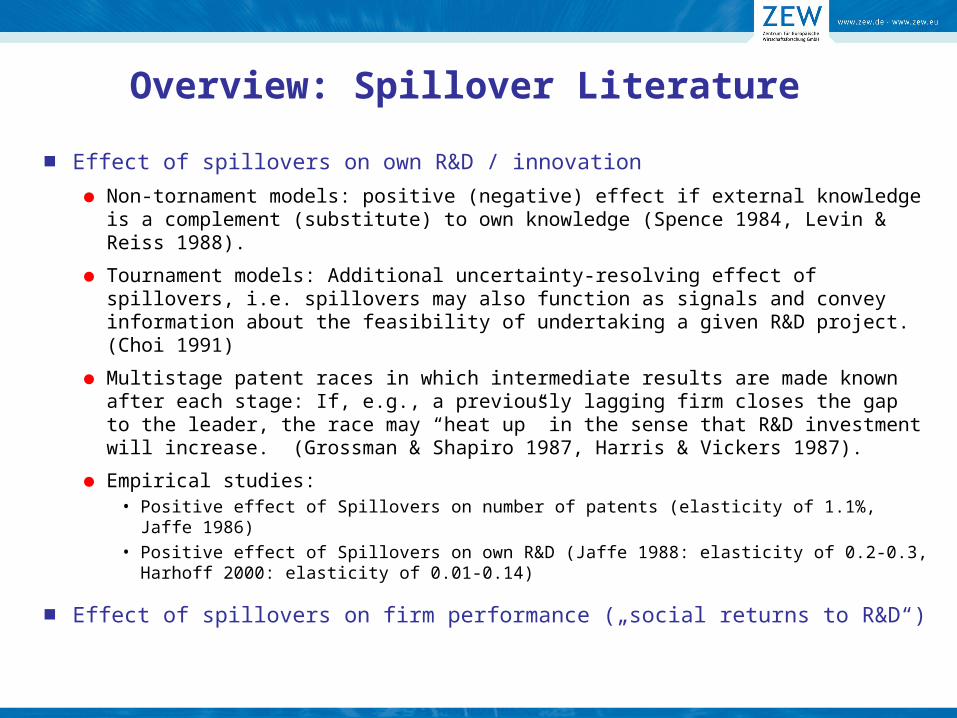
■ Effect of spillovers on own R&D / innovation
● Non-tornament models: positive (negative) effect if external knowledge is a complement (substitute) to own knowledge (Spence 1984, Levin & Reiss 1988).
● Tournament models: Additional uncertainty-resolving effect of spillovers, i.e. spillovers may also function as signals and convey information about the feasibility of undertaking a given R&D project. (Choi 1991)
● Multistage patent races in which intermediate results are made known after each stage: If, e.g., a previously lagging firm closes the gap to the leader, the race may “heat up” in the sense that R&D investment will increase. (Grossman & Shapiro 1987, Harris & Vickers 1987).
● Empirical studies:• Positive effect of Spillovers on number of patents (elasticity of 1.1%, Jaffe 1986) • Positive effect of Spillovers on own R&D (Jaffe 1988: elasticity of 0.2-0.3, Harhoff
2000: elasticity of 0.01-0.14)
■ Effect of spillovers on firm performance („social returns to R&D“)
Effect of spillovers on firm performance
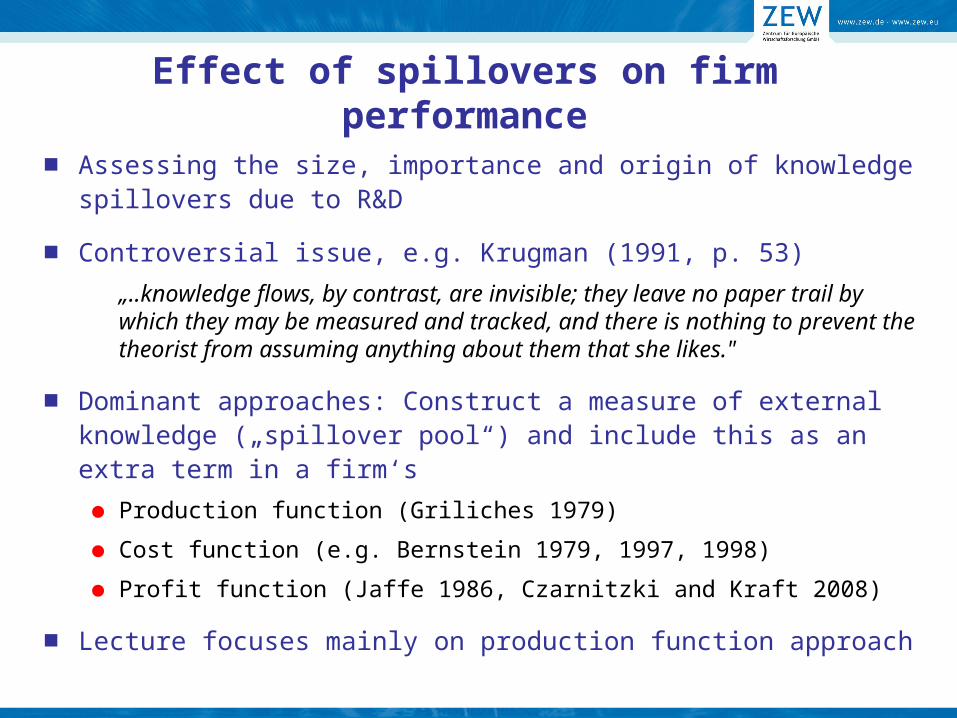
■ Assessing the size, importance and origin of knowledge spillovers due to R&D
■ Controversial issue, e.g. Krugman (1991, p. 53)
„..knowledge flows, by contrast, are invisible; they leave no paper trail by which they may be measured and tracked, and there is nothing to prevent the theorist from assuming anything about them that she likes."
■ Dominant approaches: Construct a measure of external knowledge („spillover pool“) and include this as an extra term in a firm‘s
● Production function (Griliches 1979)
● Cost function (e.g. Bernstein 1979, 1997, 1998)
● Profit function (Jaffe 1986, Czarnitzki and Kraft 2008)
■ Lecture focuses mainly on production function approach
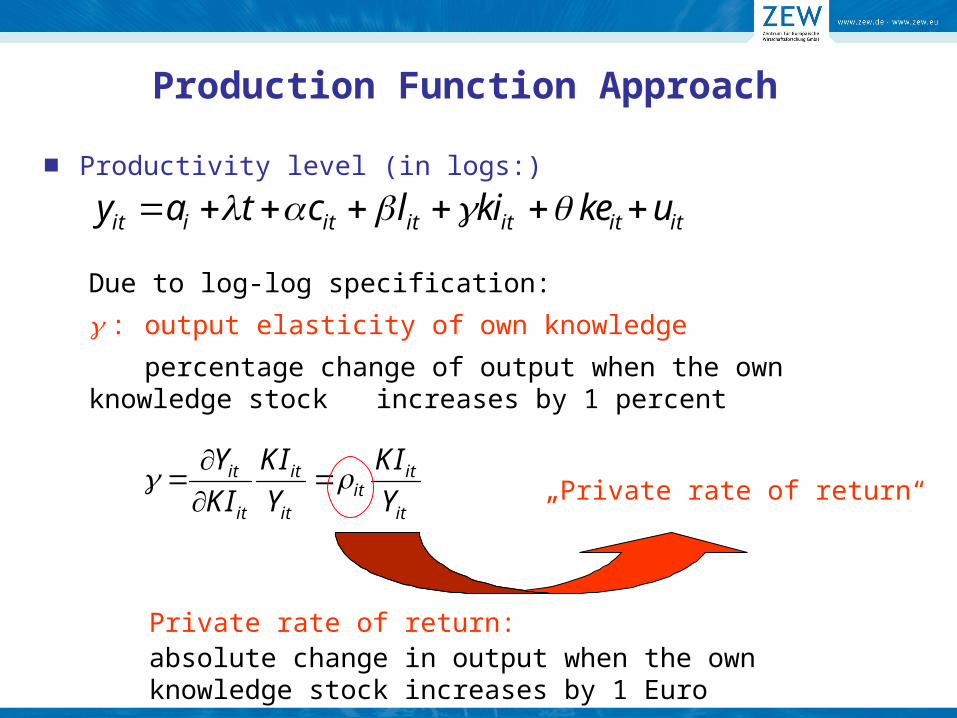
Production Function Approach
Y: Output
C: Physical capital stock
L: Labour
KI: Internal knowledge stock
KE: External knowledge stock
: Exogenous technological change
A: Scaling parameter (total factor productivity)
u: error term (unsystematic productivity shocks which are not observed)
itutit i it it it itY A e C L KI KE e
■ Productivity level (in logs:)
Production Function Approach
it i it it it it ity a t c l ki ke u
Due to log-log specification:
: output elasticity of own knowledge
percentage change of output when the own knowledge stock increases by 1 percent
it it itit
it it it
Y KI KI
KI Y Y
„Private rate of return“
Private rate of return: absolute change in output when the own knowledge stock increases by 1 Euro
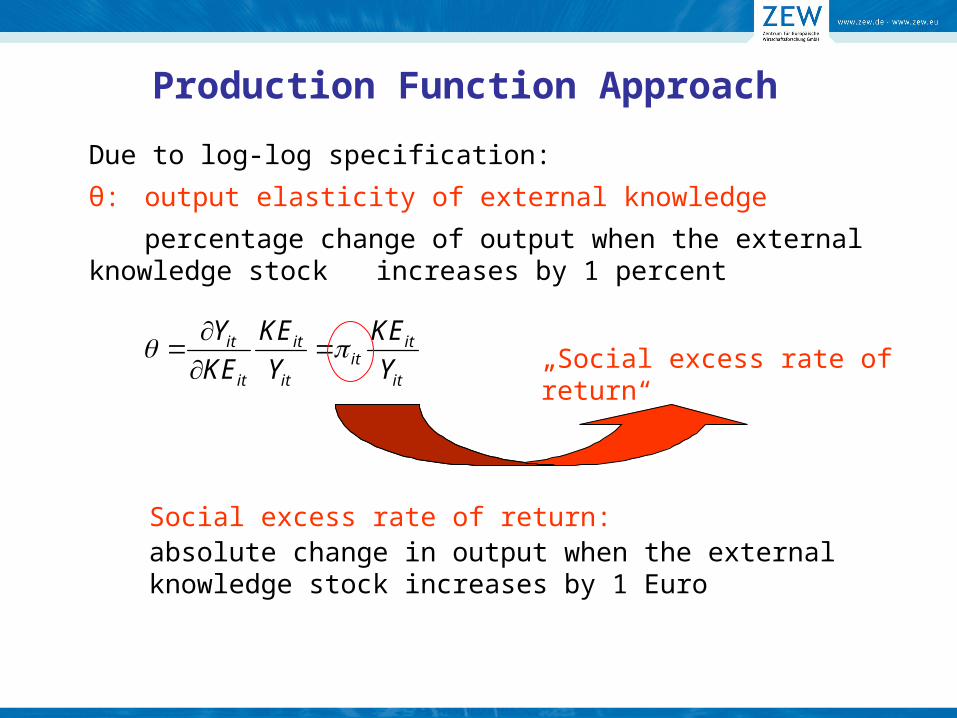
Production Function Approach
Due to log-log specification:
θ: output elasticity of external knowledge
percentage change of output when the external knowledge stock increases by 1 percent
it it itit
it it it
Y KE KE
KE Y Y
„Social excess rate of return“
Social excess rate of return: absolute change in output when the external knowledge stock increases by 1 Euro
Production Function Approach
■ Productivity level (per capita)
● Assuming constant returns to scale in conventional inputs (e.g. Mairesse und Sassenou 1991 ):
Test on constant returns to scale:
● Assuming constant returns to scale in all internal inputs (e.g. Los and Verspagen 2000):
● Assuming constant returns to scale in all inputs:
1it it i it it it it it it ity l a t c l ki l ke l u
it it i it it it it ity l a t c l ki ke u
1it it i it it it it it it it ity l a t c l ki l ke l l u
1it it i it it it it it ity l a t c l ki ke l u
■ Productivity growth rates:
● Instead of estimating productivity levels, many authors also use equation in (first) differences, i.e. productivity growth rates (e.g. Harhoff 2000)
■ Note: So far, output elasticities w.r.t. internal and external knowledge capital are the same for all firms, respectively.
■ Private and social rates of returns can be indirectly calculated (indirect approach)
25
1it it i it it it it it ity l a t c l ki ke l u
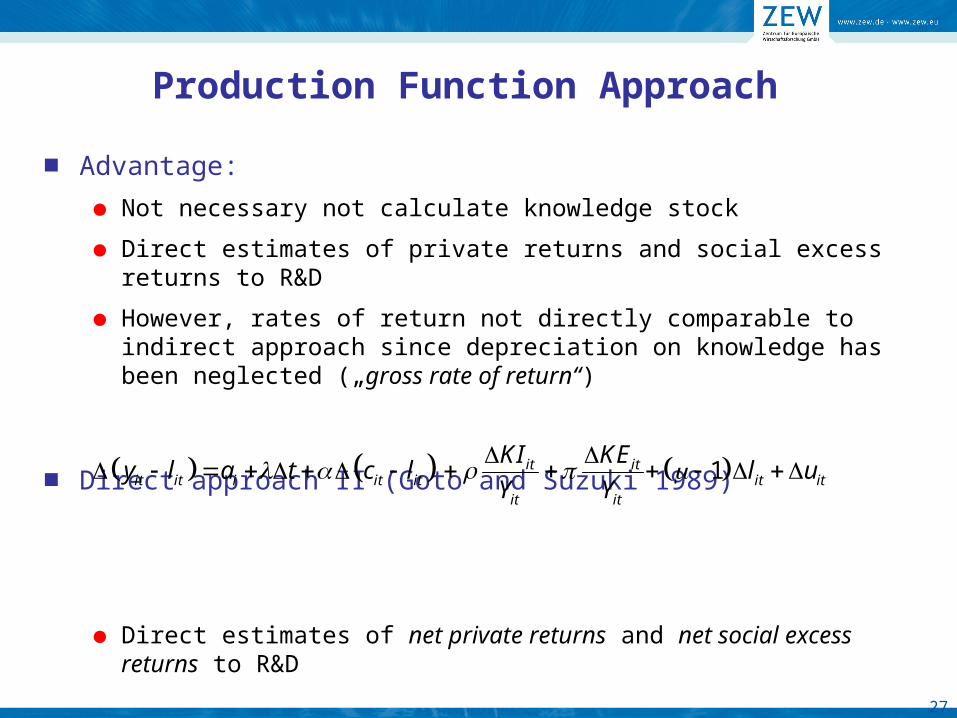
Production Function Approach
■ Direct approach I:
● Assuming that depreciation rates on knowledge capital are zero:
● We approximately get:
26
, 1 , 1, 1
, 1 , 1
log( ) log( ) it i t it i tit it i t
i t i t
KI KI RDI KIki KI KI
KI KI
1it it i it it it it it ity l a t c l ki ke l u
Production Function Approach
1it itit it i it it it it it it
it it
KI KEy l a t c l ki ke l u
Y Y
1it itit it i it it it it
it it
RDI RDEy l a t c l l u
Y Y
■ Advantage:
● Not necessary not calculate knowledge stock
● Direct estimates of private returns and social excess returns to R&D
● However, rates of return not directly comparable to indirect approach since depreciation on knowledge has been neglected („gross rate of return“)
■ Direct approach II (Goto and Suzuki 1989)
● Direct estimates of net private returns and net social excess returns to R&D
27
Production Function Approach
1it itit it i it it it it
it it
KI KEy l a t c l l u
Y Y
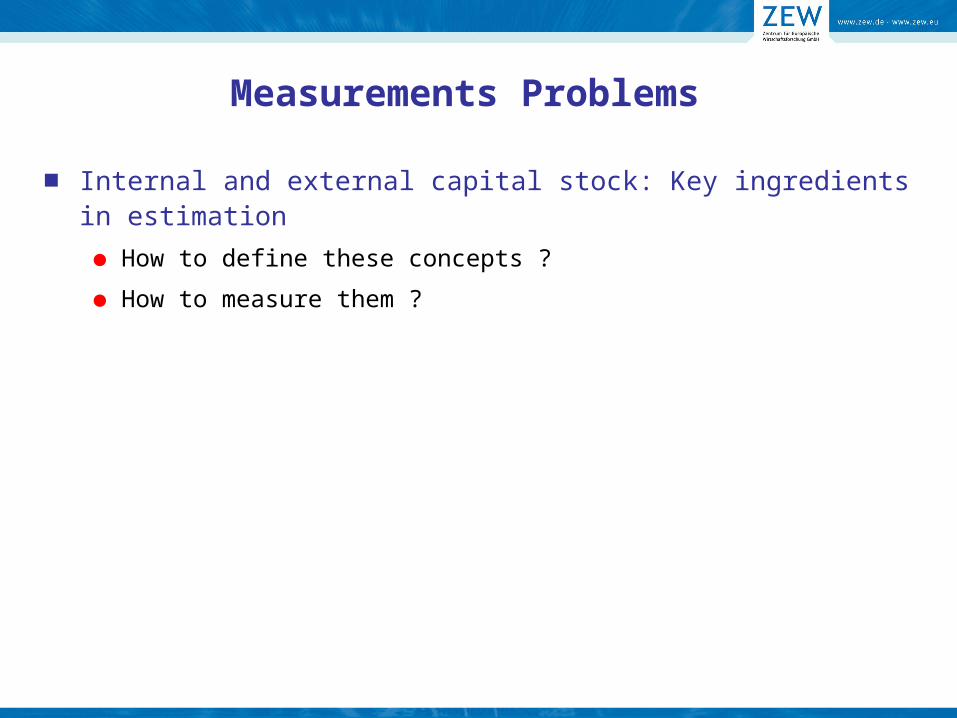
Measurements Problems
■ Internal and external capital stock: Key ingredients in estimation
● How to define these concepts ?
● How to measure them ?
Internal Knowledge Stock: Data Issues and Solutions
■ Nessary to have a long time period
■ How to get initial kapital stock in t=1?
● Permanent growth approximation
● Assumptions:
• capital accumulation process has been going on for a sufficiently long time
• R&D expenditure has been growing at constant rate g in a pre-sample period (many studies simply assume 5 %)
• Knowledge has depreciated at a constant rate d
● Note: Many studies delete the first observation in regression (e.g. Harhoff 1998, Los and Verspagen 2000)
1 1 /i iKI RDI g d
Internal Knowledge Stock: Data Issues and Solutions
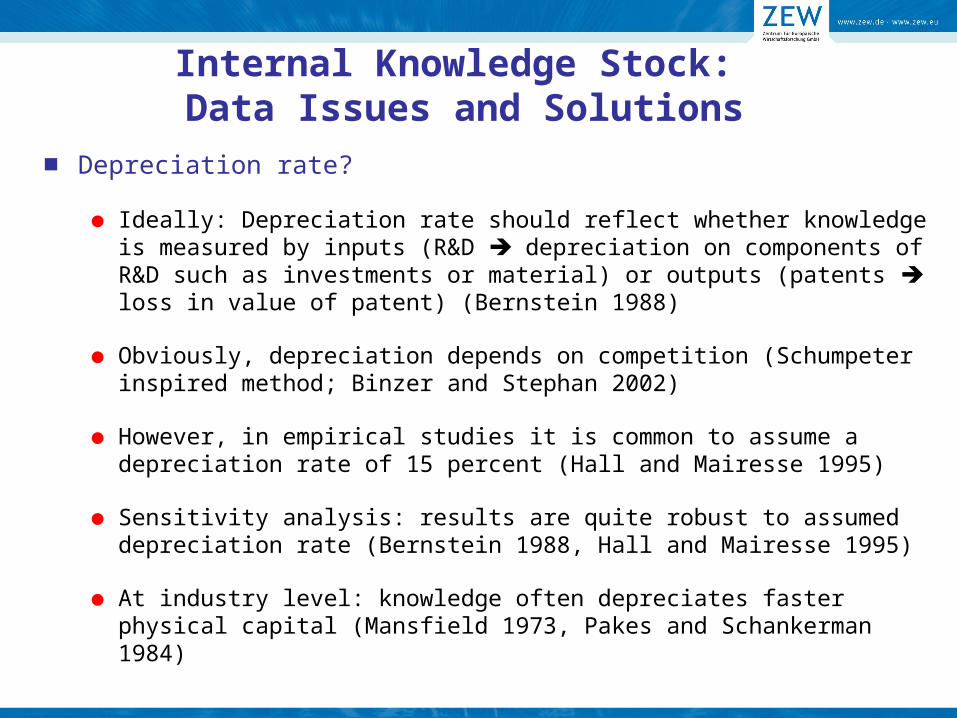
■ Depreciation rate?
● Ideally: Depreciation rate should reflect whether knowledge is measured by inputs (R&D depreciation on components of R&D such as investments or material) or outputs (patents loss in value of patent) (Bernstein 1988)
● Obviously, depreciation depends on competition (Schumpeter inspired method; Binzer and Stephan 2002)
● However, in empirical studies it is common to assume a depreciation rate of 15 percent (Hall and Mairesse 1995)
● Sensitivity analysis: results are quite robust to assumed depreciation rate (Bernstein 1988, Hall and Mairesse 1995)
● At industry level: knowledge often depreciates faster physical capital (Mansfield 1973, Pakes and Schankerman 1984)
Internal Knowledge Stock: Data Issues and Solutions
■ Deflator for R&D?
● Not available in official statistics
● Solutions:
• Many papers use GDP deflator (e.g. Los and Verspagen 2000)
• Others use deflator for investments (e.g. Harhoff 2000)
• Most appropriate:
composite index using a deflator for labour costs, material and investments and the (average) share of labour, materials and investments of R&D expenditure (Bernstein 1988, Peters et al. 2009)
Internal Knowledge Stock: Data Issues and Solutions
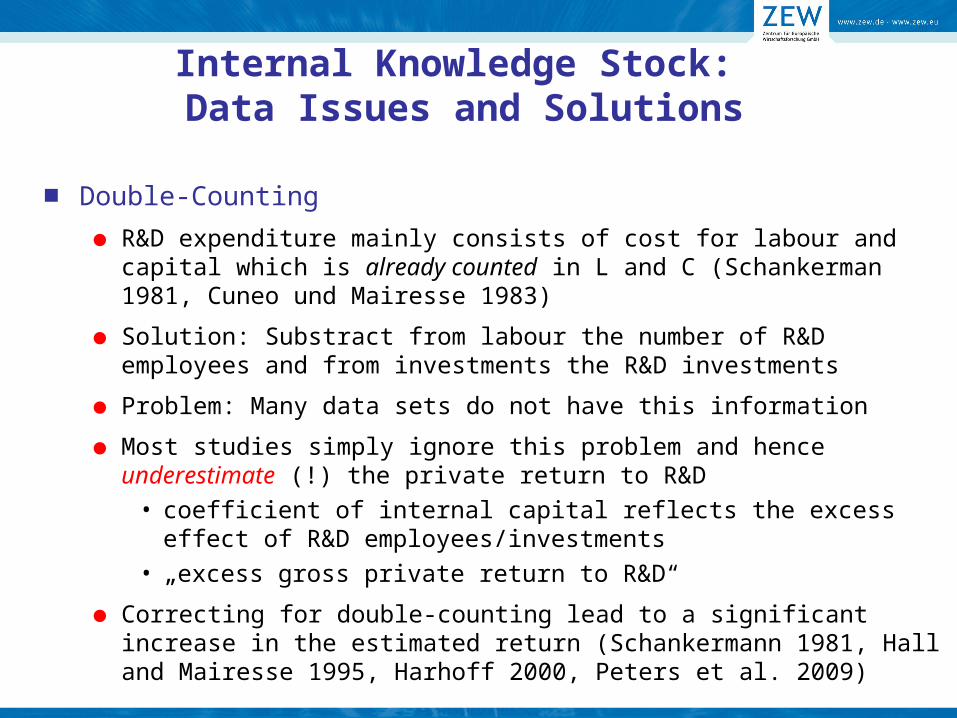
■ Double-Counting
● R&D expenditure mainly consists of cost for labour and capital which is already counted in L and C (Schankerman 1981, Cuneo und Mairesse 1983)
● Solution: Substract from labour the number of R&D employees and from investments the R&D investments
● Problem: Many data sets do not have this information
● Most studies simply ignore this problem and hence underestimate (!) the private return to R&D
• coefficient of internal capital reflects the excess effect of R&D employees/investments
• „excess gross private return to R&D“
● Correcting for double-counting lead to a significant increase in the estimated return (Schankermann 1981, Hall and Mairesse 1995, Harhoff 2000, Peters et al. 2009)
External Knowledge Stock: Data Issues and Solutions
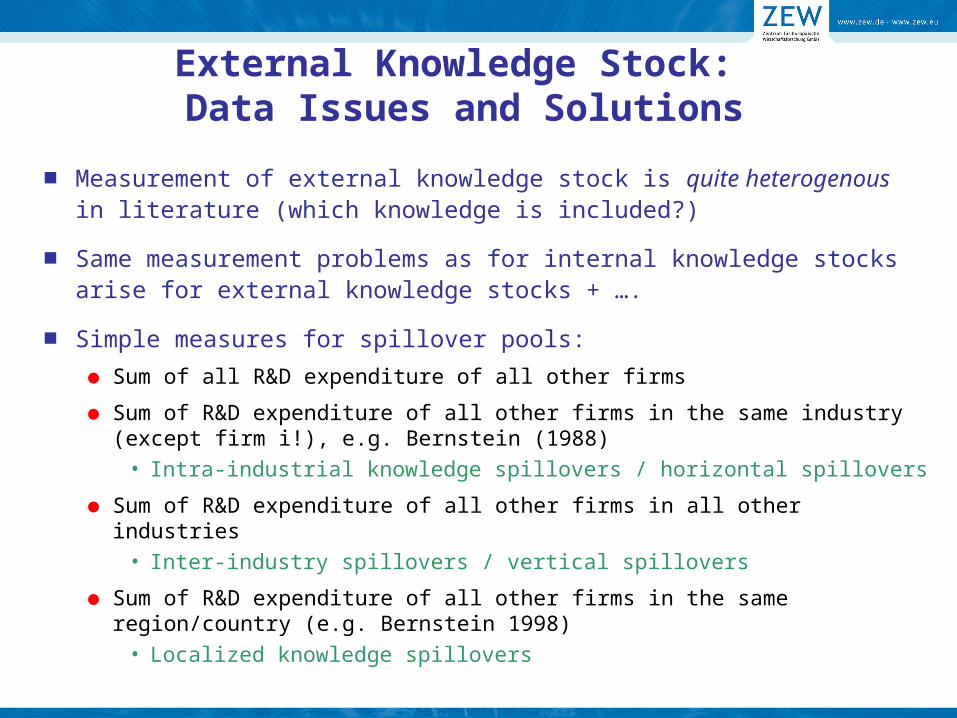
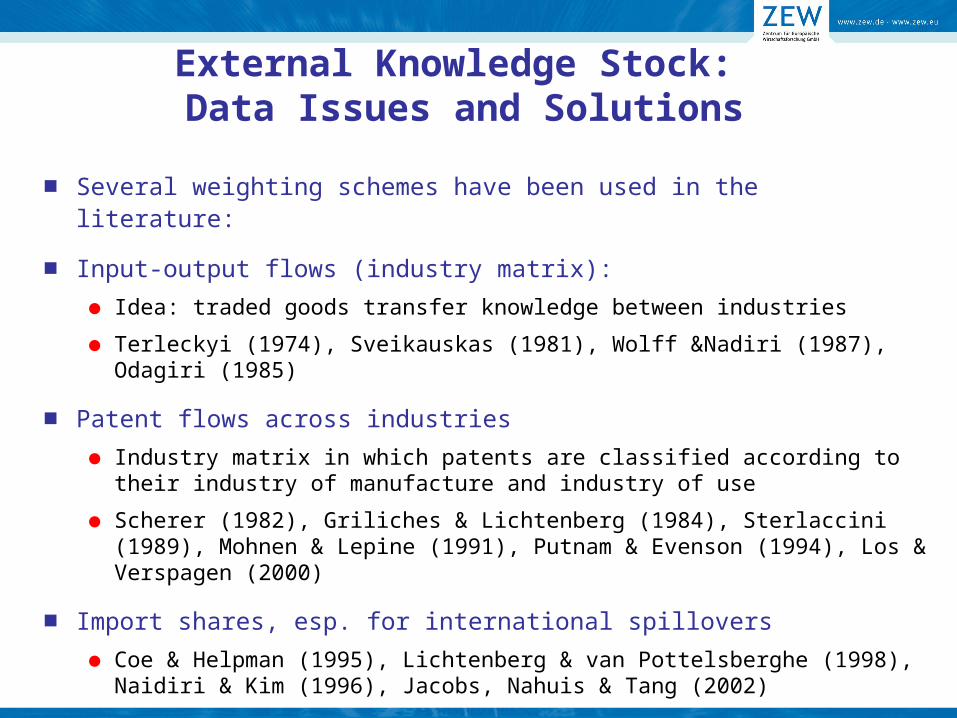
■ Measurement of external knowledge stock is quite heterogenous in literature (which knowledge is included?)
■ Same measurement problems as for internal knowledge stocks arise for external knowledge stocks + ….
■ Simple measures for spillover pools:
● Sum of all R&D expenditure of all other firms
● Sum of R&D expenditure of all other firms in the same industry (except firm i!), e.g. Bernstein (1988)
■ Import shares, esp. for international spillovers
● Coe & Helpman (1995), Lichtenberg & van Pottelsberghe (1998), Naidiri & Kim (1996), Jacobs, Nahuis & Tang (2002)
External Knowledge Stock: Data Issues and Solutions
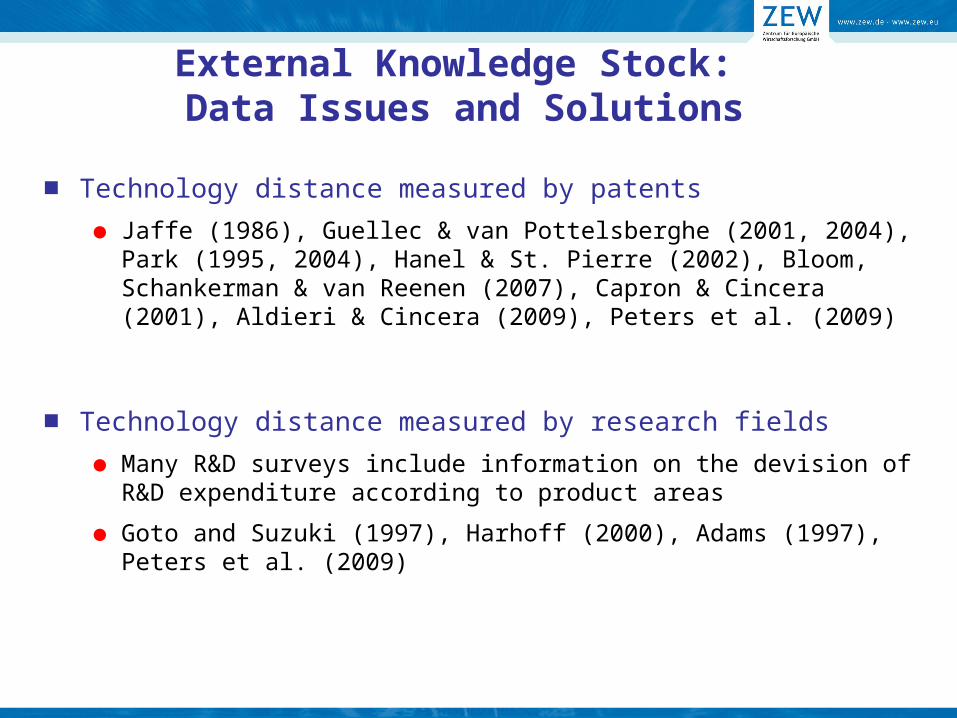
■ Technology distance measured by patents
● Jaffe (1986), Guellec & van Pottelsberghe (2001, 2004), Park (1995, 2004), Hanel & St. Pierre (2002), Bloom, Schankerman & van Reenen (2007), Capron & Cincera (2001), Aldieri & Cincera (2009), Peters et al. (2009)
■ Technology distance measured by research fields
● Many R&D surveys include information on the devision of R&D expenditure according to product areas
● Goto and Suzuki (1997), Harhoff (2000), Adams (1997), Peters et al. (2009)
■ Characterizes the technological position of firms.
■ Suppose there are K “technological areas” in which firms can invest in R&D / patent.
■ Then firm’s i position in the technological space can be summarized as
where PAik is either
● Share of patents in a specific IPC class k
● Share of R&D budget allocated to a specific product area / technology field k
37
,1 ,1 ,, , ,i i i i KF PA PA PA
Technological Distance (Jaffe, 1986)
■ Example (k=2)
■ Jaffe technology distance index (uncentered correlation of Fi and Fj):
38
, 0 1i j
ij ij ij
i i j j
FFw T T
F F F F
Technological Distance (Jaffe, 1986)
Nice properties:1 for identical firms0 for orthogonal firmsNot directly affected by length of F
1
1
Orthogonal firms
Close firms
Empirical Evidence of Spillovers
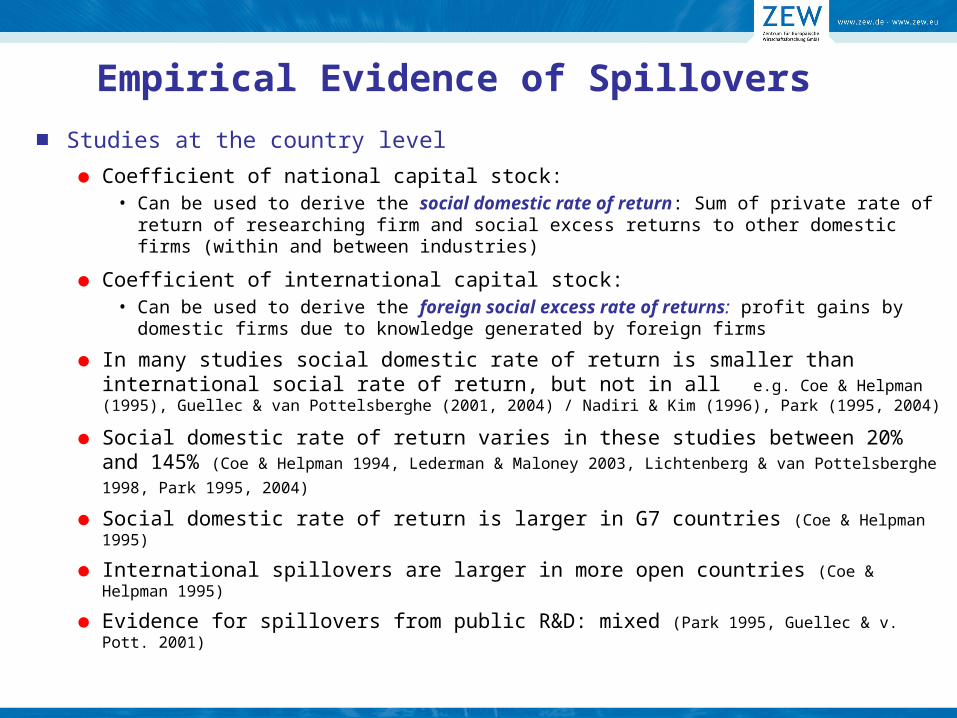
■ Studies at the country level
● Coefficient of national capital stock: • Can be used to derive the social domestic rate of return: Sum of private rate of
return of researching firm and social excess returns to other domestic firms (within and between industries)
● Coefficient of international capital stock: • Can be used to derive the foreign social excess rate of returns: profit gains by
domestic firms due to knowledge generated by foreign firms
● In many studies social domestic rate of return is smaller than international social rate of return, but not in all e.g. Coe & Helpman (1995), Guellec & van Pottelsberghe (2001, 2004) / Nadiri & Kim (1996), Park (1995, 2004)
● Social domestic rate of return varies in these studies between 20% and 145% (Coe & Helpman 1994, Lederman & Maloney 2003, Lichtenberg & van Pottelsberghe 1998, Park 1995,
2004)
● Social domestic rate of return is larger in G7 countries (Coe & Helpman 1995)
● International spillovers are larger in more open countries (Coe & Helpman 1995)
● Evidence for spillovers from public R&D: mixed (Park 1995, Guellec & v. Pott. 2001)
Empirical Evidence of Spillovers
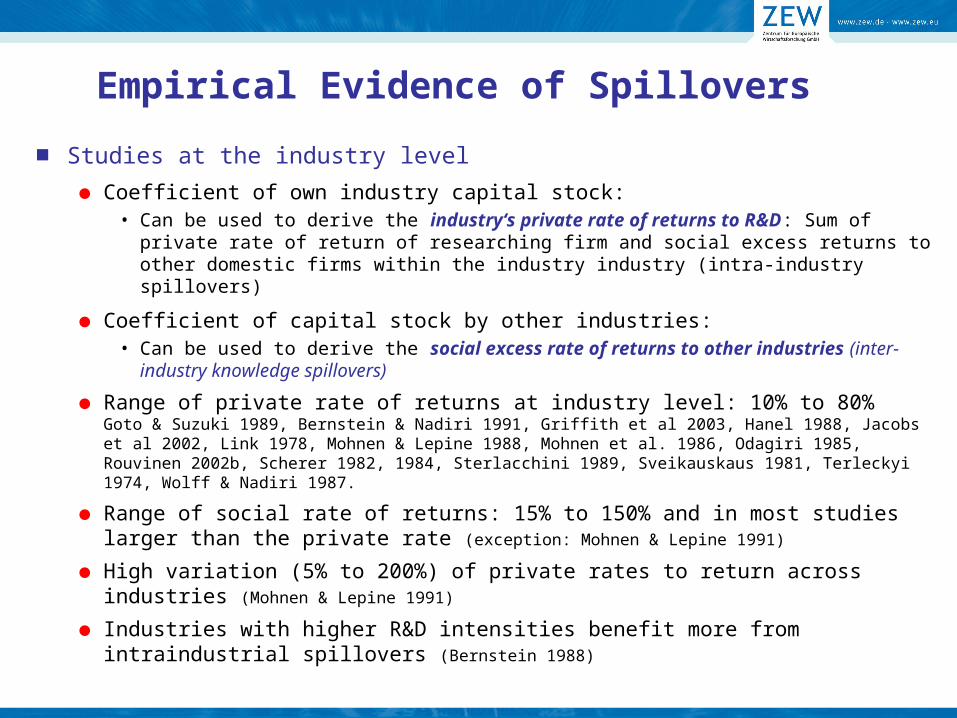
■ Studies at the industry level
● Coefficient of own industry capital stock: • Can be used to derive the industry‘s private rate of returns to R&D: Sum of private
rate of return of researching firm and social excess returns to other domestic firms within the industry industry (intra-industry spillovers)
● Coefficient of capital stock by other industries: • Can be used to derive the social excess rate of returns to other industries (inter-
industry knowledge spillovers)
● Range of private rate of returns at industry level: 10% to 80% Goto & Suzuki 1989, Bernstein & Nadiri 1991, Griffith et al 2003, Hanel 1988, Jacobs et al
● Range of social rate of returns: 15% to 150% and in most studies larger than the private rate (exception: Mohnen & Lepine 1991)
● High variation (5% to 200%) of private rates to return across industries (Mohnen & Lepine 1991)
● Industries with higher R&D intensities benefit more from intraindustrial spillovers (Bernstein 1988)
Empirical Evidence of Spillovers
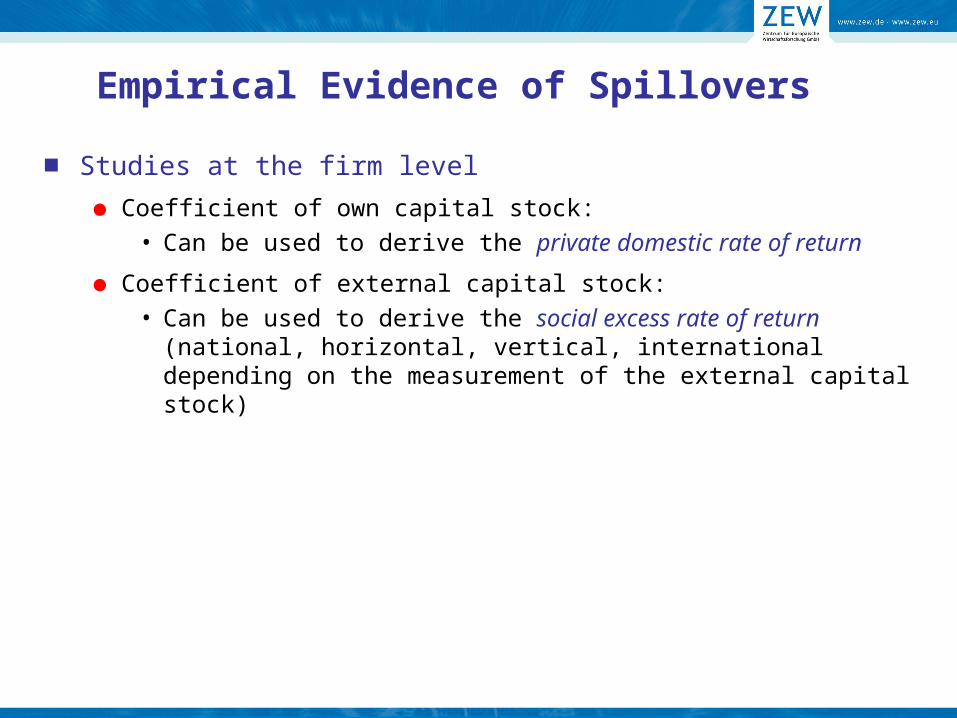
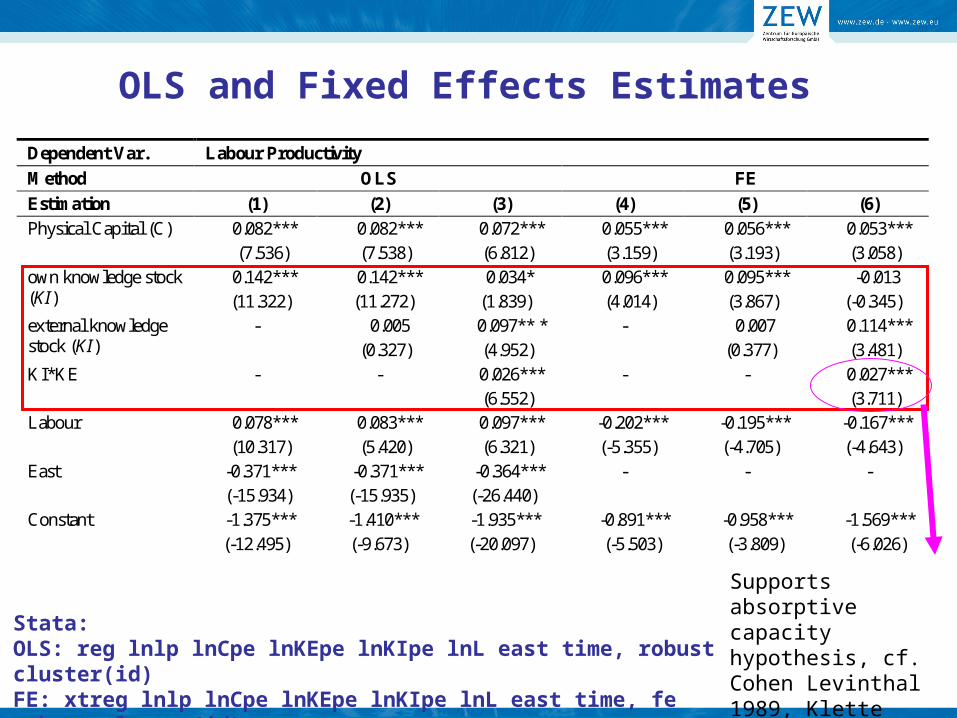
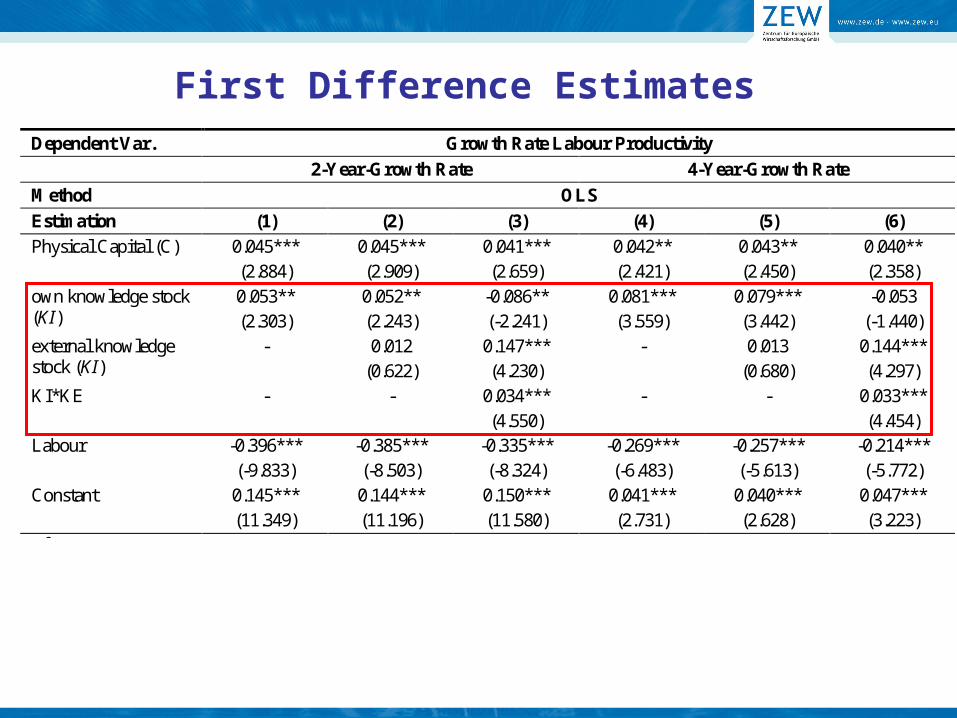
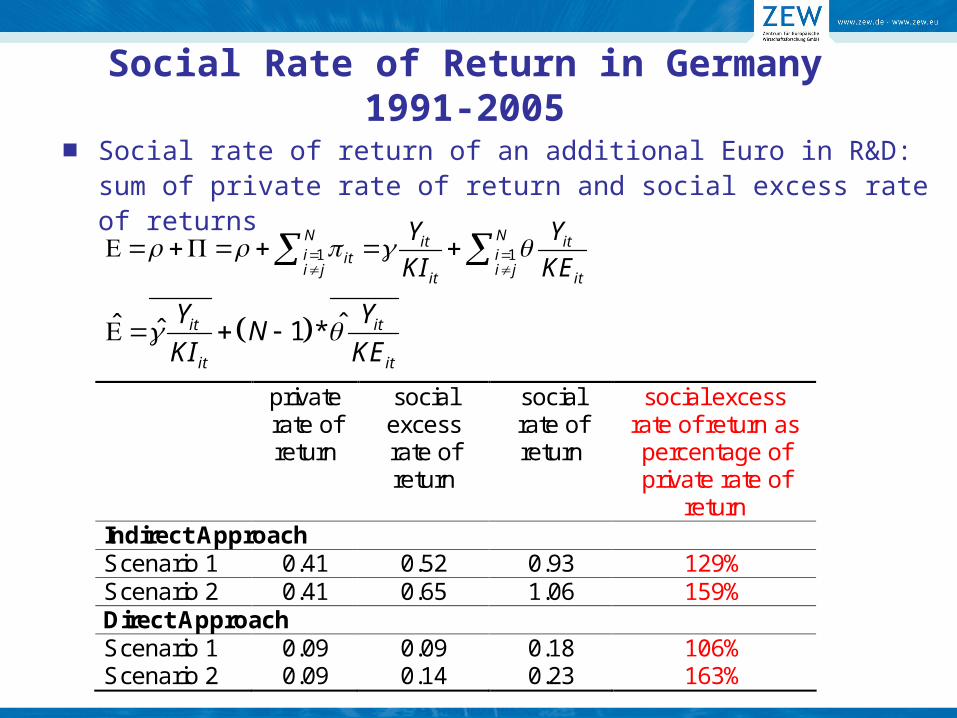
■ Studies at the firm level
● Coefficient of own capital stock:
• Can be used to derive the private domestic rate of return
● Coefficient of external capital stock:
• Can be used to derive the social excess rate of return (national, horizontal, vertical, international depending on the measurement of the external capital stock)
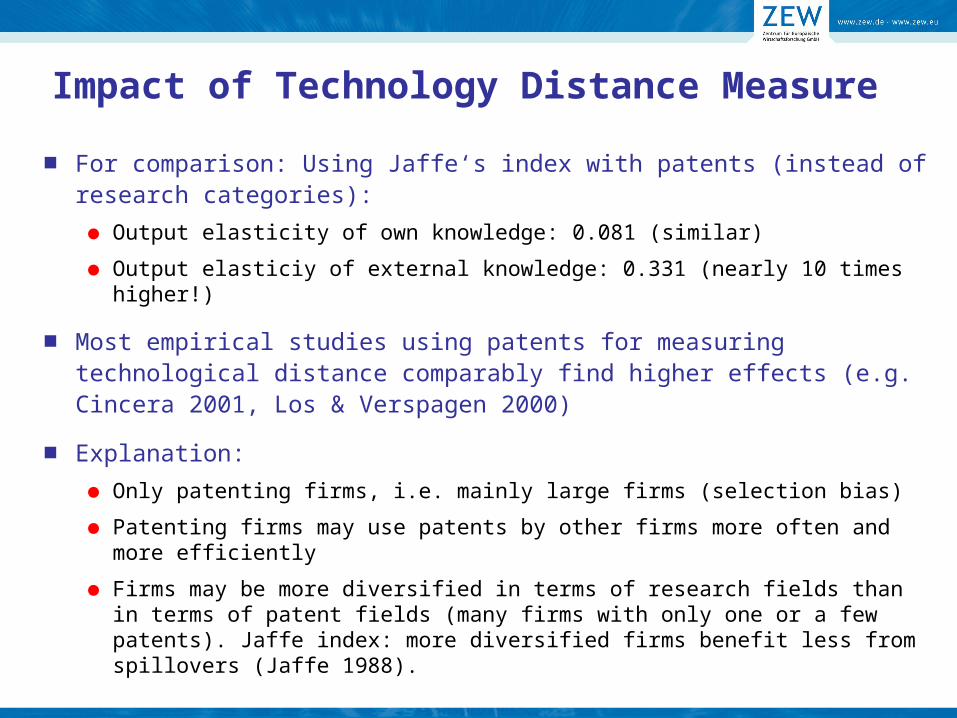
■ For comparison: Using Jaffe‘s index with patents (instead of research categories):
● Output elasticity of own knowledge: 0.081 (similar)
● Output elasticiy of external knowledge: 0.331 (nearly 10 times higher!)
■ Most empirical studies using patents for measuring technological distance comparably find higher effects (e.g. Cincera 2001, Los & Verspagen 2000)
■ Explanation:
● Only patenting firms, i.e. mainly large firms (selection bias)
● Patenting firms may use patents by other firms more often and more efficiently
● Firms may be more diversified in terms of research fields than in terms of patent fields (many firms with only one or a few patents). Jaffe index: more diversified firms benefit less from spillovers (Jaffe 1988).
Some More Econometric Issues
■ Potential Endogeneity of R&D and capital: shocks (e.g. unobserved “management skills”) may both lead to higher productivity and to higher investments and/or R&D expenditure.
■ Panel data econometrics: Traditional way to overcome this problem
● IV or GMM estimator using lagged endogenous variables as instruments (stata: ivreg or xtabond)
e.g. Aldieri and Cincera (2009)
■ Productivity literature: estimator of Olley and Pakes (1996) or Petrin and Levinson (2003)
● Yet no application of estimating knowledge spillovers using this estimator
Some More Problems in Identifying Knowledge Spillovers
■ Productivity effect is a priori unclear due to two countervailing types of R&D spillovers (Bloom et al. 2007):
● External R&D is presumed to have a positive technological effect:
Firm gets knowledge for free upon which it can build, may reduce its R&D expenditure and may increase its efficiency
● External R&D may induce negative business stealing effects:
Successful R&D by product market rivals worsen a firm‘s competitive position and may lead to business stealing
■ Estimated productivity effect is a combination of both effects
■ Identification problem of disentangling both types of spillovers using existing empirical strategies
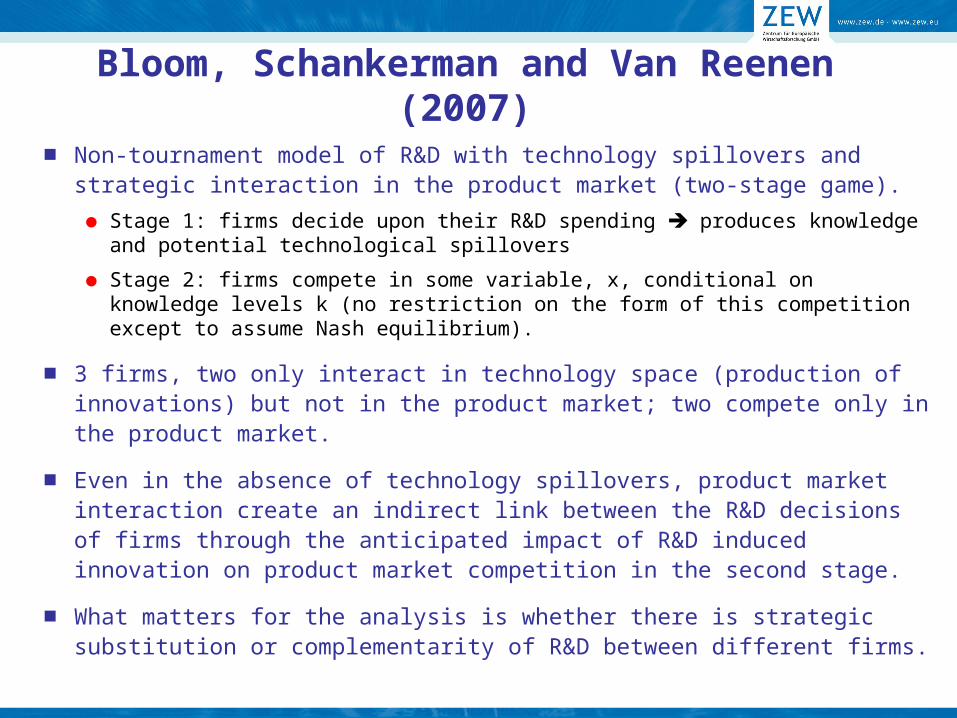
Bloom, Schankerman and Van Reenen (2007)
■ Non-tournament model of R&D with technology spillovers and strategic interaction in the product market (two-stage game).
● Stage 1: firms decide upon their R&D spending produces knowledge and potential technological spillovers
● Stage 2: firms compete in some variable, x, conditional on knowledge levels k (no restriction on the form of this competition except to assume Nash equilibrium).
■ 3 firms, two only interact in technology space (production of innovations) but not in the product market; two compete only in the product market.
■ Even in the absence of technology spillovers, product market interaction create an indirect link between the R&D decisions of firms through the anticipated impact of R&D induced innovation on product market competition in the second stage.
■ What matters for the analysis is whether there is strategic substitution or complementarity of R&D between different firms.
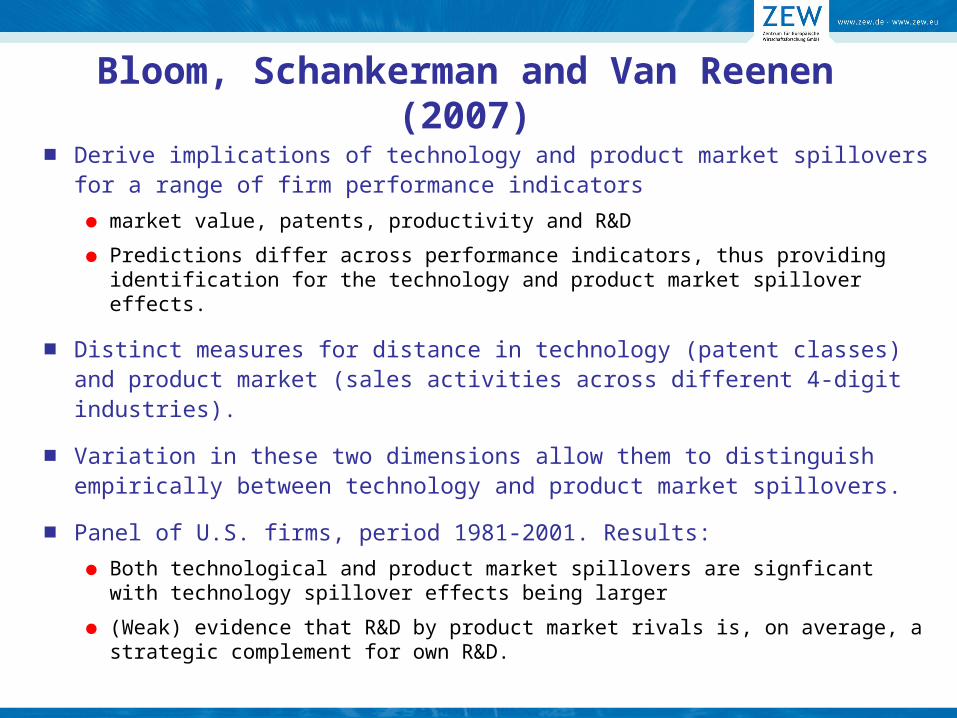
Bloom, Schankerman and Van Reenen (2007)
■ Derive implications of technology and product market spillovers for a range of firm performance indicators
● market value, patents, productivity and R&D
● Predictions differ across performance indicators, thus providing identification for the technology and product market spillover effects.
■ Distinct measures for distance in technology (patent classes) and product market (sales activities across different 4-digit industries).
■ Variation in these two dimensions allow them to distinguish empirically between technology and product market spillovers.
■ Panel of U.S. firms, period 1981-2001. Results:
● Both technological and product market spillovers are signficant with technology spillover effects being larger
● (Weak) evidence that R&D by product market rivals is, on average, a strategic complement for own R&D.
■ This lecture was about the “Search for R&D Spillovers”
■ In most studies, a positive productivity effect is found which can be interpreted as a reduced-form evidence of spillovers from external R&D
Conclusions
■ However, the mechanisms for such spillovers are not well identified (Jaffe and Trajtenberg 1998)
■ Not easy to distinguish knowledge spillovers from competitive effects (Bloom et al. 2007)
■ Not easy to distinguish a spillovers interpretation from the possibility that positive interactions are just a reflection of spatially correlated technological opportunities.
● If new research opportunities arise exogenously in a given technological area, then all firms in that area will do more R&D and may improve their productivity, an effect which may be erroneously picked up by a spillover measure (Griliches, 1998).
Challenges
■ No structural model for empirical work to capture all possible effects that can be associated with knowledge spillovers (Harhoff 2000)
■ Spillovers from the technological frontier (Griffith et al. 2004).
■ Data constraints.
● This explains why we don’t have a standardized measure of spillovers.
• Patent data
• CIS: spillovers usually measured by the use of information sources
● Too much creativity?
■ Zvi Griliches, Scan. J. of Ec. 1992 (“The Search for R&D Spillovers”)
“In spite of (many) difficulties, there have been a significant number of reasonable well-done studies all pointing in the same direction: R&D spillovers are present, their magnitude may be quite large and social rates of return remain significantly above private rates.”
Challenges
ReferencesAdams, J. D. (1997), The Structure of Firm R&D and the Factor Intensity of Production, Working Paper, Universität Florida und NBER.
Aldieri und Cincera (2009), Domestic Versus International R&D Spillovers and Productivity Performance of Large International Firms, Journal of Technology Transfer, 2, 196-211.
Anselin, Varga & Acs (2000), “Geographical Spillovers and University Research: A Spatial Econometric Perspective”, Journal of Urban and Regional Policy, 31(4), pp 501-15
Arrow, K. J. (1962), Economic Welfare and the Allocations of Resources of Invention, in: Nelson, R. R. (Hrsg.), The Rate and Direction of Inventive Activity: Economic and Social Factors, Princeton.
Audretsch & Feldman (2004), “Knowledge Spillovers and the Geography of Innovation”, in Handbook of Urban and Regional Economics, Vol. 4
Bernstein, J. (1988), Costs of Production, Intra- and Interindustry R&D Spillovers: Canadian Evidence, Canadian Journal of Economics 21 (2), 324-347.
Bernstein, J. (1989), The Structure of Canadian Interindustry R&D Spillovers, and the Rates of Return to R&D, Journal of Industrial Economics 37, 315-328.
Bernstein, J. (1997) Interindustry R&D Spillovers for Electrical and Electronic Products: The Canadian Case, Economic Systems Research 9, 111-125.
Bernstein, J. (1998), Factor Intensities, Rates of Return, and International R&D Spillovers: The Case of Canadian and U.S. Industries, Annales d'Economie et de Statistique 49-50, 541-564.
Bernstein, J. und M. Nadiri (1988), Interindustry R&D Spillovers, Rate of Return and Pro duction in High-Tech Industries, American Economic Review 78, 429-434.
Bitzer, J. und A. Stephan (2002), A Schumpeter-Inspired Approach to the Construction of R&D Capital Stocks, DIW Discussion Paper 300, Berlin.
Bloom, N, M. Schankerman und J. van Reenen (2007), Identifying Technology Spillovers and Product Market Rivalry, NBER Working Papers 13060.
ReferencesBranstetter, L. G. (1998), Looking for International Knowledge Spillovers: A Review of the Literature with Suggestions for New
Approaches; Annales d'Economie et de Statis tique 49-50, 517-540.
Breschi & Lissoni (2001), “Knowledge Spillovers and Local Innovation Systems: A Critical Survey”, Industrial and Corporate Change, 10(4), 975-1005.
Capron, H. und M. Cincera (2001), Technological Competition, Economic Performance and Strategic Behaviour of International Firms, Cahiers Economiques de Bruxelles 169, 33-62.
Coe, D. und E. Helpman (1995), International R&D Spillovers, European Economic Review 39, 859-887.
Cassiman & Veugelers (2002), “R&D Cooperation and Spillovers: Some Empirical Evidence from Belgium”, American Economic Review, 92(4), 1169-1184.
Choi, J. P. (1991), “Dynamic R&D Competition Under ‘Hazard Rate’ Uncertainty”, in: RAND Journal of Economics, Vol. 22 (4), 596– 610.
Czarnitzki, D. und K. Kraft (2008), On the Profitability of Innovative Assets, Applied Economics, forthcoming
D’Aspremont & Jacquemin (1988), “Cooperative and Noncooperative R&D in Duopoly with Spillovers”, American Economic Review, 78(5), 1133-1137
Goto, A. und K. Suzuki (1989), R&D Capital, Rate of Return on R&D Investment and Spill over of R&D in Japanese Manufacturing Industries, Review of Economics and Statistics 71, 731-753.
Griffith, R., S. Redding und J. van Reenen (2003), R&D and Absorptive Capacity: Theory and Empirical Evidence, Scandinavian Journal of Economics 105, 99-118.
Griliches, Z. (1979), Issues in Assessing the Contribution of R&D to Productivity Growth." Bell Journal of Economics, 10(1), 92-116.
Griliches (1992) “The Search for R&D Spillovers”, Scandinavian Journal of Economics, 94, pp 29-47.
Griliches, Z. und F. Lichtenberg (1984), Interindustry Technology Flows and Productivity Growth: A Re-Examination, Review of Economics and Statistics 61, 324-329.
ReferencesGrossman & Helpman (1991), “Trade, knowledge spillovers, and growth”, European Economic Review, 35(2-3), 517-526
Grossman, G./Shapiro, C. (1987), “Dynamic R&D Competition”, in: Economic Journal, Vol. 97, pp. 372 – 387.
Guellec, D. und B. van Pottelsberghe de la Potterie (2001), R&D and Productivity Growth: Panel Data Analysis of 16 OECD Countries, OECD Economic Studies 33, 104-126.
Guellec, D. und B. van Pottelsberghe de la Potterie (2004), From R&D to Productivity Growth: Do the Institutional Settings and the Source of Funds of R&D Matter?, Ox ford Bulletin of Economics and Statistics 66, 353-378.
Hanel, P. und A. St. Pierre (2002), Effects of R&D Spillovers on the Profitability of Firms, Review of Industrial Organisation 20, 305-322.
Harris, C./Vickers, J. (1987), “Racing with Uncertainty”, in: Review of Ecomic Studies, Vol. 54, pp. 1– 22.
Harhoff, D. (2000), R&D Spillovers, Technological Proximity, and Productivity Growth – Evidence from German Panel Data, Schmalenbach Business Review 52, 238-260.
Jacobs, B., R. Nahuis und P. Tang (2002), Sectoral Productivity Growth and R&D Spillovers in The Netherlands, De Economist 150 (2), 181-210.
Jaffe, A. (1986), Technological Opportunity and Spillovers of R&D: Evidence from Firms’ Patents, Profits and Market Value, American Economic Review 76, 984-1001.
Jaffe, A. (1998), The Importance of "Spillovers" in the Policy Mission of the Advanced Technology Program, Journal of Technology Transfer, 23 (2), 11-19.
Jaffe, Trajtenberg & Henderson (2002), “Geographic Localization of Knowledge Spillovers as Evidenced by Patent Citations”, Quarterly Journal of Economics, 108(3), pp. 577-598.
Kinoshita (2001),”R&D and Technology Spillovers through FDI: Innovation and Absorptive Capacity”, CEPR DP n. 2775
Lambertini, Lotti & Santarelli (2004), Economics of Innovation and New Technology
Lederman, D. und W. Maloney (2003), R&D and Development, The World Bank, Policy Research Working Paper 3024, Washington.
ReferencesLichtenberg, F. und B. van Pottelsberghe de la Potterie (1998), International R&D Spillovers: A Re-Examination, European
Economic Review 42, 1483-1491.
Link, A. (1978), Rates of Induced Technology from Investments in Research and Development, Southern Economic Journal 45 (2), 370-379.
Los, B. und B. Verspagen (2000), R&D Spillovers and Productivity: Evidence from U.S. Manufacturing Microdata, Empirical Economics 25, 127-148.
Mairesse, J. und M. Sassenou (1991), R&D Productivity: A Survey of Econometric Studies at the Firm Level, NBER Working Paper no. W3666.
Mohnen, P., M. Nadiri und I. Prucha (1986), R&D, Production Structure and Rates of Return in the US, Japanese and German Manufacturing Sectors, European Economic Review 30, 749-771.
Mohnen, P. und N. Lepine (1991), Payments for Technology as a Factor of Production, Structural Change and Economic Dynamics 2(1), 213-228.
Nelson, R. (1959), The Simple Economics of Basic Scientific Research, Journal of Political Economy 67(2) 297-306.
Nadiri, I.M. (1993), Innovation and Technological Spillovers, NBER Discussion Paper 4423, Cambridge, MA.
Nadiri, M. und S. Kim (1996), International R&D Spillovers, Trade and Productivity in Major OECD Countries, NBER Working Paper 5801, Cambridge, MA.
Odagiri, H. (1985), Research Activity, Output Growth, and Productivity Increase in Japanese Manufacturing Industries, Research Policy 14, 117-130.
Park, J. (2004), International and Intersectoral R&D Spillovers in the OECD and East Asian Economies, Economic Inquiry 42, 739-757.
Park, W. (1995), International R&D Spillovers and OECD Economic Growth, Economic Inquiry 33, 571-591.
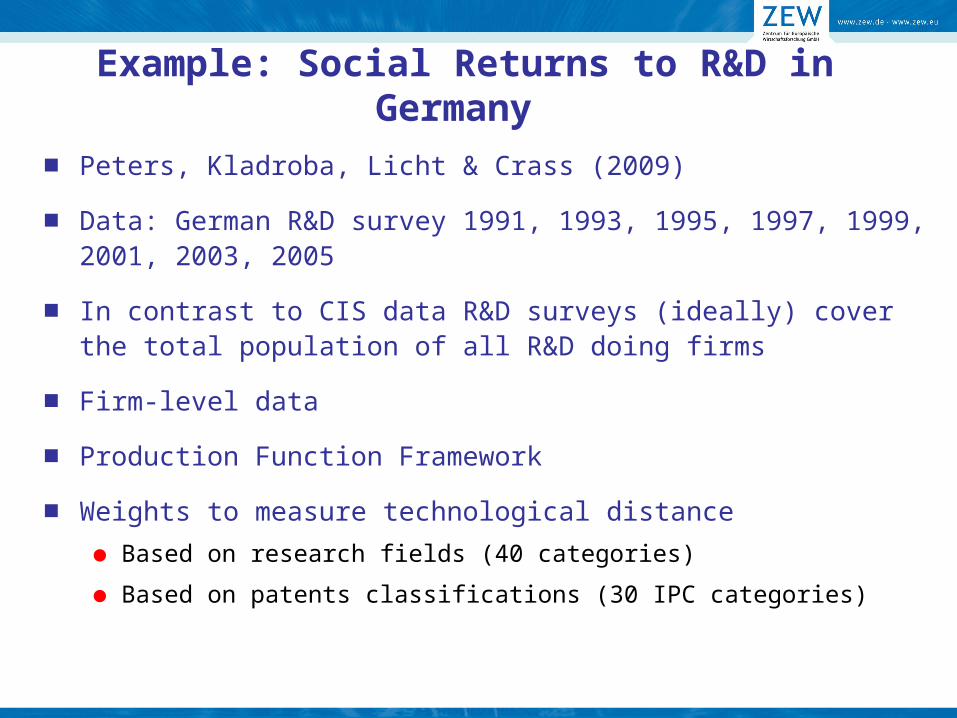
Peters, B.; Licht, G.; Kladroba, A. and Crass, D. (2009): Soziale Erträge der FuE-Tätigkeit in Deutschland. Studien zum deutschen Innovationssystem Nr. 15-2009, Berlin: EFI.
ReferencesPutnam und Evenson (1994), Inter-Sectoral Technology-Flows: Estimates from a Patent Concordance with Application to Italy,
mimeo.
Rouvinen, P. (2002b), The Existence of R&D Spillovers: A Cost Function Estimation with Random Coefficients, Economics of Innovation and New Technology 11, 525-541.
Schankerman, M. (1981), The Effects of Double-Counting and Expensing on the Measured Returns to R&D, Review of Economics and Statistics 63, 454-459.
Scherer, F. (1982), Inter-Industry Technology Flows and Productivity Growth, Review of Economics and Statistics 64, 627-634.
Levin, R. C./Reiss, P. (1988), “Cost-Reducing and Demand-Creating R&D With Spillovers”, in: Rand Journal of Economics, Vol 19 (4), pp. 538– 556.
Spence, A. M. (1984), “Cost reduction, competition and industry performance”, in: Econometrica, Vol. 52, pp. 101 – 121.
Sterlacchini, A. (1989), R&D, Innovations, and Total Factor Productivity Growth in British Manufacturing, Applied Economics 21, 1549-1562.
Suzuki, K. (1993), R&D Spillovers and Technology Transfer Among and Within Vertical Keiretsu Groups: Evidence from the Japanese Electrical Machinery Industry, International Journal of Industrial Organisation 11, 573-591.
Sveikauskas, L. (1981), Technology Inputs and Multifactor Productivity Growth, Review of Economics and Statistics 63, 275-282.
Terleckyj, N. (1974), Effects of R&D on the Productivity Growth of Industries: An Exploratory Study, National Planning Association, Washington D.C.
Thompson, P. & M. Fox-Kean (2005), "Patent Citations and the Geography of Knowledge Spillovers: A Reassessment," American Economic Review, American Economic Association, vol. 95(1), 450-460.
Wolff, E. und M. Nadiri (1987), Spillover Effects, Linkage Structure, and Research and Development, Structural Change and Economic Dynamics 4, 315-331.