56
Let Agilent ICP-MS Unlock Your Laboratory’s Full Potential Cost Effective Measurements of Elements in Food Samples Arun Kumar Raju Application Chemist – ICPMS Agilent Technologies India

Let Agilent ICP-MS Unlock Your Laboratory’s FullPotential
Cost Effective Measurements of Elements in Food
Samples
Arun Kumar Raju
Application Chemist – ICPMS
Agilent Technologies India

How Are Elements Typically Measured in Food?
In order to cover all of the elements that should be analysed at the appropriate ranges, several traditional techniques are used
• As/Se/Sn – hydride generation AAS or AFS
• Hg – cold vapour AFS
• All other elements at sub ppb level GFAAS or FAAS
• All other elements at ppb – ppm - % level ICP-OES
In many large laboratories, all of the above techniques have been replaced with a single ICP-MS

Typical Workflow in an Older Food Laboratory
Sample Prep 1 (Hg analysis)
Sample Prep 2 (As analysis)
Sample Prep 3 (Cd, Pb)
Cold Vapour AFS
Hydride Generation
AAS
GFAAS or ICP-OES
Dat
a C
olla
tion
Final Report
Bottlenecks – Productivity reduced here

So, What is ICP-MS?
ICP - Inductively Coupled Plasma
• high temperature ion source
• decomposes, atomizes and ionizes the sample
MS - Mass Spectrometer
• featuring quadrupole mass analyzer
• mass range - 5 to 260 amu (Li to U...)
– separates all elements in rapid sequential scan
• ions measured using dual mode detector
– ppt to ppm levels
– isotopic information available
An inorganic (elemental) analysis technique
ICP-MS has the detection limits of GFAA and the sample throughput of ICP-OES

Low flow sample introduction system
27MHz solid state RF plasma generator
Multi-element interference removal by on-axis octopole reaction cell
High frequency hyperbolic quadrupole
Fast simultaneous dual mode detector (9 orders dynamic range)
Agilent 7500cx ICP-MS System withOctopole Reaction System (ORS)
Off-axis Lens
Helium Inlet
OctopolePlasma

The Octopole Reaction System (ORS)

Molecular InterferencesContribute to Noise
51V35Cl16O, 37Cl14N
52Cr36Ar16O, 40Ar12C, 35Cl16OH, 37Cl14NH
53Cr 36Ar16OH, 40Ar13C, 37Cl16O, 35Cl18O, 40Ar12CH54Fe 40Ar14N, 40Ca14N55Mn 37Cl18O, 23Na32S,56Fe 40Ar16O, 40Ca16O57Fe 40Ar16OH, 40Ca16OH58Ni 40Ar18O, 40Ca18O, 23Na35Cl59Co 40Ar18OH, 41K18O, 43Ca16O60Ni 44Ca16O, 23Na37Cl61Ni 44Ca16OH, 38Ar23Na, 23Na37ClH63Cu 40Ar23Na, 12C16O35Cl, 12C14N37Cl64Zn 32S16O2,
32S2, 36Ar12C16O,
38Ar12C14N, 48Ca16O65Cu 32S16O2H, 32S2H, 14N16O35Cl, 40Ar25Mg, 48Ca16OH66Zn 34S16O2,
32S34S, 33S2, 48Ca18O
67Zn 32S34SH, 33S2H, 48Ca18OH, 14N16O37Cl, 16O235Cl
68Zn 32S18O2, 34S2
69Ga 32S18O2H, 34S2H, 16O237Cl
70Zn 34S18O2, 35Cl2
71Ga 34S18O2H72Ge 40Ar32S, 35Cl37Cl, 40Ar16O2
73Ge 40Ar33S, 35Cl37ClH, 40Ar16O2H74Ge 40Ar34S, 37Cl275As
40Ar34SH, 40Ar 35Cl, 40Ca 35Cl
77Se40Ar 37Cl, 40Ca 37Cl
78Se40Ar 38Ar
80Se40Ar2,
40Ca2, 40Ar40Ca, 40Ar 39KH, 79BrH
Main Polyatomic Ion interferences arising from a
matrix containing:Plasma Components
(Ar, O, N, H)
Plus
Matrix Components(Cl, S, C, Ca, Mg, Na, K etc)
Commonly observed matrix components in environmental, food, agricultural, clinical and many other sample matrices

Mass Spectrum He Mode – Espresso Coffee
Only isotopesNO interferences

Wide Analytical Range- these 4 calibration plots were generated simultane ously in a single run
1180 ppm Sodium
As
Se
Hg
Na
Calibration rangesHg (0.01 – 2ppb) – Std ModeAs (0.1 – 200 ppb) – He ModeSe (0.1 – 200 ppb) – H2 ModeNa (0.05 – 1180 ppm) – He Mode
Overall calibration range 10ppt (Hg) to 1180 ppm (Na) in a single method- without attenuating ion transmission to increase working range
NaTypically, ICP-MS cannot measure above 200ppm Na without changing quad resolution or ion lens settings
HgHg detection limit by 7500ce is about 3ppt – 7500ce can QUANTIFY at 10ppt!
7500cx can measure both Na and Hg in the same run!

Advantages of ICP-MS
Excellent detection limits
• ppt to low ppb for all elements
Wide elemental coverage - from Li - U
• Over 70 elements measurable in a single acquisition
Simple to use He only collision/reaction cell (Agilent ORS)
• Improve accuracy through removal of interferences
High throughput
• All elements determined simultaneously• 20 element run/3 replicates/washout in
4 minutes
Wide dynamic range
• linear over 9 orders
Powerful semiquantitative analysis
• no standards needed
Isotopic analysis
• isotope ratios
• isotope dilution
Routine technique
• many users run systems overnight
Small size
• saves lab space
• mobile installations
=PRODUCTIVITY

Analysing Food samples by ICP-MS
More difficult than most environmental samples because of the huge range of matrices
Regulated elements tend to be the “toxic heavies”
• As, (Se), Cd, Hg, Pb
• But other elements may also be measured
Very dependant on sample preparation

Sample PreparationSample preparation for ICP-MS is relatively simple
• Consists of converting solid samples into solutions (digestion)• Usually involves a oxidizing environment
– Nitric acid/hydrogen peroxide– Nitric acid/perchloric acid– Nitric acid/sulfuric acid– Sometimes (usually in high cellulose plants/seeds), a small amount of HF is
requiredThe high carbon content of most food matrices make sample preparation relatively straightforward
• High fat content can cause problemsTypically samples are digested using one of the following
• Acid digestion in an open vessel• Pressurized digestion
– Simple uncontrolled– Automated
• Microwave aided digestionGood sample preparation is the key to success

Typical Digestion Mixtures for Food Sample Prep
Cellulose and starches
• HNO3 (sometimes HOCl4)
Leaves and grains
• HNO3 / HF
Meat and other high protein samples
• HNO3 (plus H2O2 )
Foods containing high amounts of fats and oils
• HNO3 and H2O2
• Sometimes HNO3 and H2SO4

Simple Acid Digestion
Typically samples are typically heated with a mixture of concentrated nitric acid plus hydrogen peroxide in an open vessel
• Boiling point of the acid mixture controls the maximum temperature • Special care must be taken if hydrofluoric or perchloric acids are used
– For hydrofluoric acid, PTFE or other plastic materials must be used– Because of the risk of explosion, perchloric acid concentration must never
exceed 72%Advantages
• Inexpensive/simple• Okay for some (but not all) matricesDisadvantages
• Slow• Risk of contamination• Poor/no control• Volatile metals such as As, Sn, Hg will be lost

Simple Pressurised PTFE “Bomb”Digestion performed in a pressurized container (often called a “bomb”)
• Closed system avoids contamination and loss of volatile elements
Most commonly used design was introduced by Tölg in 1972
• Tölg’s “bomb” consists of– Pressure valve, screw-cap, pressure spring, metal lid, PTFE lid, PTFE insert and
a pressure vessel (lined with stainless steel and thermal insulation)
An aluminum heating block with a thermal probe is used to heat the device
Kotz, L.; Kaiser, G.; Tschöpel, P.; Tölg, G.;Fresenius Z. Anal. Chem. 1972, 260, 207.
Advantages
• Low cost
• Contamination free
• Closed system so no loss of volatile elements
Disadvantages
• Potential for explosions so care must be exercised
• Use of PTFE limits the temperature to approx 170oC
• Limited control

Typical Digestion Mixtures and Preparation Times
Matrix Typical Sample weight
Digestion Matrix
Temperature Time
Cellulose/starches 1000 mg HNO3 140-160°C 1-2 hr.
Leaves / grain 1000 mg HNO3 / HF 150-180°C 2-3 hr.
Meat/ High Protein 1000 mg HNO3 170-190°C 2-4 hr.
Fats / oils 500 mg HNO3 (H2O2) 180-200°C 3-4 hr.
High Pressure Digestion
Source: http://www.berghof-instruments.de

Automated High Pressure DigestionCommercial systems are available that automate high pressure digestion
• Use the same wet chemical pressure digestion• Better controlledMost products avoid PTFE
• High purity quartz glass or glassy carbon– Compatible with most digesting acid mixtures
• Temperatures up to 320°C• Pressures up to 130 bar • Produces complete mineralization of even the most difficult samplesAdvantages
• Relatively fast• Complete decomposition • Contamination free• Closed system so no loss of volatile elements• Some level of control over digestion temperatures and pressuresDisadvantages
• Relatively high cost

Microwave DigestionMany laboratories have turned to microwave digestion to improve productivity
• Samples and digestion mixture in sealed container within a microwave oven– Sample tubes are made of glass, quartz or PTFE
• “Transparent” to microwave radiation
• Very high pressures generated within sample containers• Typical digestion time is 15 min to 1 hour
Advantages
• Relatively fast• Complete decomposition • Contamination free• Closed system so no loss of volatile elements• Digestion temperatures and pressures can be controlled• USEPA methods
Disadvantages
• Relatively high cost

Typical Digestion Mixtures and Preparation Times
Matrix Typical Sample weight
Digestion Matrix
Temperature Time
Cellulose/starches 500 mg HNO3 160°C 25 min.
Leaves / grain 500 mg HNO3 / HF 190°C 30 min.
Meat/ High Protein 50-250 mg HNO3 170-190°C 25 min.
Fats / oils 700 mg HNO3 (H2O2) 180-210°C 30-40 min.
Microwave Digestion
Source: http://www.berghof-instruments.de

Analysis of Tea CRM using Standard ICP-MS
Element Found standard deviation
Certified concentration
+/-error
% recovery
Mg 2827 57 ppm 2760 240 ppm 102%
Al 5875 78 ppm
P 1545 35 ppm 1480 80 ppm 104%
K 8581 183 ppm 8630 620 ppm 99%
Ca 7610 129 ppm 8000 660 ppm 95%
Cr 2007 21 ppb (2000) ppb 100%
Mn 2062 31 ppm 2170 120 ppm 95%
Fe 362.5 1 ppm 347 12 ppm 104%
Co 184.1 1 ppb (180) ppb 102%
Ni 5064 20 ppb 5090 760 ppb 99%
Cu 8092 67 ppb 8960 580 ppb 90%
Zn 21923 2 ppb 22600 1500 ppb 97%
As 190.3 6 ppb 180 48 ppb 106%
Se 85.22 14 ppb 40 6 ppb 213%
Cd 25.86 2 ppb 23 4 ppb 112%
Ba 107328 75 ppb 120000 10000 ppb 89%
Hg 23.26 1 ppb (17) ppb 137%
Pb 872.2 1 ppb 1000 40 ppb 87%
Th 84.07 0.1 ppb 104 14 ppb 81%
U 34.49 1 ppb
• Samples were digested in a heated PTFE pressure vessel with conc nitric acid
• Note the wide range of concentrations measured (10’s ppb to 1000’s ppm)
• All elements were measured in the same analytical cycle
• Acquisition (3 replicates) was 6 min

GBW 08501 Peach Leaf CRM analysis ICP-ORS-MS
Element unit Reference value
Determined value
Cr (ng/g) 940±140 949
Co (ng/g) (250) 229
Cu (ug/g) 10.4±1.6 9.1
Zn (ug/g) 22.8±2.5 20.7
As (ng/g) 340±60 350
Se (ng/g) (40) 44
Cd (ng/g) 18±8 14.7
Ba (ug/g) 18.4±1.8 17.7
Hg (ng/g) 46±12 58
Pb (ng/g) 990±80 922
Wet Digested with Nitric and Perchloric AcidIn a Pressurised Tolg Bomb

BCR 191 (Brown bread) analysis ICP-ORS-MS
Found Certified
mg/kg
Chromium 0.258 +/- 0.063
Cobalt 0.039 +/- 0.003
Nickel 0.381 +/- 0.051
Copper 2.254 +/- 0.130 2.6±0.1
Zinc 17.38 +/- 1.386 19.5±0.5
Arsenic 0.027 +/- 0.004
Selenium 0.034 +/- 0.017
Molybdenum 0.214 +/- 0.015
Cadmium 0.024 +/- 0.003 0.028±0.002
Barium 1.533 +/- 0.105
Lead 0.198 +/- 0.076 0.187±0.014
Microwave digestion nitric/sulfuricData courtesy of B Zarchinas, CSIRO, S Australia
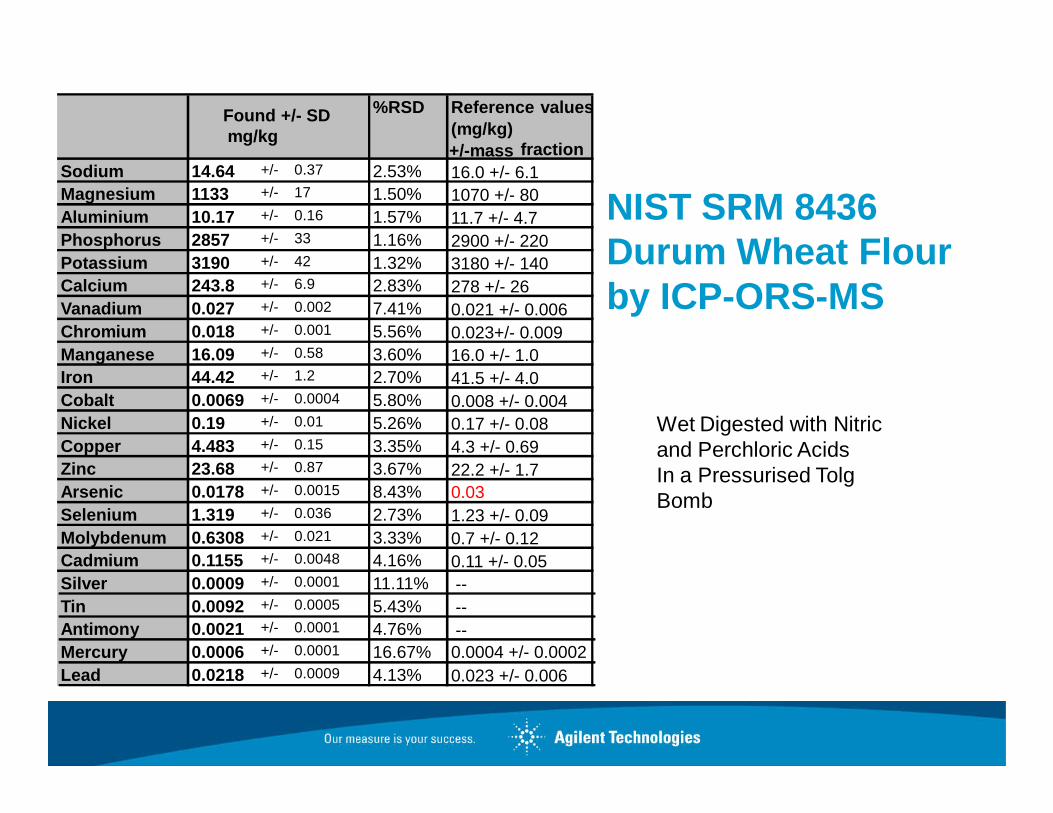
NIST SRM 8436 Durum Wheat Flour by ICP-ORS-MS
%RSD Reference values(mg/kg)+/-mass fraction
Sodium 14.64 +/- 0.37 2.53% 16.0 +/- 6.1Magnesium 1133 +/- 17 1.50% 1070 +/- 80Aluminium 10.17 +/- 0.16 1.57% 11.7 +/- 4.7Phosphorus 2857 +/- 33 1.16% 2900 +/- 220Potassium 3190 +/- 42 1.32% 3180 +/- 140Calcium 243.8 +/- 6.9 2.83% 278 +/- 26Vanadium 0.027 +/- 0.002 7.41% 0.021 +/- 0.006Chromium 0.018 +/- 0.001 5.56% 0.023+/- 0.009Manganese 16.09 +/- 0.58 3.60% 16.0 +/- 1.0Iron 44.42 +/- 1.2 2.70% 41.5 +/- 4.0Cobalt 0.0069 +/- 0.0004 5.80% 0.008 +/- 0.004Nickel 0.19 +/- 0.01 5.26% 0.17 +/- 0.08Copper 4.483 +/- 0.15 3.35% 4.3 +/- 0.69Zinc 23.68 +/- 0.87 3.67% 22.2 +/- 1.7Arsenic 0.0178 +/- 0.0015 8.43% 0.03Selenium 1.319 +/- 0.036 2.73% 1.23 +/- 0.09Molybdenum 0.6308 +/- 0.021 3.33% 0.7 +/- 0.12Cadmium 0.1155 +/- 0.0048 4.16% 0.11 +/- 0.05Silver 0.0009 +/- 0.0001 11.11% --Tin 0.0092 +/- 0.0005 5.43% --Antimony 0.0021 +/- 0.0001 4.76% --Mercury 0.0006 +/- 0.0001 16.67% 0.0004 +/- 0.0002Lead 0.0218 +/- 0.0009 4.13% 0.023 +/- 0.006
Found +/- SDmg/kg
Wet Digested with Nitric and Perchloric AcidsIn a Pressurised Tolg Bomb

NIST 8435 Whole Milk ICP-ORS-MS
Found Certifiedmg/kg mg/kg
23Na 3677 3560 ± 40024Mg 845 814 ± 7627Al 0.32 0.931P 7965 7800 ± 49034S 2607 2650 ± 35039K 13552 13630 ± 47043Ca 9525 9220 ± 49055Mn 0.18 0.17 ± 0.0556Fe 1.98 1.8 ± 1.160Ni 0.03 0.04 ± 0.0163Cu 0.47 0.46 ± 0.0866Zn 25.8 28 ± 3.175As 0.01 0.00182Se 0.15 0.131 ± 0.01495Mo 0.26 0.29 ± 0.13137Ba 0.59 0.58 ± 0.23208Pb 0.1 0.11 ± 0.05
Wet Digested with Nitric Acid and Hydrogen PeroxideIn a Microwave System

NIST 2387 Peanut Butter analysis ICP-ORS-MS
Element Reference value
mg/kg
Determined value
mg/kg
Value (error) 1 2 3 4 5 Mean % RSDMg 1680 (70) 1,660 1,750 1,690 1,680 1,670 1689.3 2.09P 3378 (92) 3,250 3,420 3,320 3,300 3,410 3341 2.22Ca 411 (18) 396 400 396 384 392 394 1.56Cr n/a 0.0257 0.023 0.021 0.025 0.020 0.023 10.3Mn 16 (0.6) 15.5 16.6 16.2 16.0 15.9 16.0 2.55Fe 16.4 (0.8) 15.7 16.4 15.9 15.7 15.6 15.9 2.07Ni n/a 0.821 0.852 0.834 0.824 0.819 0.8 1.66Cu 4.93 (0.2) 4.78 5.04 4.88 4.94 4.91 4.9 1.88Zn 26.3 (1.1) 26.6 27.9 26.8 26.8 27.0 27.0 1.81As n/a 0.0170 0.0178 0.0178 0.0172 0.0161 0.017 4.13Cd n/a 0.0522 0.0537 0.0523 0.0512 0.0519 0.1 1.74Pb n/a 0.00651 0.0057 0.0059 0.0056 0.0058 0.0059 5.87
Wet Digested with Nitric Acid, Sulfuric Acid and Hydrogen PeroxideIn an open system

Normalised Stability Plot Spiked Rapeseed Oil
0
0.2
0.4
0.6
0.8
1
1.2
1.4
1.6
1.8
2
00:0
0:00
00:2
0:00
00:4
1:00
01:0
2:00
01:2
3:00
01:4
4:00
02:0
4:00
02:2
5:00
02:4
6:00
03:0
7:00
03:2
8:00
03:4
8:00
04:0
9:00
04:3
0:00
04:5
1:00
05:1
1:00
05:3
2:00
05:5
3:00
06:1
4:00
06:3
5:00
06:5
5:00
07:1
6:00
07:3
7:00
07:5
8:00
08:1
9:00
08:4
0:00
09:0
1:00
09:2
1:00
09:4
2:00
10:0
3:00
10:2
4:00
10:4
5:00
11:0
6:00
11:2
7:00
Time
Nor
mal
ised
Con
cent
ratio
n
Be 9 NoGas
P 31 He
S 32 Xe
Ti 47 He
V 51 He
Cr 52 H2
Cr 53 H2
Mn 55 He
Fe 56 He
Co 59 He
Ni 60 He
Cu 63 He
Cu 65 He
Zn 66 He
As 75 He
Sr 88 NoGas
Mo 95 NoGas
Ag 107 NoGas
Cd 111 NoGas
Sn 118 NoGas
Sb 121 NoGas
Ba 137 NoGas
W 182 NoGas
Pb 208 NoGas
Normalized 11.5 hour stability plot for a spiked Rapeseed oil.
Each element measured in the appropriate cell mode (automatically switched during each sample analysis)
Simple Preparation:•Samples and standards
•Prepared in kerosene (Purum, Fluka) •1:3 by weight/weight dilution.
•Standards and internal standard•Prepared from ~1000mgkg-1 metallo-organic oils (Spex Certiprep & Conostan)
•Internal standards were added to all samples and standards prior to analysis.

Calibration plotsGas mode shown (no gas mode inset)

Analysing Soils Featuring the High Matrix Introduction (HMI) System

HMI Schematic

Sample Preparation
Sample preparation was undertaken in accordance with the partner lab’s Standard Operating Procedure
• 1 gram of soil to 8 ml of aqua regia prior to microwave extraction
• Extracted samples were further diluted to 50 ml final volume
– Ultra pure (18.2MΩ) water
• The final acid concentration is 4% HNO3 and 12% HCl.
By permissionWim ProperEurofins AnalyticoBarneveldNetherlands

Calculated Method Detection Limits (Dutch regulation AS3000)
Analyte -isotope
ORS mode MDLintDutch Required
MDLBe 9 He 0.042 0.1V 51 He 0.255 1Cr 52 He 2.300 15Co 59 He 0.147 1Ni 60 He 0.770 3Cu 63 He 0.502 5Zn 66 He 1.704 17As 75 He 0.549 4Se 78 H2 0.832 10Se 78 He 1.064 10Mo 95 He 0.195 1.5Ag 107 He 0.278 1Cd 114 He 0.058 0.17Sn 118 He 0.589 6Sb 121 He 0.333 1Te 125 He 1.217 10Ba 135 He 3.041 15Hg 201 He 0.014 0.05Tl 203 He 0.285 3Pb 208 He 1.197 13
By permissionWim ProperEurofins AnalyticoBarneveldNetherlands

Certified Reference Material Analysis FeNeLab FeNeLab River Clay (mg kg -1)
AnalyteORS Mode
Measured (ave, n=10)
Certified Rec. %(ave)
Be 9 He 1.6V 51 He 59.6Cr 52 He 191.9 187 103Co 59 He 19.8 18.7 106Ni 60 He 55.7 52.9 105Cu 63 He 153.9 156 99Zn 66 He 1031.6 970 106As 75 He 44. 7 44 102Se 78 H2 2.0Se 78 He 2.4Mo 95 He 1.3Ag 107 He 2.9Cd 114 He 8.5 8.07 105Sn 118 He 0.02Sb 121 He 1.6Te 125 He 0.3Ba 135 He 828.3 817 101Hg 201 He 4.1 3.83 107Tl 203 He 1.1Pb 208 He 297.0 274 108
Replicate (n=10) analyses (mg kg-1) of FeNeLab Reference Clay
Superb recoveries
Regulatory requirement 80 - 110%.
By permissionWim ProperEurofins AnalyticoBarneveldNetherlands

Certified Reference Material Analysis BCR144RBCR144R Sewage Sludge
AnalyteORS Mode
Measured (ave, n=10)
Certified Rec. %(ave)
Be 9 He 0.2V 51 He 13.9Cr 52 He 88.8 90 99Co 59 He 13.6 13.3 102Ni 60 He 40.7 44.9 91Cu 63 He 270.0 300 90Zn 66 He 825.1 919 90As 75 He 3.2Se 78 H2 1.7Se 78 He 1.5Mo 95 He 6.9Ag 107 He 8.2Cd 114 He 1.7 1.84 90Sn 118 He 36.0 40.8 88Sb 121 He 2.8 3.05 92Te 125 He 0.1Ba 135 He 319.2 367 87Hg 201 He 3.2 3.11 102Tl 203 He 0.1 0.14Pb 208 He 94.9 96 99
Replicate (n=10) analyses (mg kg-1) of BCR144R Reference Sewage Sludge
Superb recoveries
Regulatory requirement 80 - 110%.
By permissionWim ProperEurofins AnalyticoBarneveldNetherlands

CCV Stability – 235 Soil Samples
1.6
1.7
1.8
1.9
2
2.1
2.2
2.3
2.4
1 2 3 4 5 6 7 8 9 10 11 12 13 14 15 16 17 18 19 20 21
QC solution #
conc
entr
atio
n [p
pm]
Be / 9 [#3] Ti / 47 [#3]Ti / 48 [#3] V / 51 [#3]Cr / 52 [#3] Cr / 53 [#3]Mn / 55 [#2] Mn / 55 [#3]Ni / 58 [#3] Co / 59 [#3]Ni / 60 [#3] Ni / 61 [#3]Cu / 63 [#3] Zn / 64 [#3]Cu / 65 [#3] Zn / 66 [#3]Zn / 68 [#3] Se / 77 [#3]Se / 78 [#2] Se / 78 [#3]Se / 82 [#3] Mo / 95 [#3]Mo / 98 [#3] Cd / 111 [#3]Cd / 114 [#3] Sn / 118 [#3]Sn / 120 [#3] Sb / 121 [#3]Sb / 123 [#3] Ba / 135 [#3]Ba / 137 [#3] Pb / 208 [#3] #2: H2 mode, #3: He mode
Control limits +/- 10%
All Elements 2 mg kg-1
By permissionWim ProperEurofins AnalyticoBarneveldNetherlands

Continuing Calibration Check (CCV) Recoveries (n-21) = As
0.8
0.85
0.9
0.95
1
1.05
1.1
1.15
1.2
1 2 3 4 5 6 7 8 9 10 11 12 13 14 15 16 17 18 19 20 21
CCV # (QC solution #)
conc
entr
atio
n [p
pm]
1 mg kg-1 As
Control limits +/- 10%By permissionWim ProperEurofins AnalyticoBarneveldNetherlands

Continuing Calibration Check (CCV) Recoveries (n-21) Hg
40
42
44
46
48
50
52
54
56
58
60
1 2 3 4 5 6 7 8 9 10 11 12 13 14 15 16 17 18 19 20 21
CCV # (QC solution #)
conc
entr
atio
n [p
pb]
50 µg kg-1 Hg
Control limits +/- 10%
By permissionWim ProperEurofins AnalyticoBarneveldNetherlands
Agilent’s HMI Advantages
Speed
• HMI does not require liquid dilution of sample and stabilization of diluted sample. • It also permits the use of Agilent’s pre-emptive rinse function
– which allows rinsing of the sample tubing to begin before acquisition has finished.Low maintenance
• No tubing to replace, no moving parts to maintainSimple
• No critical timing issues or plumbing common to continuous flow autodilutorsFlexibility
• Since hardware changes or reconfigurations are not required after installation of HMI,
• The system can be switched between conventional mode and HMI mode on the fly.7500cx ICP-MS fitted with HMI to replace several instruments
• Including conventional ICP-MS, ICP-OES and a dedicated mercury analyzer.

However ICP-MS is MORE than a simple replacement for GFAAS or ICP-OES
Isotope ratio measurements
1. Isotope dilution
2. Stable (non-radioactive) isotope tracer studies
Speciation
2. LC-ICP-MS
3. GC-ICP-MS

ICP-MS offers: Isotope Ratio Measurements
Quadrupole based systems offer a simple means of measuring isotope ratios
• Not as precise as Thermal Ionisation Mass Spectrometry
• But faster and cheaper
ICP-MS opens the door to
• Stable isotope tracer (e.g element uptake in plants)
– Non-radioactive
– Relatively inexpensive
• Isotope dilution calibration
– Extremely accurate
The ORS improves precision
• As well as removing potential isobaric overlaps

Isotope Ratio Measurements (NIST 982)
Day Two
Uncorrected data Corrected for mass bias
run 1 - am run 2 - pm run 1 - am run 2 - pm
208/206 208/206 208/206 208/206
1 1.02124 1.02218 0.99954 1.00046
2 1.02145 1.02155 0.99974 0.99984
3 1.02218 1.02187 1.00046 1.00015
4 1.02124 1.02124 0.99954 0.99954
5 1.02218 1.02155 1.00046 0.99984
6 1.02197 1.02270 1.00025 1.00097
7 1.02323 1.02197 1.00148 1.00025
8 1.02135 1.02155 0.99964 0.99984
9 1.02166 1.02260 0.99995 1.00087
Mean 1.00012 1.00020
Measured bias factor Std dev 0.00063 0.00049
1.021877 %RSD 0.06% 0.05%
Day One
Uncorrected data Corrected for mass bias
run 1 – am run 2 - pm run 1 - am run 2 - pm
208/206 208/206 208/206 208/206
1 1.02438 1.02312 1.00080 0.99957
2 1.02427 1.02364 1.00069 1.00008
3 1.02354 1.02448 0.99998 1.00090
4 1.02385 1.02427 1.00029 1.00069
5 1.02406 1.02417 1.00049 1.00059
6 1.02406 1.02291 1.00049 0.99936
7 1.02385 1.02291 1.00029 0.99936
8 1.02312 1.02406 0.99957 1.00049
9 1.02249 1.02385 0.99896 1.00029
Mean 1.00017 1.00015
Measured bias factor Std dev 0.00059 0.00059
1.023728 %RSD 0.06% 0.06%
NIST 982 certificate value 208/206 1.00016+/- 0.000 36

ICP-MS As A Detector – Interfacing Options
OptionalConventionalDetector(s)
GC
LC/IC
CE
ICP-MS
Laser Ablation

LC-ICP-MS Instrumentation and Applications
Determination of just about any elemental species
Cr, As, Se, Sn, P, Br, Fe, Hg, Pb etc. etc. etc…..
Based upon their oxidation state and/or organic complex

LC-ICP-MS – As Speciation
Phenylarsonic acids used for the control of parasites and as growth promoters in poultry – concerns are raised as to the safety in excretions

LC-ICP-MS – As Speciation
Intensity
Retention time [min]
0 5 10 15 20 25
0
5000
10000
15000
20000
250004-APA
4-HPA
2-NPA
PA
3-NHPA
4-NPA
0.10 ng As0.25 ng As0.50 ng As1.00 ng As2.50 ng As5.00 ng As
Phenylarsonic acids determined in one run using Agilent LC-ICP-MS
Data kindly provided by Walter Goessler et. al. (U. Graz)

LC-ICP-MS – As Speciation
Data kindly provided by Walter Goessler et. al. (U. Graz)
During storage of chicken litter, the phenylarsonic compounds are converted to arsenate, arsenite, methylarsonic- and dimethylarsinic acid, probably by bacteria, significantly increasing the toxicity.
Retention time [min]
0 5 10 15 20 25
Intensity
0
10000
20000
30000
Uncomposted Chicken Litter
3-NHPA
4-HPA
PA
4-APA +As(V)
Composted Chicken Litter– expanded scale
As(V)
As(III)
DMA
MA

Methyl Mercury
Methyl mercury is highly toxic and is readily absorbed by the body
• USEPA's current reference dose for methylmercury is 0.1 micrograms per kilogram of body weight per day
The species is formed by biotic and abiotic methylation of the inorganic metal ion
• It has been used as a fungicide, disinfectant, and in industrial processes
Some fish appear to accumulate methyl mercury and this is how the majority of the material enters the human food chain
GC with MIP or ECD is the normal means of analysis
• New lower levels of detection are required to meet reduction in international standards

Mercury Species by LC-ICP-MS
0.501.001.502.002.503.003.504.004.505.005.506.006.507.007.508.000
2000
4000
6000
8000
10000
12000
14000
16000
18000
20000
22000
24000
26000
28000
30000
32000
34000
Time-->
Abundance
TIC: HG-JLU.D (+,-) 2.48
3.21
6.54
MeHg
Hg2+EtHg

Agilent GC-ICP-MS Interface
GC-ICP-MS System used:
ICP-MS: Agilent 7500
GC: Agilent 6890
Interface: Agilent G3158A
Fully heated and insulated GC transfer lineModified torch with heated injector replaces standard demountable torch. “Silicosteel” transfer line and injector liner for inertnessGC capillary can be inserted to tip of injector or terminated in GC ovenGC effluent injected directly into base of plasma –essential for high boiling point compoundsSpecies decomposed to atoms - atoms then ionized and passed into MS

Initial investigations into the coupling of GC to ICP-MS, for the analysis of organotin compounds
GC-ICP-MS used to separate and quantify organotin compounds in marine environmental samples of oyster tissue and sediment
– monobutyltin (MBT)– dibutyltin (DBT)– tributyltin (TBT)– monophenyltin (MPhT)– diphenyltin (DPhT)– triphenyltin (TPhT)
GC-ICP-MS – Organotin (OT) Speciation

Determination of Organotin Species in Sediment
200 250 300 350 400 450 500 550 600 650
2.5E5
5.0E5
[2] TIC:4-std3.d [Count]
sec->
TPhT590 sec
DPhT425 secTBT
328 sec
MPhT315 sec
DBT287 sec
TPrT264 sec
MBT243 sec
Retention time (sec)
Concentration PACS -2 CRM (pg l -1 Sn)
Values MBT DBT TBT MPhT DPhT TPhT
Certified (300) 1090±150 980±130 250±20*
250±20* 250±20*
Found 947±27 914±74 947±28 230±17 219±17 228±30
(xxx) = non-certified* = spiked species
Data Courtesy of Dr Olivier Donard,
U. Pau, France
GC-ICP-MS for OT Speciation

Ion 12.00 (11.70 to 12.70): CICCAL3.D
Ion 31.00 (30.70 to 31.70): CICCAL3.D
Ion 34.00 (33.70 to 34.70): CICCAL3.D
Carbon
Phosphorus
Sulphur
Ion 35.00 (34.70 to 35.70): CICCAL3.D
Ion 79.00 (78.70 to 79.70): CICCAL3.D
3.0 4.0 5.0 6.0 7.0 8.0 9.0 10.0 11.0 12.0 13.00
Ion 127.00 (126.70 to 127.70): CICCAL3.D
Chlorine
Bromine
Iodine
Pesticide Calibration Standard - Extracted Element Chromatograms

Sulfur ResponseR2 = 0.9996
0
100000
200000
300000
400000
500000
600000
700000
800000
900000
0 500 1000 1500 2000 2500
Concentration
Are
a
Phosphorous Response
R2 = 0.9935
0
1000000
2000000
3000000
4000000
5000000
6000000
7000000
8000000
9000000
0 200 400 600 800 1000 1200Concentration
Are
a
Malathion
Phorate
Dursban
Terbufos
Diazinon
Compound Independent Calibration
compound
Compound Concentration
pg/uL RT (min)P conc (ppb)
P response
Phorate 2102 7.01 250.14 1813218Terbufos 7454 7.87 735.71 5470509Diazinon 9755 8.1 955.01 7644808Malathion 1072 9.75 100.45 728914Dursban 5690 9.94 501.86 4205767
EthopropMalathion
Dursban Phorate
Diazinon
Terbufos
Compound
Compound Concentration
pg/uL RT (min)S conc (ppb)
S response
Ethoprop 385 6.4 101.64 23544Phorate 2102 7.01 775.64 261462Terbufos 7454 7.87 2280.92 785089Diazinon 9755 8.1 1024.28 360585
Malathion 1072 9.75 207.97 62313Dursban 5690 9.94 597.45 197738

GC-ICP-MS for Headspace Sampling
Supplementation of food and beverage products –Coffee contains low natural levels of volatile Se species (measured in headspace of brewed coffee). After supplementation by soaking beans in SeMet solution (2ppm), several Se species can be determined in the headspace of the brewed coffee

Service and Applications Support
Agilent is World #1 in ICP-MS units supplied since 1994. Largest user base community gives unprecedented expertise and support for new users.
Agilent on-line community is available to share ideas
Agilent ICP-MS Journal - the only regular ICP-MS users newsletter - produced 4 times/year featuring applications techniques, user stories, news, features and product information
Extensive Worldwide teams of Hardware and Applications Support staff, covering all time zones and with extensive industry expertise
Agilent ICP-MS training - extensive schedule of training classes and customized on-site training available
Committed to ongoing communications via online user forum, newsletters and a very popular an successful annual ICP-MS user meeting

Agilent ICP-MS Webpage

Bottlenecks in the laboratory workflow affect PRODUCTIVITY
• Limit the turnaround time of the lab
Agilent ICP-MS can unleash the potential of a food lab and maximise productivity
• Measure all elements on a single instrument
– Low detection limits replaces GFAAS, CVAFS, Hydride generator AAS and ICP-OES
• Wide dynamic range means fewer reruns
• Unique He collision/reaction cell (Agilent ORS) provides freedom from interferences and true accuracy
ICP-MS delivers FLEXIBILITY
• HMI to handle samples with high dissolved solids
• Use it as a detector for chromatography
• Isotope ratio capability for isotope dilution or stable tracer experiments
Summary


