Page 1
Accepted Manuscript
Cost-effective Photoelectrocatalytic Treatment of Dyes in a Batch Reactor
Equipped with Solar Cells
Mohammad Ebrahim Olya, Azam Pirkarami
PII: S1383-5866(13)00461-9
DOI: http://dx.doi.org/10.1016/j.seppur.2013.07.038
Reference: SEPPUR 11331
To appear in: Separation and Purification Technology
Received Date: 28 September 2012
Revised Date: 12 June 2013
Accepted Date: 27 July 2013
Please cite this article as: M.E. Olya, A. Pirkarami, Cost-effective Photoelectrocatalytic Treatment of Dyes in a
Batch Reactor Equipped with Solar Cells, Separation and Purification Technology (2013), doi: http://dx.doi.org/
10.1016/j.seppur.2013.07.038
This is a PDF file of an unedited manuscript that has been accepted for publication. As a service to our customers
we are providing this early version of the manuscript. The manuscript will undergo copyediting, typesetting, and
review of the resulting proof before it is published in its final form. Please note that during the production process
errors may be discovered which could affect the content, and all legal disclaimers that apply to the journal pertain.
Page 2
1
Cost-effective Photoelectrocatalytic Treatment of Dyes in a Batch Reactor Equipped with Solar
Cells
Mohammad Ebrahim Olya*, Azam Pirkarami
Department of Environmental Research, Institute for Color Science and Technology, P. O. Box: 16765-
654, Tehran, Iran
*Corresponding author: Department of Environmental Research, Institute for Color Science and
Technology, P. O. Box 16765-654, Tehran, Iran. Tel: +98 2122944184; Email address: olya-
[email protected]
Abstract
This study was an investigation into the effect of a number of operating parameters on the
photoelectrocatalysis removal of Reactive Red 120 (RR 120) and Acid Orange 2 (AO 2) from aqueous
solutions. Ni-TiO2 was used as the photocatalyst, which was applied in suspension to the solutions to
achieve a larger catalyst surface area. Photocatalyst dose, dye concentration, pH, bias potential, and
electrolyte concentration were found to be optimum at 0.6 mg L-1, 50 mg L-1, 7, 1.6 V, and 5 mg L-1,
respectively. Substantial reduction was observed in the COD values of the solutions, suggesting that the
treatment was effective. Photocatalyst efficiency was evaluated using FT-IR, SEM, TEM, XRD, EDX,
and BET techniques. Intermediate compounds were revealed during GC-MS analysis for the
characterization of post-treatment products. Pathways were proposed for the removal of the dyes. Solar
cells supplied the energy required by the experiment, making it unnecessary to purchase electricity. Cost
analysis was also performed for the treatment process.
Keywords: Reactive Red 120, Acid Orange 2, Photoelectrocatalysis, Ni-TiO2, Cost analysis, Solar cell
Page 3
2
1- Introduction
The color stuff lost in textile, leather, and plastic industries poses a major problem to water resources [1-
5]. A water treatment technique which has attracted a great deal of attention in recent years is
photoelectrocatalysis (PEC) [6, 7]. In this technique, a semiconductor used as the photocatalyst is
subjected to ultraviolet (UV) irradiation. This excites the electrons in the semiconductor from the valence
band to the conduction band and generates the electron-hole (H+/e-) pairs [8-11]. These photo-generated
pairs produce hydroxyl radicals [12], which transform organic contaminants adsorbed on the surface of
the photocatalyst to less harmful compounds [13]. Titanium dioxide (TiO2) has been widely used as a
photocatalyst for the decomposition of pollutants because it is comparatively inexpensive, non-toxic,
highly stable, and environmentally friendly [14-18] and has appropriate band-gap (3.0 eV) to adsorb UV
light at 365 nm [19]. However, it has low light-utilizing efficiency, and this limits its
photoelectrocatalytic capability. This limitation has encouraged many researchers to dope TiO2 with
metals such as gold, silver, copper, and nickel [20]. Doping enhances degradation by preventing the
recombination of electrons and holes [21]. TiO2 powder is typically applied as a thin film on the anode
electrode [22, 23] or on such carriers as glass, ceramics, and zeolite [24, 25], which are then put in the
photocatalytic microenvironment.
In this study, TiO2 was doped with nickel (Ni) and applied to the aqueous solution in suspension to obtain
a larger photocatalyst surface area, more contact between the photocatalyst and the pollutant molecules,
and higher degradation efficiency [26]. The problem of separating Ni-TiO2 powder from the treated
solutions [27, 28] was dealt with by subjecting the post-treatment solution to centrifugation. Ni-doped
TiO2 (Ni-TiO2) was used in this research to (i) keep the electrons and holes separate and (ii) improve the
PEC degradation of a reactive dye and an azo dye [29]. An aqueous solution containing Reactive Red 120
(RR 120) and Acid Orange 2 (AO 2) as pollutants was subjected to the PEC process in order to explore
the effect of a number of operating parameters on the efficiency of dye removal. The parameters were
photocatalyst dose, initial dye concentration, pH value, bias potential, and NaCl (as the electrolyte). The
Page 4
3
Chemical Oxygen Demand (COD) test was used to judge the efficiency of the treatment. Cost analysis
was also performed, considering the costs of UV irradiation, electrical energy, electrolyte, and
photocatalyst material as major cost items. The efficiency of the photocatalyst was studied using FT-IR,
SEM, TEM, XRD, EDX, and BET techniques. The GC-MS technique was used to characterize the post-
treatment products. To improve the economic efficiency of the process, solar energy was used. There are
no reports, to our knowledge, of the use of solar energy in PEC.
2. Experimental
2.1. Reagents
The chemicals used in this research were titanium tetraisopropoxide (TTIP), nickel nitrate hexahydrate,
diethanolamine, glacial acetic acid, absolute alcohol, and deionized water (produced by the researchers).
All the other chemical reagents, which were purchased and used as received from Merck chemical
company in Germany, were of analytical grade or better quality.
2.2. Preparation of the photocatalyst
The photocatalyst used in this study was TiO2 doped with nickel (Ni-TiO2). The components of the nano-
sized powder were synthesized separately before they were combined via a sol-gel process. Below is a
description of the procedures.
For TiO2 preparation, first hydroxyl propyl cellulose (HPC) was dissolved in ethanol under fast stirring
for 5 minutes in order to make the TiO2 nanoparticles be the same size [30]. Then, TTIP was added to the
mixture. This was followed by 15 minutes of stirring. A mixture of glacial acetic acid, absolute alcohol,
and deionized water was the next addition. Fifteen minutes of stirring ensued to ensure a yellow
transparent acidic TiO2 sol. The sol was allowed to stand for 30 minutes at room temperature. Glacial
acetic acid was used as an inhibitor to slow down the fast hydrolysis of TTIP.
Page 5
4
The nickel sol was prepared as follows. First, nickel nitrate hexahydrate was dissolved in absolute alcohol
under 5 minutes of stirring. Subsequently, a mixture of diethanolamine (used in order to influence the
morphologies and homogeneity of the final products [31]), absolute alcohol, and deionized water was
poured into the solution under fast stirring. The resulting solution was continuously stirred for 15 minutes
to achieve a transparent alkaline nickel sol.
For the final Ni-TiO2 photocatalyst, the Ni sol was directly incorporated into the TiO2 sol. The resultant
nanocomposite was allowed to dry at room temperature. Then, it was calcined at 350 °C for 10 minutes
and subsequently at 500 °C for 5 hours, with the temperature being increased at a speed of 5 °C/Sec.
Lastly, the specimen was cooled before use.
2.3. Materials and Equipment
The dyes used to color the aqueous solution were RR 120 and AO 2 purchased from the German company
of Merck. NaOH and HCl (both from Merck) were used to set the pH of the solution. The electrolyte was
NaCl, which was also obtained from Merck. This salt is non-toxic, inexpensive, soluble, and highly
conductive, and has negligible effect on pH. The solar cell, MA 36/45, was purchased from Optical Fiber
Fabrication Company (an Iranian manufacturer in Tehran). The specifications are given in Table 1. The
solar cell battery was of a valve-regulated lead-acid rechargeable type obtained from the Iranian company
of Faran Electronic Industries.
Table 1.
A rheostat controlled the electrical current. The photoelectrocatalytic (PEC) reactor was a glass
container (80×70×290 mm), with aluminum foil covering its walls. Two titanium electrodes
(180×30×2 mm) were placed in parallel position in the reactor at a space of 10 mm from each other.
The excitation source was a 6W UV lamp (irradiation at 365 nm) purchased from Philips, the Dutch
supplier (features and benefits UV lamp: emit short-wave UV radiation with a peak at 253.7 nm (UV-
Page 6
5
C) for germicidal action, lamp glass filters out the 185 nm ozone-forming line, protective inside
coating limits depreciation of useful UV-C output, and warning sign on lamp indicates UV-C
radiation output).The lamp was placed inside a single-walled quartz tube in the middle of the reactor.
The efficient volume of the PEC reactor was 1000 mL after subtracting the volume occupied by the
quartz tube. Fig. 1 is the sketch diagram of the reactor used in the experiment.
Fig. 1.
2.4. Procedure
The aqueous solutions were prepared by dissolving dyes into pure water. Then, NaCl and Ni-TiO2 were
added to the solution. The pH of the solution was adjusted with NaOH and HCl. The solution was poured
into the reactor and was then magnetically stirred at 200 rpm to ensure homogeneity. Then, the electrodes
were immersed in the solution. Prior to and following each run of the experiment, the electrodes were
thoroughly rinsed with water, placed in HCl solution for at least 10 minutes, and then washed with water
again. At a later stage, the UV lamp was put inside the reactor. At the same time, the electrodes were
connected to the DC power supply, and the UV lamp was turned on.
Each solution was subjected to the PEC process to study the impact of a number of operating factors on
the efficiency of removing a reactive dye and an azo dye: catalyst dose, dye concentration, pH, bias
potential, and NaCl. Each run of the experiment lasted for 30 minutes. To study the effect of catalyst dose
on the removal of dyes from the experimental solutions, five quantities of 0.1, 0.3, 0.6, 0.9, and 1 mg L-1
were applied. The doses considered for the effect of dye concentration on removal efficiency were 50,
100, 150, 200, 250, 300, and 350 mg L-1. The impact of pH was determined by setting the pH of the
solutions at eight values: acidic (pH 2, 3, 4, 6), neutral (pH 7), and basic (pH 9, 10, 12). To see which bias
potential leads to the highest efficiency of color removal, five levels were applied: 0.8, 1, 1.3, 1.6 and 1.8
Page 7
6
V. The effect of electrolyte was examined using NaCl at seven concentrations: 0, 0.5, 1, 2, 3, 5, and 10
mg L-1. The viability of the removal technique was determined by measuring the COD of the treated
solutions.
2.5. Photocatalyst Characterization
The morphological features and surface characteristics of the Ni-TiO2 photocatalyst were studied using a
scanning electron microscope (SEM) unit (HITACHI-3000 SH Model, Japan) and transmission electron
microscopy (TEM, HF-2000, Hitachi, Japan) operating at 200 kV. The specific surface area of Ni-TiO2
was determined using the BET (Brunauer-Emmett-Teller) method on the Quantachrome NOVA 2000e
equipment. Further, the efficiency of the nanocomposite was judged by the X-ray diffraction (XRD)
technique using a Philips PW 1710 high power diffractometer (the Netherlands) with Cu Kα radiation at
40 kV and 40 mA. Another technique was utilized to characterize the Ni-TiO2: FT-IR spectrometry. For
this purpose, the photocatalyst was mixed with spectroscopically pure KBr in the ratio of 2:200 to make
pellets, which were to be placed in the Shimadzu 8300 FT-IR (Perkin-Elmer, Spectrum one). FT-IR
spectra were obtained in the range of 500 to 4000 cm-1.
2.6. Evaluation of PEC Efficiency
The UV absorbance of each dye was tested using a UV–Visible spectrophotometer (Campec M-350
Double Beam) at wavelengths of 530 nm and 484 nm (the maximum absorbance wavelengths of RR120
and Acid Orange 2, respectively). For this purpose, at the end of each run of the experiment, 5-mL
aliquots were taken out from each solution and were centrifuged at 12,000 rpm for 20 minutes before they
were placed inside the spectrophotometer. The linear relationship between dye concentration and removal
efficiency was determined through Eq. (1):
0(%) 100C C
CRC
−= × (1)
Page 8
7
where C0 and C are the light absorbance of the dye before and after PEC, respectively.
The degradation products were also analyzed through gas chromatography-mass spectrometry (GC-MS)
using an Agilent 7890GC device (Agilent Technologies, USA) with a 30 m × 0.25 mm HP-5MS capillary
column equipped with an Agilent 5973 mass spectrometer operating in the electron mode at 70 eV. The
temperature program of the column was as follows: 50 °C for 5 min, up to 300 °C at a rate of 10 °C min-1.
The temperature of the inlet and detector was 250 and 150 °C, respectively. The carrier gas was pure
helium (99.999%) used at a flow rate of 1 mL min-1. For identification purposes, the intermediate
compounds formed during the photocatalytic process were compared with commercial standards. Then,
their fragment ions in the mass spectra were interpreted under the following conditions: an m/z scan from
40 to 250, scan speed of 2000, interval 0.5 s, and ion source temperature of 200 °C.
3. Results and discussion
The PEC removal of RR 120 and AO 2 from the aqueous solutions was investigated at of 530 nm and 484
nm. The optimal conditions for both dyes proved to be catalyst dose of 0.6 mg L-1, initial dye
concentration of 50 mg L-1, pH of 7, bias potential of 1.6 V, and electrolyte concentration of 5 mg L-1. A
discussion of these parameters ensues.
3.1. Effect of photocatalyst dose
The effect of photocatalyst on the degradation kinetics of RR 120 and AO 2 was investigated by applying
five doses of Ni-TiO2: 0.1, 0.3, 0.6, 0.9, and 1 mg L-1. The observation was that an increase in the quantity
of the nanocomposite resulted in a corresponding increase in the PEC degradation of both dyes. However,
as Fig. 2 shows, the last three values cause essentially the same degree of removal efficiency. For this
reason and to take account of economic considerations, 0.6 mg L-1 was taken to be the optimum dose for
efficient degradation of both dyes. The effect of photocatalyst quantity is explainable by the fact that
increasing the amount of photocatalyst correspondingly increases the number of active sites on the Ni-
TiO2 surface, which in turn increases the number of OH• and OH2• radicals.
Page 9
8
Another important issue is that although the molecular structure of RR 120 is much more complicated
than that of AO 2, the two dyes had the same removal efficiency under the same reaction conditions. A
possible explanation is that H2O2 produced during the electrochemical process is transformed into
hydroxyl and superoxide radicals as a result of UV irradiation. This dramatically increases the population
of the active sites in the microenvironment and thus maximizes the photocatalytic power. Under this
strong destructive force all dyes quickly begin to degrade regardless of their molecular structure. Indeed,
only after a few minutes, we observed the degradation of both RR 120 and AO 2 and the formation of
intermediate compounds. The GC-MS analysis (given in Section 4.5 below) confirmed this.
Fig. 2.
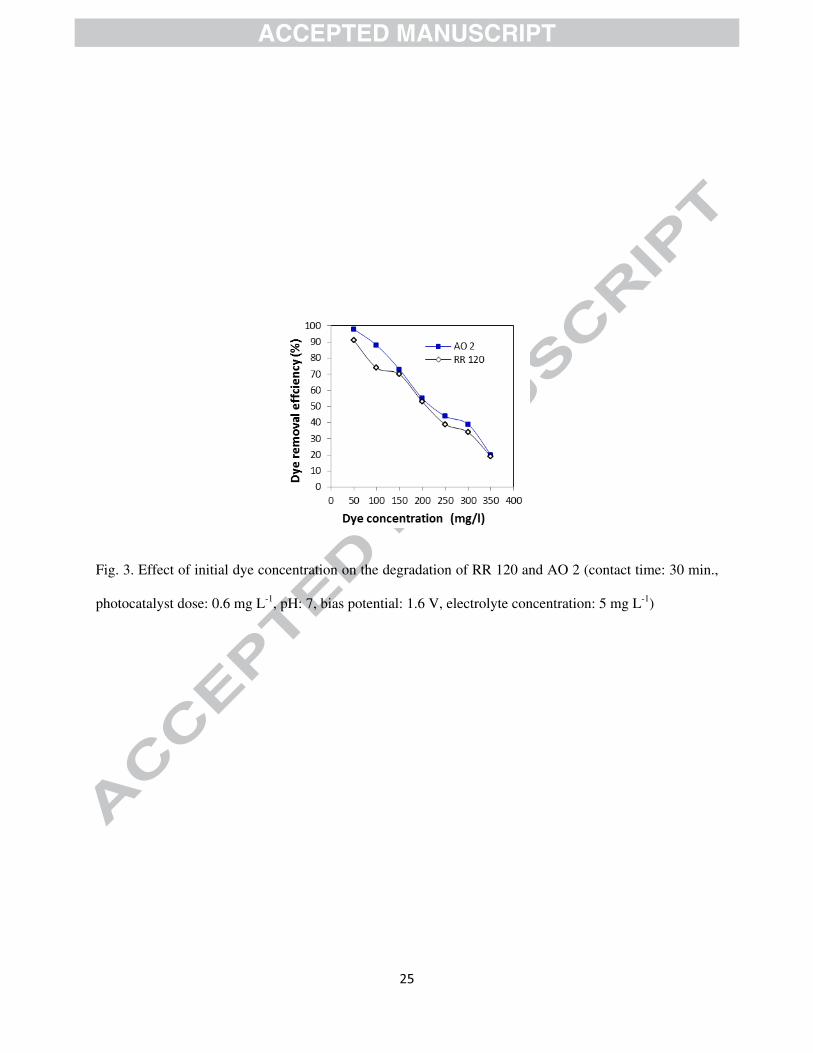
3.2. Effect of initial dye concentration
For the effect of the initial concentration of the dye on the degradation efficiency, seven quantities of 50,
100, 150, 200, 250, 300, and 350 mg L-1 were studied. It can be seen from Fig. 3 that removal is
maximum at the dye concentration of 50 mg L-1 and that increasing dye concentration reduces the rate of
removal in the case of both dyes. This reduction may be explained as follows: an increase in the amount
of dye in the solution prevents the penetration of light photons to the surface of the photocatalyst, and this
inhibits the formation of hydroxyl and superoxide radicals responsible for attacking the dye molecules,
thus resulting in diminished removal efficiency [32, 33].
Fig. 3.
3.3. Effect of pH value
Page 10
9
Fig. 4 illustrates the effect of different values of pH on the efficiency of the removal of RR 120 and AO 2:
acidic (pH 2, 3, 4, 6), neutral (pH 7), and basic (pH 9, 10, 12). The effect of pH can be explained in terms
of point of zero charge (pzc) of the Ni-TiO2 surface. The pzc for a given mineral surface is a value of pH
where that surface is neutrally charged. The first observation for both dyes was that as pH of the solution
increased from 5 to 7, more removal efficiency was obtained. An explanation is that these values of pH
lead to a little increase in the concentration of H+ ions in the solution, which in turn causes the
photocatalyst surface to be positively charged. This generates an electrostatic force between negatively-
charged dye molecules and the positively-charged the photocatalyst surface. As a result, the dye
molecules react with the OH• and O•2 on the photocatalyst surface, a fact which results in improved
removal efficiency. At pH values below 5, the concentration of H+ ions in the solution increases too
much. As a result of this, the dye molecules are combined with these H+ ions and do not get the
opportunity to be adsorbed onto the surface of the photocatalyst. Lastly, it was observed that the rate of
removal diminished at pH values beyond 7. This phenomenon may be attributed to the fact that higher pH
values increases the concentration of OH- ions in the solution. This increased concentration causes the
photocatalyst surface to be negatively charged. Once this happens, the negatively-charged dye molecules
are repulsed, and dye removal efficiency suffers [34- 36].
Fig. 4.
3.4. Effect of bias potential
To determine which level of bias potential leads to the highest efficiency of dye degradation, five levels
(0.8, 1, 1.3, 1.6 and 1.8 V) were applied to the electrodes in the experiment to (Fig. 5a). It can be seen
that, for both dyes, removal efficiency increased as bias potential rose from 0.8 V to 1.6 V. An
explanation is that as the bias potential increases, more electrons are produced in the aqueous. This
Page 11
10
increases the current density of the solution, which in turn increases the active sites in the solution. It is
these sites which improve the degradation ability of the reactor.
A mechanism can be proposed for the photodegradation of dyes (Fig. 5b). First, upon UV illumination,
the electrons on Ni-TiO2 surface are excited from the valence band (VB) to the conduction band (CB) and
as a result generate electron-hole pairs (Eq. (2) and (3) below [38, 39]).
+− −+−− → VBCB
hv
hTiONieTiONiTiONi 222 )( (2)
reactionreduction )()( 2 +−+ −CBSurf eTiONieNi (3)
Furthermore, as Eq. (4) shows, the nickel particles doped on the surface of TiO2 may act as electron-
trapping agents and hamper the recombination of photo-generated electrons and holes. In the meantime,
H2O2 generated as a result of reactions in the aqueous solution may speed up the process of dye
degradation by increasing the number of hydroxyl and superoxide radicals responsible for attacking the
dye molecules (Eq. (5) to (8) below [40]).
22 )()( TiONieNieTiONiNi SurfSurf −+→−+ (4)
−∗∗ +→−+ OHOHeTiONiOH )(222 (5)
HOHhOH VB∗∗+ +→+ 222 (6)
222 OOHOHOH +→+ ∗∗ (7)
products mineral2 →++ −∗∗ DyeOOH (8)
Fig. 5.
Page 12
11
An important observation was that removal efficiency declined at a bias potential of 1.8 V. A possible
reason can be that at potential values of higher than 1.6 V, the oxygen in the aqueous solution reduces the
number of hydroxyl radicals via undesirable reaction with them [37]. In addition, Fig. 5a shows that at
some values of bias potential, RR 120 was more efficiently removed than AO 2, but that at other values,
the removal efficiency of AO 2 was higher. However, these differences in removal efficiency are not
significant, meaning that the reactor was so strong that it degraded both dyes more or less equally
regardless of the molecular structure.
3.5. Effect of electrolyte
For the effect of electrolyte, six concentrations of NaCl were investigated: 0, 0.5, 1, 2, 3, 5, and 10 mg L-
1. As Fig. 6 shows, dye removal was 25-26% in the absence of electrolyte, but the process was
significantly enhanced as NaCl concentration rose. This degradation enhancement is attributable to the
increase in the conductivity of the solution caused by the presence of electrolyte (i.e., more efficient Ni-
TiO2-induced electron excitation and hole generation) [41, 42]. Also, removal efficiency did not undergo
any significant increase beyond the electrolyte dose of 5 mg L-1.
Fig. 6.
3.6. Chemical oxygen demand (COD)
The COD test is widely used to evaluate the efficiency of dye removal techniques by measuring the
amount of organic compounds in water [43]. In this research, for both dyes a comparison was drawn
between the COD value of the pre-treatment solution and that of the treated solution in the obtained
optimum operating conditions (contact time: 30 minutes, photocatalyst dose: 0.6 mg L-1, dye
concentration: 50 mg L-1, pH: 7, bias potential: 1.6 V, electrolyte concentration: 5 mg L-1). The COD
Page 13
12
values substantially declined (Fig. 7). More specifically, COD for the RR 120 solution dropped from
1532 to 85 mg L-1 (i.e., 95.5% removal). Also, the AO 2-containing solution underwent a significant fall
from 1494 to 61 mg L-1, indicating a degradation efficiency of 96%. In another run of the experiment, the
COD test was applied to an aqueous solution containing both dyes. A substantial decrease in COD values
was observed here too, from 1548 to 78 mg L-1 (that is, 95% removal).
Fig. 7.
3.7. Energy consumption
The amount of energy consumed by the PEC process (denoted by E and expressed in kWh/m3 aqueous
solution) was calculated using Eq. (9) [44, 45]:
( )U.I.tE
v= (9)
where U is the applied voltage, I is the current intensity, t is the time of reaction (in minutes), and v is the
volume of the aqueous solution (m3).
While treating the solution containing RR 120 re quired 4.3 kWh/m3, the AO 2 solution was treated
consuming 3.8 kWh/m3 of energy. The treatment of the solution containing both dyes was accomplished
with the consumption of 4.8 kWh/m3 of energy. It is worth noting at this point that this energy was
supplied by solar cells, meaning that the money that would have otherwise been spent on electricity was
saved.
4. Characterization and analysis
4.1. Characterization of TiO2 and Ni-TiO2: FT-IR analysis
Page 14
13
To determine the efficiency of TiO2 preparation, the FT-IR spectra of TiO2 and (b) of Ni-TiO2 were
studied. As for TiO2, three significant peaks were observed (Fig. 8a). The peak at 700 cm−1 suggests the
formation of symmetric Ti-O-Ti stretching. The peak at 1271 cm−1 indicates the presence of HPC, the
organic polymer. The peak at 3424 cm−1 can be attributed to the presence of O-H stretching. According to
FT-IR spectra for Ni-TiO2 (Fig. 8b), symmetric Ti-O-Ti stretching took place at 659 cm−1, HPC appeared
at 1384 cm−1, and O-H stretching appeared at 3626 cm−1. Lastly, range 2326 cm−1 to 1921cm−1 is
attributable to nickel.
Fig. 8.
4.2. Characterization of TiO2 and Ni-TiO2: SEM analysis
The SEM technique was employed to analyze the surface texture of TiO2 and to determine that of the
photocatalyst prior to and following the PEC process. As Fig. 9a shows, the particles are uniformly
distributed, and they are not stuck together. According to Fig. 9 (b,c), Ni-TiO2 had a porous structure, and
the micropores had amorphous edges. However, the pores seen in Fig. 9 (d) are blocked, an observation
which shows the adsorption of the dye molecules on to the surface of Ni-TiO2 during PEC.
Fig. 9
4.3. Characterization of TiO2 and Ni-TiO2: TEM analysis
Fig. 10 shows the TEM images of the microspheres of undoped TiO2 (Fig. 10a) and also TiO2 doped with
0.2% Ni (Fig. 10b). These microspheres were formed by the aggregation of nanoparticles, ranging in size
from a few nanometers to several tens of nanometers. In Fig. 10a, there is no lattice distortion, and all
atoms are well-aligned in the lattice. However, it can be seen in Fig. 10b that Ni-TiO2 microspheres have
Page 15
14
a polycrystalline structure. This can be ascribed to the fact that the crystal ionic radius of Ti+4 is less than
that of Ni (0.068 nm in comparison with 0.069 nm). As a result, Ti+4 could enter the Ni lattice during
synthesis, and this induces a great deal of lattice distortions and plenty of defects on the Ni-TiO2 surface.
Fig. 10.
4.4. Characterization of TiO2 and Ni-TiO2: XRD and EDX analyses
XRD measurements were carried out in the range of 2(θ) = 10-80◦ to investigate the changes in the crystal
structure of TiO2 due to Ni doping. As is clear in Fig.11 (a), the major peaks detected for the modified Ni-
TiO2 and unmodified TiO2 samples were found to be the same, with the only difference being that the Ni-
TiO2 sample had peaks with significantly low intensities. Another observation was peak broadening,
which could be pertinent to grain refinement caused by doping. Indeed, part of Ni penetrated into TiO2,
and Ni ions were distributed uniformly in the interstices of semiconductor crystalline structure. Lastly, no
mixed phase was detected between Ni and Oxygen. This can be due to the low loading (2%) of nickel.
Further, EDX analysis was performed to study the elemental composition of Ni-TiO2 nanoparticles. The
intense peaks observed in Fig. 11b are associated with Ti, O, and Ni atoms. These peaks confirm the
composition of elements in the experiment.
Fig. 11.
4.5. Analysis of BET surface area
Given the fact that the BET surface area of the catalyst is the most important factor influencing the
catalytic activity, a comparison was drawn between the surface area of pure TiO2 and that of Ni-TiO2
using the nitrogen gas adsorption method. The results are given in Table 2. It can be seen that with an
Page 16
15
increase in the nickel content doped onto TiO2, the BET surface area decreases. This decrease may be
ascribed to blocking of micropores on the TiO2 surface by the nickel particles.
Table 2:
4.6. GC-MS analysis
To identify the intermediate products formed during the PEC treatment of RR 120 and AO 2, GC-MS
analysis was performed. The results for the main intermediates detected are presented in Table 3 (RR
120) and Table 4 (AO 2). From these results, a pathway can be proposed for the degradation of the dyes
(Scheme 1 and Scheme 2).
Table 3:
Table 4:
Scheme 1.
Scheme 2.
To explain the process for RR 120, the radical hydroxyl attacked the carbon atom bearing the dye
leakage, leading to cleavage of the C–N bond and the generation of 2-Aminobenzenesulfonic acid (m/z
27), Benzene (m/z 173), and 3-Amino-5 [(4-amino-6-chloro-1,3,5-triazin-2-yl)amino]-4-
hydroxynaphathalene -2-sulfonic acid methanethiol (m/z 465), The main transformation products were 3-
Amino-4-hydroxynaphthalene-2-7-disulfonic acid (m/z 320), 6-chloro-1,3,5-triazine-2,4-diamine(m/z
146), and 2-Naphthalenol (m/z 144). If the PEC process continues, these organic compounds will change
into CO2 and H2O. A similar process occurred in the case of AO 2.
4.7. Cost analysis
Page 17
16
Cost analysis was performed for the PEC process. For this, the costs of electrical energy, UV irradiation,
photocatalyst, and electrolyte were considered as main cost items. The operating cost was calculated
through eq 10 below [46].
Operating cost (USD/m3) = aCenergy + bCphotocatalyst + cCelectrolyte (10)
where Cenergy is the energy consumed for UV irradiation and electrode operation (kWh/m3), Cphotocatalyst is
the amount of photocatalyst consumed (kg/m3), and Celectrolyte is the amount of electrolyte consumed
(kg/m3). The letters a, b, and c are unit prices for the Iranian market in June 2012, as follows: (a) electrical
energy price: 0.042 USD/kWh, (b) photocatalyst Ni-TiO2 price 220 USD/kg, and (c) electrolyte NaCl
price 5.70 USD/kg. The cost of electrical energy (kWh/m3) was calculated from eq 2. In the present
research, treating 1 m3 of the colored solution under the optimum conditions obtained from the earlier
runs of the experiment consumed 4 kWh/m3 of energy, 0.6 kg/m3 of photocatalyst, and 5 mg L-1 of NaCl.
With these data, the operating cost was calculated to be 9.42 USD/m3. However, it should be noted that
we paid no money for the electrical energy consumed during the treatment since this energy was supplied
by solar cells. This means 17 % off the total costs.
5. Conclusion
This research treated aqueous solutions containing a reactive dye (Reactive Red 120) and an azo dye
(Acid Orange 2), using PEC with Ni-TiO2 as the photocatalyst applied in suspension. The purpose was to
optimize a number of operating parameters, which were photocatalyst dose, dye concentration, pH, bias
potential, and supporting electrolyte. The optimal conditions turned out to be the same for both dyes. The
first observation was 0.6 mg L-1 of nanocomposite dose. As for the impact of initial dye concentration, a
value of 50 mg L-1 was found to cause maximum removal despite the fact that the rate of removal
decreased at higher concentrations. It was also observed that a pH value of 7 and a bias potential of 1.6 V
led to the highest efficiency of dye degradation. It was also seen that the highest degree of removal was
achieved when 5 mgL-1 of NaCl was used. To judge the efficiency of the treatment, the solutions were
Page 18
17
subjected to the COD test under the obtained optimum operating conditions. Substantial reduction was
observed in the COD values. Cost analysis was also done for the treatment process, considering the costs
of electrical energy, UV irradiation, photocatalyst, and electrolyte as main cost items. Further, as the
energy required by the experiment was supplied by solar cells, the money that would have otherwise been
spent on electricity was saved. Also, the efficiency of the photocatalyst was studied using SEM, TEM,
XRD, EDX, and FT-IR techniques. Lastly, the post-treatment product was characterized using the GC-
MS technique. Intermediate compounds were identified, and pathways were proposed for the removal of
the dyes.
References
[1] Z. Aksu, I.A. Tatli, O. Tunc, A comparative adsorption/ biosorption study of Acid Blue 161: effect of
temperature on equilibrium and kinetic parameters, J. Chem. Eng. 142 (2008) 23–39.
[2] Y. Mu, K. Rabaey, R.A. Rozendal, Z. Yuan, J. Keller, Decolorization of azo dyes in
bioelectrochemical systems, Environ. Sci. Technol. 43 (2009) 5137–5143.
[3] W.T. Tsai, C.Y. Chang, M.C. Lin, S.F. Chien, H.F. Sun, M.F. Hsieh, Adsorption of acid dye onto
activated carbons prepared from agricultural waste bagasse by ZnCl2 activation, Chemosphere. 45 (2001)
51–58.
[4] K.G. Bhattacharyya, A. Sharma, Kinetics and thermodynamics of methylene blue adsorption on Neem
(Azadirachta indica) leaf powder, Dyes Pigments. 65 (2005) 51–59.
[5] A. Pirkarami, M.E. Olya, N. Yousefi Limaee. Decoloration of azo dyes by photo electro adsorption
process using polyaniline coated electrode. Prog. Org. Coat. 2003, 76, 682–688.
[6] Y.L. Su, S. Han, X.W. Zhang, X.Q. Chen, L.C. Lei, Preparation and visible-light-driven
photoelectrocatalytic properties of boron-doped TiO2 nanotubes, Mater. Chem. Phys. 110 (2008) 239–
246.
Page 19
18
[7] X. Wang, H.M. Zhao, X. Quan, Y.Z. Zhao, S. Chen, Visible light photoelectrocataly- siswithsalicylic
acid-modified TiO2 nanotube array electrode for p-n it ro phenol degradation, J. Hazard. Mater. 166
(2009) 547–552.
[8] T. Tachikawa, M. Fujitsuka, T. Majima, Mechanistic insight into the TiO2 photocatalytic reactions:
Design of new photocatalysts, J. Phys. Chem. C 111 (2007) 5259–5275.
[9] N. Chandrasekaran, P.V. Kamat, Improving the photoelectrochemical performance of manostructured
TiO2 films by adsorption of gold nanoparticles, J. Phys. Chem. B 104 (2000) 10851–10857.
[10] S. Yae, M. Kitagaki, T. Hagihara, Y. Miyoshi, H. Matsuda, A.B. Parkinson, Y. Nakato,
Electrochemical deposition of fine Pt particles on n-Si electrodes for efficient photoelectrochemical solar
cells, Electrochem. Acta 47 (2001) 345–352.
[11] T. Okato, T. Sakano, M. Obara, Suppression of photocatalytic efficiency in highly N-doped anatase
films, Phys. Rev. B: Condens. Matter. Mater. Phys. 72 (2005) 115124/1–115124/6.
[12] J.I. Li, L.U. Li, L. Zheng, Y.U. Xian, L. Jin, Photoelectrocatalytic degradation of rhodamine B using
Ti/TiO2 electrode prepared by laser calcination method, Electrochem. Acta. 51 (2006) 4942–4949.
[13] A. Manivel, S. Naveenraj, P. S. Sathish Kumar, S. Anandan. CuO-TiO2 Nanocatalyst for
Photodegradation of Acid Red 88 in Aqueous Solution, Ameri. Scien. Publi. 2 (2010) 51–57.
[14] K. Tanaka, K.S.N. Reddy, Pho to degradation of phenoxyaceticacid and carba- mate
pesticidesonTiO2, Appl. Catal. B 39 (2002) 305–310.
[15] R.Zhang, L.Gao, Q.H.Zhang, Photodegradation of surfactants on the nano sized TiO2 prepared by
hydrolysis of the alkoxidetitanium, Chemosphere. 54 (2004) 405–411.
[16] A. Kaur, U. Gupta, Areview on applications of nanoparticles for the preconcen- tration of
environmental pollutants, J. Mater.Chem. 19 (2009) 8279–8289.
Page 20
19
[17] B.B. Yu, J.B. Zeng, L.F. Gong, M.S. Zhang, L.M. Zhang, X. Chen, Investigation of the
photocatalytic degradation for ganochlorin epesticidesonanano-TiO2 coated film, Talanta. 72 (2007)
1667–1674.
[18] D.B. Dong, P.J. Li, X.J. Li, C.B. Xu, D.W. Gong, Y.Q. Zhang, Q. Zhao, P. Li, Pho- to catalytic
degradation of phenanthrene and pyrene on soil surfaces in the presence of nano meterrutileTiO2 under
UV-irradiation, J. Chem. Eng. 158 (2010) 378–383.
[19] W.Y. Wang, M.L. Yang, Y. Ku, Photoelectrocatalytic decomposition of dye in aqueous solution
using Nafion asan electrolyte, J. Chem. Eng. 165 (2010) 273–280.
[20] K. Esquivel, M. G. Garcia, F. J. Rodriguez, M. Vega Gonzalez , L. Escobar Alarcon, L.O.rtiz-Frade,
L. A. Godı´nez, Titanium dioxide doped with transition metals (MxTi1-xO2,M: Ni, Co), J. Nanopart Res. 8
(2011) 3313-3325.
[21] G.M. Liu, X.Z. Li, J.C. Zhao, H. Hiadaka, N. Serpone, Photooxidation pathway of sulforhodamine-B
dependence on the adsorption mode on TiO2 exposed to visible light radiation, Environ. Sci. Technol. 34
(2000) 3982–3990.
[22] S.J. Jiao, S.R. Zheng, D.Q. Yin, L.H. Wang, L.Y. Chen, Aqueous photolysis of tetracycline and
toxicity of photolytic products to luminescent bacteria, Chemosphere. 73 (2008) 377–382.
[23] Y. Liu, X. Gan, B. Zhou, Photoelectrocatalytic degradation of tetracycline by highly effective TiO2
nanopore arrays electrode, J. Hazar. Mater. 171 (2009) 678–683.
[24] D.K. Lee, I.C. Cho, Characterization of TiO2 thin film immobilized on glass tube and its application
to PCE photocatalytic destruction, J. Microchem. 68 (2001) 215–223.
[25] P.S. Marcos, J. Marto, Screen-printing of TiO2 photocatalytic layers on glazed ceramic tiles, J.
Photochem. Photobiol. A 197 (2008) 125–131.
Page 21
20
[26] M. Pourmanda, N. Taghavinia,TiO2 nanostructured films on mi causing liquid phase deposition,
Mater. Chem. Phys. 107 (2008) 449–455.
[27] R.S. Sonawane, B.B .Kale, M.K. Dongare, Preparationphoto-catalyticactivity of Fe–TiO2 thin films
prepared by sol–gel dipcoating, Mater. Chem. Phys. 85 (2004) 52–57.
[28] X.W.Zhang, M.H. Zhou, L.C. Lei, Co-deposition of photocatalytic Fe doped TiO2 coatings by
MOCVD, Catal, Commun.7 (2006) 427–431.
[29] P. Sathishkumar, S. Anandan, P. Maruthamuthu, T. Swaminathan, M. Zhou, M. Ashokkumar.
Synthesis of Fe3+ doped TiO2 photocatalysts for the visible assisted degradation of an azo dye,
Physicochem. Eng. Aspects. 375 (2011) 231–236.
[30] M.R. Mohammadi, D.J. Fray, M.C. Cordero-Cabrera. Sensor performance of nanostructured TiO2
thin films derived from particulate sol–gel route and polymeric fugitive agents. Sensor Actuat B-Chem.
124 (2007) 74–83.
[31] K. Pan, Q. Zhang, Q. Wang, Z. Liu, D. Wang, J. Li, Y. Bai. The photoelectrochemical properties of
dye-sensitized solar cells made with TiO2 nanoribbons and nanorods. Thin Solid Films 515 (2007) 4085–
4091.
[32] M.S.T. Goncalves, A.M.F. Campus, E.M.S. Pinto, P.M.S. Plesnica, M.J.R. Queiroz, Photochemical
treatment of solution of azo dyes containing TiO2, Chemosphere. 39 (1999) 781–786.
[33] A.K. Subramini, K. Byrappa, S. Ananda, K.M. L. Rai, C. Ragnathaiall, M. Yoshimura,
Photocatalytic degradation of indigocaramine dye using TiO2 impregnited activated carbon, Bull. Mater.
Sci. 30 (2007) 37–41.
Page 22
21
[34] M. Arami, N.Y. Livnaer, N.M. Mahamodi, N.S. Tabrizi, Removal of dyes from colourful textile
wastewater by orange pell adsorbent: equation and kinetics studies, J. Colloid Interface Sci. 288 (2005)
371–376.
[35] C. Namasivayam, S. Sumithra, Removal of direct red 12B and methylene blue from water by
adsorption onto Fe (III)/Cr (III) hydroxide, An industrial solid waste, J. Environ. Manage. 74 (2005) 207–
215.
[36] M. Arami, N.Y. Limaee, N.M. Mahmoodi, N.S. Tabrizi, Equilibrium and kinetics studies for the
adsorption of direct and acid of dyes from aqueous solution soya meal hull, J. Hazard. Mater. B. 135
(2006) 171–179.
[37] T. C. An, W. B. Zhang, X. M. Xiao, G.Y. Sheng, J. M. Fu, X. H. Zhu, Photoelectrocatalytic
degradation of quinoline with a novel three-dimensional electrode-packed bed photocatalytic reactor. J.
Photochem. Photobiol, A: Chem. 161 (2004), 233-242.
[38] N. Shimizu, C. Ogino, M.F. Dadjour, T. Murata, Sonocatalytic degradation of Methylene blue with
TiO2 pellets in water, Ultrason. Sonochem. 14 (2007) 184–190.
[39] Y.Liu, X. Gan, B. Zhou, B.Xiong, J.Li, C. Dong, J.Bai,W.Cai. Photoelectrocatalytic degradation of
tetracycline by highly effective TiO2 nanopore arrays electrode. Journal of Hazardous Materials 171
(2009) 678–683
[40] M.E. Olya, A. Pirkarami, M. Soleimani, M. Bahmaei. Photoelectrocatalytic degradation of acid dye using
NieTiO2 with the energy supplied by solar cell: Mechanism and economical studies. J Environ Manage. 121
(2013) 210-219.
[41] J. Shang, Y. Zhang, T. Zhu, Q.Wang, H. Song, The promoted photoelectrocatalytic degradation of
rhodamine B over TiO2 thin film under the half-wave pulsed direct current A: Catalysis B: Environmental
102 (2011), 464–469.
Page 23
22
[42] M. Valnice, B. Zanoni, J. Sene, A. Anderson, Photoelectrocatalytic degradation of Remazol
Brilliant Orange 3R on titanium dioxide thin-film electrodes, J. Photochem. Photobio. A: Chem. 157
(2003) 55–63.
[43] F. Akbal, S. Camc, Copper, chromium and nickel removal from metal plating wastewater
by electrocoagulation, Desalination. 269 (2011) 214–222.
[44] C.A. M. Huitle, E. Brillas, Decontamination of wastewaters containing synthetic organic dyes by
electrochemical methods: a general review, App. Catal. B Environ. 87 (2009) 105–145.
[45] B. N. Patil, D.B. Naik, V.S. Shrivastava. Photocatalytic degradation of hazardous Ponceau-S dye
from industrial wastewater, Desalination. 269 (2011) 276–283.
[46] M. Kobya, S. Delipinar, Treatment of the baker’s yeast wastewater by electrocoagulation, J. Hazard.
Mater. 154 (2008) 1133–1140.
Page 24
23
Figures
Fig. 1. Schematic representation of the side view of the PEC reactor
Page 25
24
Fig. 2. Effect of photocatalyst (Ni-TiO2) dose on the degradation of RR 120 and AO 2 (contact time: 30
min, dye concentration: 50 mg L-1, pH: 7, bias potential: 1.6 V, electrolyte concentration: 5 mg L-1)
Page 26
25
Fig. 3. Effect of initial dye concentration on the degradation of RR 120 and AO 2 (contact time: 30 min.,
photocatalyst dose: 0.6 mg L-1, pH: 7, bias potential: 1.6 V, electrolyte concentration: 5 mg L-1)
Page 27
26
Fig. 4. Effect of initial pH value on the degradation of RR 120 and AO 2 (contact time: 30 min.,
photocatalyst dose: 0.6 mg L-1, dye concentration: 50 mg L-1, bias potential: 1.6 V, electrolyte
concentration: 5 mg L-1)
Page 28
27
Fig. 5. (a) Effect of bias potential on the degradation of RR 120 and AO 2 (contact time: 30 min.,
photocatalyst dose: 0.6 mg L-1, dye concentration: 50 mg L-1, pH: 7, electrolyte concentration: 5 mg L-1)
and (b) the associated mechanism
Page 29
28
Fig. 6. Effect of electrolyte concentration on the degradation of RR 120 and AO 2(contact time: 30 min,
photocatalyst dose: 0.6 mg L-1, dye concentration: 50 mg L-1, pH: 7, bias potential: 1.6 V)
Page 30
29
Fig. 7. COD removal in the dye solutions under optimum PEC conditions
Page 31
30
Fig. 8. FT-IR spectra of (a) TiO2 and (b) of Ni-TiO2
Page 32
31
Fig. 9. SEM micrographs of (a) original TiO2, (b) original Ni-TiO2, (c) enlargement of selected area in
(b), and (d) Ni-TiO2 colored by a combination of the two dyes
Page 33
32
Fig. 10. TEM micrographs of (a) TiO2 and (b) Ni-TiO2
Page 34
33
Fig. 11. (a) XRD spectra of TiO2 (ii) and Ni-TiO2 (i); (b) EDX spectra of Ni-TiO2
Page 35
34
Scheme 1. Proposed pathway of RR 120 degradation under PEC
Page 36
35
Scheme 2. Proposed pathway of AO 2 degradation under PEC
Page 37
36
Tables
Table 1. Specifications of the solar cell
Type Polycrystal Maximum Power 45 W Maximum Voltage 16.5 V Maximum Current 2.8 A Dimensions 947×460 mm2 Price $ 40
Table 2: BET surface area of pure and nickel-doped TiO2
Catalyst Ni weight (%) BET surface area (m2/g)
TiO2
Ni-TiO2
0.0 2.0
22.04 13.11
Table 3: Intermediate products generated during the PEC treatment of RR 120 and identified by GC-MS
Name of metabolites Retention time (min)
#
2-Aminobenzenesulfonic acid 22.77 1 Benzene 17.34 2 3-Amino-5[(4-amino-6-chloro-1,3,5-triazin-2-yl)amino]-4- hydroxynaphathalene-2-sulfonic acid methanethiol 1:1
22.85 3
Phenol 21.11 4 1,4-Benzoquinone 28.44 5 6-chloro-1,3,5-triazine-2,4-diamine 22.03 6 3-Amino-4-hydroxynaphthalene-2-7-disulfonic acid 23.77 7 2-Naphthalenol 20.47 8 1,2-Naphthalenediol 25.95 9 1,2-Naphthalenedione 28.76 10 2-1-Benzopyran 22.08 11
Page 38
37
Table 4: : Intermediate products generated during the PEC treatment of AO 2 and identified by GC-MS
Name of metabolites Retention time (min) #
Phenol 21.02 1 1,2-Naphthalenediol 24.71 2 2-Aminobenzenesulfonic acid 22.77 3 Phthalic anhydride 18.95 4 Phthalic acid, dimethyl ester 20.44 5 4-Hydroxy-phthalicacid 27.97 6
Phthalic anhydride 20.05 12 Phthalic acid 20.05 13