Page 1
COST-EFFECTIVENESS ANALYSIS OF A PROSPECTIVE BREAST
CANCER SCREENING PROGRAM IN TURKEY
A THESIS SUBMITTED TO THE GRADUATE SCHOOL OF SOCIAL SCIENCES
OF MIDDLE EAST TECHNICAL UNIVERSITY
BY
ENGİN ASTIM
IN PARTIAL FULFILLMENT OF THE REQUIREMENTS FOR
THE DEGREE OF MASTER OF SCIENCE IN ECONOMICS IN
THE DEPARTMENT OF ECONOMICS
JANUARY 2011
Page 2
Approval of the Graduate School of Social Sciences
Prof. Dr. Meliha Altunışık
Director I certify that this thesis satisfies all the requirements as a thesis for the degree of Master of Science
Prof. Dr. Erdal Özmen Head of Department
This is to certify that we have read this thesis and that in our opinion it is fully adequate, in scope and quality, as a thesis for the degree of Master of Science.
Assoc. Prof. Dr. H. Hakan Yılmaz Assoc. Prof. Dr. Ebru Voyvoda Co-Supervisor Supervisor
Examining Committee Members Assoc. Prof. Dr. Ebru Voyvoda (METU, ECON)
Assoc. Prof. Dr. H. Hakan Yılmaz (AU, PF )
Assoc. Prof. Dr. Nuray Yazıhan (AU, MF)
Assoc. Prof. Dr. Şirin Saraçoğlu (METU, ECON)
Assoc. Prof. Dr. Murat Kırdar (METU, ECON)
Page 3
iii
PLAGIARISM
I hereby declare that all information in this document has been obtained and
presented in accordance with academic rules and ethical conduct. I also declare
that, as required by these rules and conduct, I have fully cited and referenced
all material and results that are not original to this work.
Name, Last name:
Signature :
Page 4
iv
ABSTRACT
COST-EFFECTIVENESS ANALYSIS OF A PROSPECTIVE BREAST CANCER SCREENING PROGRAM IN TURKEY
Astım, Engin M.S., Department of Economics Supervisor : Asst. Prof. Dr. Ebru Voyvoda Co-Supervisor: Assoc. Prof. Dr. H. Hakan Yılmaz
January 2010, 108 pages Cancer is the second leading cause of death among the world and it has an increasing share among all causes of death. Economical burden of cancer is increasing especially in high and middle-income countries. Leaving cancer in competitive markets would lead to inefficiencies; hence governments should intervene in the market and make public decisions in struggling cancer. Among all cancer types breast cancer has the highest incidence and mortality rates in females. Causes of breast cancer still remains indeterminate and only way to cope with breast cancer are by early diagnoses. Early diagnoses can best be achieved by regular mammography screenings. This study analyzes the possible outcomes of implementing regular breast cancer mammography screening program in Turkey. A simulation model is constructed and run for 10 years, to obtain the costs and benefits of such a screening program. Costs of such a program include the screening costs and costs due to abnormal mammograms. Benefits, on the other hand are reduced treatment costs due to early diagnosis, reduced mortality and morbidity. Simulation model is run for 11 different screening strategies for determining the optimal screening strategy in terms of screening interval and minimum age to screen. The necessary data is obtained from hospital records, Cancer Early Diagnosis and Treatment Center records, IMF, WHO and TUIK databases and literature. Results of the simulation suggest that women over 40 in Turkey should be screened biennially for economical efficiency. Keywords: Breast cancer screening, mammography, cost-effectiveness
Page 5
v
ÖZ
TÜRKİYE’DE UYGULANACAK OLASI BİR MEME KANSERİ TARAMA PROGRAMININ MALİYET-ETKİNLİK ANALİZİ
Astım, Engin Yüksek Lisans., Ekonomi Bölümü Tez Danışmanı : Yrd. Doç. Dr. Ebru Voyvoda Yardımcı Danışman: Doç. Dr. Hakkı Hakan Yılmaz
Ocak 2010, 108 sayfa Kanser dünyada ölüm nedenleri arasında ikinci önde gelen nedendir ve tüm ölüm nedenleri arasında giderek artan bir paya sahiptir. Kanserin ekonomik yükü özellikle yüksek ve orta gelirli ülkelerde giderek artmaktadır. Kanseri rekabetçi piyasalara bırakmak ekonomik verimsizliğe yol açabilir, dolayısıyla hükümetlerin kanser piyasasına müdahale etmeleri ve kanserle mücadele için kamu politikaları sunmaları gerekir. Tüm kanser türleri arasında meme kanseri kadınlarda en yüksek insidans ve mortalite oranlarına sahiptir. Meme kanserinin nedenleri bilinmemektedir ve meme kanseri ile başa çıkmanın tek yolu erken tanıdır. Erken tanı en iyi düzenli mamografi taramaları ile elde edilebilir. Bu çalışmada, Türkiye'de düzenli olarak mamografi tarama programı uygulanmasının olası sonuçları analiz edilmiştir. Bu bağlamda olası bir tarama programının fayda-maliyet analizini yapabilmek için bir simülasyon modeli inşa edilmiş ve 10 yıllık bir sure için çalıştırılmıştır. Maliyetler tarama masrafları ve anormal mamogram maliyetlerinden oluşur. Faydalar ise, azalan tedavi maliyetleri ile azalan mortalite ve morbiditeyi içerir. Simülasyon modeli tarama aralığı ve taranacak minimum yaşı belirlemek için 11 farklı tarama stratejisi için çalıştırılmıştır. Gerekli veriler hastane kayıtlarından, Kanser Erken Teşhis ve Tedavi Merkezleri kayıtlarından, IMF, DSÖ ve TÜİK veritabanları ve literatürden alınmıştır. Simülasyon sonuçları, Türkiye'de 40 yaşın üzerindeki kadınların iki yılda bir taranmasının ekonomik açıdan etkin sonuç olduğunu göstermektedir. Anahtar kelimeler: Meme kanseri tarama programı, mamografi, maliyet-fayda
Page 6
vi
DEDICATION
To My Wife
Page 7
vii
ACKNOWLEDGMENTS
Firstly, I would like to express my deepest gratitude to my co-supervisor Assoc.
Prof. Dr. Hakkı Hakan Yılmaz for his guidance, advice, criticism,
encouragements, patience and insight throughout the study.
I am also grateful to Assoc. Prof. Dr. Nuray Yazıhan for her guidance and advice
about medical issues, and help in obtaining the necessary data for the study.
I would also like to thank to my thesis examining committee members, Asst.
Prof. Dr. Ebru Voyvoda, Asst. Prof. Dr. Şirin Saraçoğlu, and Asst. Prof. Dr. Murat
Kırdar for their suggestions and comments.
This study was financed by TUBITAK (The Scientific and Technological Research
Council of Turkey), National Scholarship Program no.2210.
Lastly, I offer my endless gratitude to my wife for her endless support, patience
and encouragement.
Page 8
viii
TABLE OF CONTENTS
PLAGIARISM ................................................................................................................. İİİ
ABSTRACT ..................................................................................................................... İV
ÖZ ...................................................................................................................................... V
DEDICATION ................................................................................................................ Vİ
ACKNOWLEDGMENTS ............................................................................................. Vİİ
TABLE OF CONTENTS ............................................................................................. Vİİİ
LIST OF TABLES ............................................................................................................ Xİ
LIST OF FIGURES ........................................................................................................Xİİİ
CHAPTER
1 INTRODUCTION .................................................................................................... 1
2 BURDEN OF BREAST CANCER ........................................................................... 8
3 SCREENING FOR BREAST CANCER ................................................................ 11
3.1 RANDOMIZED TRIALS ...................................................................................... 12
4 LITERATURE ON COST-EFFECTIVENESS OF BREAST CANCER
SCREENING ................................................................................................................... 14
5 COST EFFECTIVENESS ANALYSIS MODEL FOR TURKEY ......................... 23
5.1 AIM ................................................................................................................... 23
5.2 MODEL .............................................................................................................. 24
5.3 DATA ................................................................................................................ 30
5.3.1 Estimation of Target Population ................................................................... 30
5.3.2 Probability of Breast Cancer ......................................................................... 32
Page 9
ix
5.3.3 Stage at Diagnosis ........................................................................................ 36
5.3.4 Cost of Screening .......................................................................................... 39
5.3.5 Cost of Treatment .......................................................................................... 40
5.3.6 Screening Interval ......................................................................................... 42
5.3.7 False Positive Results .................................................................................... 44
5.3.8 Intangible Costs ............................................................................................ 45
5.3.9 Survival Rates ............................................................................................... 52
5.3.10 Simulation Length .................................................................................... 54
5.4 RESULTS ............................................................................................................ 55
6 CONCLUSION AND DISCUSSION ................................................................... 63
BIBLIOGRAPGY ............................................................................................................ 69
APPENDIX A: DETAILED RESULTS OF SIMULATION RUNS ........................... 76
A.1 NO SCREENING ..................................................................................................... 76
A.2 ANNUAL SCREENING WOMEN OVER 40 .............................................................. 78
A.3 ANNUAL SCREENING WOMEN OVER 45 ............................................................. 80
A.4 ANNUAL SCREENING WOMEN OVER 50 ............................................................. 82
A.5 ANNUAL SCREENING WOMEN OVER 55 ............................................................. 84
A.6 ANNUAL SCREENING WOMEN OVER 60 ............................................................. 86
A.7 BIENNIAL SCREENING WOMEN OVER 40 ............................................................. 88
A.8 BIENNIAL SCREENING WOMEN OVER 45 ............................................................ 90
A.9 BIENNIAL SCREENING WOMEN OVER 50 ............................................................ 92
A.10 BIENNIAL SCREENING WOMEN OVER 55 .......................................................... 94
A.11 BIENNIAL SCREENING WOMEN OVER 60 .......................................................... 96
APPENDIX B: SIMAN CODE OF THE SIMULATION MODEL ............................ 98
B.1 BLOCKS ................................................................................................................... 98
Page 10
x
B.2 VARIABLES ........................................................................................................... 101
Page 11
xi
LIST OF TABLES
Table 1: Estimated Total Direct Costs of Breast Cancer .............................................. 9
Table 2: Estimated Total Indirect Cost of Breast Cancer .......................................... 10
Table 3: Costs for Breast Cancer by Stage ................................................................... 10
Table 4: Randomized Trials .......................................................................................... 12
Table 5: Female Population in Turkey ........................................................................ 31
Table 6: Mortality Rates Excluding Breast Cancer .................................................... 32
Table 7: Breast Cancer Incidence Rates Estimated by Ministry of Health ............. 33
Table 8: Breast Cancer Incidence Rates Estimated Using Survey Results ............. 34
Table 9: Breast Cancer Incidences Rates by Age Group ........................................... 35
Table 10: Relative Frequency of Breast Cancer for Age Groups ............................. 36
Table 11: Breast Cancer Stage Distributions in Screened Women in Detail .......... 37
Table 12: Breast Cancer Stage Distributions in Screened Women .......................... 37
Table 13: Breast Cancer Stage Distributions in Clinically Diagnosed Women ..... 38
Table 14: Screening Cost ............................................................................................... 39
Table 15: Distribution of Screening Costs ................................................................... 40
Table 16: Breast Cancer Treatment Costs .................................................................... 42
Table 17: Annual vs. Biennial Screening Odds Ratios .............................................. 43
Table 18: Annual vs. Biennial Screening Odds Ratios in Following Screenings ... 44
Table 19: False Positive Ratios for Mammography Screening ................................. 45
Table 20: EQ-5D QALY Calculation Examples .......................................................... 47
Table 21: QALY Lost According to Stage at Diagnosis ............................................. 48
Table 22: GDP and GDP per Working Population in 98 prices ............................... 49
Table 23: GDP per Working Capita Estimations ....................................................... 50
Table 24: Employment Rates of Women ..................................................................... 50
Table 25: Employment Rate Estimations .................................................................... 51
Page 12
xii
Table 26: 5-Year Survival Rates .................................................................................... 52
Table 27: Mortality Probabilities by Stage at Diagnosis ........................................... 54
Table 28: Simulation Length ......................................................................................... 55
Table 29: Estimated Women Population over 30 ....................................................... 56
Table 30: Early Diagnosis Ratio with respect to Screening Strategy ....................... 57
Table 31: Death and QALY Burden by Screening Strategy (thousand) ................. 58
Table 32: Estimated Number of False Positives ......................................................... 59
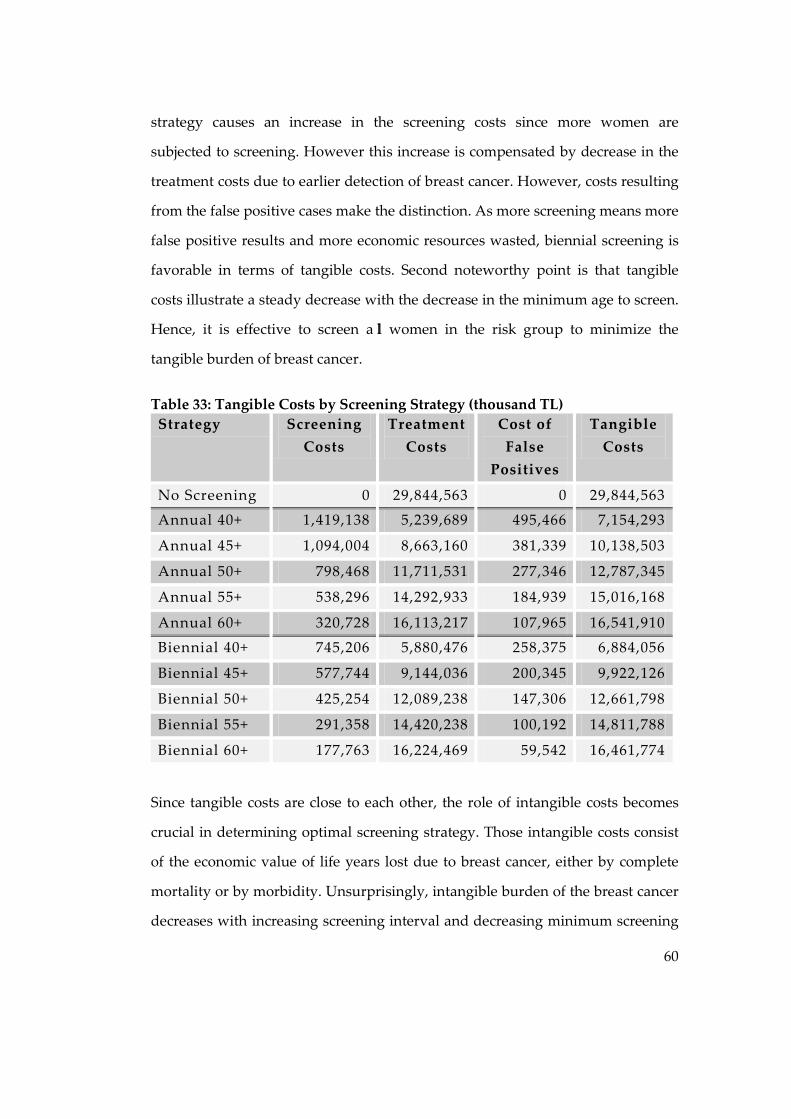
Table 33: Tangible Costs by Screening Strategy (thousand TL) .............................. 60
Table 34: Intangible Costs by Screening Strategy (thousand TL) ............................ 61
Table 35: Total Costs by Screening Strategy (thousand TL) ..................................... 62
Page 13
xiii
LIST OF FIGURES
Figure 1: Deaths by Cause –World, 2004 ...................................................................... 1
Figure 2: Death by Cause - 2002, Turkey ...................................................................... 2
Figure 3: Cancer Incidence Rates - Turkey ................................................................... 3
Figure 4: Deaths by Cancer Type - World, 2004 .......................................................... 4
Figure 5: Incidence and Mortality Rates in Females by Cancer Type - Income
groups, 2002 (per 100,000) ............................................................................................... 5
Figure 6: Modeling used by Rojnik et al. .................................................................... 16
Figure 7: Modeling used by Ohnuki et al. .................................................................. 18
Figure 8: Modeling used by Wong et al ...................................................................... 19
Figure 9: Sub-Model Screening .................................................................................... 27
Figure 10: Sub-Model Treatment ................................................................................. 29
Figure 11: 10 Year Survival Rates ................................................................................ 53
Page 14
1
1 INTRODUCTION
In medical terms cancer can basically be defined as an abnormal growth of cells
which tend to reproduce in an uncontrolled way and, in some cases, to
metastasize (spread) (http://en.wikipedia.org, 2010). In economical terms, on the
other hand, it can be described a s one of the biggest and to be ta ckled in first
place economical troubles that causes huge amount of economical resources to be
wasted, which include both medical care costs that spent in treatment and
rehabilitation processes of those who have cancer, and the labor force loss.
According to statistical data collected by world health organization from the
member countries, worlds leading causes for death are cardiovascular disease,
infectious and parasitic disease and then malignant neoplasm, i.e. cancer,
respectively. (Figure 1)
Figure 1: Deaths by Cause –World, 2004, WHO, 2004
Page 15
2
The data suggest that there has been 7,424 thousand deaths occurred due to
cancer by the year 2004. This corresponds to the fact that 13 of every 100 people
died due to cancer in 2004.
Analyzing death reasons for Turkey brings out similar results. The Figure 2
illustrates that cancer is second leading cause of death for Turkey with 48.3
thousand deaths by the year 2002. (www.ketem.org, 2010) This corresponds to
the 11% of all occasions.
Figure 2: Death by Cause - 2002, Turkey www.ketem.org, 2010
Cancer early diagnosis, screening and treatment center in Turkey made a
research among 8 cities (Ankara, Antalya, Samsun, Erzurum, Trabzon, İzmir,
Edirne, Eskişehir) from different regions of Turkey corresponding to 20 % of all
population and kept records for cancer incidence rates since 1999. The Figure 3
below displays the development of cancer incidence rates from 1999 to 2005. It
illustrates that from 1999 to 2005 incidence rate increased steadily from 58.13 to
173.85 per 100.000 people. The increase is cancer incidence rate is drastic as it
Page 16
3
tripled in 6 years. This demonstrates that burden of cancer is increasing each year
making public authorities obligated to take action against it for overall wellness
of society.
Figure 3: Cancer Incidence Rates - Turkey www.ketem.org
The main types of cancer leading to overall cancer mortality among the world
each year are (WHO, 2004):
• lung (1.3 million deaths/year)
• stomach (803 000 deaths)
• colorectal (639 000 deaths)
• liver (610 000 deaths)
• breast (519 000 deaths)
Deaths caused by each cancer type according to gender are illustrated below in
Figure 4. The most frequent types of cancer worldwide (in order of the number of
global deaths) are:
• Among men - lung, stomach, liver, colorectal, oesophagus and prostate
• Among women - breast, lung, stomach, colorectal and cervical
Breast cancer is the top cancer in women worldwide and is increasing
particularly in developing countries where the majority of cases are diagnosed in
Page 17
4
late stages. It was estimated that 636,000 incident cases occurred in developed
countries and 514,000 in developing countries during 2002.
Figure 4: Deaths by Cancer Type - World, 2004 WHO, 2004
Breast cancer is also the most important cause of neoplastic deaths among
women; the estimated number of deaths in 2002 was 410,000 worldwide. The
number of deaths in 2004 is estimated as 519,000 by WHO for 2004. (Boyle, et al.,
2008)
Although breast cancer is thought to be a disease of the developed world, a
majority (69%) of all breast cancer deaths occurs in developing countries. Figure
5 illustrates the incidence and mortality rates in females by cancer type in income
groups.
Page 18
5
Figure 5: Incidence and Mortality Rates in Females by Cancer Type - Income groups, 2002 (per 100,000) (Boyle, et al., 2008)
Exact causes of breast cancer are not known. Even there are some certain risk
factors such as;
• Age
• Personal History
• Family History
• Genetic Alterations:
• Reproductive and Menstrual History
• Race
• Radiation therapy to chest
• DES (Diethylstilbestrol
• Obesity
• Alcohol.
• Oral contraceptives and hormonal replacement therapy
Page 19
6
when a woman develops breast cancer the physician examining her seldom
realizes the reasons behind cancer formation. Most of the risk factors of risk
factors, such as age, genetic alterations etc., are unavoidable. Therefore in order
to cope with breast cancer instead of fighting with risk factors, fighting with the
disease itself is necessary.
Breast cancer is a progressive disease and it needs some time before it gets
hazardous. It is separated into stages, by a specific method called TNM
classification, according to the progress it has made. TNM classified stages of
breast cancer are as follows;
• Stage 0
• Stage I
• Stage IIA
• Stage IIB
• Stage IIIA
• Stage IIIB
• Stage IIIC
• Stage IV
Staging is extremely important in breast cancer because many variables are
dependent on the stage that the disease is diagnosed. Once the disease is
diagnosed in early stages, survival rates of the patients and economical resources
spent on the treatment and rehabilitation processes will be lower. Moreover lack
of economical activity because of labor force lost and life quality lost due to
breast cancer will be lower in earlier diagnosed cases as well.
Diagnosing breast cancer in early stages can best be done by randomly checking
women who do not have clinical symptoms of breast cancer for a possible breast
cancer occasion, which is called screening. Breast cancer screening can be done
by clinical and self breast exams, mammography, genetic screening, ultrasound,
Page 20
7
and magnetic resonance imaging. The most widely used approach is the
mammography screening.
This study endeavors to analyze the possible economical effects of a population
based mammography screening program for Turkey. Once a population based
screening program is applied, the breast cancer incidences will be diagnosed in
earlier stages, and thus economical resources spent in the treatment and
rehabilitation processes will be lower as well as the economical activity lost due
to the disease. The burden of such a screening program, on the other hand, will
be cost of mammography screening and the further medical intervention costs
resulting from abnormal mammograms.
Besides seeking answer to the question, whether a population based screening
program would be cost-effective in terms of economical considerations, there are
two more issues that this study aims to discover. First, what should be the
minimum age for a woman to be included in the screening program, and second,
how often should a woman be subject to screening for economical efficiency.
Page 21
8
2 BURDEN OF BREAST CANCER
Breast cancer is the leading cause of death among all cancer types among women
and there have been 516,644 deaths occurred in 2004 (http://www.who.int, 2010).
Besides, future projections about the burden of breast cancer state that the
burden of the breast cancer in terms of incidence and mortality rates will be even
higher. It is predicted that the number of deaths due to breast cancer will increase
to 787,041 by the year 2030. (http://www.who.int, 2010) However, the burden of
breast cancer on the society is not limited to the mortality. There is also an
economical burden of the disease, resulting from treatment and rehabilitation
processes, and the lack of economical activity due to labor force lost.
David Radice et al. searched for the detailed burden of breast cancer in terms of
direct and indirect costs. (Radice, et al., 2003) The worldwide economic burden of
breast cancer in 2001 was projected to be in the range of $US300–400 billion
($US100–140 billion as direct costs). In the last decade, an overall $US500 billion
was spent to treat this deadly disease. Table 1 and Table 2 show the estimated
total and per-patient direct and indirect costs of stage III and IV breast cancer for
the year 1995 in the US (unpublished data, Decision Resources Inc.). Direct costs
are physician visiting costs, diagnostic costs, radiation therapy and drug costs,
surgery costs and the costs of home health care visits. The detailed cost
estimations for USA for stage III and IV breast cancer in 1995 are summarized in
Table 1.
Page 22
9
Table 1: Estimated Total Direct Costs of Breast Cancer
(Radice, et al., 2003)
Indirect costs for stage III and stage IV were estimated according to the 1995
Statistical Abstract of the United States and the International Monetary Fund.
Indirect costs for stage III breast cancer were estimated considering the 1995
incidence (16 500) multiplied by the expected workforce rate, which varies by age
cohort, and then multiplied by the actual workforce rate (15–25% depending on
age). The total number of days lost for the incident population has been
calculated by multiplying the non-workforce population by a total of 125 days (to
account for an expected half year of missed work). Assuming that those who are
kept out of the workforce by the disease are inactive for the entire year (250
days), the resulting number of lost days totals nearly 2 million. Combining this
figure with the number of missed days from work and the incident population
results in more than 2.7 million days of missed work.
Page 23
10
Table 2: Estimated Total Indirect Cost of Breast Cancer
(Radice, et al., 2003)
Table 3 below illustrates the initial, continuing and terminal care costs for breast
cancer patients tracked in USA with respect to diagnoses stage of their breast
cancer, age distribution and co morbidity rates. The figures show that all of the
initial, continuing and terminal care costs are highly related with the stage of the
breast cancer when the disease is diagnosed. Especially continuing care costs are
much higher in distant breast cancer, with respect to other stages. Costs of breast
cancer care are also dependent to age at diagnoses and co morbidity.
Table 3: Costs for Breast Cancer by Stage
(Radice, et al., 2003)
Page 24
11
3 SCREENING FOR BREAST CANCER
Breast cancer screening is a test applied to women known as breast cancer free in
order to achieve early diagnosis. The aim in screening is to diagnose the disease
in earlier stages and reduce mortality and disability rates as well as the treatment
costs. (http://en.wikipedia.org, 2010) The methods of screening are clinical and
self breast exams, mammography, genetic screening, ultrasound, and magnetic
resonance imaging. Breast exams include feeling the breast for abnormalities,
whereas mammography screening is taking regular mammograms. Ultrasound
and magnetic resonance imaging are not breast cancer screening methodologies;
instead they are supplementary tools for screening.
Unlike other cancer types, breast cancer is not a risk factor dependent disease.
There is no changeable environmental risk factor that is attached to breast cancer
probability. If it was so, controlling that risk factor would mean controlling breast
cancer. For instance, lung cancer burden can be controlled by controlling the
tobacco usage since it is the main risk factor of lung cancer. Similarly, stomach
cancer can be averted by controlling the diet. However, there is no such risk
factor behind breast cancer that is controlling it would mean controlling breast
cancer. Breast cancer mortality and burden of breast cancer can be controlled not
by controlling incidence rate; instead it can be controlled by early diagnosis and
early diagnosis can only be possible by screening. Breast cancer screening is
effective because breast cancer is a slowly developing progressive disease. By
regular screenings it is possible to detect the disease in early stages.
Effects of breast cancer screening in mortality reductions are tested in some
randomized trials in different countries. Outcomes of these trials are discussed
below.
Page 25
12
3.1 Randomized Trials
In order to reliably estimate the effectiveness of screening around the world there
has been made large randomized clinical trials involving approximately 650,000
women in North America and Europe namely; Canada1980; Edinburgh 1978;
Göteborg 1982;Malmö 1976; New York 1963; Stockholm 1981 and Two-County
1977. Women without previously diagnosed breast cancer are subjected to these
randomized trials. They are separated into two groups; one is the experiment
group a nd the other is the control group. W omen in experiment group were
exposed to screening with mammography with the interval of one or two years,
whereas the women in control group were not examined by mammography
screening. Both women in two groups are followed by 13 to 20 years. The time
horizon that the women are followed in each trial and applied screening
methodology is given in Table 4.
Table 4: Randomized Trials
Trial Year Age Screening Interval Participation
Time Horizon
Canada 1980 40-59 1 year 50,430 13 year
Edinburgh 1978 45-64 2 year 44,268 13 year
Göteborg 1982 39-59 18 months 51,611 14
Malmö 1976 43-70 18 months 60,076 16
New York 1963 40-64 1 year 60,995 18
Stockholm 1981 40-64 28 months 60,117 15
Two Country 1977 40-74 2 year 133,065 20
Source: (Getzche, et al., 2009)
After this defined follow up period experiment group is compared with the
control group in measuring the outcomes as mortality from breast cancer,
mortality from any cancer, all-cause mortality, use of surgical interventions, use
Page 26
13
of adjuvant therapy and harms of mammography. As a result of these trials
significant reduction in breast cancer mortality rates were realized. Biggest
reduction in breast cancer mortality is faced in New York trial as 35 %, followed
by 24 % mortality reduction in Two Country trial. Similar mortality reductions
were obtained in other trials between 15% and 35%. Best results were obtained
for the women having their first mammography after the age of 50. (Getzche, et
al., 2009)
Page 27
14
4 LITERATURE ON COST-EFFECTIVENESS OF BREAST
CANCER SCREENING
Effectiveness studies about breast cancer in literature are usually from a medical
point of view and only mortality reductions due to breast cancer screening
program is considered and cost considerations are discarded. There are few
studies in the literature aiming to estimate cost-effectiveness of breast cancer
screening programs as well as seeking the optimal screening strategy. Those
studies guide this thesis throughout the development of the model constructed in
terms of aim, methodology and data sources.
First aspect of the model that needs guidance is the determination of the exact
goal. The primary objective and alternative scenarios should be clearly defined
and the rest of the model should be constructed consistent with this objective.
Similar studies in the literature have more or less the same primary objective;
instead they vary on the alternative scenarios tested.
A study done in Slovenia by Rojnik et al. (Rojnik, et al., 2008) tries to determine
the most cost-effective screening policy for population-based mammography
breast cancer screening. It emphasize the importance of breast cancer for Slovenia
with around 100 newly diagnosed cases per 100,000 women in a year and it will
afflict 1 in 15 Slovenian women by the age of 75 years. Then it searches for the
most effective population based screening policy that minimizes the total
screening and treatment costs. 36 alternative scenarios is included in the study
varying in terms of age distribution of the women that will be subject to
screening, from 40 to 80, and the screening interval to be implemented, annual,
biennial and triennial.
Page 28
15
The objective of the model in another study conducted by Yılmaz and Yazıhan
(Yılmaz, et al., 2007), on the other hand, is more deterministic and simplistic. It
tries to analyze whether implementing a population based screening program
including women aged between 50 and 70 would be beneficial in terms of
economic efficiency. It does not include any alternative scenarios and has just one
question to answer; that is whether the costs of screening each woman over 50
biennially would be lower than the benefits of such a program, in terms of
reduced treatment costs due to early diagnosis.
Another study searching the economic efficiency of breast cancer screening is
carried out in Japan among women aged between 30 and 70 (Ohnuki, et al.,
2006). The main objective of this study is quite different from the others. Instead
of just searching economic efficiency of mammography screening among
different age groups, it also compares the economic efficiency of different
screening methods. These methods include the clinical breast examination alone,
mammography screening, clinical breast examination with breast cancer
screening and no screening. Again several scenarios are included with respect to
age distribution and screening interval. Annual and biennial strategies among
women aged between 30 and 70 are tested for all screening methods.
Final study in literature guiding this thesis in determination of the objective and
alternative scenarios to be tested is the one done by Wong et al (Wong, et al.,
2007) in China. It aims to evaluate if it is cost-effective to implement a population
based mammography screening program among Chinese women between ages
40 and 79. Only biennial strategy is included and five different age groups are
constructed to test for the optimal screening age.
After determining the objective and alternative scenarios to be implemented,
methodology for testing those scenarios should be chosen under the constraint of
Page 29
16
available data. Different studies in the literature consist of different
methodologies for testing the cost-effectiveness, such as state transition Markov
model, simulation model or deterministic model.
The study done by Rojnik et al. (Rojnik, et al., 2008) uses a time dependent
Markov model to compare hypothetic populations of women, one followed
clinically without screening and the others undergo different screening
mammography policies. In classification of the breast cancer into stages TNM
(Tumor Node Metastasis) classification is used. Women with breast cancer are
allocated into 4 stages, namely; DCIS (ductal carcinoma in stu), Local, Regional
and Distant. Structure of the model for breast cancer screening with the possible
courses of the disease is as shown in Figure 6.
Figure 6: Modeling used by Rojnik et al. (Rojnik, et al., 2008)
Breast cancer incidence, mammography sensitivity, mortality, and breast cancer
relative survival are modeled as time dependent transition probabilities. The
dashed lines correspond to transitions possible only by screening policies. The
state “death from other causes” which can be attained from all other states is not
shown. The transitions to clinically diagnosed local, regional, and distant states
are governed by the rate of the incidence, clinical-stage distribution data, and
Page 30
17
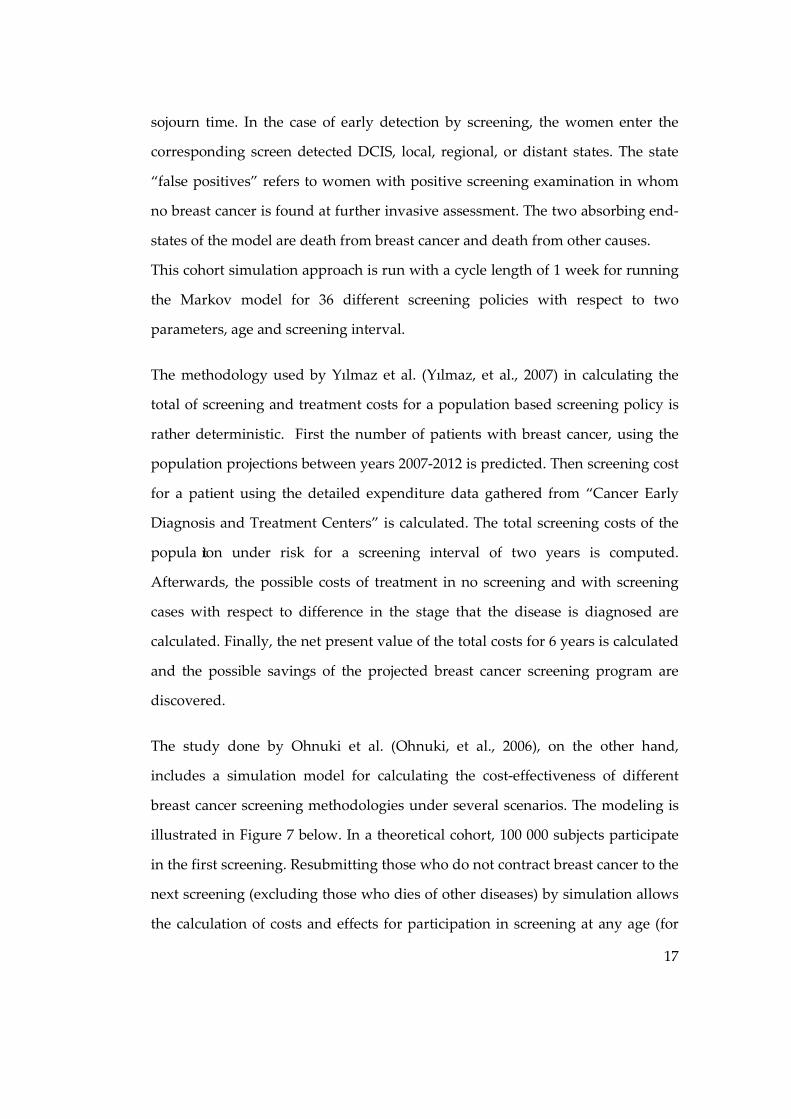
sojourn time. In the case of early detection by screening, the women enter the
corresponding screen detected DCIS, local, regional, or distant states. The state
“false positives” refers to women with positive screening examination in whom
no breast cancer is found at further invasive assessment. The two absorbing end-
states of the model are death from breast cancer and death from other causes.
This cohort simulation approach is run with a cycle length of 1 week for running
the Markov model for 36 different screening policies with respect to two
parameters, age and screening interval.
The methodology used by Yılmaz et al. (Yılmaz, et al., 2007) in calculating the
total of screening and treatment costs for a population based screening policy is
rather deterministic. First the number of patients with breast cancer, using the
population projections between years 2007-2012 is predicted. Then screening cost
for a patient using the detailed expenditure data gathered from “Cancer Early
Diagnosis and Treatment Centers” is calculated. The total screening costs of the
popula tion under risk for a screening interval of two years is computed.
Afterwards, the possible costs of treatment in no screening and with screening
cases with respect to difference in the stage that the disease is diagnosed are
calculated. Finally, the net present value of the total costs for 6 years is calculated
and the possible savings of the projected breast cancer screening program are
discovered.
The study done by Ohnuki et al. (Ohnuki, et al., 2006), on the other hand,
includes a simulation model for calculating the cost-effectiveness of different
breast cancer screening methodologies under several scenarios. The modeling is
illustrated in Figure 7 below. In a theoretical cohort, 100 000 subjects participate
in the first screening. Resubmitting those who do not contract breast cancer to the
next screening (excluding those who dies of other diseases) by simulation allows
the calculation of costs and effects for participation in screening at any age (for
Page 31
18
example, from 30 to 79 years). Difference in the effects of annual and biennial
screening emerges in the rate of false-negative breast cancers. It is hypothesized
that the proportion of early stage breast cancers among women with a false-
negative screening result would be similar to that among women who are not
screened. The simulation is run for 15 years and projected costs and benefits are
collected.
Figure 7: Modeling used by Ohnuki et al. (Ohnuki, et al., 2006)
A state-transition Markov model, illustrated in Figure 8, to simulate biennial
mammography, breast cancer diagnosis, and treatment in a hypothetical,
population based cohort of Hong Kong Chinese women is developed in the
study of Wong et al. (Wong, et al., 2007). Nodes of the Markov model are defined
as ductal carcinoma in stu and 4 stages of the breast cancer classified in TNM
classification. Also one source node as alive without breast cancer and two
terminating nodes as deaths of breast cancer and deaths from other sources were
included. The effectiveness of mammography is included by assuming that some
cancers would be detected by screening at a less advanced stage compared with
no screening. For newly diagnosed cancers in unscreened women local stage
distribution is applied and for newly diagnosed cancers in screened women the
stage distribution in SEER data from the U.S. is used to represent the stage shift
caused by screening. Only biennial screening is evaluated. 5 different strategies;
Page 32
19
no screening, biennial screening of women between ages 50-69, 50-79, 40-69 and
40-79 are compared in terms of life expectancy, quality adjusted life expectancy,
and lifetime costs. The model is run for a time horizon of 50 years and the results
are collected.
Figure 8: Modeling used by Wong et al (Wong, et al., 2007)
After constructing the model in the light of these studies in the literature the
available data sources may be used in the thesis are searched among those
studies. All data regarding age-dependent cancer incidence, clinical-stage
distribution, treatments, and survival rates are obtained from the Cancer Registry
of Slovenia in the study of Rojnik et al. (Rojnik, et al., 2008) The costs for
mammography examination, the costs for diagnostic interventions for clinically
detected breast cancer, the costs for invasive and noninvasive diagnostics at
recall, and the costs for treatment interventions are obtained from the Institute of
Oncology Ljubljana. QALYs for treatment and the corresponding durations of
treatments are obtained from the literature. The quality of life for DCIS, local and
regional breast cancers after treatment is weighted according to the treatment
interventions. The quality of life for distant cancer is weighted with 0.515. The
quality of life for women with false positive result is also reduced according to
Page 33
20
the diagnostic duration and QALY weight. In the case of death from breast
cancer, a terminal illness lasting 1 month with QALY weight of 0.288 is taken into
account.
Probable number of breast cancer cases in women at the age group 50+ in Turkey
in general is calculated using the number of breast cancer cases obtained from
screening results in Cancer Early Diagnosis and Treatment Centers and
population projections in the study by Yılmaz et al. (Yılmaz, et al., 2007).
Screening costs per patient is calculated by examining in detail the cost structures
of Cancer Early Diagnosis and Screening Centers. The costs of surgical operation,
radiotherapy and medicine treatments, and laboratory tests used in diagnosis
and monitor, which are applied during the 14-57 months monitor period are
calculated excluding the costs of line in hospital for 14 stage I, 6 stage II, 9 stage
III, and 6 stage IV patients with adjustment to 2007 prices and hence treatment
and monitor costs for patients in each stage are calculated as average annual
costs.
For each of the screening strategies, sensitivity, specificity and proportion of
early stage breast cancer are derived from studies conducted in Miyagi
prefecture in the study done by Ohnuki et al. (Ohnuki, et al., 2006) Mortality
from breast cancer and total mortality are derived from the annual report on
Vital Statistics of Japan in 2001, and life expectancy is derived from the 19th Life
Table. The proportion of early stage breast cancers among breast cancers detected
at outpatient departments, the 5-year survival rate by clinical stage, screening
costs, further examination costs, diagnostic costs for outpatients and treatment
costs are based on a questionnaire survey carried out by the Grant-in-Aid for
Cancer Research from the Ministry of Health and Welfare in 1996 at 13
institutions in Japan.
Page 34
21
In the study done by Wong et al. (Wong, et al., 2007) age-specific invasive breast
cancer incidence and associated stage distribution are obtained from the Hong
Kong Cancer Registry. Because DCIS incidence is not recorded locally, the age
specific proportions of DCIS are adopted among all newly diagnosed breast
cancer cases in the Surveillance, Epidemiology, and End Results (SEER) data in
1983 and 1998 for the unscreened and screened women in the model,
respectively. All- cause mortality is abstracted form local data. Cost estimates are
derived from local public sector costs and private sector charges. Transition
probabilities are calibrated according to the observed 5-year relative survival
statistics from the SEER data for stages I, II, and III from the most recent 15 years.
For stage IV or metastatic disease cancer specific death rates are derived from the
relative survival data from patients with stage IV disease. Quality adjusted life
years are weighted according to stages of breast cancer as 0.95, 0.9, 0.8, 0.7, and
0.3 respectively for DCIS, Stage I, II, III and IV.
Results of the all these four studies in the literature, favors breast cancer
screening against no screening. Based on commonly quoted thresholds of
society’s willingness to pay per QALY in Slovenia, the policy of choice for breast
cancer screening in the Slovenian population is found as screening women aged
from 40 to 80 years every 3 years in the study of Rojnik e al. (Rojnik, et al., 2008).
The savings achieved in treatment expenditures for six years is calculated as
217.78 million YTL for Turkey by Yılmaz and Yazıhan (Yılmaz, et al., 2007) if the
total female population under risk is to be screened once two years. In all age
groups, the smallest ratio of cost to survival duration is observed for biennial
clinical breast examination and mammography screening together in Japanese
case (Ohnuki, et al., 2006) and of the 5 strategies considered biennial
mammography for all women ages 40 years to 69 years is found out as the least
Page 35
22
costly, non-dominated screening option among Chinese women. (Wong, et al.,
2007)
Page 36
23
5 COST EFFECTIVENESS ANALYSIS MODEL FOR
TURKEY
5.1 Aim
It is now clear that breast cancer has great burden on the society in both
economic a nd socia l a spects a nd cannot be left to competitive markets for the
optimal allocation to be stored. Governments should intervene in the market and
make a public choice for providing optimality. It is also clear that breast cancer is
not a disease that is dependent on the amendable factors. In other words unlike
most of the other diseases, breast cancer cannot be averted by controlling risk
factors because main factors such as age and genetic structure are not
controllable. For example, while policies against tobacco usage may result in
serious decrease in lung cancer, or a change in diet may decrease the incidence
rate of stomach cancer, there is no such thing known that can affect the incidence
rate of breast cancer. (www.who.org, 2010) The only way to struggle with breast
cancer is to diagnose it in early stages, before it spreads all over the body. Early
diagnosis of the breast cancer can only be done by mammography or ultrasound
screenings. Hence, in struggle with breast cancer governments should implement
screening programs to provide diagnosis of the breast cancer before spreading
and reduce the overall burden of the breast cancer to the society.
It is for sure that a population based screening program would decrease the
amount of resources spent in the treatment of breast cancer, because early
detected cases are cheaper to treat in terms of treatment methodology used. A
screening policy is also expected to decrease mortality rates and disabilities
caused by breast cancer, because earlier diagnosis of the cancer means greater
survival rates and less distortion to the patient in the treatment process.
Page 37
24
However, screening program charges extra burden on the society in terms of
resources spent during the screening process. These resources include both the
investments needed for screening the women in the risk group and the further
operational costs about clarification of the status of the cases resulted from
abnormal screenings. The question here is that whether the decrease in the
treatment costs, mortality rates and disability rates are enough to compensate the
screening costs and operational costs resulted from abnormal screenings. In other
words, would a prospective population based screening program is cost
effective.
The aim of the model constructed in this study is to answer this question for
Turkey and find out if a population based screening program would have
positive effect on the resources spent for breast cancer. Population based
screening program is tested for cost effectiveness by the model. However, the
aim is not limited to measuring cost effectiveness. The optimal screening strategy
in terms of mortality and disability rates, screening costs and treatment costs is
investigated as well. The screening strategies determined according to two
criteria, minimum age to screen and frequency of screening, are compared to find
out which screening policy would be most effective. At the end of the study the
questions;
• Whether a population based screening program is cost-effective
• What is the optimal minimum age for screening
• What is the optimal screening interval
are expected to be answered.
5.2 Model
For finding answers to questions in the previous section a real-world simulation
model is used. All the components of a breast cancer screening program are
Page 38
25
transferred to simulation software, Arena 4.0, and using Markov analysis logic
several strategies tested for cost effectiveness. Basically each single woman in real
world is treated as an entity strolling between nodes in the simulation model and
all possible states that a woman can be in are constructed as the nodes to be
strolled. Transition probabilities between these nodes are estimated from real
world applications, some of which existed in the literature or databases, and
some of which are derived from surveys conducted or from hospital records. The
databases of World Bank, World Health Organization, International Money
Fund, Turkish Institute of Statistics and Turkish Republic Ministry of Health,
survey results from Cancer Early Diagnoses and Treatment Centers from
different districts of Turkey, namely Antalya, Kayseri, Ankara, Ordu, Denizli,
Konya, Bursa, Balıkesir, Sivas, and hospital records of Aegen University Hospital
and Ankara Numune Hospital are used in the estimation of transition
probabilities. Estimation of each variable used in the model is explained in detail
in the following sections.
Structure of the model is illustrated in Figures 9 and 10. Each of these figures
presents a single closed sub-model that make up the whole model together. First
sub-model (Figure 9) includes the period between a woman entering the system
and it is diagnosed by breast cancer and transferred to the treatment sub-model.
Second sub-model includes the period from the beginning of the treatment to the
time the women leaves the system, i.e. die.
In the screening sub-model, first of all, women population over 30 according to
the last census done by Turkish Institute of Statistics in 2008 is created as unique
entities at the beginning of the simulation. This is the only entity creation
throughout the simulation. Although the risk group for breast cancer is chosen as
women between 40 - 70 years, an entity created for each female over 30 by the
thought that in 10 years time, which is the simulation length, females between 30
Page 39
26
and 40 years old will be added to the risk group. After creation of the entities
they are marked with an attribute defining their ages.
Entities are then transferred to the decision node where screening decision is
made according to the screening strategy given and the value of their attributes.
According to the decision made entities are sent to “screened” or “unscreened”
nodes.
In the screened node according to the transition probability derived from the
survey results coming from Cancer Early Diagnosis and Treatment Centers the
entities are dispatched to positive or negative nodes implying the result of the
screening. From negative node there are two paths that an entity can follow, it is
either be transferred to the terminating node meaning that the person dies or it is
transferred back to the decision node after age attribute is increased by one for
the next year’s decision. This choice is done according to the transition
probability derived from the mortality rate data of Turkish Institute of Statistics
for 2008.
Entities in the positive node, on the other hand, are separated into false positives
and true positives nodes according to the age dependent mammogram specificity
rates taken from literature. Entities in the false positive node are treated similar
to the ones in negative node. They are either disposed according to the mortality
rates, or transferred back to the decision node by increasing age by one for the
next year’s decision. An entity in the true positive node represents a women
actually diagnosed by breast cancer and the stage of the cancer should be
decided. Therefore according to the survey results from Cancer Early Diagnosis
and Treatment Centers and value of the age attribute they are dispatched to the
stage nodes from Stage I to Stage IV. Then, entities in the stage nodes left the
screening sub-model and transferred to the treatment sub-model.
Page 40
27
Fem
ales
ov
er 3
0 Sc
reen
or
Not
Scre
ened
Not
Scr
eene
d
Posi
tive
Neg
ativ
e
Not
Can
cer
Can
cer
True
Pos
itive
Fals
e Po
sitiv
e
Die
Incr
ease
A
ge St
age
I
Stag
e II
Stag
e IV
Stag
e II
I
Stag
e I
Stag
e II
Stag
e IV
Stag
e II
I
Trea
tmen
t
Figure 9: Sub-Model Screening
Page 41
28
In the unscreened node according to the transition probabilities derived from
survey results, entities are transferred to the “clinically diagnosed breast cancer
cases” node or “not breast cancer” node. Entities in the “not breast cancer” node
are the dispatched to the disposing node or age increase node according to the
mortality rate data similar to the entities in the false positive or negative nodes.
Entities in the “clinically diagnosed” node, on the other hand, are transferred to
the treatment node after stages of the breast cancer for each entity is determined
according to the transition probability derived from the hospital records of
Aegean University Hospital and Ankara Numune Hospital.
Entities coming to treatment sub-model are dispatched into two paths. They are
either sent to “die due to breast cancer” or “not die to due to breast cancer”
nodes according to breast cancer survival rates taken from the literature. Entities
transferred to “die due to breast cancer” node are done sent to “death burden”
node but they are not disposed yet. Those entities enter in a loop between “death
burden” and “age increase”. This is done to keep record of the death burden due
to breast cancer.
Entities keep looping until they are completely disposed by the probability of
mortality rate due to another reason. This loop provides the accurate calculation
of the death burden.
Entities transferred to “not die due to breast cancer” node are disposed by the
probability derived from mortality rate data. If an entity in “not die due to breast
cancer” node is not disposed, in other words, if a women taking breast cancer
treatment does not die, it is transferred back to treatment node for the following
years of treatment.
Page 42
29
Trea
tmen
t
Die
due
to
Brea
st C
acne
r
Not
Die
due
to
Brea
st C
acne
r
Incr
ease
D
eath
Bu
rden
Incr
ease
Age
by
One
Incr
ease
Q
ALY
Bu
rden
Incr
ease
Age
by
One
Die
Due
to
Ano
ther
Re
ason
Not
Die
Wou
ld H
ave
Die
d if
Not
BC
Wou
ld L
ive
if
Not
BC
Dis
pose
En
tity
Figure 10: Sub-Model Treatment
Page 43
30
Transition probabilities changes for each entity in each loop according to some
factors such as age, screening strategy applied and whether the patient is
previously screened or not.
At each node visited by an entity corresponding outputs are kept for each year.
For example, when a stage III breast cancer patient entity visits the treatment
node, corresponding treatment cost is incurred. Similarly, when an entity visits
the false positive node, number of false positives and corresponding false
positive costs are increased by their values. These outputs are then summarized
and classified in order to make appropriate analysis. The results of the simulation
are discussed in the following section.
10 different screening methodologies and 1 base scenario are applied to collect
results, and to compare the effects of different strategies. These strategies are
chosen according to the similar studies in the literature, under the constraint of
the data that can be reached. These strategies consist of 5 annual screening
strategies and 5 biennial screening strategies according minimum age to be
screened, which are 40+, 45+, 50+, 55+, and 60+.
5.3 Data
5.3.1 Estimation of Target Population
To run a simulation model for discovering the benefits of a population-based
breast cancer screening policy, first thing needed to know is the number of
women to be included in simulation each year. Once the target population to be
included is estimated, this number can be used as the number of entities to be
created in the simulation model. Those entities will stroll around the simulation
nodes by specific transition probabilities and build-up the total cost and benefit
values. The main parameter in the simulation is the age group, since breast
cancer incidence rates are very much dependent on the age. Therefore, besides
Page 44
31
estimation of the target population to be included in simulations, age of each
entity should also be determined. Ages of women can be thought as attributes of
entities that will be used during simulation, provided that they will be updated
each simulation year.
Instead of a deterministic calculation of the number of women in risk group for
each year, a rather dynamic approach is used during simulations. At the very
beginning of each simulation, all entities are created once and for all according to
the results of the “abode based census”. Table 5 displays the results of the 2009
census for all ages, as the number of entities to be created at the beginning of the
simulation. However, rather than the age group of a woman in the simulation
model, exact age should be known in order to update her age in each simulation
year. Therefore, female population for each year should be further divided into
unique ages. For simplicity, it is assumed that a given age group consists of equal
number of females for each exact age. For instance, female population aged 47 is
assumed to be 445,682 (2,228,411/5).
Table 5: Female Population in Turkey Age
Group Female
Population Age
Group Female
Population
30-34 2.912.568 50-54 1.847.369
35-39 2.740.457 55-59 1.483.667
40-44 2.296.915 60-64 1.236.594
45-49 2.228.411 65-69 920.652 Source: TUIK, 2009
After creation of all women as entities at the beginning of the simulation and
exact ages are attributed to them, target population is estimated for the first
simulation year. However, in order to estimate the target population for
successive simulation years a specific transition probability is needed. That is the
termination rates of the entities. At the end of each simulation period there are
Page 45
32
two possibilities for each entity. It either will continue to the next simulation
period by increasing the value of age attribute by one, or leave the system. In
other words, at the end of each year, a woman will either continue to live by
aging one more year, or die. Therefore, for estimating the target population in
successive periods of the simulation, terminating probabilities of the entities, in
other words mortality rates of the women, should be known. Table 6 illustrates
the mortality rates for females according to the age groups, which is used as the
transition probability of termination node. These rates are mortality rates of
females excluding the deaths caused of breast cancer in 2009. Breast cancer
mortality rates excluded from overall mortality rates, since they are used as
separate transition probabilities, in order to prevent double counting.
Table 6: Mortality Rates Excluding Breast Cancer Age
Group Mortality
Rates* Age
Group Mortality
Rates*
30-34 0,0269% 55-59 0,2786%
35-39 0,0399% 60-64 0,4833%
40-44 0,0631% 65-69 0,8437%
45-49 0,1046% 70-74 1,5542%
50-54 0,1684% 75+ 4,1512% Source: TUIK, 2009
5.3.2 Probability of Breast Cancer
Probably the most crucial data in the simulation model for accurate calculation of
the cost and benefits of breast cancer is to correctly estimate the probability for a
woman to get cancer. The model then can be used to calculate the overall burden
of the breast cancer in accordance with the estimated target population. The very
basic way to estimate breast cancer probabilities is to look at the yearly incidence
rates registered in previous years. These incidence rates can be considered as the
probability for each individual to develop breast cancer.
Page 46
33
Cancer Struggle Agency of the Ministry of Health made a study including 2004-
2006 aiming to display the overall incidence rates for each cancer type. In the
context of this study number of breast cancer cases taken from the eight different
Cancer Registry Centers1
Table 7: Breast Cancer Incidence Rates Estimated by Ministry of Health
in different cities of the country is divided by the
overall female population of these cities in order to derive a breast cancer
incidence rate. Breast cancer incidence rates for three consecutive years derived
by Cancer Struggle Agency of the Ministry of Health are presented in Table 7.
2004 2005 2006
Incidence Rate 0,0373% 0,0384% 0,0417%
Ministry of Health, 2007
According to the results of the study conducted in eight cities, breast cancer
incidence rate appears to be about 39 in 100,000. However, there are strong
shortcomings of this study in reflecting accurate incidence rates. First of all,
breast cancer is a progressive disease and very much dependent on the age. Thus,
an overall incidence rate derived by dividing the total number of cases to the
population is quite pointless, since almost all of the breast cancer occurrences
appear after the age of 402
1 Antalya, Kayseri, Ordu, Denizli, Konya, Bursa, Balıkesir, Sivas
2 Survey Results among Cancer Early Diagnosis and Treatment Centers
. Another shortcoming of this exercise is that it is based
on the data taken from the Cancer Registry Centers. It is for sure that Cancer
Registry System of Turkey is not developed enough yet to be a data source for
such a study. There may be a number of breast cancer cases diagnosed and under
treatment in health facilities, however not registered to any Cancer Registry
Page 47
34
Centers. Moreover, there are also unknown breast cancer cases developing,
which are not diagnosed yet.
In this thesis instead of using breast cancer incidence rates of the Cancer Struggle
Agency of the Ministry of Health, more reliable incidence rates are calculated for
the women over 40, according to the survey results coming from Cancer Early
Diagnoses and Treatment Centers3
Table 8: Breast Cancer Incidence Rates Estimated Using Survey Results
. Number of mammography screenings
between years 2007 to 2009, and number of breast cancer cases diagnosed in this
mammography screenings are presented in Table 8. In 2007, 60 of every 10,000
women screened is found to be diagnosed with breast cancer, 82 of every 10,000
for 2008 and 67 of every 10,000 for 2009. These are more accurate breast cancer
probability values including both registered and unregistered cases.
2007 2008 2009
No of Mammography Screening 37.274 35.866 24.639
Incidence 222 295 166
Incidence rate 0,60% 0,82% 0,67% Source: Data Collected from Cancer Early Diagnosis and Treatment Centers
Using these incidence rates, probability for a woman diagnosed by breast cancer
each year is calculated for each simulation period. However, since there are only
three data points, doing trend analysis to predict future incidence rates is quite
inappropriate, rather an average constant value is used. Overall breast cancer
probability during simulation is used as 0.70 %, as the average incidence rate
faced during random mammography screenings in Cancer Early Diagnoses and
Treatment Centers.
3Antalya, Kayseri, Ordu, Denizli, Konya, Bursa, Balıkesir, Sivas
Page 48
35
Overall breast cancer incidence rate is necessary data for running the simulation,
but not a sufficient one. These overall incidence rates should be assigned to age
groups. Table 9 displays the allocation of the 8,153 breast cancer incidences
diagnosed between 2002 and 2006 in different health facilities into the age groups
and relative frequencies of each age group.
Table 9: Breast Cancer Incidences Rates by Age Group 40-44 45-49 50-54 55-59 60-64 65-69
2006 341 359 349 287 253 206
2005 288 324 332 281 243 169
2004 312 324 290 239 235 172
2003 371 311 263 227 211 180
2002 283 317 321 254 237 174
Total 1595 1635 1555 1288 1179 901
Relative Frequency
19.56% 20.05% 19.07% 15.80% 14.46% 11.05%
Source: Data Collected from Clinical Hospital Records4
By using these relative frequencies and with the assumption that the number of
women screened in random screenings carried on Cancer Early Diagnoses and
Treatment Centers are same for all age groups, age dependent cancer incidence
rates can be calculated by the following formula.
Table 10 displays the results of this formula for all age groups. Therefore,
transition probability for diagnose by breast cancer in each period of our
simulation is found separately for each individual in all age groups.
4 T.C. Sağlık Bakanlığı Numune Eğitim ve Araştırma Hastanesi Onkoloji Kliniği
Page 49
36
Table 10: Relative Frequency of Breast Cancer for Age Groups 40-44 45-49 50-54 55-59 60-64 65-69
Incidence Rate 0.007 0.007 0.007 0.007 0.007 0.007
No of age groups
screened 6 6 6 6 6 6
Relative Frequency of
Age Group 19.56% 20.05% 19.07% 15.80% 14.46% 11.05%
Incidence Rate of the
Age Group 0.82% 0.84% 0.80% 0.66% 0.60% 0.46%
Source: Data Collected fromCancer Early Diagnosis and Treatment Centers
5.3.3 Stage at Diagnosis
The stage of breast cancer at the diagnosis is important for defining the relative
mortality rates of the patients. If a breast cancer is diagnosed at early stages, then
survival rates can be high. However, if the diagnosis is done at late stages,
especially after metastasis, survival rates can be extremely low. Besides from
mortality rates, diagnosis stage is also a primary factor in breast cancer treatment
options and hence, the money spent on treatment. While, at the early stages of
the cancer, main treatment options are chemotherapy, radiotherapy and
systematic medical drugs, at late stages heavier medical treatment, mastectomy
and surgery may be needed. The delay of the diagnosis of the disease means
higher treatment costs. Therefore accurate staging of breast cancer is important
both for mammography screened women and for clinically diagnosed women.
5.3.3.1 In Mammography Screened Women
To determine the relative percentages of the breast cancer stages faced in
mammography screened women, survey results from Cancer Early Diagnosis
and Treatment Centers are used. As explained above, 37,424, 35,866 and 24,639
women were screened in CEDTC’s randomly in 2007, 2008 and 2009 successively,
Page 50
37
and 222, 195, 166 incidences were reported. Table 11 below displays the stage
distribution of these incidences, stage of which can be identified.
Table 11: Breast Cancer Stage Distributions in Screened Women in Detail 2007 2008 2009 Total
Stage 0 5 11 5 21
Stage I 32 33 27 92
Stage I A
Stage I B
Stage II 48 47 37 132
Stage II A 9 15 11 35
Stage II B 11 16 7 34
Stage II C 0
Stage III 13 17 6 36
Stage III A 2 6 7 15
Stage III B 1 1
Stage III C 5 1 6
Stage IV 6 10 9 25
Total 126 165 111 402 Source: Data Collected from Cancer Early Diagnosis and Treatment Centers
For simplicity, these TNM stages are categorized in four main stages in Table 12,
and relative average occurrence rate for all stages in 2007 to 2009 are used as the
transition probability for entities between diagnose node and stage nodes during
the simulation.
Table 12: Breast Cancer Stage Distributions in Screened Women Stage Probability
Stage I 28,11%
Stage II 50,00%
Stage III 14,43%
Stage IV 6,22% Source: Data Collected From Cancer Early Diagnosis and Treatment Centers
Page 51
38
5.3.3.2 In Clinically Diagnosed Women
To determine the stage allocations of the diagnosed cases where diagnosis comes
out from a clinical symptom, outcomes of the study made by Haydaroğulları et al
(Haydaroğlu, et al., 2005) is used with combination of the study by Yılmaz et al.
(Yılmaz, et al., 2007) Haydaroğulları et al made a study in Aegean University
Hospital, using 3897 breast cancer incidences, half of which are from habitants of
Izmir and half of which is coming from out of town, aiming to evaluate these
incidences with respect to certain factors. One of the aims of the study was to
evaluate relative frequencies of stages at the diagnosis. It is found out that 1,097
of the 3,171 cases are diagnosed at early stages (Stage I and Stage II), 1,923 are
diagnosed at Stage III and 151 are diagnosed at the Stage IV. However,
separation of early stage cancers into Stage I and Stage II cancers is needed, since
different cost parameters are attached to them. The outcomes of the study done
by Yılmaz et al are used in this allocation. 17 of the 89 early stage breast cancer
incidences in the mentioned study are found to be at Stage I and 72 of 89 are at
Stage II. Applying these ratios to the 1,923 cases of early diagnosis (Stage I and
Stage II) breast cancer incidences faced in Aegean University Hospital results in
219 Stage I cases and 878 Stage II cases. Therefore relative frequencies of the
stages for clinically diagnosed breast cancer, which is used as the transition
probabilities between diagnosis node and the stage nodes of the simulation
model, are found as given in Table 13.
Table 13: Breast Cancer Stage Distributions in Clinically Diagnosed Women Stage Number Frequency
Stage I 219 6,91%
Stage II 878 27,69%
Stage III 1923 60,64%
Stage IV 151 4,76%
Toplam 3171 100,00% (Haydaroğlu, et al., 2005), (Yılmaz, et al., 2007)
Page 52
39
5.3.4 Cost of Screening
There are basically two cost parameters in the simulation model, cost of
screening and cost of treatment, which will be determining factors in chosen
strategy. Simulation results will favor the population based screening program if
the screening costs are lower with respect to treatment costs and no screening
strategies will be favored if the screening costs are high. Therefore, both of these
cost values are needed to be estimated carefully.
Cost of mammography screening per woman is taken from the detailed analysis
of the cost structures of Cancer Early Diagnosis and Treatment Centers. Results
of the surveys conducted in CEDTC’s containing the detailed cost analysis are
classified into groups as expenditures on goods and services, maintenance
expenditures, capital expenditures and personnel expenditures. Economic life
years of the medical equipments such as mammography, ultrasound and
computers are calculated and yearly amortizations are included in yearly cost of
screening. Calculations are not done based on the current capacity usage rates,
rather they are done assuming the situation that CEDTC’s work at the full
capacity due to a projected population based screening program. Moreover
calculations are based on the mammography and examination screenings,
ultrasound and pathological interventions are discarded. Average screening cost
per patient based on mammography and examination screenings are estimated
as 15.2 TL in 2007 prices.
Table 14: Screening Cost Average Screening Cost Per Patient 15.2 TL
(Yılmaz, et al., 2007)
Page 53
40
Table 15 below illustrates the detailed analysis of the screening costs per patient.
The greatest cost item is the personnel expenditures by almost 50 percent of the
all expenditures, followed by operating costs and investment costs.
Table 15: Distribution of Screening Costs Expenditure Relative Percentage
Personnel 49.1%
Operating Expenditures 33.8%
Investment 14.7%
Maintenance 2.40%
Total 100% (Yılmaz, et al., 2007)
The cost of screening per patient, which is estimated as 15.2 TL, is incurred
whenever an entity visits the screening node during simulation. Therefore, at the
end of the simulation run, an overall cost of screening is found, with respect to
the number of entities visiting the screening node, in other words number of
women screened.
5.3.5 Cost of Treatment
The other cost parameter in the simulation model is the cost of treatment. Unlike
screening costs, treatment costs are not the same for all breast cancer patients and
respect a great variety dependent on some factors, such as age, stage at diagnosis
and co morbidity etc. Breast cancer patients diagnosed in old ages are more
costly to treat, since there is a greater probability to develop infection or other
disease. Similarly, patients with co-morbidity besides the breast cancer also needs
special care compared to breast cancer patients only, hence they are more costly
to treat. However the most crucial parameter defining the cost of treatment for a
Page 54
41
patient is the stage of the cancer at the diagnosis. Studies5
Table 16 presents the average annual treatment costs per patient for each stage
that will be charged in each simulation year as long as the patient is in the
system. Once an entity comes to one of these stage nodes, corresponding
treatment cost is added to the total costs. At the end of the simulation year, if the
in literature display the
fact that breast cancer treatment costs are very much dependent on the progress
of the disease, and other factors are in minor importance. Stage of the disease at
the diagnosis is the main parameter in defining treatment cost because the
medical intervention method is decided according to the stage. In early stages
medical treatment or chemotherapy can be enough the ensure survival, whereas
at the later stages heavier and costly treatment options such as mastectomy, or
surgery are needed. Therefore in estimating treatment costs, only stage
parameter is used and annual treatment cost for each stage that the disease is
diagnosed is found.
Treatment and surveillance costs for breast cancer patients are estimated
according to the records in registry of Oncology Clinic of Ankara Numune
Education and Research Hospital. 35 patients, whose records are kept in detail,
diagnosed by breast cancer in different times are chosen randomly. The diagnosis
stages of the disease of these 35 chosen patients are as follows; 14 Stage I, 6 Stage
II, 9 Stage III and 6 Stage IV. Records of these patients including each type of
expenditure in the process of treatment such as medical treatments,
radiotherapy, surgery and laboratory tests during 14-57 months were analyzed in
detail. The results of the analysis are then adapted to 2007 prices and annual
treatment costs per patient with respect to the stage of the breast cancer at the
diagnosis is found.
5 (Yılmaz, et al., 2007), (Rojnik, et al., 2008), (Ohnuki, et al., 2006), (Wong, et al., 2007)
Page 55
42
entity still remains in the system then these treatment costs are charged again for
the next simulation period. These costs are continued to be charged until the
entity leaves the system, in other words until the patient dies.
Table 16: Breast Cancer Treatment Costs Stage Average Annual Treatment Costs
Stage I 2,580 TL
Stage II 3,624 TL
Stage III 8,735 TL
Stage IV 4,001 TL
(Yılmaz, et al., 2007)
5.3.6 Screening Interval
An ‘interval cancer’ is a cancer diagnosed between a normal screen, and the time
the next screen is due. A screening program with a high percentage of interval
cancers is unlikely to make a significant difference to breast cancer mortality.
Therefore the choice of screening interval is important to realize higher benefits
with lower costs. A long screening interval means enough time for cancerous
cells to develop and make progression between two screening intervals. On the
other hand, much shorter screening interval may lead to higher rates of false
positive results and higher costs of screening with a lower reduction in mortality
rates.
A seventeen year study for evaluating the effects of screening interval on the
burden of breast cancer carried out by Miltenburg et al in Netherlands,
introduced the relative probabilities for patients to develop interval cancer.
(Miltenburg, et al., 1998) 14,697 women attending the program are subjected to
the mammography screening at different intervals and followed up by seventeen
years, and odds ratios for screening intervals are calculated. Table 17 below
illustrates the odds ratios to develop interval cancer for each screening interval.
Page 56
43
These ratios are multiplied by breast cancer incidence rates for unscreened
women to estimate the probability of being diagnosed by breast cancer between
two successive screenings. For instance, while the probability of diagnose for an
unscreened women aged 50 is 0.80%, given that the result of the first screening is
negative the probability of diagnose reduces to 0.43% in successive screenings in
a biennial screening strategy.
Table 17: Annual vs. Biennial Screening Odds Ratios Screening Interval Odds Ratio
Annual 0.38
Biennial 0.54
(Miltenburg, et al., 1998)
Besides the reduced probability of diagnosis, choice of screening interval has also
effects on the stage of the breast cancer at diagnosis. Since there is less time for
the progression of the cancerous cells in more frequent screenings, the stage of
the disease at the diagnosis is that much lower. White et al made a study to
compare the advantages of annual and biennial screening strategies with respect
to certain factors. 7,840 patients attending the study were followed-up by five
years between 1996 and 2001. 5400 of these patients are subject to annual
screenings and 2440 are subject to biennial screenings. The stages of the breast
cancers at the diagnosis for those women who had received negative results from
previous screenings were derived separately for each screening strategy.
Moreover, these results are separated into age groups to see if screening interval
has different effects for women in different age groups. The results of the study is
presented as percentage of interval cancer stages encountered in annual and
biennial screening strategies for all age groups separately in Table 18. According
to the results presented, for instance, if a 50 year old woman in annual screening
strategy, who had negative mammography result in the previous screening, has
Page 57
44
positive result in the current screening than stage of her breast cancer is Stage I
with 69%, Stage II with 27% and Stage III with 4% probabilities. These
probabilities are used as the transition probabilities between screening and stage
nodes for the women who were screened before.
Table 18: Annual vs. Biennial Screening Odds Ratios in Following Screenings Interval Annual Biennial
Age <49 50-59 60-69 <49 50-59 60-69
Stage I 67% 69% 74% 62% 66% 76%
Stage II 29% 27% 23% 32% 30% 21%
Stage III 4% 4% 3% 6% 4% 3%
(White, et al., 2004)
5.3.7 False Positive Results
The goal of any screening procedure is to examine a large population of patients
and find a small number most likely to have a serious condition. These patients
are then referred for further, usually more invasive, testing. Thus a screening
exam is not intended to be definitive. It is intended to have a high sensitivity so
as to not miss any cancers. The cost of this high sensitivity is a relatively large
number of results that would be regarded as suspicious in patients without
disease. This is true for mammography. The patients called back for further
testing from a screening session are sometimes called as "false positives",
implying an error. (http://en.wikipedia.org, 2010)
The study done by Lehman et al with the attendance of 4,091 women to examine
the effect of breast density and age on false-positive mammography results
introduces that false positive rates of mammography screenings are dependent
on the age. (Lehman, et al., 1999) Relative specifities of the mammograms
derived during the study; hence the probability of having a false positive result is
Page 58
45
summarized in table 19. For instance, if a 50 year old woman who actually does
not have breast cancer goes through mammography screening, there is 9.3%
probability that she will be diagnosed with breast cancer by mistake.
Table 19: False Positive Ratios for Mammography Screening Age Group Mammogram Specificity False Positive Ratio*
40-49 90.9% 9.2%
50-59 90.7% 9.3%
60-69 91.1% 8.9%
(Lehman, et al., 1999), *False positive/ (True negative + False positive)
These false positive ratios are used as the transition probabilities between “breast
cancer negative” node and the “false positive cases” node.
Whenever a patient is diagnosed as breast cancer by mistake, some further
operations are needed to realize that she actually has no cancer, in other words
she is a false positive case. These further operations have both tangible and
intangible costs, which can be named as cost of false positive results. There are
both medical costs of these operations and intangible costs due to reduction in
the quality of life of the patient. Therefore, these costs should be estimated and
included in the simulation for getting more reliable results. Assuming that,
among women with an abnormal mammogram, 60.9% required repeat
mammography, 27.9% required ultrasound, 4.4% required fine-needle aspiration,
and 15.8% required open biopsy. Further treatment costs for false positive results
are calculated as 58 TL in 2007 prices. After one-time incurring of this cost, at the
end of the year, they are transferred back to the “breast cancer negative” node.
5.3.8 Intangible Costs
It is for sure that breast cancer is a disease that puts a great burden on society in
terms of treatment and medicine costs. As stated above, dependent on the stage
Page 59
46
that the disease is diagnosed, it incurs costs of lumpectomy, radiation therapy,
chemotherapy, mastectomy, surgery as well as the costs of medical substances
and salaries of health personnel etc. Besides these tangible and measurable costs
there are some other costs, which are hard to measure or estimate. These are
intangible costs, including a high variety of costs from the value of time lost in
treatment procedure to labor force lost due to the disease. It puts an extra burden
on the society when a woman is obliged to participate in treatment process and
thus stays away from her usual economic activities. Moreover, some breast
cancer treatment procedures such as mastectomy or surgery may cause the
patient entirely to lose some part of her body. This is called dismemberment, and
may become inappropriate to carry on her usual economic activity.
One method to measure the intangible costs of a disease, combining the mortality
rates with the morbidity and figure out an overall summary of disease’s burden
on the society is calculating quality adjusted life years. A quality adjusted life
year (QALY) takes into account both the quantity and quality of life generated by
healthcare interventions. It is basically the combination of quantity and quality of
life lived. It provides a tool for the assessment of benefits gained from a variety
of interventions in terms of health related quality of life and survival for the
patient (Philips, 2009).
In calculation of the QALY each health state is weighted by a number from 1 to 0.
A year in a perfect health state is valued as 1 and a year less than a perfect health
state is valued as less than 1. There are also some debates in literature that there
are some health states which are worse than death, thus scale of the QALY
should go further below 0. (Sassi, 2006)
The preferred instrument for the measurement and valuation of health related
quality of life in NICE (National Institute for Health and Clinical Excellence)
Page 60
47
evaluations is the EQ-5D, which measures the health state in 5 dimensions as,
mobility, pain or discomfort, self-care, anxiety or depression and usual activities.
Some examples about EQ-5D system and corresponding QALY values are
presented in table 20 below.
Table 20: EQ-5D QALY Calculation Examples
(Philips, 2009)
Quality adjusted life years lost in the time horizon of the disease for breast cancer
patients, similar to the other disease, is very much dependent on the treatment
procedure carried on. For instance, while medical treatment or chemotherapy
may cause little handicaps in five dimensions declared, surgery may cause much
more than that. Since the treatment methodology selected is related to the stage
of the breast cancer in diagnosis, QALY is also dependent on the diagnosis stage.
QALY lost in process is low when the cancer is diagnosed in early stages and can
be treated by medical treatment or chemotherapy, however if the diagnosis of the
disease falls behind to late stages, QALY lost would be much higher. Especially
breast cancer occasions diagnosed after metastasis leads to QALY values close to
zero, in other words almost equivalent to death.
Page 61
48
There are several studies in literature aiming to calculate QALY lost in the case of
breast cancer with respect to the stage that the cancer is diagnosed. These studies
endeavor to estimate the QALY by assigning a value for each treatment option
reducing the quality of life. Then by attaining these values to patients in
randomized clinical trials by grouping them according to the diagnosis stage
ends up in the separate QALY values for each stage. Table 21 illustrates the
QALY values taken from the literature that is used in our simulation model.
Table 21: QALY Lost According to Stage at Diagnosis Diagnosis Stage Stage I Stage II Stage III Stage IV Death
QALY 0.9 0.8 0.7 0.3 0.0
Lost QALY 0.1 0.2 0.3 0.7 1.0 (Wong, et al., 2007)
During the simulation QALY of the woman for each simulation year is reduced
by the lost QALY value corresponding to her diagnosis stage. In the case of a
death QALY value is reduced to zero and each year an economical burden due to
entirely lost economical activity of the women is incurred.
5.3.8.1 Expressing QALY in Monetary Units
The life quality lost due to the disease can be estimated by QALY methodology
for each patient in terms of life years. However since all quantities in our model
are expressed in monetary units, QALY should be converted to TL values as well.
We need to include increased QALY due to the screening program in monetary
units to end up in a total cost-benefit analysis.
Converting QALY to monetary units is quite simple. If how much a woman
contributes to the economy can be found, then absence of her economical activity
means same amount of burden. Therefore, first thing we need to do is to calculate
the contribution of each woman to economy. For calculating this we need gross
domestic product and employment data. Dividing gross domestic product (GDP)
Page 62
49
to working population results in economic value created per person (working
population). Table 22 below shows the GDP values for the last 10 years in 1998
values as well as the employment numbers. Third column in the Table is the
division of GDP to the working popula tion; therefore it is the economic
contribution of a person to the society. Since all cost values are measured in 2007
values, economic contribution should also be converted to 2007 values. Final
column in the Table is the converted values using consumption price index.
Table 22: GDP and GDP per Working Population in 98 prices
Year GDP
(thousand)
Working Population (thousand)
GDP per Working
Population (1988 prices)
GDP per Working
Population (2007 prices)
2009 97,087,661 21,277 4,563 51,334
2008 101,921,730 21,194 4,809 54,101
2007 101,254,625 20,738 4,883 54,929
2006 96,738,320 22,330 4,332 48,737
2005 90,499,731 22,046 4,105 46,182
2004 83,485,591 21,791 3,831 43,101
2003 76,338,193 21,147 3,610 40,611
2002 72,519,831 21,354 3,396 38,206
2001 68,309,352 21,524 3,174 35,703
2000 72,436,399 21,581 3,356 37,761 TUIK
Once economic contributions of working population in past years are found, it
can be forecasted for the following 10 years, which is our simulation length. GDP
per working population values are forecasted as in Table 23.
Page 63
50
Table 23: GDP per Working Capita Estimations
Year
GDP per Working
Capita Year
GDP per Working
Capita
2010 55,516 2015 67,524
2011 57,733 2016 70,221
2012 60,039 2017 73,025
2013 62,437 2018 75,942
2014 64,931 2019 78,975 Author’s own calculations
However, incurring these costs for each QALY lost by each woman would be
misleading, because a woman getting breast cancer may be unemployed or out of
labor force. Therefore we can incur these costs for a fraction of the women that
are still working at the time of diagnosis. To determine the correct fraction that
this cost to be incurred, labor-force participation and employment rates are
needed. The proportion of number of women that are employed in an age group
to the overall number of women in that age group indicates how much of these
costs will be included. Table 24 below is the employment rate of women in the
last 10 years, for all age groups. Using these values the probability of a diagnosed
woman, to be in working population can be calculated.
Table 24: Employment Rates of Women Year 15-
19 20-24
25-29
30-34
35-39
40-44
45-49
50-54
55-59
60-64 65+
2009 13,5 25,3 28,8 30,0 30,1 29,0 23,9 20,7 17,4 14,3 5,9
2008 13,9 25,7 28,3 28,0 29,6 26,8 23,3 19,6 16,2 13,0 5,7
2007 13,5 25,1 27,3 27,3 28,2 26,4 22,1 18,9 15,7 13,2 5,8
2006 14,7 24,8 27,5 27,0 29,2 27,9 23,9 21,4 18,3 14,5 6,6
Page 64
51
2005 15,0 25,3 26,8 26,2 28,2 27,4 24,9 21,5 18,3 15,2 7,6
2004 16,2 25,8 27,0 26,7 28,9 26,9 24,8 21,8 21,2 17,9 8,7
2003 17,4 25,7 27,9 28,0 29,0 28,0 26,1 23,1 22,9 19,2 10,4
2002 19,6 28,2 28,6 29,5 29,2 28,4 27,8 25,0 22,8 22,5 11,5
2001 19,9 28,6 28,0 29,0 28,9 28,4 26,6 25,8 22,9 19,7 12,4
2000 22,0 27,4 29,3 27,9 28,4 27,6 25,1 24,9 24,2 18,5 11,3
Source: TUIK
The results of the trend analysis are presented in the Table 25 below. These
values in Table 25 are the values used in simulation as the probability of a
women diagnosed by breast cancer to be actively working. For instance, if a
women aged 47 is diagnosed by Stage II breast cancer in 2018, each year by 22.9
percent cost of 14,605 (73,025*0.2) as the value of quality adjusted life years lost
due to breast cancer burden will be included, by 87.1 percent no QALY costs will
be incurred.
Table 25: Employment Rate Estimations Year 15-
19 20-24
25-29
30-34
35-39
40-44
45-49
50-54
55-59
60-64
65+
2010 12.9 25.1 28.7 30.3 30.3 29.2 23.8 20.3 16.9 13.9 5.59
2011 12.4 24.9 28.7 30.5 30.5 29.3 23.6 19.9 16.3 13.6 5.29
2012 11.8 24.7 28.6 30.8 30.7 29.5 23.5 19.6 15.8 13.2 5.01
2013 11.3 24.4 28.6 31 30.9 29.7 23.4 19.2 15.3 12.9 4.74
2014 10.8 24.2 28.5 31.3 31.1 29.8 23.3 18.8 14.8 12.6 4.49
2015 10.4 24 28.5 31.5 31.3 30 23.1 18.5 14.4 12.3 4.25
2016 9.93 23.8 28.4 31.8 31.5 30.2 23 18.1 13.9 12 4.03
Page 65
52
2017 9.5 23.6 28.4 32.1 31.7 30.3 22.9 17.8 13.5 11.7 3.81
2018 9.1 23.4 28.3 32.3 32 30.5 22.8 17.5 13.1 11.4 3.61
2019 8.71 23.2 28.3 32.6 32.2 30.7 22.7 17.1 12.7 11.1 3.42
Author’s own calculations
5.3.9 Survival Rates
There are two ways that the entities in the simulation leave the system; either by
death caused by breast cancer or death due to another reason. The mortality rates
due to other reasons used in the simulations are explained in section 5.3.1. The
mortality rates due to other reasons are given as constant probabilities, however
mortality rates due to breast cancer needs further analysis. For reliable
calculation of the costs and benefits, besides mortality rates, the time horizon
between the time of diagnosis and death is also needed. This is necessary to
evaluate the time spent on treatment period, and calculate tangible and
intangible costs accrued during this period.
The most convenient way encountered in literature for expressing the survival
rate for a disease is calculating ratios of the patients that succeeded to survive for
a certain time period (usually 5 years) to the all patients. According to the
American Cancer Society records, the proportions of the patients in each Stage
group who were still alive at the end of fifth year are presented as 5-year survival
rates in Table 26.
Table 26: 5-Year Survival Rates Stage 5-Year Survival Rate
Stage I 100%
Stage II 86%
Stage III 60%
Stage IV 20% (https://seer.cancer.gov, 2010)
Page 66
53
However, this data is not enough to be used in the simulation model for two
reasons. First, it is limited with five years, second it gives no information about
the mortality probabilities for interval periods. The data required for the
simulation should involve mortality probabilities of breast cancer separately for
each year for each stage at the diagnosis.
One of the most detailed analyses of breast cancer survival rate in the literature
comes from the results of the study done in West Midland, UK. 16,378 breast
cancer patients from different diagnose stages are followed up from 1990 to 2004
and relative survival rates of these patients for each year is determined.
(www.wmpho.org.uk, 2010) Figure 11 illustrates the results of the study, as the
10-year relative survival rates for breast cancer patients according to stage at
diagnosis. As can be seen from the Figure relative survival rates for late-
diagnosed breast cancer cases are very low with comparison to early-diagnosed
cases.
Figure 11: 10 Year Survival Rates (www.wmpho.org.uk, 2010)
These survival rates are calculated as conditional probabilities and should be
converted to simple probability rates to be integrated in the simulation model. In
Page 67
54
other words, rather than the probability of being alive at the end of the 4th year of
diagnosis, the probability to die exactly at the end of 4th year is needed for the
model. Table 27 contains the simple probability rates for breast cancer mortality
rates calculated using the data in the Figure 11. These values are used as the
transition probabilities between stage nodes and “death due to breast cancer”
node during simulations.
Table 27: Mortality Probabilities by Stage at Diagnosis 1 2 3 4 5 6 7 8 9 10
Stage I 0,50 1,72 2,21 1,92 1,99 1,56 0,83 1,25 0,53 0,88
Stage II 4,22 7,74 7,16 5,87 5,54 3,98 3,20 3,68 2,50 1,76
Stage III 16,99 15,97 11,21 9,79 9,99 7,22 5,04 4,74 3,52 2,57
Stage IV 55,72 34,56 31,43 22,42 15,78 11,75 12,01 8,91 10,80 9,30
Author’s own calculations
5.3.10 Simulation Length
After all the parameters and variables to be used in the simulation model are set,
it is time to decide how many years the simulation will be run to display the cost
and benefits of a population based breast cancer screening program accurately.
There are some key factors in choosing simulation length. It should be chosen
long enough to overcome the possible bias at the beginning of the program and
allow the system to approach steady-state values. However, choosing a over-long
simulation can cause some shortcomings to occur and system may fail to present
the results of the cost benefit analysis accurately. There are many parameters
used in simulation model, some of which are forecasted for future using the past
data, and some of which are assumed to be constant over time and simply the
past average values are used during the simulation. If greater simulation length
is used, values of the simulation parameters used in the model may change and
fail to reflect the real world. It is possible assumptions and forecast done during
Page 68
55
the estimation of model parameters may not hold in the long-run. Moreover,
there are also parameters that are hard to estimate for long-run such as survival
rates, since there are no such studies done in the literature previously.
Apart from these all, looking at the real-world applications also ensures one to
choose a relatively short simulation period. Health sector is a really dynamic
sector that treatment methodologies applied are changing rapidly each year
parallel to the technological and scientific developments. Therefore, projecting a
population based mammography screening program for much longer periods
would be inappropriate, since it is highly possible for mammography to be
replaced by other new screening methodologies.
Taking all these factors into consideration and taking into account the fact that
survival rate data can be reached for 10 years at most, simulation length is chosen
as 10 years, which is a long enough period to display the results of a screening
program and short enough to overcome the shortcomings.
Table 28: Simulation Length Simulation Length 10 years
5.4 Results
The simulation model was constructed by the computer software Arena 4.0 and
run for 11 scenarios to get the results. Each scenario was run for 20 replications to
overcome any bias that could occur. One replication for a scenario took
approximately 1.5 minutes; hence it took 7.5 hours in total to get all the results.
Those results are then transferred into software Microsoft Excel to derive average
values obtained from 20 replications and to construct summarized tables. The
detailed results for each scenario containing annual values for each variable
obtained are given in Appendix A. Values obtained for each year are discounted
to current year to express the total discounted burden of each scenario.
Page 69
56
Discounting was made by using 3.5 discount rate, which is the real interest rate
for December 2010.
First result obtained from the simulation model is the number of women in the
risk group for the following ten years. Given current population and mortality
rates data, the female population over 30 years is obtained as in the Table 29.
Even these very basic results are enough to put emphasize on the breast cancer
screening programs. The results display that society is aging steadily year by
year, which means that number of women in the risk group is increasing, since
breast cancer is very much dependent on the age. This is a warning about
possible increase in the breast cancer incidence rates in the following periods,
therefore a greater economic burden unless an action is taken into consideration.
Table 29: Estimated Women Population over 30 Year Women
2010 10,014
2011 10,282
2012 10,586
2013 10,889
2014 11,191
2015 11,488
2016 11,765
2017 12,035
2018 12,286
2019 12,533
The projected female population is the only result that is same for all the
scenarios applied, other results are dependent on the screening strategy used.
One of them is the percentage of early diagnosed cases. Table 30 illustrates the
early detection ratio obtained for each screening strategy. It is an expected result
that as the minimum age to screen or screening interval is increased, early
Page 70
57
detection ratio would fall. The results are somewhat supporting this expectation.
There is a sharp fall in the early detection ratio with the increased minimum
screening age, however the difference between annual and biennial screening
policies are not serious that much. For instance, when minimum screening age is
increased from 40 to 45 in biennial screening policy early detection ratio is
decreased by 22 percent, whereas a shift from biennial screening to annual
screening only results in 0.3 percent decrease. Therefore, it is much effective to
screen as many female as possible instead of screening the same individual
frequently. Another noteworthy result about early detection ratios is that while
decreasing minimum screening age results in great increase in early detection
ratios for middle aged females, the effect is comparatively less in younger or
older females.
Table 30: Early Diagnosis Ratio with respect to Screening Strategy Strategy Early (I-II) Late (III-IV)
No Screening 34.2 65.8
Annual 40+ 90.8 9.2
Annual 45+ 66.9 33.1
Annual 50+ 53.3 46.7
Annual 55+ 44.5 55.5
Annual 60+ 39.6 60.4
Biennial 40+ 91.1 8.9
Biennial 45+ 69.0 31.0
Biennial 50+ 55.3 44.7
Biennial 55+ 45.4 54.6
Biennial 60+ 40.6 59.4
Some other results obtained from simulation runs are death and quality adjusted
life year losses faced during 10 simulation years. Screening more women and
more frequently means earlier diagnosis of the cases, hence less mortality and
Page 71
58
QALY loss. Table 31, displaying death and QALY lost numbers, is supporting
this statement. While 695 thousand life years will be lost till 2019 if no screening
is done, this number would be reduced by 573 thousand by annually screening
women aged over 40. Again it is more effective to screen as many females as
possible instead of screening same individuals more frequently in terms of death
and QALY loss values.
Table 31: Death and QALY Burden by Screening Strategy (thousand)
Death QALY Lost Total
No Screen 324.6 370.7 695.2 Annual 40+ 59.5 62.4 121.9
Annual 45+ 91.6 104.4 196.0
Annual 50+ 128.9 144.2 273.1
Annual 55+ 155.7 178.2 333.9
Annual 60+ 173.0 201.3 374.3 Biennial 40+ 63.9 69.5 133.4
Biennial 45+ 99.4 110.5 209.9
Biennial 50+ 127.7 148.1 275.8
Biennial 55+ 156.6 180.1 336.6
Biennial 60+ 171.3 202.9 374.2
One burden of screening as many people as possible and more frequently is the
increased amount of screening costs. Each time an individual is screened it incurs
an extra cost which makes screening less favorable. However, there is a greater
burden caused by more frequent screening and causes frequent screenings to
become less favorable. That is the false positive results due to specificity rates of
mammograms. A false positive result is a case resulted from an abnormal
mammogram, which indicates that the patient has breast cancer while in fact she
has not. There are some further operations mentioned in previous sections to be
carried in order to realize that the woman has not breast cancer. Cost of abnormal
Page 72
59
mammograms constructs the greatest part of costs due to screening strategies.
Table 32 displays the total number of false positive results faced during 10 years
simulation. An annual screening strategy has abnormal mammogram numbers
twice as the biennial screening strategies, making them less favorable with
comparison to biennial strategies.
Table 32: Estimated Number of False Positives
Strategy Abnormal
Mammograms
No Screening 0
Annual 40+ 10,341
Annual 45+ 7,966
Annual 50+ 5,800
Annual 55+ 3,869
Annual 60+ 2,260 Biennial 40+ 5,325
Biennial 45+ 4,133
Biennial 50+ 3,046
Biennial 55+ 2,074
Biennial 60+ 1,237
Clearly the most important aspect of the simulation is the costs that are derived
from the results of the simulation for each strategy. Costs are representatives of
all of the advantages and disadvantages of a screening program in a common
unit. Costs are separated into two categories as tangible and intangible costs.
Tangible costs are direct costs spent on screening or treatment, whereas
intangible costs include the indirect costs resulting from deaths and QALY loss.
Table 33 illustrates the discounted tangible costs for each strategy. There are
some noteworthy points here. First of all when we compare the annual and
biennial screening strategies in terms of screening and treatment costs it is clearly
seen that there is almost no difference. A shift from biennial strategy to annual
Page 73
60
strategy causes an increase in the screening costs since more women are
subjected to screening. However this increase is compensated by decrease in the
treatment costs due to earlier detection of breast cancer. However, costs resulting
from the false positive cases make the distinction. As more screening means more
false positive results and more economic resources wasted, biennial screening is
favorable in terms of tangible costs. Second noteworthy point is that tangible
costs illustrate a steady decrease with the decrease in the minimum age to screen.
Hence, it is effective to screen a ll women in the risk group to minimize the
tangible burden of breast cancer.
Table 33: Tangible Costs by Screening Strategy (thousand TL) Strategy Screening
Costs Treatment
Costs Cost of
False Positives
Tangible Costs
No Screening 0 29,844,563 0 29,844,563
Annual 40+ 1,419,138 5,239,689 495,466 7,154,293
Annual 45+ 1,094,004 8,663,160 381,339 10,138,503
Annual 50+ 798,468 11,711,531 277,346 12,787,345
Annual 55+ 538,296 14,292,933 184,939 15,016,168
Annual 60+ 320,728 16,113,217 107,965 16,541,910
Biennial 40+ 745,206 5,880,476 258,375 6,884,056
Biennial 45+ 577,744 9,144,036 200,345 9,922,126
Biennial 50+ 425,254 12,089,238 147,306 12,661,798
Biennial 55+ 291,358 14,420,238 100,192 14,811,788
Biennial 60+ 177,763 16,224,469 59,542 16,461,774
Since tangible costs are close to each other, the role of intangible costs becomes
crucial in determining optimal screening strategy. Those intangible costs consist
of the economic value of life years lost due to breast cancer, either by complete
mortality or by morbidity. Unsurprisingly, intangible burden of the breast cancer
decreases with increasing screening interval and decreasing minimum screening
Page 74
61
age, in terms of both mortality and disability. Earlier the detection of the disease
by more frequent screening means less life years lost during treatment process.
The reduction in the intangible costs succeeded by screening programs is also in
favor of screening as many female as possible to decrease the overall burden of
breast cancer. For instance, applying annual screening to those women over 40
results in savings of 10 billion due to continued economical activity. This
highlights that intangible benefits are also important for screening programs in
reaching optimality.
Table 34: Intangible Costs by Screening Strategy (thousand TL) Strategy Cost of Death Cost of QALY Intangible Costs
No Screening 17,932,258 15,642,317 33,574,575
Annual 40+ 3,385,984 2,922,523 6,308,507
Annual 45+ 5,399,497 5,125,397 10,524,894
Annual 50+ 7,744,066 6,763,533 14,507,599
Annual 55+ 8,615,759 7,849,175 16,464,933
Annual 60+ 9,371,508 8,381,450 17,752,958 Biennial 40+ 3,364,691 3,262,228 6,396,654
Biennial 45+ 5,779,907 5,451,081 10,295,002
Biennial 50+ 7,225,223 6,815,978 14,041,201
Biennial 55+ 8,665,443 7,711,644 16,377,087
Biennial 60+ 9,425,296 8,340,629 17,765,924
When discounted values of all tangible and intangible costs obtained for 10 years
time are put together, total burden of each strategy forms as in Table 35. Table
displays that the optimal screening strategy for minimizing total costs is
screening all women over 40 in every 2 year. Even annual screening has more
advantages on decreasing mortality and disability rates, thus decreasing
intangible costs, and almost the same tangible costs in terms of screening and
treatment, causing much more false positive results makes this strategy
Page 75
62
unfavorable to biennial screening. Therefore, all the women over 40 should
undergo mammography screening in every two year for effective allocation of
resources in struggle with breast cancer.
Table 35: Total Costs by Screening Strategy (thousand TL) Strategy Total Costs
No Screening 63,419,138
Annual 40+ 13,462,800
Annual 45+ 20,663,397
Annual 50+ 27,294,944
Annual 55+ 31,481,101
Annual 60+ 34,294,868 Biennial 40+ 13,280,710
Biennial 45+ 20,217,128
Biennial 50+ 26,702,999
Biennial 55+ 31,188,876
Biennial 60+ 34,227,698
Page 76
63
6 CONCLUSION AND DISCUSSION
Cancer is one of the major health care problems that governments should take
care of to reduce the economic and social burden imposed to society. Recently,
cancer is the third reason behind the mortality over the whole world by 7.5
million deaths in 2004. The overall mortality numbers are dominated by low
income countries where there are greater health problems such as infectious
diseases and perinatal conditions. Excluding low income countries makes the
cancer caused mortality ratios much drastic for developing and developed world.
Cancer is the second reason behind the mortality for developing and developed
countries with approximately 20% mortality ratio. Projections for the future
mortality rates introduces that burden of the cancer will increase year by year
and by 2030 mortality proportion will be increased from 20 to 22
(http://www.who.int, 2010). Apart from the burden on the mortality and decrease
in the quality of life, cancer is a disease with great economic burden. By the year
2006 cancer expenditures is estimated as 125 euro per capita and 33 euro per
capita for Turkey. Cancer types causing much economical burden and mortality
are lung, liver, stomach and colon cancers for males and breast, lung, colon,
stomach cancers for females.
Breast cancer is the top cancer in women worldwide and is increasing
particularly in developing countries where the majority of cases are diagnosed in
later stages. It was recorded that 636,000 incident cases occurred in developed
countries and 514,000 in developing countries during 2002. Similar to other
countries, breast cancer is by far the mostly occurring cancer type in women in
Turkey as well. Breast cancer incidence rate is estimated as 35 in 100,000. This
mortality and incidence numbers forces governments to take action against it to
increase social welfare.
Page 77
64
Unlike other types of cancers breast cancer cannot be attributed to an
environmental risk factor causing the development of tumor. For instance, 80 of
the lung cancer incidences can be attached to tobacco usage, similarly stomach
cancer can be prevented by an appropriate diet. However, there is no such an
environmental risk factor causing breast cancer formation, that is controlling the
risk factor would mean controlling the cancer. The major risk factor in breast
cancer is the age, which is an uncontrollable parameter. Therefore, reducing the
burden of breast cancer cannot be done by decreasing incidence rates by
controlling risk factors, but it can only be done by early diagnosis of the cases.
Early diagnosis of the breast cancer is crucial in choosing treatment strategies,
economical resources spent in treatment process and mortality rates. Diagnosing
breast cancer in late stages causes higher treatment costs usually with low
survival rates.
In struggle with breast cancer governments should look for the effective policies
to provide the early diagnosis of the disease. There are two advantages of early
diagnosis in economical terms. First the treatment costs will be reduced due to
treatment strategies applied to the patient, and second the economical burden
due to terminated economical activity of the patients will be less due to reduced
mortality and disability. Only way to provide early diagnosis for breast cancer is
screening. Screening can be done by mammography, ultrasound or clinical breast
examination. Most widely used, cheaper and effective tool for screening is
mammography screening. Governments should implement population based
mass screening policies to reduce the burden of breast cancer. Most of the EU
countries recently have population based breast cancer screening programs.
Therefore, such a screening program can be implemented in Turkey to reduce the
burden of breast cancer.
Page 78
65
A real world simulation model is constructed to test for the economical
effectiveness of a population based breast cancer mammography screening
program in this thesis. Besides the economical effectiveness of the screening
program, most effective screening strategy in terms of screening interval and
minimum age to screen is investigated. The databases of World Bank, World
Health Organization, International Money Fund, Turkish Institute of Statistics
and Turkish Republic Ministry of Health, survey results from Cancer Early
Diagnoses and Treatment Centers from different districts of Turkey, namely
Antalya, Kayseri, Ankara, Ordu, Denizli, Konya, Bursa, Balıkesir, Sivas, hospital
records of Aegen University Hospital and Ankara Numune Hospital and results
of the some studies in the literature are used to decide for the optimal screening
strategy for Turkey. Optimality is sought in two aspects; one is the tangible
economic costs such as screening and treatment costs, and the other is the
intangible costs such as the economic values of the life years lost due to breast
cancer.
10 years simulation run results indicate that biennial screening of females over 40
is effective in terms of tangible costs and annual screening of females over 40 is
effective for intangible considerations. Combining these two aspects and looking
for an overall burden of the screening strategies indicates that the optimal
strategy for breast cancer screening is to biennially screening women over 40.
National program against breast cancer burden prepared by Ministry of Health
suggest the biennial screening for females over 50. Therefore this study belies the
national policy against breast cancer in terms of minimum screening age. Results
of the surveys obtained from Cancer Early Diagnosis and Treatment Centers
implies that risk group for breast cancer is not limited with women over 50, and
especially in recent years number of breast cancer cases encountered in females
Page 79
66
below 50 is quite high. Therefore, results of this thesis suggest the revision of
national policy in breast cancer screening to include all women over 40.
Further analysis of the results obtained by the simulation indicates that the
biggest handicap of the annual screening policies against biennial screening
policies is the higher false positive rates which results in higher false positive
costs. A development in technology may lead the mammogram specificities to
increase which will end up in lower false positive cases. In such an environment
annual screening strategies may prevail over the biennial screening policies and
the optimality may change. Therefore optimal screening strategy should be
tested each year to see if there is a shift due to environmental factors.
The model constructed here is run for only 10 years due to reasons mentioned in
simulation length section. However, results of the simulation indicate that
screening more individuals today means trading today’s money for future’s
benefits. 10 year may be insufficient for completely displaying the future benefits
and longer simulation runs may result in a change in optimal strategy from
biennial to annual. Therefore, if necessary data can be obtained the simulation
should be run for longer periods until it reaches steady-state values, and analyze
whether there is a shift in the optimal strategy.
Another shortcoming of the study is that the model cannot be run for alternative
strategies due to lack of adequate data sources. Optimality of the screening
strategies are tested in terms of minimum age to screen, but optimality could not
be tested in terms of maximum age to screen. Screening females over a specific
age may be economically inefficient due to lower life expectancies and lower
conditional incidence probabilities. Results of the simulation are somehow
supporting this idea such that, difference in costs between screening strategies
for over 60 and over 55 aged females are low with respect to the difference
Page 80
67
between screening strategies over 40 and 45 aged females. This points out that
screening higher aged women brings less economical benefit with respect to
screening lower aged females. Therefore, if adequate data source can be found
screening strategies should also be tested for maximum age considerations.
A major issue which is not discussed so far is the practically applicability of the
breast cancer screening programs. Theoretically, it is found out that biennially
screening all the females in the risk group provides economic efficiency.
However, is it possible to screen 20 million individuals in a year? Are there
enough resources to apply these strategies? The answers to these questions are
probably negative. Resources, in terms of facilities, mammography equipment
and physicians recently are insufficient to screen that much individual a year.
However, these theoretically optimality may be infeasible in real world. If the
optimality is out of the possibility, then the closest point to the optimality in
possibility can be used as a proxy to optimality. Screening as many females as
possible in the risk group minimizes the economic burden of breast cancer. If the
resources are insufficient to screen many individuals, then new investments can
be done and number of women included in the screening program can be
increased gradually. Moreover, although it is hard to demonstrate in
mathematical modeling there are other risk factors that may affect the breast
cancer probabilities. Women having those risk factors may have priority in
screening since they have higher risk to develop breast cancer. Those risk factors
include genetic heritage, age of first birth and menstruation, obesity and diet etc.
Mammography screening also can be supported by other screening
methodologies to obtain higher efficiency. Those other methodologies include
ultrasound, clinical breast examinations and self examinations. Women should
be educated on importance of the breast cancer and how to apply self
examination, and awareness should be created to provide sustainability.
Page 81
68
Finally, supplementary policies should be undertaken to provide the efficiency of
the screening program. There should be a force to make all individuals to attend
screening program. Efficiency of the screening program should be fenced by
laws, legislations, rules and penalties. Women should be obliged to attend
screening programs by making laws similar to the ones in Germany and France.
In these countries women not attending the screening programs are expelled
from the scope of social security for any breast cancer related diseases.
Doubtlessly, in order to implement such a strategy and also in order to collect
data for further analysis national cancer registry system should be developed.
Page 82
69
BIBLIOGRAPGY
Ames Bruce N., Gold Luis Swirsky and Willett Walter C. The Causes and Prevention of Cancer [Journal] // Proc. Natl. Acad. Sci.. - 1995. - pp. 5258-5265.
Anderson Benjamin O. and Jakesz Raimund Breast Cancer Issues in Developing Countries: An Overview of the Breast Health Global Initiative [Journal] // World Journal of Surgery. - 2008.
Andiçen Cancer Early Diagnosis and Treatment Center Survey Results. - 2010.
Antalya Cancer Early Diagnosis and Treatment Center Survey Results. - 2010.
Bakanlığı T.C. Sağlık Ulusal Hastalık Yükü ve Maliyet Etkililik Projesi, Hastalık Yükü Final Raporu [Report]. - Ankara : T.C. Sağlık Bakanlığı Refik Saydam Hıfzıssıhha Merkezi Başkanlığı Hıfzıssıhha Mektebi Müdürlüğü, 2007.
Baker DB [et al.] A health study of two communities near the Stringfellow waste disposal site [Journal] // Archives of Environmental Health. - 1988. - pp. 325-334.
Balıkesir Cancer Early Diagnosis and Treatment Center Survey Results. - 2010.
Boyle Peter and Levin Bernard World Cancer Report 2008 [Book]. - Lyon : International Agency for Research on Cancer, 2008.
Breast Cancer Screening With Mammography In Women Aged 40-49 Years [Report]. - Falun,Sweden : Wiley, 1996.
Bursa Cancer Early Diagnosis and Treatment Center Survey Results. - 2010.
Coleman MP [et al.] Cancer survival in five continents: a worldwide population-based study [Journal]. - [s.l.] : The Lancet Oncology, 2008.
Corsetti Vittorio [et al.] Breast screening with ultrasound in women with mammography-negative dense breasts: Evidence on incremental cancer detection and false positives, and associated cost [Journal] // European Journal of Cancer. - 2008. - pp. 539-544.
Demirkazık Ahmet and Karaoğuz Handan Kanser'den Korunma [Journal] // T Klin Tıp Bilimleri. - 1992.
Page 83
70
Denizli Cancer Early Diagnosis and Treatment Center Survey Results. - 2010.
Eastaugh Steven R. Health economics : Efficiency, Quality, and Equity . [Book]. - Westport : Auburn House, 1992.
Elmore Joann G. [et al.] Screening for Breast Cancer [Journal] // Jama. - 2010.
Eser Sultan [et al.] 2004-2006 Yılları Arası Türkiye Kanser İnsidansı [Report]. - [s.l.] : Sağlık Bakanlığı, Kanserle Savaş Dairesi Başkanlığı.
Fidaner Caner Kanser'de Erken Yakalama: Erken Tanı ve Taramalar [Book Section] // Türkiye'de Kanser Kontrolü. - Ankara : Onur Matbaacılık, 2007.
Fryback Dennis G. and Craig Benjamin D. Measuring Economic Outcomes of Cancer [Journal] // Journal of the National Cancer Institute Monographs. - 2004.
Garcia M. [et al.] Global Cancer Facts and Figures 2007 [Book]. - Atlanta : American Cancer Society, 2007.
Getzche Peter C. and Nielsen Margrethe Screening for Breast Cancer With Mammography (Review) [Article]. - [s.l.] : Wiley, 2009.
Getzen Thomas E. Health Economics and Financing [Book]. - Hoboken : Wiley, 2007.
Haes J.C.J.M. De [et al.] The Impact of Breast Cancer Screening Programme on Quality Adjusted Life-years [Journal] // International Journal of Cancer. - 1991. - pp. 538-544.
Hakama Matti [et al.] Cancer screening: Evidence and practice in Europe 2008 [Journal] // European Journal of Cancer. - 2008. - pp. 1404-1413.
Haydaroğlu A. [et al.] Ege Üniversitesin'de Meme Kanserleri: 3897 Olgunun Değerlendirilmesi [Article]. - 2005.
Hillman Arye L. Public Finance and Public Policy : Responsibilities and Limitations of Government [Book]. - Cambridge : Cambridge University Press, 2003.
http://en.wikipedia.org [Online] // http://en.wikipedia.org/wiki/Breast_cancer. - 2010.
Page 84
71
http://en.wikipedia.org [Online] // http://en.wikipedia.org/wiki/Mammography. - 2010.
http://en.wikipedia.org [Online] // http://en.wikipedia.org/wiki/Health. - 2009.
http://en.wikipedia.org http://en.wikipedia.org [Online] // http://en.wikipedia.org/wiki/Cancer#cite_note-Kinz-3. - 2010.
http://www.atsdr.cdc.gov [Online] // http://www.atsdr.cdc.gov/COM/cancer-fs.html. - 2010.
http://www.cancer.gov [Online] // http://www.cancer.gov/cancertopics/types/breast. - 2010.
http://www.cancer.gov [Online] // http://www.cancer.gov/cancertopics/what-is-cancer. - 2010.
http://www.imaginis.com [Online] // http://www.imaginis.com/breast-cancer-resource-center. - 2010.
http://www.medicinenet.com [Online] // http://www.medicinenet.com/breast_cancer/article.htm. - 2010.
http://www.netwellness.org [Online] // http://www.netwellness.org/healthtopics/breastcancer/qa1.cfm. - 2010.
http://www.nlm.nih.gov [Online] // http://www.nlm.nih.gov/medlineplus/breastcancer.html#cat1. - 2010.
http://www.webmd.com [Online] // http://www.webmd.com/breast-cancer/guide/stages-breast-cancer. - 2009.
http://www.who.int [Online] // http://www.who.int/healthinfo/global_burden_disease/projections/en/index.html. - 2010.
http://www.who.int [Online] // http://www.who.int/cancer/detection/en/. - 2010.
http://www.who.int [Online] // http://www.who.int/healthinfo/statistics/mortestimatesofdeathbycause/en/index.html. - 2010.
Page 85
72
http://www.who.int [Online] // http://www.who.int/mediacentre/factsheets/fs297/en/index.html. - 2010.
Hunter David J. Public Health Policy [Book]. - Cambridge : Polity, 2003.
Jack William Principles of Health Economics for Developing Countries [Book]. - Washington : World Bank, 1999.
Jamison Dean T. [et al.] Disease Control Priorities in Developing Countries [Book]. - Washington : Oxford University Press, 2006.
Kadınlar'da Meme Kanseri Taramaları İçin Ulusal Standartlar [Report]. - [s.l.] : Ulusal Kanser Danışma Kurulu, 2004.
Kanser Tedavisi [Journal] // The Cancer Council Victoria. - 2004.
Kayseri Cancer Early Diagnosis and Treatment Center Survey Results. - 2010.
Konya Cancer Early Diagnosis and Treatment Center Survey Results. - 2010.
Lehman Constance D. [et al.] Effect ofAge and Breast Density on Screening Mammograms with False-Positive Findings [Article]. - 1999.
Lopez Alan D. [et al.] Global Burden of Disease and Risk Factors [Book]. - 2006 : Oxford University Press, Washington.
Mandelblatt Jeanne S. [et al.] Benefits and Costs of Interventions to Improve Breast Cancer Outcomes in African American Women [Journal] // Journal of Clinical Oncology. - 2004. - pp. 2554-2566.
Mason Helen, Jones-Lee Micheal and Donaldson Cam Modelling the Monetary Value of a QALY: A New Approach Based On UK Data [Journal] // Health Economics. - 2009. - pp. 933-950.
McPake Barbara Health economics : An International Perspective [Book]. - London : Routledge, 2002.
Miltenburg GAJ [et al.] Seventeen-year evaluation of breast cancer screening: the DOM project, The Netherlands [Article]. - 1998. - pp. 962-965.
OECD Reviews of Health Systems: Turkey [Report]. - [s.l.] : World Bank, 2008.
Page 86
73
Ohnuki Koji [et al.] Cost-effectiveness analysis of screening modalities for breast cancer in Japan with special reference to women aged 40–49 years [Article]. - 2006.
Okonkwo Quirine Lamberts [et al.] Breast Cancer Screening Policies in Developing Countries: A Cost-effectiveness Analysis for India [Journal] // Journal of National Cancer Inst. - 2008.
Oltra Amparo [et al.] Cost-Benefit Analysis of a Follow-up Program in Patients with Breast Cancer: A Randomized Prospective Study [Journal] // The Breast Journal. - 2007. - pp. 571-574.
Ordu Cancer Early Diagnosis and Treatment Center Survey Results. - 2010.
Özen Emire Tarihçe, Kanserle Savaşın Ülkemizdeki Geçmişi [Book Section] // Türkiye'de Kanser Kontrolü. - Ankara : Onur Matbaacılık, 2007.
Özmen Vahit [et al.] Breast cancer risk factors in Turkish women – a University Hospital based nested case control study [Journal] // World Journal of Surgical Oncology. - 2009.
Özmen Vahit [et al.] Türkiye'de Meme Kanseri Erken Tanı ve Tarama Programlarının Hazırlanması [Journal] // The Journal of Breast Health. - 2009.
Özmen Vahit Breast Cancer in the World and Turkey [Journal] // Journal of Breast Health.
Özmen Vahit Dünya'da ve Türkiye'de Meme Kanseri Tarama ve Kayıt Programları [Book Section] // Türkiye'de Kanser Kontrolü. - Ankara : Onur Matbaacılık, 2007.
Parkin Alistar D and Yule B Aggregate health care expenditures and national income:: Is health care a luxury good? [Journal] // Journal of Health Economics. - 1987.
Peer Petronella G.M. [et al.] Age-Dependent Growth Rate of Primary Breast Cancer [Journal] // Cancer. - 1993.
Philips Ceri What is QALY [Article] // What is Series. - 2009.
Poterba James M. Government Intervention in the Markets for Education and Health Care: How and Why [Book Section].
Page 87
74
Radice Davide and Redaelli Alberto Breast Cancer Management: Quality-of-Life and Cost Considerations [Article]. - 2003.
Rice Dorothy P., H.A. F.A.P. and Cooper Barbara S. The Economic Value Of Human Life [Journal] // A.J.P.H. - 1967.
Rice Thomas H. The Economics of Health Reconsidered [Book]. - Chigago : Health Administration Press, 2003.
Rojnik Klemen [et al.] Probabilistic Cost-Effectiveness Modeling of Different Breast Cancer Screening Policies in Slovenia [Article]. - 2008.
Santerre Rexford E. Health economics : Theories, Insights, and Industry Studies [Book]. - Ohio : Thomson, 2007.
Sarvazyan A. [et al.] Cost-Effective Screening for Breast Cancer Worldwide: Current State and Future Directions [Journal] // National Institute of Cancer. - 2008.
Sassi Franco Calculating QALYs, Comparing QALY and DALY Calculations [Report]. - London : Oxford University Press, 2006.
seer.cancer.gov [Online] // seer.cancer.gov. - 2010.
Seppanen Johanna Mammographic Mass-screening and Future Breast Cancer Burden in Finland. - Helsinki : University of Helsinki, 2008.
Shapiro Sam [et al.] Breast Cancer Screening Programmes in 22 Countries: Current Policies Administrations and Guidelines [Journal] // International Journal of Epidemiology. - 1998. - pp. 735-742.
Sivas Cancer Early Diagnosis and Treatment Center Survey Results. - 2010.
Sönmez Sinan Kamu Ekonomisi Teorisi : Kamu Harcamalarında Etkinlik Arayışı [Book]. - Ankara : Teori Yayınları, 1987.
Stiglitz Joseph E. Kamu Kesimi Ekonomisi [Book]. - İstanbul : Marmara Üniversitesi, 1994.
T.C. Ankara Numune Hospital Records. - 2007.
Page 88
75
Tatar Mehtap and Şahin İsmet Türkiye'de Kanser Harcamaları [Book Section] // Türkiye'de Kanser Kontrolü. - Ankara : Onur Matbaacılık, 2007.
Tina Shih Ya-Chen and Halpern Micheal T. Economic Evaluations of Medical Care Interventions for Cancer Patients: How, Why, and What Does it Mean [Journal] // A Cancer Journal for Clinicians. - 2008. - pp. 231-244.
Tuncer Murat Ulusal Kanser Programı 2009-2015 [Report]. - [s.l.] : T.C. Sağlık Bakanlığı Kanserle Savaş Dairesi Başkanlığı, 2009.
White Emily [et al.] Biennial Versus Annual Mammography and the Risk of [Article]. - 2004.
Wonderling David Introduction to Health Economics [Book]. - Maidenhead : Open University Press, 2005.
Wong Irene O.L. [et al.] Cost Effectiveness of Mammography Screening for Chinese Women [Article]. - 2007.
www.ketem.org [Online] // www.ketem.org. - 2010.
www.mayoclinic.com [Online] // http://www.mayoclinic.com/health/breast-cancer/. - May 2010.
www.who.org [Online] // www.who.org. - 2010.
www.wmpho.org.uk [Online] // www.wmpho.org.uk/wmciu. - 2010.
Yalçın Eser Sultan Kanser Kayıtçılığı ve Kanser Kayıt Merkezleri [Book Section] // Türkiye'de Kanser Kontrolü. - Ankara : Onur Matbaacılık, 2007.
Yılmaz Hakkı Hakan and Yazıhan Nuray Türkiye'de Meme Kanseri Ekonomik Etkinlik ve Maliyet Etkililik [Book Section] // Türkiye'de Kanser Konrtolü. - Ankara : Onur Matbaacılık, 2007.
Yılmaz Hakkı Hakan Ulusal Kanser Kurumu Kurulması Projesi Değerlendirme Raporu [Article]. - Ankara : Tepav, 2009.
Yılmaz Hakkı Hakan Ulusal Kanser Kurumu Projesi Nihai Raporları [Report]. - Ankara : Tepav, 2009.
Page 89
Appendix A: Detailed Results of Simulation Runs
A.1 No Screening
Screen Detected Breast Cancer Clinically Diagnosed Breast Cancer
Year Women
Screened StageI StageII StageIII StageIV StageI StageII StageIII StageIV False
Positives Death QALY Lost
2010 0 0.0 0.0 0.0 0.0 7.4 33.3 77.1 5.9 0 17.9 34.6 2011 0 0.0 0.0 0.0 0.0 10.3 36.2 75.6 6.0 0 29.7 35.1 2012 0 0.0 0.0 0.0 0.0 9.4 33.6 78.1 5.6 0 34.9 35.0 2013 0 0.0 0.0 0.0 0.0 10.5 34.4 79.0 5.9 0 34.8 35.7 2014 0 0.0 0.0 0.0 0.0 9.2 36.2 81.3 6.2 0 43.7 36.8 2015 0 0.0 0.0 0.0 0.0 7.8 36.0 83.1 6.5 0 38.2 37.4 2016 0 0.0 0.0 0.0 0.0 8.3 37.1 85.6 7.6 0 31.6 39.2 2017 0 0.0 0.0 0.0 0.0 10.4 38.1 85.3 7.0 0 37.3 39.1 2018 0 0.0 0.0 0.0 0.0 10.4 39.1 86.6 6.8 0 30.8 39.6 2019 0 0.0 0.0 0.0 0.0 8.6 39.8 82.2 6.7 0 26.0 38.2
76
Page 90
Year Women
Screened Screening
Cost Treatment
Cost
Cost of False
Positive Tangible
Costs Cost of Death
Cost of Lost
QALY Intangible
Costs Total Costs
2010 0 0 836,335 0 836,335 17.9 281.7 299.5 836,635 2011 0 0 1,544,308 0 1,544,308 47.5 539.4 586.8 1,544,895 2012 0 0 2,175,188 0 2,175,188 82.0 781.5 863.5 2,176,051 2013 0 0 2,796,546 0 2,796,546 116.4 1,028.2 1,144.6 2,797,690 2014 0 0 3,436,692 0 3,436,692 159.6 1,267.9 1,427.5 3,438,119 2015 0 0 4,017,029 0 4,017,029 197.0 1,524.3 1,721.3 4,018,751 2016 0 0 4,673,491 0 4,673,491 227.6 1,815.1 2,042.7 4,675,534 2017 0 0 5,388,709 0 5,388,709 263.6 2,092.4 2,355.9 5,391,064 2018 0 0 6,082,451 0 6,082,451 292.8 2,388.5 2,681.3 6,085,132 2019 0 0 6,779,406 0 6,779,406 316.9 2,688.3 3,005.1 6,782,412
77
Page 91
A.2 Annual Screening Women over 40
Screen Detected Breast Cancer Clinically Diagnosed Breast Cancer
Year Women
Screened StageI StageII StageIII StageIV StageI StageII StageIII StageIV False
Positives Death QALY Lost
2010 10,014 21.0 37.0 10.9 4.8 0.0 0.0 0.0 0.0 912 6.9 16.1 2011 10,282 18.5 9.9 1.8 0.4 0.0 0.0 0.0 0.0 937 7.7 4.6 2012 10,586 20.1 8.3 2.1 0.3 0.0 0.0 0.0 0.0 988 7.5 4.5 2013 10,889 21.0 10.8 1.8 0.2 0.0 0.0 0.0 0.0 998 6.0 4.9 2014 11,191 23.1 11.4 1.7 0.5 0.0 0.0 0.0 0.0 1,030 6.7 5.4 2015 11,488 22.8 11.7 2.0 0.5 0.0 0.0 0.0 0.0 1,054 6.7 5.5 2016 11,765 24.0 9.9 1.7 0.3 0.0 0.0 0.0 0.0 1,072 4.3 5.1 2017 12,035 24.4 11.4 2.3 0.4 0.0 0.0 0.0 0.0 1,097 6.7 5.6 2018 12,286 21.6 10.4 2.1 0.3 0.0 0.0 0.0 0.0 1,126 3.8 5.0 2019 12,533 26.3 10.5 2.0 0.6 0.0 0.0 0.0 0.0 1,126 3.4 5.7
78
Page 92
Year Women
Screened Screening
Cost Treatment
Cost
Cost of False
Positive Tangible
Costs Cost of Death
Cost of Lost
QALY Intangible
Costs Total Costs
2010 10,014 152,213 302,248 52,916 507,377 6.9 132.2 139.1 507,516 2011 10,282 156,292 363,950 54,343 574,585 14.5 157.3 171.8 574,757 2012 10,586 160,900 427,716 57,304 645,919 22.0 182.6 204.6 646,124 2013 10,889 165,511 502,530 57,907 725,948 27.9 218.8 246.7 726,195 2014 11,191 170,105 594,717 59,717 824,539 34.6 258.6 293.1 824,833 2015 11,488 174,612 685,318 61,106 921,036 41.1 300.4 341.5 921,378 2016 11,765 178,832 769,678 62,196 1,010,706 45.3 342.0 387.2 1,011,093 2017 12,035 182,925 874,251 63,652 1,120,828 51.8 383.3 435.0 1,121,263 2018 12,286 186,740 957,881 65,334 1,209,956 55.3 424.0 479.3 1,210,435 2019 12,533 190,504 1,063,965 65,325 1,319,794 58.5 473.0 531.5 1,320,326
79
Page 93
A.3 Annual Screening Women Over 45
Screen Detected Breast Cancer Clinically Diagnosed Breast Cancer
Year Women
Screened StageI StageII StageIII StageIV StageI StageII StageIII StageIV False
Positives Death QALY Lost
2010 7,717 16.3 27.6 9.0 3.6 1.2 4.9 10.9 0.6 697 6.5 17.1 2011 7,908 13.6 6.9 1.3 0.2 1.7 5.9 11.7 0.6 722 10.2 8.4 2012 8,143 15.1 7.6 1.2 0.3 1.2 6.4 13.3 0.9 748 10.8 9.5 2013 8,386 15.0 7.1 2.1 0.2 1.5 6.2 12.8 1.0 770 10.7 9.6 2014 8,612 16.4 7.6 1.4 0.3 1.4 5.9 12.4 1.0 779 11.6 9.4 2015 8,838 16.7 8.5 1.7 0.3 1.9 6.8 12.9 1.1 811 9.3 10.2 2016 9,065 16.2 7.9 2.0 0.2 1.5 5.6 13.3 0.7 825 7.0 9.7 2017 9,283 17.3 7.9 1.2 0.3 2.1 6.5 12.9 1.0 847 10.7 9.9 2018 9,504 16.5 8.8 1.4 0.2 1.6 5.6 13.2 1.0 873 8.0 9.9 2019 9,725 17.8 8.1 1.2 0.5 1.8 5.7 15.3 1.1 894 7.0 10.7
80
Page 94
Year Women
Screened Screening
Cost Treatment
Cost
Cost of False
Positive Tangible
Costs Cost of Death
Cost of Lost
QALY Intangible
Costs Total Costs
2010 7,717 117,298 352,743 40,423 510,464 6.5 143.5 149.9 510,614 2011 7,908 120,199 513,017 41,885 675,101 16.7 198.7 215.3 675,317 2012 8,143 123,779 673,894 43,361 841,034 27.5 263.2 290.6 841,324 2013 8,386 127,466 834,096 44,657 1,006,218 38.1 328.6 366.7 1,006,585 2014 8,612 130,896 987,572 45,208 1,163,676 49.5 393.2 442.7 1,164,119 2015 8,838 134,341 1,149,389 47,029 1,330,759 58.6 470.8 529.4 1,331,288 2016 9,065 137,793 1,322,690 47,865 1,508,347 65.4 547.4 612.8 1,508,960 2017 9,283 141,105 1,508,187 49,114 1,698,406 75.9 618.7 694.6 1,699,101 2018 9,504 144,465 1,674,383 50,617 1,869,464 83.4 694.5 777.9 1,870,242 2019 9,725 147,815 1,874,287 51,878 2,073,980 90.0 779.0 869.0 2,074,849
81
Page 95
A.4 Annual Screening Women Over 50
Screen Detected Breast Cancer Clinically Diagnosed Breast Cancer
Year Women
Screened StageI StageII StageIII StageIV StageI StageII StageIII StageIV False
Positives Death QALY Lost
2010 5,489 10.1 18.6 5.1 2.6 2.7 10.6 23.9 1.8 502 7.8 18.8 2011 5,697 10.7 5.2 1.1 0.4 3.0 9.8 23.5 2.0 519 13.9 13.3 2012 5,906 11.4 6.1 1.0 0.4 3.4 10.7 24.7 1.9 536 14.5 14.1 2013 6,106 10.8 5.5 1.0 0.3 2.8 10.1 23.8 1.3 553 16.2 13.0 2014 6,290 11.6 5.0 1.1 0.3 2.9 11.3 24.9 1.7 562 16.0 13.9 2015 6,480 10.9 5.8 1.2 0.3 2.9 11.4 24.3 1.8 589 13.6 13.9 2016 6,669 11.7 5.8 1.3 0.4 2.9 11.0 24.1 2.1 610 13.1 14.1 2017 6,845 11.8 5.3 1.2 0.0 3.2 11.8 22.1 1.7 637 12.7 13.1 2018 7,023 12.4 6.3 1.3 0.4 2.8 12.0 25.5 1.6 637 10.9 14.6 2019 7,195 12.6 6.3 1.2 0.4 3.0 10.9 27.7 2.2 655 10.3 15.4
82
Page 96
Year Women
Screened Screening
Cost Treatment
Cost
Cost of False
Positive Tangible
Costs Cost of Death
Cost of Lost
QALY Intangible
Costs Total Costs
2010 5,489 83,433 408,617 29,104 521,154 7.8 156.2 164.0 521,318 2011 5,697 86,591 668,867 30,122 785,580 21.6 247.8 269.4 785,849 2012 5,906 89,777 905,893 31,062 1,026,731 36.0 345.5 381.5 1,027,113 2013 6,106 92,815 1,128,314 32,077 1,253,206 52.1 427.7 479.8 1,253,686 2014 6,290 95,614 1,349,257 32,622 1,477,493 68.0 518.4 586.4 1,478,079 2015 6,480 98,490 1,570,408 34,148 1,703,045 81.4 620.7 702.1 1,703,748 2016 6,669 101,371 1,807,265 35,386 1,944,022 94.4 722.6 817.0 1,944,839 2017 6,845 104,042 2,030,638 36,920 2,171,601 106.7 816.6 923.3 2,172,524 2018 7,023 106,748 2,294,270 36,955 2,437,972 117.1 928.1 1,045.2 2,439,018 2019 7,195 109,362 2,584,904 37,981 2,732,247 127.0 1,049.3 1,176.3 2,733,423
83
Page 97
A.5 Annual Screening Women Over 55
Screen Detected Breast Cancer Clinically Diagnosed Breast Cancer
Year Women
Screened StageI StageII StageIII StageIV StageI StageII StageIII StageIV False
Positives Death QALY Lost
2010 3,642 6.2 11.1 3.3 1.4 3.3 16.0 31.4 2.8 328 9.4 19.6 2011 3,787 6.5 2.9 0.4 0.0 3.6 14.0 33.9 2.7 342 14.7 16.5 2012 3,937 5.7 3.0 0.7 0.1 3.7 14.9 34.1 3.2 350 16.1 17.2 2013 4,091 6.7 3.9 0.6 0.1 3.8 15.0 31.2 2.1 373 17.6 15.8 2014 4,244 7.0 3.2 0.5 0.1 3.5 14.5 33.6 3.2 386 20.1 17.1 2015 4,391 7.9 3.2 1.0 0.2 5.1 14.6 34.0 2.6 397 16.4 17.2 2016 4,520 7.7 3.8 0.8 0.2 4.3 16.9 34.7 3.5 411 14.3 18.5 2017 4,657 8.1 3.5 0.8 0.2 4.1 16.6 37.4 2.5 418 17.8 18.6 2018 4,790 8.2 4.1 1.0 0.2 4.2 15.0 36.2 3.0 424 15.9 18.4 2019 4,930 8.0 3.7 0.9 0.3 4.7 17.3 36.9 3.3 441 13.7 19.3
84
Page 98
Year Women
Screened Screening
Cost Treatment
Cost
Cost of False
Positive Tangible
Costs Cost of Death
Cost of Lost
QALY Intangible
Costs Total Costs
2010 3,642 55,358 441,064 19,050 515,473 9.4 159.2 168.6 515,641 2011 3,787 57,555 774,515 19,824 851,895 24.1 278.2 302.3 852,197 2012 3,937 59,849 1,079,820 20,294 1,159,964 40.1 398.5 438.6 1,160,402 2013 4,091 62,183 1,351,854 21,660 1,435,698 57.7 503.4 561.0 1,436,259 2014 4,244 64,510 1,626,964 22,365 1,713,840 77.7 613.7 691.4 1,714,531 2015 4,391 66,737 1,901,842 23,000 1,991,579 94.0 737.4 831.4 1,992,410 2016 4,520 68,709 2,215,623 23,838 2,308,170 108.0 877.7 985.7 2,309,156 2017 4,657 70,780 2,562,315 24,247 2,657,342 125.2 1,009.1 1,134.3 2,658,476 2018 4,790 72,813 2,875,176 24,583 2,972,571 140.6 1,140.9 1,281.5 2,973,853 2019 4,930 74,937 3,213,120 25,558 3,313,614 153.8 1,285.8 1,439.6 3,315,054
85
Page 99
A.6 Annual Screening Women Over 60
Screen Detected Breast Cancer Clinically Diagnosed Breast Cancer
Year Women
Screened StageI StageII StageIII StageIV StageI StageII StageIII StageIV False
Positives Death QALY Lost
2010 2,158 3.3 5.6 2.2 0.6 4.8 15.9 38.7 2.6 191 9.2 19.6 2011 2,249 3.8 1.6 0.5 0.1 4.0 17.3 40.0 3.5 198 18.4 19.2 2012 2,330 4.3 1.5 0.3 0.2 3.4 17.8 40.1 3.5 210 17.1 19.3 2013 2,423 4.1 2.0 0.6 0.1 4.9 17.9 41.7 3.8 214 20.5 20.3 2014 2,515 3.9 2.2 0.6 0.1 5.3 19.6 40.5 2.9 218 24.2 19.6 2015 2,610 3.8 2.4 0.5 0.2 5.2 18.8 41.8 3.4 231 18.7 20.3 2016 2,703 4.2 2.2 0.5 0.2 4.9 18.8 38.7 3.4 238 16.4 19.3 2017 2,795 5.4 2.0 0.7 0.2 5.5 19.0 42.4 3.2 246 19.5 20.5 2018 2,874 4.9 2.5 0.6 0.3 5.3 18.8 44.3 4.5 256 15.4 22.0 2019 2,972 3.9 2.3 0.8 0.1 6.5 19.9 44.6 3.1 258 14.0 21.3
86
Page 100
Year Women
Screened Screening
Cost Treatment
Cost
Cost of False
Positive Tangible
Costs Cost of Death
Cost of Lost
QALY Intangible
Costs Total Costs
2010 2,158 32,802 467,932 11,093 511,826 9.2 162.0 171.1 511,997 2011 2,249 34,189 858,425 11,458 904,072 27.5 295.6 323.1 904,395 2012 2,330 35,411 1,178,285 12,154 1,225,850 44.6 434.2 478.8 1,226,329 2013 2,423 36,827 1,539,969 12,427 1,589,222 65.0 573.4 638.4 1,589,860 2014 2,515 38,233 1,868,201 12,656 1,919,089 89.0 695.6 784.6 1,919,873 2015 2,610 39,664 2,176,188 13,386 2,229,239 107.5 843.3 950.7 2,230,189 2016 2,703 41,089 2,493,088 13,827 2,548,003 123.4 982.7 1,106.0 2,549,109 2017 2,795 42,477 2,871,873 14,288 2,928,639 142.2 1,128.1 1,270.3 2,929,909 2018 2,874 43,689 3,247,039 14,836 3,305,564 157.0 1,295.6 1,452.6 3,307,016 2019 2,972 45,170 3,651,737 14,967 3,711,873 170.3 1,459.1 1,629.3 3,713,503
87
Page 101
A.7 Biennial Screening Women over 40
Screen Detected Breast Cancer Clinically Diagnosed Breast Cancer
Year Women
Screened StageI StageII StageIII StageIV StageI StageII StageIII StageIV False
Positives Death QALY Lost
2010 10,014 19.8 40.0 11.0 5.2 0.0 0.0 0.0 0.0 906 6.6 16.9 2011 551 1.9 2.3 0.8 0.3 18.3 8.0 1.0 0.0 53 6.6 4.8 2012 10,037 24.1 12.9 2.6 0.4 0.9 0.4 0.0 0.0 916 7.8 6.2 2013 1,105 2.3 2.8 0.8 0.2 20.2 6.1 0.8 0.0 106 6.1 4.6 2014 10,077 25.7 13.4 2.4 0.3 2.4 0.8 0.2 0.0 911 7.8 6.6 2015 1,676 4.5 2.9 1.2 0.2 18.5 8.1 1.1 0.0 153 7.1 5.3 2016 10,087 25.0 13.9 2.6 0.2 3.1 1.5 0.1 0.0 915 5.2 6.8 2017 2,244 6.0 4.5 0.9 0.5 17.3 7.8 1.1 0.0 207 6.7 5.7 2018 10,046 26.8 12.2 2.4 0.4 4.1 2.1 0.3 0.0 905 5.1 7.0 2019 2,778 7.7 4.9 1.0 0.3 16.7 7.4 0.9 0.0 253 5.0 5.7
88
Page 102
Year Women
Screened Screening
Cost Treatment
Cost
Cost of False
Positive Tangible
Costs Cost of Death
Cost of Lost
QALY Intangible
Costs Total Costs
2010 10,014 152,213 312,497 52,565 517,276 6.6 140.2 146.7 517,422 2011 551 8,377 382,108 3,051 393,535 13.1 169.5 182.5 393,718 2012 10,037 152,568 487,354 53,119 693,041 20.8 212.7 233.5 693,275 2013 1,105 16,798 556,508 6,136 579,442 26.7 243.2 269.9 579,712 2014 10,077 153,163 676,731 52,832 882,726 34.4 293.0 327.3 883,053 2015 1,676 25,476 762,350 8,889 796,714 41.3 330.3 371.6 797,086 2016 10,087 153,323 883,546 53,076 1,089,945 46.3 386.2 432.5 1,090,377 2017 2,244 34,105 980,996 11,994 1,027,095 52.8 429.0 481.7 1,027,577 2018 10,046 152,701 1,105,932 52,507 1,311,141 57.7 486.4 544.1 1,311,685 2019 2,778 42,232 1,208,118 14,691 1,265,041 62.5 532.9 595.4 1,265,637
89
Page 103
A.8 Biennial Screening Women Over 45
Screen Detected Breast Cancer Clinically Diagnosed Breast Cancer
Year Women
Screened StageI StageII StageIII StageIV StageI StageII StageIII StageIV False
Positives Death QALY Lost
2010 7,717 15.8 28.1 8.5 3.3 1.5 5.5 12.1 1.0 700 6.6 17.6 2011 459 0.7 1.3 0.6 0.2 13.0 11.5 13.1 1.1 43 10.2 8.9 2012 7,692 18.8 9.0 1.8 0.4 2.1 5.4 12.5 1.2 701 11.6 10.4 2013 935 2.3 2.2 0.6 0.2 14.9 10.7 14.5 0.9 84 10.3 9.6 2014 7,668 21.8 7.6 1.7 0.3 3.4 7.1 13.1 1.3 699 11.0 10.9 2015 1,434 3.6 4.4 0.5 0.3 14.7 12.0 14.9 0.9 131 11.8 10.5 2016 7,623 18.4 9.0 2.1 0.2 4.3 7.3 12.8 1.1 682 9.5 10.8 2017 1,938 6.2 4.3 0.8 0.2 14.8 12.4 13.0 1.0 177 11.2 10.3 2018 7,571 19.3 8.8 1.3 0.3 4.4 6.7 13.4 1.0 688 9.5 10.8 2019 2,442 7.7 4.8 1.1 0.3 15.2 11.1 13.1 1.4 229 7.9 10.9
90
Page 104
Year Women
Screened Screening
Cost Treatment
Cost
Cost of False
Positive Tangible
Costs Cost of Death
Cost of Lost
QALY Intangible
Costs Total Costs
2010 7,717 117,298 362,233 40,609 520,140 6.6 147.9 154.5 520,295 2011 459 6,971 528,586 2,506 538,063 16.8 205.7 222.4 538,285 2012 7,692 116,920 702,120 40,646 859,686 28.3 276.3 304.6 859,991 2013 935 14,211 862,887 4,849 881,947 38.6 344.6 383.1 882,330 2014 7,668 116,560 1,056,038 40,542 1,213,140 49.5 425.0 474.5 1,213,614 2015 1,434 21,803 1,237,178 7,598 1,266,579 61.2 499.7 560.8 1,267,140 2016 7,623 115,865 1,415,642 39,547 1,571,054 70.4 581.0 651.3 1,571,706 2017 1,938 29,459 1,593,106 10,266 1,632,831 81.4 655.4 736.8 1,633,567 2018 7,571 115,073 1,779,200 39,910 1,934,183 90.6 735.7 826.3 1,935,009 2019 2,442 37,119 1,963,305 13,268 2,013,692 98.3 820.0 918.3 2,014,610
91
Page 105
A.9 Biennial Screening Women Over 50
Screen Detected Breast Cancer Clinically Diagnosed Breast Cancer
Year Women
Screened StageI StageII StageIII StageIV StageI StageII StageIII StageIV False
Positives Death QALY Lost
2010 5,489 10.9 18.8 6.5 2.5 2.7 11.4 23.6 1.7 496 8.7 19.3 2011 437 1.1 1.4 0.5 0.3 12.6 12.3 24.5 1.7 39 12.5 13.0 2012 5,461 12.2 6.6 0.8 0.2 3.7 11.2 24.0 1.7 489 12.0 13.8 2013 873 2.1 2.4 0.7 0.3 12.8 13.3 23.3 1.5 82 14.6 13.0 2014 5,416 14.2 6.3 0.8 0.4 4.9 11.6 24.3 2.2 491 16.3 14.8 2015 1,311 3.5 2.3 0.6 0.0 11.6 15.1 25.1 2.1 122 14.8 14.1 2016 5,342 12.7 6.5 1.7 0.3 4.5 12.2 25.0 1.9 493 13.0 14.9 2017 1,758 4.5 3.0 0.6 0.2 12.1 13.6 25.7 2.7 160 13.5 14.9 2018 5,265 13.4 6.2 0.6 0.1 5.5 14.7 24.6 2.3 473 11.8 15.2 2019 2,195 5.6 3.3 0.7 0.3 11.7 16.1 25.9 1.8 200 10.8 15.0
92
Page 106
Year Women
Screened Screening
Cost Treatment
Cost
Cost of False
Positive Tangible
Costs Cost of Death
Cost of Lost
QALY Intangible
Costs Total Costs
2010 5,489 83,433 423,314 28,788 535,535 8.7 158.3 167.0 535,702 2011 437 6,643 676,072 2,265 684,980 21.2 249.1 270.3 685,250 2012 5,461 83,009 917,508 28,377 1,028,893 33.1 352.5 385.5 1,029,278 2013 873 13,263 1,150,898 4,771 1,168,931 47.5 438.9 486.4 1,169,418 2014 5,416 82,327 1,399,153 28,501 1,509,981 63.7 541.2 604.9 1,510,586 2015 1,311 19,926 1,621,442 7,059 1,648,427 78.3 639.4 717.7 1,649,144 2016 5,342 81,200 1,869,596 28,617 1,979,413 90.9 749.6 840.5 1,980,253 2017 1,758 26,716 2,125,889 9,271 2,161,876 103.9 859.1 962.9 2,162,839 2018 5,265 80,035 2,385,350 27,428 2,492,813 115.3 971.8 1,087.1 2,493,900 2019 2,195 33,365 2,662,407 11,606 2,707,377 125.8 1,088.7 1,214.4 2,708,592
93
Page 107
A.10 Biennial Screening Women Over 55
Screen Detected Breast Cancer Clinically Diagnosed Breast Cancer
Year Women
Screened StageI StageII StageIII StageIV StageI StageII StageIII StageIV False
Positives Death QALY Lost
2010 3,642 5.9 10.2 3.4 1.3 3.7 14.6 32.7 2.4 326 9.4 19.3 2011 367 0.7 1.5 0.4 0.2 9.0 16.5 32.6 3.0 33 16.6 16.6 2012 3,583 7.8 3.3 0.6 0.5 3.8 15.6 34.7 3.3 331 16.4 18.1 2013 748 1.8 1.5 0.3 0.2 9.9 17.0 32.2 2.2 71 16.3 16.2 2014 3,498 7.9 3.8 0.7 0.3 5.5 15.4 34.8 2.6 311 21.2 17.8 2015 1,128 1.8 2.1 0.6 0.3 10.1 15.6 34.9 2.8 104 17.2 17.5 2016 3,412 6.8 4.4 0.6 0.1 5.8 17.3 34.8 3.0 304 15.5 18.3 2017 1,493 4.4 2.2 0.5 0.4 9.3 17.3 35.8 3.1 136 16.9 18.5 2018 3,341 7.1 3.3 0.7 0.4 7.1 17.5 37.0 3.4 298 15.2 19.5 2019 1,825 4.3 2.7 0.5 0.1 9.9 17.2 36.0 2.6 159 12.1 18.2
94
Page 108
Year Women
Screened Screening
Cost Treatment
Cost
Cost of False
Positive Tangible
Costs Cost of Death
Cost of Lost
QALY Intangible
Costs Total Costs
2010 3,642 55,358 443,707 18,914 517,979 9.4 157.4 166.8 518,146 2011 367 5,584 767,095 1,929 774,607 26.0 269.6 295.6 774,902 2012 3,583 54,456 1,069,235 19,210 1,142,901 42.2 401.1 443.3 1,143,345 2013 748 11,367 1,351,351 4,115 1,366,833 58.5 512.7 571.2 1,367,404 2014 3,498 53,167 1,667,715 18,044 1,738,925 79.5 629.0 708.5 1,739,634 2015 1,128 17,146 1,941,677 6,058 1,964,881 96.5 752.1 848.6 1,965,730 2016 3,412 51,860 2,248,339 17,638 2,317,837 111.7 885.9 997.6 2,318,835 2017 1,493 22,694 2,570,964 7,885 2,601,542 128.1 1,021.9 1,150.0 2,602,692 2018 3,341 50,782 2,910,736 17,293 2,978,810 142.9 1,167.0 1,309.8 2,980,120 2019 1,825 27,745 3,236,497 9,234 3,273,475 154.5 1,308.5 1,463.0 3,274,938
95
Page 109
A.11 Biennial Screening Women Over 60
Screen Detected Breast Cancer Clinically Diagnosed Breast Cancer
Year Women
Screened StageI StageII StageIII StageIV StageI StageII StageIII StageIV False
Positives Death QALY Lost
2010 2,158 3.2 5.9 2.0 0.7 5.5 16.9 38.8 2.9 187 9.3 20.1 2011 291 0.6 0.6 0.3 0.1 7.2 19.9 40.3 2.9 24 18.1 19.1 2012 2,049 4.3 2.2 0.5 0.1 5.1 17.7 39.3 3.5 185 19.5 19.3 2013 589 1.3 1.7 0.3 0.2 8.1 17.8 39.7 2.9 49 19.6 19.0 2014 1,961 3.7 2.2 0.4 0.1 5.5 19.1 39.7 2.8 170 22.3 19.2 2015 865 1.6 1.1 0.1 0.1 7.5 19.4 40.3 3.2 77 18.4 19.4 2016 1,893 3.6 1.9 0.4 0.1 6.5 19.3 46.5 3.4 168 17.0 21.7 2017 1,109 2.7 2.3 0.5 0.2 7.8 20.7 43.4 4.3 97 18.2 21.9 2018 1,864 3.1 2.0 0.5 0.2 6.5 22.1 43.3 3.6 166 16.1 21.5 2019 1,304 3.5 1.7 0.3 0.3 8.1 21.9 44.1 3.4 114 12.9 21.8
96
Page 110
Year Women
Screened Screening
Cost Treatment
Cost
Cost of False
Positive Tangible
Costs Cost of Death
Cost of Lost
QALY Intangible
Costs Total Costs
2010 2,158 32,802 474,281 10,872 517,955 9.3 164.9 174.2 518,129
2011 291 4,429 866,426 1,380 872,235 27.4 299.5 326.9 872,562
2012 2,049 31,139 1,191,646 10,747 1,233,532 46.8 431.7 478.4 1,234,010
2013 589 8,958 1,514,867 2,854 1,526,679 66.3 559.6 625.9 1,527,304
2014 1,961 29,806 1,841,676 9,837 1,881,319 88.6 686.4 774.9 1,882,094
2015 865 13,141 2,141,675 4,449 2,159,265 106.8 827.8 934.5 2,160,200
2016 1,893 28,769 2,537,414 9,715 2,575,898 123.5 991.7 1,115.2 2,577,013
2017 1,109 16,863 2,922,719 5,635 2,945,217 141.4 1,154.7 1,296.1 2,946,513
2018 1,864 28,338 3,306,769 9,645 3,344,752 157.1 1,314.5 1,471.6 3,346,224
2019 1,304 19,816 3,709,011 6,595 3,735,421 169.5 1,486.9 1,656.3 3,737,078
97
Page 111
98
APPENDIX B: SIMAN CODE OF THE SIMULATION
MODEL
B.1 Blocks Age20_24 CREATE, 3075::NEXT(0$); 0$ ASSIGN: agegroup=1; main BRANCH, 1: If,(PrevScreened==1)*(BiennialStrategy==1)*(year-lastscreen<=1),bien,Yes: If,agegroup<=4,under30,Yes: If,(agegroup>=lowestage)*(agegroup<=10),screening,Yes: If,agegroup>=11,end,Yes: Else,unscreened,Yes; bien BRANCH, 1: with,0.042*RelativeFreq(agegroup)*(PrevUnscreened+PrevScreened*0.38),Positive2,Yes: Else,Negative2,Yes; Positive2 COUNT: 600+year,1; 29$ BRANCH, 1: With,0.0691*PrevUnscreened+PrevScreened*ASSP(1,agegroup),StageI2,Yes: With,0.2769*PrevUnscreened+PrevScreened*ASSP(2,agegroup),StageII2,Yes: With,0.6064*PrevUnscreened+PrevScreened*ASSP(3,agegroup),StageIII2,Yes: With,0.0476*PrevUnscreened+PrevScreened*ASSP(4,agegroup),StageIV2,Yes; StageI2 COUNT: 1400+year,1; 21$ ASSIGN: stage=1; treat COUNT: 400+year,TreatmentCost(stage); 25$ BRANCH, 1: With,SurvivalRate(year,stage),death,Yes: Else,qalyburden,Yes; death COUNT: 300+year,1; deathburden COUNT: 1800+year,1; 28$ COUNT: 2000+year,DISC(LFPR(agegroup,year),GDP(year),1,0); 26$ WAIT: 365; 33$ BRANCH, 1: If,agegroup==12,woulddeath,Yes: Else,ageincrease3,Yes; woulddeath BRANCH, 1: With,deathrate(agegroup),end,Yes:
Page 112
99
Else,deathburden,Yes; end DISPOSE: No; ageincrease3 ASSIGN: agegroup=DISC(0.8,agegroup,1,agegroup+1):NEXT(woulddeath); qalyburden ASSIGN: qaly=(stage==1)*0.1+(stage==2)*0.2+(stage==3)*0.3+(stage==4)*0.7; izle2 COUNT: 1900+year,qaly*10; izle COUNT: 2100+year,QALY*(DISC(LFPR(agegroup,year),GDP(year),1,0)); 27$ WAIT: 365; 36$ BRANCH, 1: With,deathrate(agegroup),end,Yes: Else,olmeyen,Yes; olmeyen BRANCH, 1: If,agegroup==12,treat,Yes: Else,ageincrease2,Yes; ageincrease2 ASSIGN: agegroup=DISC(0.8,agegroup,1,agegroup+1):NEXT(treat); StageII2 COUNT: 1500+year,1; 22$ ASSIGN: stage=2:NEXT(treat); StageIII2 COUNT: 1600+year,1; 23$ ASSIGN: stage=3:NEXT(treat); StageIV2 COUNT: 1700+year,1; 24$ ASSIGN: stage=4:NEXT(treat); Negative2 BRANCH, 1: With,deathrate(agegroup),end,Yes: Else,nextyear,Yes; nextyear WAIT: 365; 32$ BRANCH, 1: If,agegroup==12,main,Yes: Else,ageincrease1,Yes; ageincrease1 ASSIGN: agegroup=DISC(0.8,agegroup,1,agegroup+1):NEXT(main); under30 WAIT: 365:NEXT(ageincrease1); Screening COUNT: 100+year,1; 35$ ASSIGN: lastscreen=year; 16$ BRANCH, 1: With, 0.042*RelativeFreq(agegroup)*(PrevUnscreened+PrevScreened*(AnnualStrategy*0.38+BiennialStrategy*0.54)), Positive,Yes:
Page 113
100
Else,Negative,Yes; Positive COUNT: ((800+year)*PrevUnscreened)+((700+year)*PrevScreened),1; 30$ BRANCH, 1: With, PrevUnscreened*FSSP(1)+PrevScreened*AnnualStrategy*ASSP(1,agegroup)+PrevScreened*BiennialStrategy*BSSP(1,agegroup), StageI,Yes: With, PrevUnscreened*FSSP(2)+PrevScreened*AnnualStrategy*ASSP(2,agegroup)+PrevScreened*BiennialStrategy*BSSP(2,agegroup), StageII,Yes: With, PrevUnscreened*FSSP(3)+PrevScreened*AnnualStrategy*ASSP(3,agegroup)+PrevScreened*BiennialStrategy*BSSP(3,agegroup), StageIII,Yes: With, PrevUnscreened*FSSP(4)+PrevScreened*AnnualStrategy*ASSP(4,agegroup)+PrevScreened*BiennialStrategy*BSSP(4,agegroup), StageIV,Yes; StageI COUNT: 1000+year,1; 17$ ASSIGN: stage=1:NEXT(treat); StageII COUNT: 1100+year,1; 18$ ASSIGN: stage=2:NEXT(treat); StageIII COUNT: 1200+year,1; 19$ ASSIGN: stage=3:NEXT(treat); StageIV COUNT: 1300+year,1; 20$ ASSIGN: stage=4:NEXT(treat); Negative BRANCH, 1: With,FalsePositive(agegroup),FalsePositives,Yes: Else,TrueNegative,Yes; FalsePositives COUNT: 500+year,1; 31$ COUNT: 2300+year,58; 34$ ASSIGN: PrevScreened=1: PrevUnscreened=0:NEXT(Negative2); TrueNegative ASSIGN: PrevScreened=1: PrevUnscreened=0:NEXT(Negative2); unscreened COUNT: 200+year,1:NEXT(bien); Age25_29 CREATE, 3202::NEXT(1$); 1$ ASSIGN: agegroup=2:NEXT(main); Age30_34 CREATE, 2913::NEXT(2$);
Page 114
101
2$ ASSIGN: agegroup=3:NEXT(main); Age35_39 CREATE, 2740::NEXT(3$); 3$ ASSIGN: agegroup=4:NEXT(main); Age40_44 CREATE, 2297::NEXT(4$); 4$ ASSIGN: agegroup=5:NEXT(main); Age45_49 CREATE, 2228::NEXT(5$); 5$ ASSIGN: agegroup=6:NEXT(main); Age50_54 CREATE, 1847::NEXT(6$); 6$ ASSIGN: agegroup=7:NEXT(main); Age55_59 CREATE, 1484::NEXT(7$); 7$ ASSIGN: agegroup=8:NEXT(main); Age60_64 CREATE, 1237::NEXT(8$); 8$ ASSIGN: agegroup=9:NEXT(main); Age65_69 CREATE, 921::NEXT(9$); 9$ ASSIGN: agegroup=10:NEXT(main); Age70_74 CREATE, 737::NEXT(10$); 10$ ASSIGN: agegroup=11:NEXT(main); Age75over CREATE, 1203::NEXT(11$); 11$ ASSIGN: agegroup=12:NEXT(main); 12$ CREATE, 1:1,9:NEXT(13$); 13$ ASSIGN: year=year+1; 15$ SIGNAL: 365; 14$ DISPOSE: No;
B.2 Variables
PROJECT, "Unnamed Project","Engin",,,No,Yes,Yes,Yes,No,No,Yes; ATTRIBUTES: lastscreen: PrevUnscreened,1: agegroup: qaly: stage,0: PrevScreened,0: FP,0; VARIABLES: 1,LostQALY1,CLEAR(System): 2,LostQALY2,CLEAR(System): 3,LostQALY3,CLEAR(System):
Page 115
102
4,LostQALY4,CLEAR(System): 5,LostQALY5,CLEAR(System): 6,LostQALY6,CLEAR(System): 7,LostQALY7,CLEAR(System): 8,LostQALY8,CLEAR(System): 9,LostQALY9,CLEAR(System): 10,LostQALY10,CLEAR(System): FSSP(4),CLEAR(System),0.281,0.5,0.1443,0.0622: lowestage,CLEAR(System),9: deathrate(14),CLEAR(System),0.0002,0.0002,0.0003,0.0004,0.0006,0.0010,0.0017,0.0028,0.0048,0.0084,0.0155,0.0415, 0.0415,0.0415: AnnualStrategy,CLEAR(System),0: FalsePositive(12),CLEAR(System),0,0,0.073,0.073,0.092,0.092,0.093,0.093,0.089,0.089,0.081,0.081: LFPR(14,10),CLEAR(System),0,0,0.303,0.303,0.292,0.238,0.203,0.169,0.139,0.0559,0.0559,0.0559,0.0559,0.0559,0,0, 0.305,0.305,0.293,0.236,0.199,0.163,0.136,0.0529,0.0529,0.0529,0.0529,0.0529,0,0,0.308,0.307,0.295,0.235,0.196, 0.158,0.132,0.0501,0.0501,0.0501,0.0501,0.0501,0,0,0.31,0.309,0.297,0.234,0.192,0.153,0.129,0.0474,0.0474,0.0474, 0.0474,0.0474,0,0,0.313,0.311,0.298,0.233,0.188,0.148,0.126,0.0449,0.0449,0.0449,0.0449,0.0449,0,0,0.315,0.313,0.3, 0.231,0.185,0.144,0.123,0.0425,0.0425,0.0425,0.0425,0.0425,0,0,0.318,0.315,0.302,0.23,0.181,0.139,0.12,0.0403, 0.0403,0.0403,0.0403,0.0403,0,0,0.321,0.317,0.303,0.229,0.178,0.135,0.117,0.0381,0.0381,0.0381,0.0381,0.0381,0,0, 0.323,0.32,0.305,0.228,0.175,0.131,0.114,0.0361,0.0361,0.0361,0.0361,0.0361,0,0,0.326,0.322,0.307,0.227,0.171, 0.127,0.111,0.0342,0.0342,0.0342,0.0342,0.0342: GDP(10),CLEAR(System),55516,57733,60039,62437,64931,67524,70221,73025,75942,78975: BiennialStrategy,CLEAR(System),1: SurvivalRate(10,4),CLEAR(System),0.005,0.0172,0.0221,0.0192,0.0199,0.0156,0.0083,0.0125,0.0053,0.0088,0.0422, 0.0774,0.0716,0.0587,0.0554,0.0398,0.032,0.0368,0.025,0.0176,0.1699,0.1597,0.1121,0.0979,0.0999,0.0722,0.0504, 0.0474,0.0352,0.0257,0.5572,0.3456,0.3143,0.2242,0.1578,0.1175,0.1201,0.0891,0.108,0.093: year,CLEAR(System),1: TreatmentCost(4),CLEAR(System),2580,3624,8735,4001:
Page 116
103
RelativeFreq(14),CLEAR(System),0,0,0,0,0.1956,0.2005,0.1907,0.1580,0.1446,0.1105,0,0,0,0: ASSP(4,14),CLEAR(System),0,0,0,0,0,0,0,0,0.67,0.29,0.04,0,0.67,0.29,0.04,0,0.67,0.29,0.04,0,0.67,0.29,0.04,0,0.69, 0.27,0.04,0,0.69,0.27,0.04,0,0.74,0.23,0.03,0,0.74,0.23,0.03,0,0.78,0.19,0.03,0,0.78,0.19,0.03,0,0.78,0.19,0.03,0, 0.78,0.19,0.03,0: BSSP(4,14),CLEAR(System),0,0,0,0,0,0,0,0,0.62,0.32,0.06,0,0.62,0.32,0.06,0,0.62,0.32,0.06,0,0.62,0.32,0.06,0,0.66, 0.30,0.04,0,0.66,0.30,0.04,0,0.76,0.21,0.03,0,0.76,0.21,0.03,0,0.76,0.21,0.03,0,0.76,0.21,0.03,0,0.76,0.21,0.03,0, 0.76,0.21,0.03,0; COUNTERS: 101,Screened1,,Replicate: 102,Screened2,,Replicate: 103,Screened3,,Replicate: 104,Screened4,,Replicate: 105,Screened5,,Replicate: 106,Screened6,,Replicate: 107,Screened7,,Replicate: 108,Screened8,,Replicate: 109,Screened9,,Replicate: 110,Screened10,,Replicate: 201,Unscreened1,,Replicate: 202,Unscreened2,,Replicate: 203,Unscreened3,,Replicate: 204,Unscreened4,,Replicate: 205,Unscreened5,,Replicate: 206,Unscreened6,,Replicate: 207,Unscreened7,,Replicate: 208,Unscreened8,,Replicate: 209,Unscreened9,,Replicate: 210,Unscreened10,,Replicate: 301,DeathCancer1,,Replicate: 302,DeathCancer2,,Replicate: 303,DeathCancer3,,Replicate: 304,DeathCancer4,,Replicate: 305,DeathCancer5,,Replicate: 306,DeathCancer6,,Replicate: 307,DeathCancer7,,Replicate: 308,DeathCancer8,,Replicate: 309,DeathCancer9,,Replicate:
Page 117
104
310,DeathCancer10,,Replicate: 401,TreatmentCosts1,,Replicate: 402,TreatmentCosts2,,Replicate: 403,TreatmentCosts3,,Replicate: 404,TreatmentCosts4,,Replicate: 405,TreatmentCosts5,,Replicate: 406,TreatmentCosts6,,Replicate: 407,TreatmentCosts7,,Replicate: 408,TreatmentCosts8,,Replicate: 409,TreatmentCosts9,,Replicate: 410,TreatmentCosts10,,Replicate: 501,FalsePositives1,,Replicate: 502,FalsePositives2,,Replicate: 503,FalsePositives3,,Replicate: 504,FalsePositives4,,Replicate: 505,FalsePositives5,,Replicate: 506,FalsePositives6,,Replicate: 507,FalsePositives7,,Replicate: 508,FalsePositives8,,Replicate: 509,FalsePositives9,,Replicate: 510,FalsePositives10,,Replicate: 701,DiaagnosedInLater1,,Replicate: 702,DiaagnosedInLater2,,Replicate: 703,DiaagnosedInLater3,,Replicate: 704,DiaagnosedInLater4,,Replicate: 705,DiaagnosedInLater5,,Replicate: 706,DiaagnosedInLater6,,Replicate: 707,DiaagnosedInLater7,,Replicate: 708,DiaagnosedInLater8,,Replicate: 709,DiaagnosedInLater9,,Replicate: 710,DiaagnosedInLater10,,Replicate: 801,DiaagnosedInFirst1,,Replicate: 802,DiaagnosedInFirst2,,Replicate: 803,DiaagnosedInFirst3,,Replicate: 804,DiaagnosedInFirst4,,Replicate: 805,DiaagnosedInFirst5,,Replicate: 806,DiaagnosedInFirst6,,Replicate: 807,DiaagnosedInFirst7,,Replicate: 808,DiaagnosedInFirst8,,Replicate: 809,DiaagnosedInFirst9,,Replicate: 810,DiaagnosedInFirst10,,Replicate: 901,Screening Cost,,Replicate:
Page 118
105
1001,ScreenedStageI1,,Replicate: 1002,ScreenedStageI2,,Replicate: 1003,ScreenedStageI3,,Replicate: 1004,ScreenedStageI4,,Replicate: 1005,ScreenedStageI5,,Replicate: 1006,ScreenedStageI6,,Replicate: 1007,ScreenedStageI7,,Replicate: 1008,ScreenedStageI8,,Replicate: 1009,ScreenedStageI9,,Replicate: 1010,ScreenedStageI10,,Replicate: 1101,ScreenedStageII1,,Replicate: 1102,ScreenedStageII2,,Replicate: 1103,ScreenedStageII3,,Replicate: 1104,ScreenedStageII4,,Replicate: 1105,ScreenedStageII5,,Replicate: 1106,ScreenedStageII6,,Replicate: 1107,ScreenedStageII7,,Replicate: 1108,ScreenedStageII8,,Replicate: 1109,ScreenedStageII9,,Replicate: 1110,ScreenedStageII10,,Replicate: 1201,ScreenedStageIII1,,Replicate: 1202,ScreenedStageIII2,,Replicate: 1203,ScreenedStageIII3,,Replicate: 1204,ScreenedStageIII4,,Replicate: 1205,ScreenedStageIII5,,Replicate: 1206,ScreenedStageIII6,,Replicate: 1207,ScreenedStageIII7,,Replicate: 1208,ScreenedStageIII8,,Replicate: 1209,ScreenedStageIII9,,Replicate: 1210,ScreenedStageIII10,,Replicate: 1301,ScreenedStageIV1,,Replicate: 1302,ScreenedStageIV2,,Replicate: 1303,ScreenedStageIV3,,Replicate: 1304,ScreenedStageIV4,,Replicate: 1305,ScreenedStageIV5,,Replicate: 1306,ScreenedStageIV6,,Replicate: 1307,ScreenedStageIV7,,Replicate: 1308,ScreenedStageIV8,,Replicate: 1309,ScreenedStageIV9,,Replicate: 1310,ScreenedStageIV10,,Replicate: 1401,ClincalStageI1,,Replicate: 1402,ClincalStageI2,,Replicate:
Page 119
106
1403,ClincalStageI3,,Replicate: 1404,ClincalStageI4,,Replicate: 1405,ClincalStageI5,,Replicate: 1406,ClincalStageI6,,Replicate: 1407,ClincalStageI7,,Replicate: 1408,ClincalStageI8,,Replicate: 1409,ClincalStageI9,,Replicate: 1410,ClincalStageI10,,Replicate: 1501,ClincalStageII1,,Replicate: 1502,ClincalStageII2,,Replicate: 1503,ClincalStageII3,,Replicate: 1504,ClincalStageII4,,Replicate: 1505,ClincalStageII5,,Replicate: 1506,ClincalStageII6,,Replicate: 1507,ClincalStageII7,,Replicate: 1508,ClincalStageII8,,Replicate: 1509,ClincalStageII9,,Replicate: 1510,ClincalStageII10,,Replicate: 1601,ClincalStageIII1,,Replicate: 1602,ClincalStageIII2,,Replicate: 1603,ClincalStageIII3,,Replicate: 1604,ClincalStageIII4,,Replicate: 1605,ClincalStageIII5,,Replicate: 1606,ClincalStageIII6,,Replicate: 1607,ClincalStageIII7,,Replicate: 1608,ClincalStageIII8,,Replicate: 1609,ClincalStageIII9,,Replicate: 1610,ClincalStageIII10,,Replicate: 1701,ClinicalStageIV1,,Replicate: 1702,ClinicalStageIV2,,Replicate: 1703,ClinicalStageIV3,,Replicate: 1704,ClinicalStageIV4,,Replicate: 1705,ClinicalStageIV5,,Replicate: 1706,ClinicalStageIV6,,Replicate: 1707,ClinicalStageIV7,,Replicate: 1708,ClinicalStageIV8,,Replicate: 1709,ClinicalStageIV9,,Replicate: 1710,ClinicalStageIV10,,Replicate: 1801,BurdDeath1,,Replicate: 1802,BurdDeath2,,Replicate: 1803,BurdDeath3,,Replicate: 1804,BurdDeath4,,Replicate:
Page 120
107
1805,BurdDeath5,,Replicate: 1806,BurdDeath6,,Replicate: 1807,BurdDeath7,,Replicate: 1808,BurdDeath8,,Replicate: 1809,BurdDeath9,,Replicate: 1810,BurdDeath10,,Replicate: 1901,BurdQALY1,,Replicate: 1902,BurdQALY2,,Replicate: 1903,BurdQALY3,,Replicate: 1904,BurdQALY4,,Replicate: 1905,BurdQALY5,,Replicate: 1906,BurdQALY6,,Replicate: 1907,BurdQALY7,,Replicate: 1908,BurdQALY8,,Replicate: 1909,BurdQALY9,,Replicate: 1910,BurdQALY10,,Replicate: 2001,EcBurdDeath1,,Replicate: 2002,EcBurdDeath2,,Replicate: 2003,EcBurdDeath3,,Replicate: 2004,EcBurdDeath4,,Replicate: 2005,EcBurdDeath5,,Replicate: 2006,EcBurdDeath6,,Replicate: 2007,EcBurdDeath7,,Replicate: 2008,EcBurdDeath8,,Replicate: 2009,EcBurdDeath9,,Replicate: 2010,EcBurdDeath10,,Replicate: 2101,EcBurdQALY1,,Replicate: 2102,EcBurdQALY2,,Replicate: 2103,EcBurdQALY3,,Replicate: 2104,EcBurdQALY4,,Replicate: 2105,EcBurdQALY5,,Replicate: 2106,EcBurdQALY6,,Replicate: 2107,EcBurdQALY7,,Replicate: 2108,EcBurdQALY8,,Replicate: 2109,EcBurdQALY9,,Replicate: 2110,EcBurdQALY10,,Replicate: 2201,BurdFalsPosQALY1,,Replicate: 2202,BurdFalsPosQALY2,,Replicate: 2203,BurdFalsPosQALY3,,Replicate: 2204,BurdFalsPosQALY4,,Replicate: 2205,BurdFalsPosQALY5,,Replicate: 2206,BurdFalsPosQALY6,,Replicate:
Page 121
108
2207,BurdFalsPosQALY7,,Replicate: 2208,BurdFalsPosQALY8,,Replicate: 2209,BurdFalsPosQALY9,,Replicate: 2210,BurdFalsPosQALY10,,Replicate: 2301,BurdFalsPosTreat1,,Replicate: 2302,BurdFalsPosTreat2,,Replicate: 2303,BurdFalsPosTreat3,,Replicate: 2304,BurdFalsPosTreat4,,Replicate: 2305,BurdFalsPosTreat5,,Replicate: 2306,BurdFalsPosTreat6,,Replicate: 2307,BurdFalsPosTreat7,,Replicate: 2308,BurdFalsPosTreat8,,Replicate: 2309,BurdFalsPosTreat9,,Replicate: 2310,BurdFalsPosTreat10,,Replicate; REPLICATE, 20,,,Yes,Yes,,,,24,Hours;