Page 1
i
UKERC Technology and Policy
Assessment
Cost Methodologies Project:
PV Case Study
Working Paper
July 2012: REF UKERC/WP/TPA/2013/009
Chiara Candelise, Imperial College Centre for Energy Policy and Technology
This document has been prepared to enable results of on-going work to be made available
rapidly. It has not been subject to review and approval, and does not have the authority of a full
Research Report.
Page 2
ii
UK Energy Research Centre UKERC/WP/TPA/2013/009
T H E U K E N E R G Y R E S E A R C H C E N T R E
The UK Energy Research Centre carries out world-class research into sustainable future
energy systems.
It is the hub of UK energy research and the gateway between the UK and the
international energy research communities. Our interdisciplinary, whole systems
research informs UK policy development and research strategy.
www.ukerc.ac.uk
The Technology and Policy Assessment (TPA) Theme of UKERC
The TPA was set up to inform decision-making processes and address key controversies
in the energy field. It aims to provide authoritative and accessible reports that set very
high standards for rigour and transparency. Subjects are chosen after extensive
consultation with energy sector stakeholders and upon the recommendation of the TPA
Advisory Group, which is comprised of independent experts from government, academia
and the private sector.
The primary objective of the TPA is to provide a thorough review of the current state of
knowledge. New research, such as modelling or primary data gathering may be carried
out when essential. It also aims to explain its findings in a way that is accessible to non-
technical readers and is useful to policymakers.
This working paper was produced as part of the TPA Cost Methodologies project.
Page 3
Contents
1 INTRODUCTION ........................................................................................................1
2 COST TRAJECTORIES AND ESTIMATION ......................................................................3
2.1 MODULE PRICE AND PRODUCTION COST ........................................................................... 3
2.2 SYSTEM CAPEX ......................................................................................................... 7
3 DISCUSSION ............................................................................................................ 10
3.1 PV MODULE COST REDUCTIONS .................................................................................... 10
3.2 SYSTEM CAPEX COST REDUCTIONS ............................................................................... 13
3.3 METHODOLOGICAL ISSUES ........................................................................................... 16
4 CONCLUDING REMARKS .......................................................................................... 21
REFERENCES .............................................................................................................. 24
Page 4
1
UK Energy Research Centre UKERC/WP/TPA/2013/009
1 Introduction
Thanks to policy incentives implemented in key countries, such as Germany, Italy, and
Spain, the photovoltaic (PV) sector has experienced a massive expansion in the last
decade, with worldwide cumulative installed capacity growing from 1.4GW in 2000 to
over 67GW in 2011 (EPIA, 2012). This market growth has definitely been policy driven,
but it has nonetheless triggered industry expansion and PV module price reductions,
with dramatic price drops in the last couple of years. In the UK the introduction of the
Feed in Tariff (FIT) scheme in April 2010 has boosted the UK PV sector, leading to a
relatively unexpected increase in installed capacity since its implementation. By the end
of 2011 PV installations in the UK reached about 750MW, up from about 40MW at the
beginning of 2010. Indeed, system price drops and increased installation rate have led
the UK Department of Energy and Climate Change (DECC) to undergo a controversial
review of the FIT scheme, implying a substantial cut in the tariffs to support PV
deployment. Nevertheless, these recent developments have allowed the UK PV industry
to grow substantially and to achieve considerable cost reductions in UK PV system costs.
This working paper examines global and UK trends in cost trajectories of PV
technologies, at module and system level, with the aim of:
1. Examining key trends in contemporary costs and forecasted cost projections;
2. Discussing major drivers for cost reductions;
3. Identifying implications for the use of available cost estimation methodologies
in forecasting PV technology costs.
A photovoltaic system is an integrated assembly of modules and other components
designed to convert solar energy into electricity. The main component of a PV system is
the module, being the device responsible for the conversion of sunlight into electricity
and accounting for the largest share of the PV system cost (about 35%-55% of total
system cost depending on applications (Ernst & Young, 2011, Parsons Brinckerhoff,
2012)). All the other components needed to build up a PV system are, by convention,
called Balance of System (BOS). Usually, BOS refers to all PV system components and
cost elements except for the modules, thus including technical components such as
inverter, mounting structures, cables and wiring, battery (for off-grid systems),
metering (for grid-connected applications) as well as other costs such as installation,
design and commissioning costs.
Page 5
2
UK Energy Research Centre UKERC/WP/TPA/2013/009
There is a wide variety of PV module technologies at different levels of maturity.
Commercial PV modules can divided in two broad categories: crystalline silicon – c-Si -
(also often called 1st generation) which are the conventional PV technologies accounting
for the majority of the market share (about 85% (Photon International, 2011)); and thin
film (2nd generation),an alternative to c-Si recently gaining market share (more
specifically Cadmium Telluride (CdTe), Amorphous Silicon (a-Si) and Copper Indium
(Gallium) (di)Selenide (CIGS) technologies). A range of novel technologies (3rd
generation) are also emerging, including concentrating PV and organic PV which are
under development in laboratories and, in some cases, quite close to commercialization.
Most of the data presented in this paper, in particular historical cost trajectories and the
discussion on drivers for reduction, refer to c-Si technologies and to a lesser extent to
thin film technologies. As such, historical trajectories are actual cost and price data
since they refer to already commercialised technologies.
PV systems are divided in two main categories: off-grid, which operate independently
from the grid network, and grid-connected. Although off-grid applications still play a
role in global PV markets (in particular in developing countries), grid-connected PV
currently accounts for the major market share and is responsible for the dramatic
expansion of the last decade. In analysing PV system costs this paper will only present
data and discuss grid-connected system costs. Grid-connected PV systems can be
further sub-divided in grid-connected distributed, where the electricity generated
satisfies local loads and only the excess is fed into the grid, and grid-connected
centralised, where all electricity generated is fed into the grid. Grid connected PV system
can also be divided according to the market segment they satisfy and the system
type/size. Typical PV market segments are: residential (systems of small size - below
10kW), commercial (systems of medium size - in the hundreds of kW range), and utility
(large ground mounted systems - in the MW range). Residential and commercial systems
are generally utilised as distributed systems, and are on top of buildings or building
integrated (BIPV) when they displace conventional building materials. This wide variation
of grid-connected systems types and sizes implies variation in system costs (as
discussed in Section 2.2). PV costs and prices are presented and analysed at module and
system level. For the module both prices and production cost (€ or $/Wp) figures are
presented. Capital cost (CAPEX) figures (£/Wp installed) are presented for PV systems.
Page 6
3
UK Energy Research Centre UKERC/WP/TPA/2013/009
2 Cost trajectories and estimation
This section presents PV costs trajectories and compares forecasted costs with actual
out-turns. First, cost reductions are discussed at module level by presenting module
price and production costs figures. Then PV system CAPEX cost data are presented, i.e.
accounting for BOS costs.
2.1 Module price and production cost
PV module prices have been decreasing over time. Figure 1 shows the average module
price trend from the mid-70s to 2011. Data is presented in $/Wp1. It indicates a
dramatic reduction in PV module prices over the period, mainly due to the development
and deployment of crystalline silicon technologies.
Figure 1. PV module price historical trend (Maycock, 2011, Solarbuzz, 2012)
1 Module price figures are presented in the currency of the data collected, i.e. either
dollars or euros. This is a reflection of the global dimension of the PV module market
and the fact that module prices have been driven to date by developments and market
dynamics in countries other than the UK (i.e. the UK PV market has been very small and
has had no influence on global price trends). A conversion in £/Wp would introduce a
currency effect that could mislead the interpretation of historical module price trends.
Page 7
4
UK Energy Research Centre UKERC/WP/TPA/2013/009
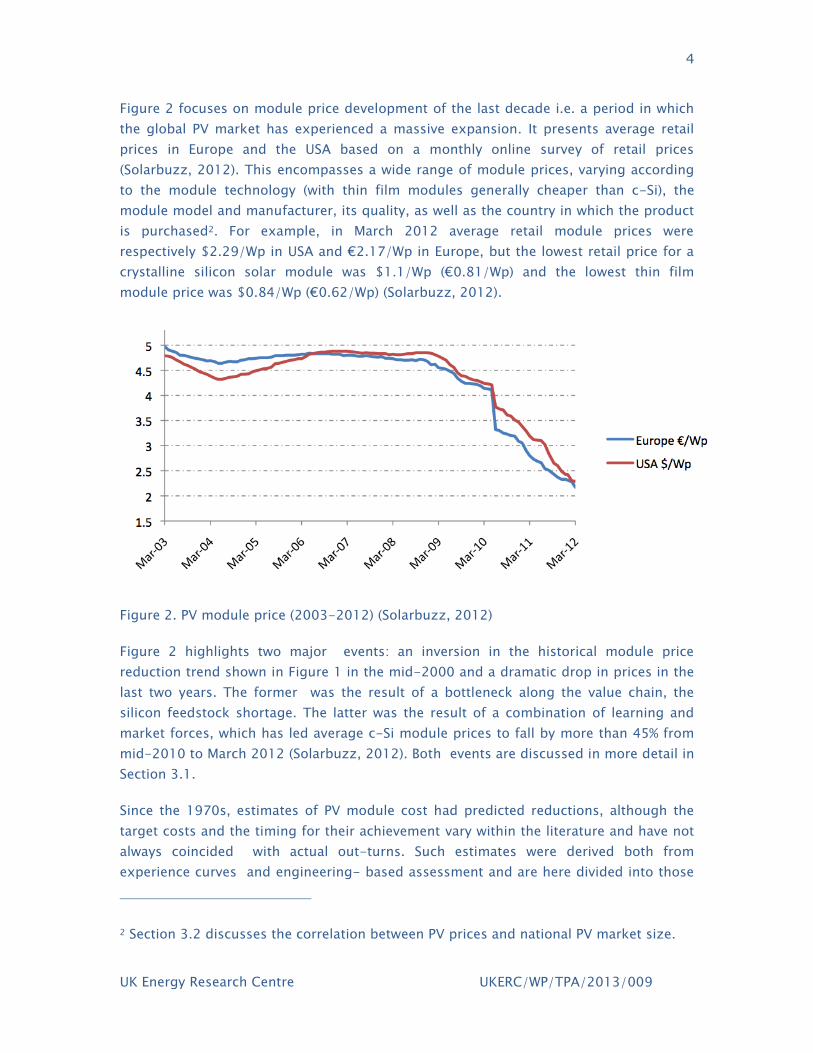
Figure 2 focuses on module price development of the last decade i.e. a period in which
the global PV market has experienced a massive expansion. It presents average retail
prices in Europe and the USA based on a monthly online survey of retail prices
(Solarbuzz, 2012). This encompasses a wide range of module prices, varying according
to the module technology (with thin film modules generally cheaper than c-Si), the
module model and manufacturer, its quality, as well as the country in which the product
is purchased2. For example, in March 2012 average retail module prices were
respectively $2.29/Wp in USA and €2.17/Wp in Europe, but the lowest retail price for a
crystalline silicon solar module was $1.1/Wp (€0.81/Wp) and the lowest thin film
module price was $0.84/Wp (€0.62/Wp) (Solarbuzz, 2012).
Figure 2. PV module price (2003-2012) (Solarbuzz, 2012)
Figure 2 highlights two major events: an inversion in the historical module price
reduction trend shown in Figure 1 in the mid-2000 and a dramatic drop in prices in the
last two years. The former was the result of a bottleneck along the value chain, the
silicon feedstock shortage. The latter was the result of a combination of learning and
market forces, which has led average c-Si module prices to fall by more than 45% from
mid-2010 to March 2012 (Solarbuzz, 2012). Both events are discussed in more detail in
Section 3.1.
Since the 1970s, estimates of PV module cost had predicted reductions, although the
target costs and the timing for their achievement vary within the literature and have not
always coincided with actual out-turns. Such estimates were derived both from
experience curves and engineering- based assessment and are here divided into those
2 Section 3.2 discusses the correlation between PV prices and national PV market size.
Page 8
5
UK Energy Research Centre UKERC/WP/TPA/2013/009
made before and after the year 2000. A previous contribution (Schaeffer et al., 2004b)
has pointed out how cost reduction projections made before the year 2000 have been
too optimistic when compared to actual PV module prices3, as shown in Table 1. The
table also shows the discrepancies between experience curves and engineering
assessment estimates and evidence of higher ‘appraisal optimism’ in the latter.
Study Year of
study
Year of
projection
Engineering
assessment
projection
Experience
curve
projection
Actual
average
selling
price
JBL86-31 target 1978 1986 1.63 0.86 11.94
JBL86-31 Cz 1985 1988 2.17 6.35 9.12
JBL86-31 Dentretic 1985 1992 1.02 2.8 7.7
EPRI 1986 1986 2000 1.5 0.79 5.05
MUSIC FM, 1996 1996 2000 1 4.07 4.05
Table 1. Comparing experience curve and engineering assessment production costs
projections with actual PV module prices (Schaeffer et al., 2004b)
During the last decade the reverse has happened, with estimates underestimating cost
reductions achieved over recent years. Table 2 presents a selection of PV cost estimates
made after the year 2000 by both experience curves and engineering assessment
studies. Estimates are presented as quoted in the studies, thus they are not converted to
account for currency and inflation. This as $1/Wp and €1/Wp have been by convention
assumed the benchmark production cost reduction figures within the cost reduction
literature of the last 5 years. Therefore, the estimates here presented should not be
interpreted as absolute values, but rather considered against such benchmarks.
3 This applies even considering manufacturers’ mark-ups on top of production costs
figures, i.e. the discrepancy between estimated production costs and actual prices is too
high to be simply attributed to mark-ups. Implications of the use of price versus
production cost figures are discussed in Section 3.3.1.
Page 9
6
UK Energy Research Centre UKERC/WP/TPA/2013/009
Study Year of
study
PV
technology
Year of
projection
Cost
projection
Experience curve studies:
Surek 2005 c-Si 2023 $1/Wp
Trancok & Zweibel 2006 Thin film 2022 $0.7/Wp
Engineering assessment
studies:
EU Strategic Research
Agenda 2007 c-Si 2013 €1/Wp
EU Strategic Research
Agenda 2007 Thin film 2020 €0.75/Wp
Table 2. Experience curves and engineering assessment cost projections ( post-2000)
(EU PV Technology Platform, 2007, Trancik and Zweibel, 2006, Surek, 2005)
Estimates presented in Table 2 have proven to be over-pessimistic when compared with
actual out-turns in PV production costs. Figure 3 presents current and future estimates
of production costs for c-Si and some thin film technologies (CdTe, silicon thin film)
(Ebinger, 2011, Fath, 2011, First Solar, 2011, Holzapfel, 2011, IHS iSuppli, 2011, IMS
Research, 2012)4. It shows how c-Si and thin film have got close to the $1/Wp
benchmark threshold, well ahead of estimates from both experience curves and
engineering based studies presented in Table 2.
4 Data points before 2012 are actual production costs, whereas those from 2012
onwards are forecasts and as such should be treated with caution.
Page 10
7
UK Energy Research Centre UKERC/WP/TPA/2013/009
Figure 3. Current and forecasted production costs for c-Si and thin film PV, $/Wp
(Ebinger, 2011, Fath, 2011, First Solar, 2011, Holzapfel, 2011, IHS iSuppli, 2011, IMS
Research, 2012)
Section 3 will discuss possible reasons behind such discrepancies between PV module
cost reduction estimates and actual out-turns.
2.2 System CAPEX
Despite the module being the major cost element of the PV system, what matters for
the assessment of PV technologies cost effectiveness is the total PV system capital cost
(CAPEX), i.e. including BOS cost.
1$/Wp
Page 11
8
UK Energy Research Centre UKERC/WP/TPA/2013/009
Figure 4. PV system price across European countries
Figure 4 presents CAPEX of PV systems installed in several European countries in the last
decade (i.e. Germany, Italy, Spain, Netherlands, Belgium, Austria, Greece, France, UK)
(Arup, 2011, Candelise, 2009, Candelise et al., 2010, Castello et al., 2003, Castello et
al., 2004, Castello et al., 2007, Castello et al., 2008, Castello et al., 2009, Castello et al.,
2010, Energy Saving Trust, 2008, IEA-PVPS, 2005, Mott Mcdonald, 2011, Rudkin et al.,
2007, Sonnenertrag.eu, 2011). The data presented are actual PV system prices
converted into 2011 British pounds. The variability in PV system prices shown in Figure
4 is due to differences in system prices across both market segment (and system size),
system types and countries. System prices do not scale linearly with system size, thus
tend to be higher in residential markets compared to medium size commercial systems
and large utility scale systems. They also differ across countries and across PV system
types, with e.g. BIPV systems being more expensive than standard roof top applications.
Despite such high variability, Figure 4 shows a clear decrease in system prices over time
across market segments and countries.
Due to the high variability of PV system CAPEX figures across countries, comparison of
past estimates with PV system price out-turns is done for the UK only. Figure 5 presents
UK PV system future cost trajectories as estimated by several studies commissioned by
the UK Government since 2008 (CEPA and PB, 2011, Element Energy, 2008, Element
Energy, 2009, Parsons Brinckerhoff, 2012). Trajectories are presented for small,
medium (when available) and large size PV systems. The figure shows how previous
estimates have underestimated UK system price reduction achieved in the last few years
and how estimates for future price reductions trajectories have been progressively
Page 12
9
UK Energy Research Centre UKERC/WP/TPA/2013/009
revised downward. For example, 2012 UK PV system prices had been estimated in 2008
to be £3,338/kWp and £3,115/kWp respectively for small and large PV systems (Element
Energy, 2008). Such estimates are much higher than the actual out-turns of respectively
£2,542/kWp and £1,200/kWp for the same PV system sizes (Parsons Brinckerhoff,
2012). Similarly, estimates for UK system costs for e.g. small size systems in 2020 have
been revised downward from £2,172/kWp in the 2008 study (Element Energy, 2008) to
£1,050/kWp in the 2012 study (Parsons Brinckerhoff, 2012). Drivers behind cost
reductions at PV system level are discussed in Section 3.
Figure 5. Comparison of UK PV system cost trajectories estimates (CEPA and PB, 2011,
Element Energy, 2008, Element Energy, 2009, Parsons Brinckerhoff, 2012)
Page 13
10
UK Energy Research Centre UKERC/WP/TPA/2013/009
3 Discussion
The following sections discuss the major drivers behind the reduction in PV module and
system prices over time and the possible reasons for the discrepancies between
expectations of future costs and actual outcomes.
3.1 PV module cost reductions
The first substantive drop in PV module costs occurred in the mid-70s, when PV moved
from space to terrestrial applications. C-Si module price decreased from $90/Wp in
1968 to $15/Wp in 1978, mainly thanks to reduced device quality and reliability
requirements, higher product standardization as well as increased market competition.
Subsequently, c-Si module costs continued to decrease over time, with the PV industry
experiencing historical learning rates in the 18-20% range. Device efficiency and plant
size increases (and consequent economies of scale) have been judged to be the major
cost reduction drivers up to the early 2000s (accounting for respectively 30% and 43% of
price reduction) (Nemet, 2006). Crystalline silicon technologies have also benefited from
knowledge spillovers from the already mature semiconductor industry.
Cost reductions at device level (c-Si technologies)
At the device level, the main drivers for cost reductions for c-Si technologies are
increases in cell efficiency and power density of the module and a reduction in silicon
consumption per Wp. An increase in cell efficiency of 1% alone is able to reduce the cell
cost per Wp by 5-7%. Commercial module efficiency has been increasing in recent
years, moving from 12-14% in 2007 to 13-16% in 2011 for average c-Si modules, and
to 15-17% to around 20% for the best performing modules (EU PV Technology Platform,
2007, EU PV Technology Platform, 2011, Green et al., 2012). Silicon usage in c-Si cells
has also been reduced over time, thanks to innovation that has allowed thinner wafers
and improving efficiencies in wafer cutting (reducing wastage of material). Wafer
thickness has decreased from above 400µm in the 90s to 160-180µm in 2011 (EU PV
Technology Platform, 2011, Kazmerski, 2006). Silicon usage has overall decreased from
around 13g/Wp in early 2000s to 7g/Wp (Photovoltaics Bulletin, 2003, EU PV
Technology Platform, 2007, EU PV Technology Platform, 2011).
Manufacturing processes and scale
Improvements in the manufacturing processes as well as vertical integration (with
vertically integrated companies able to purchase feedstock or wafer at cost prices) have
Page 14
11
UK Energy Research Centre UKERC/WP/TPA/2013/009
also contributed to cost reductions. Over the last decade, module production processes
have become more automated, gradually moving away from batch processes toward in-
line, high throughput, high yield processing. For many years, most companies grew by
specialising in a single activity within the value chain. In recent years, the largest c-Si
PV manufacturers have integrated vertically both up-stream and down-stream along the
PV supply chain, thus positioning to achieve “best practice” production costs5. The size
of plants has also played an important role in reducing costs, and the last decade has
seen a dramatic increase in c-Si production capacity and average plant size. In 2007
average plant size was c.100MWp/y; this quickly increased to the 500-1000MWp/y
range (e.g. JA Solar, the second largest PV manufacturer in the world has established a
PV module production facility in Fengxian, Shanghai, with an annual capacity of 1.2 GW
(JA Solar, 2012)).
Silicon feedstock bottleneck
In the mid-2000s, because of a sudden increase in demand for PV modules due to
demand pull policies implemented in key countries, the PV industry experienced a
serious bottleneck – a silicon feedstock shortage. This caused silicon spot prices to go
up from $50/kg to over $500/kg in 2008 (Flynn, 2009), increasing production costs and
leading to an inversion in the historical module price reduction trend (Figure 2).
However, the silicon shortage also stimulated innovation both in R&D and
manufacturing to improve material utilization (through lower silicon consumption in
devices and efficiency increases), and drove new investments in feedstock production as
well as increased R&D efforts in developing cheaper ways to produce silicon (e.g.
production of less pure ‘solar grade’ silicon). Since the mid-2000s, silicon feedstock
prices have more closely reflected production costs and production capacity expansion
eventually created oversupply in the silicon feedstock market, pushing prices
downwards (spot prices were around $35/kg in late 2011) (Prior and Campbell, 2012,
Iken, 2012). Cheap silicon feedstock was also a driver of the dramatic module price drop
experienced in the last couple of years (discussion below).
Technology differentiation
The silicon bottleneck in the mid-2000s and the consequent production costs increase
for c-Si technologies also triggered a new wave of investments in thin film (TF) PV
technologies. Among currently commercialized technologies TF PV are generally deemed
to have major potential for cost reductions, provided that the expected increases in
5 Best practice costs are the lowest observed processing costs at each step of the supply chain, i.e. the sum of
polysilicon best practice costs, ingot/wafer best practice cost, cell best practice cost, and module best practice
production costs.
Page 15
12
UK Energy Research Centre UKERC/WP/TPA/2013/009
production facility sizes and efficiencies are realised (Chopra et al., 2004, EU PV
Technology Platform, 2007, EU PV Technology Platform, 2011, Hegedus, 2006,
Woodcock et al., 1997, Zweibel, 2005, Zweibel, 2000). Their high cost reduction
potential is due to very little use of high-cost semiconductor compared to c-Si and to
the fact that their unit of production is more flexible and not constrained by the wafer
dimensions, thus allowing larger units of production, continuous production processes
and large scale, high-throughput manufacturing. Investments in TF PV production
capacity have been increasing, facilities production capacities have reached the MWs
range, and turnkey production lines with high cost reduction potential are being
developed. TF PV are currently the least expensive to manufacture, with CdTe TF
modules produced at a cost of $0.74/Wp by First Solar, a company which has managed
to increase production capacity from 25MW in 2005 to over 2GW in 2011 (First Solar,
2011), thus achieving large scale production, which is one of the major conditions to
fully harness the cost reduction potential of thin film technologies (Chopra et al., 2004,
Hegedus, 2006, Woodcock et al., 1997). Indeed, First Solar is the first PV manufacturer
to reduce production costs below the $1/Wp production cost threshold, in 2009, much
earlier than predicted in previous estimates (see Figure 3 in Section 2.1).
Beyond production costs – Recent price drop and market forces
As shown in Figure 2 module prices have been dropping dramatically since 2010. Such
drastic reductions were largely unexpected, and correlated to a dramatic market
expansion. Overall since 2000, total PV production increased more than 30 fold, with
annual growth rates above 40% since 2006 (Jäger-Waldau, 2011). High demand and
profit margins in the second half of the 2000s drove high levels of investment, with new
companies and countries entering the market, expanding production capacity and
supply (Jager-Waldau, 2006, Jager-Waldau, 2008). By 2009, many analysts expected a
shift from a supply-constrained to a demand-constrained market, leading to price
reductions and industry consolidation (Englander et al., 2009, Rogol, 2009). Production
overcapacity started to impact the market in 2010 and continued during 2011 leading
to a dramatic drop in global module prices. Much of the rapid growth in production
capacity has been in China and Taiwan (which together now account for about 50 % of
world-wide production (Jager-Waldau, 2010)), with new companies able to supply the
global market with much lower price modules. The c-Si module price drop is also due to
an oversupply in polysilicon production, with a consequent reduction in silicon
feedstock prices and module production costs. Early 2012 evidence and analysts’ views
also suggest that modules are currently being sold below production costs, triggering
PV industry consolidation (several companies have been filing for bankruptcy) and global
controversies over module pricing (with some US PV manufacturers filing an anti-
dumping petition against Chinese manufacturers and the US Department of Commerce
to release in March 2012 a determination on countervailing imports of silicon PV
modules from China).
Page 16
13
UK Energy Research Centre UKERC/WP/TPA/2013/009
However, it remains unclear how much of these recent price reductions can be
attributed to actual reduction in production costs driven by incremental innovation (e.g.
device and production process improvements) and economies of scale along the PV
module value chain (including production of component materials such as glass), or to
market demand/supply dynamics and other factors such as easy access to cheap
(subsidized) capital for Chinese manufacturers and industry ‘dumping’ strategies.
3.2 System CAPEX cost reductions
PV system cost reductions are driven by reductions in module cost (discussed above) as
well as balance of system (BOS) costs. Cost reduction and learning in manufacturing PV
BOS components are relatively less substantial than for PV modules, as PV systems’ BOS
components are common, mass-produced electrical and mechanical components with
mature markets outside the solar industry. Nonetheless, incremental innovation in some
BOS components has led to lower manufacturing costs, in particular for inverters which
have experienced a learning rate in the 10% range (Schaeffer et al., 2004b). A similar
trend was found in the USA for cost reduction for labour costs attributed to installed PV
systems (IPCC, 2011).
Combined effect of several factors
Overall, unlike module cost reductions, system cost reductions cannot be attributed to
individual system/hardware components, but rather to the combined effect of several
factors in a compound learning system. Cost reductions in BOS are achieved by system
design efforts, i.e. reducing the number of BOS parts, improving mechanical and
electrical integration of PV modules, array structures and power conversion electronics,
and improving mounting systems for easier, faster and cheaper installation. BOS
component standardization also helps in reducing cost, as it allows for higher volumes
of production (and economies of scale) and to shift system assembly from the field to
the factory. Increasing module efficiency also has an impact on BOS costs. For a given
installed capacity, higher efficiency modules require less area than c-Si modules,
reducing mounting structures, cabling and inverter costs. Learning by doing in design
and installation procedures also reduces BOS cost through reductions in labour costs.
PV system costs and market expansion
System cost reductions are also correlated with market expansion. In particular, a more
developed PV market tends to imply:
Higher competition among system developers and installers which reduces
margins;
Page 17
14
UK Energy Research Centre UKERC/WP/TPA/2013/009
The development of an experienced network of installers and wholesale
distribution network, which allows learning by doing and economies of scale
along the supply chain;
Higher purchasing power of system developers and installers for module and
system components in the international market;
More transparent and efficient administrative rules and grid connection
procedures, thus reducing transaction and financing costs due to delays in
completion of the PV systems installation and connection.
Some of the above points have been quantified in a recent study showing how, over the
last decade to 2010, PV module prices have been 90% and 180% of global average
module price in countries with PV markets respectively above 100MW/y and below
5MW/y (Werner et al., 2011). In other words, PV module prices are considerably lower in
countries with well-developed markets and supply chains.
To explore the correlation between PV system costs and market expansion, the PV
system CAPEX data that was presented in Figure 4 across several EU countries are here
presented for Germany, Italy and UK in Figure 6, together with the countries’ total
installed capacity for the 2000-2011 period. Germany and Italy are leading PV markets.
The impressive market expansion in Germany has been driven by the introduction of PV
policy support in the mid-2000s, i.e. a Feed in Tariffs (FIT) implemented in 2004 in
conjunction with ‘soft loan’ schemes, preceded by roof-top deployment programmes.
Similarly, Italy first implemented FITs in 2006 and started experiencing a major PV
market expansion in 2008 (once initial scheme implementation issues were resolved), to
become the largest world market in 2011.
Page 18
15
UK Energy Research Centre UKERC/WP/TPA/2013/009
Figure 6 PV system prices against total installed capacity in Germany, Italy and UK
Figure 6 shows that for a given module price, system CAPEX is higher in countries with
smaller PV markets. For example, in 2007 and 2008 (years of massive market expansion
in Germany (EPIA, 2011)) system CAPEX was on average higher in Italy compared to
Germany. Italian and German system CAPEX prices converged in 2010-2011, as the
Italian annual market reaches the GWs size. A similar pattern is evident for the UK,
which experienced a dramatic drop in system CAPEX after the introduction of a FIT
scheme in 2010, causing UK installed PV capacity to grow from about 30MW in 2008
(Cowley, 2009) to 750MW by 2011 (EPIA, 2012). Average system price dropped from
£6.71 in 2008 to £3.57 in 2010 and £2.75 in 20116. Module price decreases during the
last couple of years (as discussed above) certainly played a role in these rapid system
prices reductions. However, evidence shows how UK PV system prices have been falling
more than module prices since 2010, with reductions above 50% in the large scale PV
segment by mid-2012 (CEPA and PB, 2011, Parsons Brinckerhoff, 2012) (compared to
about 45% reduction in average global module prices). This indicates additional drivers
behind UK PV system price reductions as well as the drop in average module prices.
6 In the available data set (Figure 5) average UK system prices are lower in 2006 compared to 2008. This is due
to the data source: 2006 system prices come from the DTI Large Scale field trial statistics, i.e. they represent
systems of medium size Rudkin, E., Thornycroft, J., Njoku, C. & Cogzell, J. 2007. PV Large Scale building
integrated field trial. Third technical report - Case studies. Halcrow Group report for BERR. Department for
Business Enterprise & Regulatory Reform. London., whereas 2008 data comes from the Low Carbon Building
Programme statistics, i.e. mainly residential systems of small size Energy Saving Trust 2008. Statistics on PV
installation funded through Low Carbon Building Programme Data personally gathered from Energy Saving
Trust representative. March 2008.. The former are on average cheaper than the latter, as system price do not
scale linearly with system size.
Page 19
16
UK Energy Research Centre UKERC/WP/TPA/2013/009
Indeed, evidence also shows a correlation between market expansion and system / BOS
price reduction. For example, in 2007, system CAPEX was higher in the UK (with an
installed capacity of c.18MW), compared to Germany, (with over 4GW installed). In 2007
the average UK system price for a standard roof top c-Si system was £5,821/kWp, while
in Germany system integrator SolarWorld quoted €4,500/kWp (£3,487) for a similar
system (Candelise et al., 2010). In addition, the installation and commissioning share of
the total system price was about 19% in the UK and 6.2% in Germany (Candelise et al.,
2010), probably reflecting lower competition and a less developed and experienced
network of system developers and installers in the UK (Candelise et al., 2010, Jardine C.
and Bergman, 2009). The rapid convergence of UK system prices to those in more
developed PV markets also suggests rapid knowledge spillovers across countries i.e.
new countries and PV markets learning from other countries’ experiences (Schaeffer et
al., 2004b).
3.3 Methodological issues
This section discusses some of the limitation of experience curves and engineering
studies in estimating future PV costs (both at module and system level) and possible
reasons for the discrepancies between expectations of future costs and actual
outcomes.
3.3.1 Experience curves
The limitations of experience curves in predicting future technology development have
often been identified in the literature. For example, it has been pointed out that learning
can only partially explain cost reductions and that all factors associated with cost
reductions cannot be fully captured by a simple functional relationship between capacity
installed and unit cost (Clarke et al., 2006, Junginger et al., 2005, Nemet, 2006,
Papineau, 2006, Watanabe et al., 2003, Mukora et al., 2009, IEA, 2000). In particular,
some major uncertainties resulting from the use of experience curves for forecasting
future costs of PV technologies are here highlighted and discussed.
Sensitivity to input data
The extent and timing of future cost reduction is very sensitive to the estimated learning
rate, which in turn is also affected by the underlying data used (the period and the scope
covered). Table 3 summarizes the learning rate results from a selection of studies of PV
reduction trends. All these studies use price and market expansion data for the
historically conventional PV technology, crystalline silicon (c-Si) PV.
Page 20
17
UK Energy Research Centre UKERC/WP/TPA/2013/009
Study Learning
Rate Years Scope
Williams and Terzian, 1993 18.4% 1976-1992 US
Cody and Tiedje, 1997 22% 1976-1988 US
Schaeffer et al, 2004 20% 1976-2001 Global
Harmon, 2000 20.2% 1968-1998 Global
Maycock and Wakefield, 1975 22% 1959-1974 US
McDonald and Schrattenholzer, 2001 20% 1968-1998 Global
IEA, 2000 21% 1994 – 1998 Japan
Surek, 2005 20% 1976-2003 Global
Table 3. Learning rate variations among selected studies. Source: (Cody and Tiedje,
1997, Harmon, 2000, Maycock and Wakefield, 1975, McDonald and Schrattenholzer,
2001, Schaeffer et al., 2004a, Surek, 2005, Williams and Terzian, 1993, IEA, 2000)
Whilst the average PV historical learning rate appears to be in the order of 20%, even
small changes in the learning rate can affects long term estimates of cost reductions,
the market expansion needed to reach a given target cost and the potential timing for
such an achievement. Similarly, varying forecasts of future market growth affect the
estimation of the timing by which a certain cost reduction target would be achieved. For
example, in 2006 Trancik J. and Zweibel K.7 estimated, for a given learning rate, that
thin film PV might reach the cost of: $0.7/Wp in 2022 assuming a thin film growth rate
of 30%; 0.6$/Wp in 2020 or in 2018 assuming respectively a 40% and 50% growth rate;
0.5$/Wp in 2017 or 2016 assuming respectively a 60% and 70% growth rate.
In reality, and as discussed in Section 2.1, $0.7/Wp is already very close to being
achieved by thin film after experiencing very high market growth rates (above 70% in
2010 (Mints, 2011)) – much earlier than estimated (Trancik and Zweibel, 2006).
Moreover, historical evidence shows alternating periods of module price stabilization
followed by more rapid price decreases (see also Figure 7). Indeed, learning rates have
been below 20% in late 1980s-early 1990s and higher than 20% in late 1990s (the latter
7 One of the few experience curves studies which used separate experience curves for c-Si and thin film.
Page 21
18
UK Energy Research Centre UKERC/WP/TPA/2013/009
not coinciding with a high market growth rate, but possibly instead reflecting the impact
of R&D investments made before 1990s) (Nemet, 2006, Schaeffer et al., 2004b). Similar
fluctuations have also been experienced more recently as discussed in Section 2.1.
Figure 7. PV module experience curve (1980 -2010) (EU PV Technology Platform, 2011)
Technology differentiation and breakthrough
Experience curve analyses tend not to anticipate discontinuities in the learning rate,
which makes them inappropriate for predicting cost trends in discontinuous technology
fields. This is a particular concern for PV, as e.g. emerging thin film technologies have
already managed to achieve very low production costs earlier than conventional c-Si
technologies (as discussed in Section 3.1), and technological breakthroughs are
expected to occur when novel technologies under R&D reach commercialization stage.
Moreover, available PV experience curves are based on historical data for conventional
c-Si technologies and very limited or no data exists for other emerging PV technologies,
such as thin film or excitonic devices. Experience curves cannot be built for these
emergent technologies (except in a highly illustrative scenario fashion) because of the
absence of reliable data over a sufficiently long time period; clearly, this limits their use
in forecasting future aggregated PV technologies costs.
Price as a proxy of production costs
Since all manufacturers closely guard their design, construction, and operations costs, it
is not straightforward to build up a time series for manufacturing costs. Thus,
experience curves generally use PV module prices as a proxy for their production costs.
However, module prices are the result of a combination of production costs and
companies’ mark-up (price-cost margin), which in turn is affected by market forces
Page 22
19
UK Energy Research Centre UKERC/WP/TPA/2013/009
such as demand/supply dynamics and levels of market competition. Such market forces
affect prices of PV module and are beyond the learning effects captured by the
experience curve analysis, which instead attempt to identify the drivers behind
reductions in the module’s production cost. Indeed, as has been highlighted in Section
3.1, market dynamics, industry strategies and oversupply imbalance are likely to explain
a major part of the recent dramatic drop in PV module prices (rather than actual
production cost reductions).
PV as a compound learning system
PV experience curves have been mainly developed for PV module costs, yet PV should
more accurately be addressed as a compound learning system, i.e. accounting also for
learning trajectories and cost reductions at the balance of system (BOS) level. There is
relatively limited quantitative evidence on the drivers of cost reductions at BOS level, as
most cost reductions efforts (and most research literature) have concentrated on the PV
module (the major system component). This a reflection of the following difficulties:
BOS costs differ for different PV applications, e.g. grid-connected versus off-grid
and also between different grid-connected applications (roof mounted, ground
mounted, BIPV).
There are wide regional differences in the PV system type of design and
implementation and installation, which makes cross-country comparison
difficult.
System level cost reductions cannot be attributed to the learning and cost
reductions of individual system/hardware components, but are rather the result
of the combined effect of several factors.
PV system cost reductions are affected by country specific market developments,
policy and regulatory conditions.
For these reasons reliable input data over a sufficiently long time period are not readily
available for BOS, thus limiting the use of experience curves as both descriptors of past
trends and as a forecasting tool for system level costs. Learning rates based on
historical module trends cannot be applied to PV system learning nor can system level
cost reductions be attributed to the learning and cost reductions of individual
system/hardware components. Moreover, as PV system cost reductions are affected by
country specific market and regulatory conditions, learning rates experienced in one
country cannot be simply transposed to another one with a different regulatory and
market context. This particularly complicates the forecasting of future system level cost
reductions in countries with a nascent PV sector, as e.g. the UK before 2010, for which
sufficiently long historical time series for system prices and installed capacity are not
Page 23
20
UK Energy Research Centre UKERC/WP/TPA/2013/009
available and an experience curve cannot be built. In addition, a country specific
experience curve would not in any case be able to capture learning spillovers across
countries, from more mature markets (e.g. Germany) to emerging ones (e.g. UK).
3.3.2 Engineering assessment
Engineering assessment can assist in characterising and quantifying drivers behind
technological improvement, and their implications for cost reductions. It can also assist
in developing cost projections for those novel PV technologies for which historical data
are not available. It generally involves a combination of in-depth and technology specific
data gathering and expert elicitation. Therefore, this forecasting methodology entails a
degree of uncertainty arising from discretionary judgements (such as the level (and
timing) of efficiency achievable by a certain technology) including the possible biases
introduced by ’appraisal optimism’ (Gross et al., 2007). As discussed in Section 2.1,
engineering assessment of PV technology costs have been over-optimistic in assessing
future PV costs up to the early 2000s, and have then underestimated PV cost
reductions in the last decade. Nonetheless, they have provided a bottom up estimation
of the lower bound achievable for PV technologies costs.
Page 24
21
UK Energy Research Centre UKERC/WP/TPA/2013/009
4 Concluding remarks
This paper describes the significant reduction in PV technologies costs over time, both
at module and system level. It also discusses the major drivers behind module and PV
system production cost and price reductions. Overall, it can be remarked that:
1. Cost reductions in PV module technologies have been and will be further
achieved by a combination of R&D innovation (mainly at the materials and device
level) and incremental improvements of manufacturing and implementation
processes.
2. The increase in scale, both in manufacturing capacity and in market size, has
been a key factor in reducing costs. Evidence presented here has highlighted
how reductions in PV module production costs and prices have been facilitated
by a rapid production capacity up-scaling (along the whole production chain
including feedstock materials) and the consequent economies of scale and
learning by doing,. The dramatic increase in demand and market size in the last
decade, coupled with the availability of mature and fairly standardized
production processes for c-Si technologies has eased market entry for new
industry players and countries (e.g. in China and Taiwan in the last five years),
allowing quick ramping up in global production capacity. For thin film PV
technologies, turnkey production lines with high cost reduction potential have
been developed thus facilitating new investments and further capacity
expansion. In the case of CdTe technology in particular, the ability to ramp up
production capacity and improve production throughput has allowed one single
company, First Solar, to reduce production costs and become a market leader.
3. Modularity of the main PV system component, the module, allows diversity of
applications and easy implementation. This has facilitated the quick uptake of
the technology and enabled market expansion wherever the economics of the
investment have been set ‘right’, i.e. when policy support implemented in key
countries has made the investment viable (until grid parity is reached).
4. Correlation between market expansion and cost reduction is even more directly
evident at system level. Cost reductions at system level are the result of a
combination of learning factors, many of which are related to country specific
conditions affecting deployment of the technology and market size. The
evidence indicates a correlation between learning at the system level and
national market expansion.
Page 25
22
UK Energy Research Centre UKERC/WP/TPA/2013/009
Since the 1970s PV cost reductions have been the subject of a growing body of literature
comprising both experience curves and engineering-based studies. Overall, such
literature has succeed in predicting the cost reductions achieved by PV technologies,
although the specific target costs as well as the timing for their achievement has not
always coincided with the actual out-turns. In particular, forecasts of PV modules cost
reductions made before 2000 have been too optimistic when compared with actual
module price out-turns and the reverse has happened in the last decade, with recent
cost reductions exceeding previous forecasts. At the system level, UK forecasts of future
cost trajectories at system level have also been over pessimistic. UK system prices have
reached lower levels than previously predicted and future costs estimates have recently
been revised downwards.
Experience curves are an effective methodological tool to illustrate the historical cost
reduction trend for different types of technologies, and they are widely used to describe
progressive learning and technology change for energy models and scenario analysis.
However, uncertainties in their calculation and prediction as well as their inability to
predict cost trends for new and emerging technologies mean that caution and care
should be applied in using them for the analysis of PV future cost trends and to model
technological innovation within energy models and scenarios analysis. Engineering-
based assessments can assist in developing future costs estimates for PV technologies,
as they provide more detailed explanatory information regarding technological and
concomitant cost improvements, and can be used for those novel technologies for which
historical data are not available. However, such estimates are also subject to uncertainty
as they rely on expert judgement and in practice have proven not to correctly anticipate
cost reductions achieved.
In particular, neither experience curve nor engineering based studies have been able to
anticipate recent module price reductions and it still remains unclear as to the extent to
which these are the result of reduced production costs due to learning associated with
massive capacity expansion (something that, in principle, both experience curves and
engineering studies could have predicted assuming higher and faster market growth
rates) or rather the result of market forces including demand/supply imbalances,
country specific industrial policies and industry strategies. Experience curves seem to be
ill-suited to respond to questions such as this as they are essentially aggregate
observations, describing a simple functional relationship and cannot fully capture all of
the factors associated with cost reductions. Moreover, by using module prices as a
proxy of production costs they are intrinsically not suited to disentangle drivers
affecting production costs trajectories from the market forces influencing module
prices. A more detailed parameterised analysis of production costs and price dynamics
is probably needed in order to capture the several drivers involved, including multiple
R&D, supply chain, manufacturing, market and regulatory forces at work.
Page 26
23
UK Energy Research Centre UKERC/WP/TPA/2013/009
This paper also highlighted the challenges in estimating system level future costs and
the fact that system costs develop as a compound learning system, and as such are not
easily captured by experience curve analysis. Moreover, system costs trajectories are not
just affected by global module price trends but also by country specific PV
implementation conditions and national market expansion, thus they are subject to
national learning. Thus, unlike module prices which follow global dynamics, experience
and learning in system prices have a national specific component, mostly associated
with market expansion, which cannot easily be transferred from one country to another
(despite some spillover that might occur across countries) – which suggests that these
factors require careful consideration in any assessment of policy support for delivering
PV deployment and improved PV cost-effectiveness.
Page 27
24
UK Energy Research Centre UKERC/WP/TPA/2013/009
References
Arup 2011. Review of the generation costs and deployment potential of renewable
electricity technologies in the UK. Department of Energy and Climate Change. London.
Candelise, C. 2009. Technical and regulatory developments needed to foster grid-
connected photovoltaics in the UK electricity sector. PhD, Imperial College London.
Candelise, C., Gross, R. & Leach, M. 2010. Conditions for photovoltaics deployment in
the UK: the role of policy and technical developments. Proceedings of the Institution of
Mechanical Engineers, Part A: Journal of Power and Energy, 224, 153-166.
Castello, S., De Lillo, A. & Guastella, S. 2003. National Survey Report of PV Power
Applications in Italy, 2002. International Energy Agency, Co-operative Programme on
Photovoltaic Power Systems, Task 1. Italian National agency for new technologies (ENEA).
Castello, S., De Lillo, A. & Guastella, S. 2004. National Survey Report of PV Power
Applications in Italy, 2003. International Energy Agency, Co-operative Programme on
Photovoltaic Power Systems, Task 1. Italian National agency for new technologies (ENEA).
Castello, S., De Lillo, A. & Guastella, S. 2007. National Survey Report of PV Power
Applications in Italy, 2006. International Energy Agency, Co-operative Programme on
Photovoltaic Power Systems, Task 1. Italian National agency for new technologies (ENEA).
Castello, S., De Lillo, A., Guastella, S. & Paletta, F. 2008. National Survey Report of PV
Power Applications in Italy, 2007. International Energy Agency, Co-operative Programme
on Photovoltaic Power Systems, Task 1. Italian National agency for new technologies
(ENEA).
Castello, S., De Lillo, A., Guastella, S. & Paletta, F. 2009. National Survey Report of PV
Power Applications in Italy, 2008. International Energy Agency, Co-operative Programme
on Photovoltaic Power Systems, Task 1. Italian National agency for new technologies
(ENEA).
Castello, S., De Lillo, A., Guastella, S. & Paletta, F. 2010. National Survey Report of PV
Power Applications in Italy, 2009. International Energy Agency, Co-operative Programme
on Photovoltaic Power Systems, Task 1. Italian National agency for new technologies
(ENEA).
CEPA & PB 2011. Updates to the feed-in tariffs model. Documentaion of changes for
solar PV consultation - Report submitted to DECC by Cambridge Economic Policy
Page 28
25
UK Energy Research Centre UKERC/WP/TPA/2013/009
Associates Ltd and Parsons Brinckerhoff. Department of Energy & Climate Change.
London.
Chopra, K. L., Paulson, P. D. & Dutta, V. 2004. Thin film solar cells: an overview.
Progress in photovoltaics: research and applications, 12, 69-92.
Clarke, L., Weyant, J. & Birky, A. 2006. On the sources of technological change:
Assessing the evidence. Energy Economics, 28, 579-595.
Cody, G. D. & Tiedje, T. 1997. A learning curve approach to projecting cost and
performance for photovoltaic technologies. In: MCCONNELL, R. D. (ed.) Future
generation photovoltaic technologies, AIP Conference proceedings. Denver, CO.
Cowley, P. 2009. United Kingdom. PV technology and prospects. IEA PVPS Annual
Report, 2009. International Energy Agency Photovoltaic Power Systems Programme
(PVPS).
Ebinger, H. 2011. Challenging Crystalline Silicon - Oerlikon. Thin Film Solar Summit.
Berlin, March 2011.
Element Energy 2008. The growth potential for on-site renewable electricity generation
in the non domestic sector in England, Scotland and Wales. Department for Business
Enterprise & Regulatory Reform. London.
Element Energy 2009. Design of Feed-in Tariffs for Sub-5MW Electricity in Great Britain
Quantitative analysis for DECC. Department of Energy and Climate Change. London.
Energy Saving Trust 2008. Statistics on PV installation funded through Low Carbon
Building Programme Data personally gathered from Energy Saving Trust representative.
March 2008.
Englander, D., Mehta, S. & Bradford, T. 2009. 2009 Global PV demand analysis and
forecast: the anathomy of a shakeout. GreenTech Media and Prometeus Institute Report.
March 2009. GTM Research. Boston, MA.
EPIA 2011. Global market outlook for photovoltaics until 2015, EPIA 2011 Report.
European Photovoltaic Industry Association. Brussels.
EPIA 2012. EPIA Market Report 2011. European Photovoltaic Industry Association.
Brussels.
Ernst & Young 2011. Ernst & Young UK solar PV industry outlook - The UK 50kW to 5MW
solar PV market. Ernst & Young LLP. London.
Page 29
26
UK Energy Research Centre UKERC/WP/TPA/2013/009
EU PV Technology Platform 2007. A strategic research agenda for photovoltaic solar
energy technology. Report prepared by Working Group 3 "Science, Technology and
Applications" of the EU PV Technology Platform. Office for Official Publications of the
European Communities. Luxembourg.
EU PV Technology Platform 2011. A strategic research agenda for photovoltaic solar
energy technology, Edition 2 Report prepared by Working Group 3 "Science, Technology
and Applications" of the EU PV Technology Platform. Office for Official Publications of
the European Union. Luxembourg.
Fath, P. 2011. Latest developments in crystalline silicon based photovoltaics
manufacturing process technologies. Centrotherm Solar AG. PV SAT Conference.
Edinburgh, 6th-8th April 2011.
First Solar. 2011. First Solar Overview, Q3 2011 Performance [Online]. Available:
http://www.firstsolar.com/en/Projects/~/media/34AEF89EF9FE471FBEDD713DFD97916
9.ashx [Accessed March 2012].
Flynn, H. 2009. Photon Consulting's monthly silicon update. Photon International, the
photovoltaic magazine, January 2009.
Green, M. A., Emery, K., Hishikawa, Y., Warta, W. & Dunlop, E. D. 2012. Solar cell
efficiency tables (version 39). Progress in Photovoltaics: Research and Applications, 20,
12-20.
Gross, R., Heptonstall, P. & Blyth, W. 2007. Investment in electricity generation: the role
of costs, incentives and risks. UK Energy Research Centre. London.
Harmon, C. 2000. Experience curves of photovoltaic technology. International Institute
for Applied Systems Analysis. Laxenburg, Austria.
Hegedus, S. 2006. Thin film solar modules: the low cost, high throughput and versatile
alternative to Si wafers. Progress in photovoltaics: research and applications, 14, 393-
411.
Holzapfel, F. 2011. The Challange of Crystalline Silicon - Calyxo. 3rd Thinfilm Solar
Summit Berlin. Berlin, March 2011.
IEA-PVPS 2005. Trends in photovoltaic applications. Survey report of selected IEA
countries between 1992 and 2004. Report IEA - PVPS T1 - 14:2005. International Energy
Agency. Paris.
IEA 2000. Experience curves for energy policy technology. International Energy Agency.
Paris.
Page 30
27
UK Energy Research Centre UKERC/WP/TPA/2013/009
IHS iSuppli 2011. Solar PV cost per watt below $1 by Q1 2012, IHS iSuppli Report, June
2011. IHS iSuppli Market Intelligence.
Iken, J. 2012. Polysilicon production drives prices down. Sun and Wind Energy, January
2012.
IMS Research 2012. PV Module Price Tracker – Monthly - World. IMS Research Report.
Available at:
http://www.pvmarketresearch.com/report/Monthly_PV_Module_Price_Tracker_Monthly_
World IMS Research. Wellingborough.
IPCC 2011. Renewable Energy Sources and Climate Change Mitigation, Prepared by
Working Group III of the Intergovernmental Panel on Climate Change. In: EDENHOFER,
O., PICHS-MADRUGA, R., SOKONA, Y., SEYBOTH, K., MATSCHOSS, P., KADNER, S.,
ZWICKEL, T., EICKEMEIER, P., HANSEN, G., SCHLÖMER, S. & VON STECHOW, C. (eds.):
Cambridge University Press. Cambridge, UK and New York, NY, USA.
JA Solar. 2012. JA Solar company website - newspage [Online]. Available:
www.jasolar.com [Accessed March 2012].
Jager-Waldau, A. 2006. PV status report 2006. Research, solar cell production and
market implementation of photovoltaics - EUR 22346 EN. EU Commission, DG Joint
Research Centre. Brussels.
Jager-Waldau, A. 2008. PV Status Report 2008 - EUR 23604 EN - 2008. EU Commission,
DG Joint Research Centre, Renewable Energy Unit. Brussels.
Jager-Waldau, A. 2010. PV Status Report 2010 - EUR 24344 EN - 2010. EU Commission,
DG Joint Research Centre, Renewable Energy Unit. Brussels.
Jäger-Waldau, A. 2011. PV Status Report 2011 - EUR 24807 EN - 2011. EU Commission,
DG Joint Research Centre, Renewable Energy Unit. Brussels.
Jardine C. & Bergman, N. 2009. The status of the UK domestic PV market - A review of
the impact of the Low Carbon Building Programme. PVSAT - 5. Photovoltaic Science
Applications and Technology. 1-3 April 2009. Glyndwr University.
Junginger, M., Faaij, A. & Turkenburg, W. C. 2005. Global experience curves for wind
farms. Energy Policy, 33, 133-150.
Kazmerski, L. L. 2006. Solar photovoltaics R&D at the tipping point: A 2005 technology
overview. Journal of Electron Spectroscopy and Related Phenomena, 150, 105-135.
Page 31
28
UK Energy Research Centre UKERC/WP/TPA/2013/009
Maycock, P. D. 2011. PV module price data Personal correspondance with Paul Maycock,
2011.
Maycock, P. D. & Wakefield, G. F. 1975. Business analysis of solar photovoltaic
conversion. 11th IEEE Photovoltaic Specialists Conference. New York.
McDonald, A. & Schrattenholzer, L. 2001. Learning rates for energy technologies. Energy
Policy, 29, 255-261.
Mints, P. 2011. The Future Market for Thin Films. 3rd Thin Film Summit Europe. 3rd-4th
March, Berlin.
Mott Mcdonald 2011. Costs of low-carbon generation technologies. Committee on
Climate Change. London.
Mukora, A., Winskel, M., Jeffrey, H. & Mueller, M. 2009. Learning curves for emerging
technologies. Proceedings of the Institution of Civil Engineers, November 2009, 151-
159.
Nemet, G. F. 2006. Beyond the learning curve: factors influencing cost reductions in
photovoltaics. Energy Policy, 34, 3218-3232.
Papineau, M. 2006. An economic perspective on experience curves and dynamic
economies in renewable energy technologies. Energy Policy, 34, 422-432.
Parsons Brinckerhoff 2012. Solar PV cost update, Report commissioned by DECC.
Department of Energy and Climate Change. London.
Photon International 2011. Market survey. Cell and module production 2010. Photon
International, the photovoltaic magazine, March 2011.
Photovoltaics Bulletin 2003. Scope for PV energy savings for UK residents. Issue 12,
(December 2003), 2.
Prior, B. & Campbell, C. 2012. Polysilicon 2012-2016: Supply, Demand & Implications
for the Global PV Industry. GTM Research. Boston, MA.
Rogol, M. 2009. The fifth peak. Photon Consulting's monthly market commentary.
Photon International, the photovoltaic magazine, January 2009.
Rudkin, E., Thornycroft, J., Njoku, C. & Cogzell, J. 2007. PV Large Scale building
integrated field trial. Third technical report - Case studies. Halcrow Group report for
BERR. Department for Business Enterprise & Regulatory Reform. London.
Page 32
29
UK Energy Research Centre UKERC/WP/TPA/2013/009
Schaeffer, G. J., Alsema, E. A., Seebregts, A., Beurskens, L., De Moor, H., Durstewitz, M.,
Perrin, M., Boulanger, P., Laukamp, H. & Zuccaro, C. 2004a. Photovoltaic experiences.
Synthesis report of the Photex-project. ECN (Energy Research Centre of the
Netherlands). Petten.
Schaeffer, G. J., Anselma, E., Seebregts, A., Beurskens, L., De Moor, H., Van Sark, W.,
Durstewitz, M., Perrin, M., Boulanger, P., Laukamp, H. & Zuccaro, C. 2004b. Learning
from the sun. Analysis of the use of experience curves for energy policy purposes: the
case of photovoltaic power. Final report of the Photex project. ECN (Energy Research
Centre of the Netherlands). Petten.
Solarbuzz. 2012. Solarbuzz module price survey [Online]. Available:
http://solarbuzz.com/facts-and-figures/retail-price-environment/module-prices
[Accessed January 2012].
Sonnenertrag.eu. 2011. International photovoltaic database [Online]. Available:
http://www.solar-yield.eu/home/main [Accessed October 2011].
Surek, T. 2005. Crystal growth and materials research in photovoltaics: progress and
challenges. Journal of Crystal Growth, 275, 292-304.
Trancik, J. & Zweibel, K. 2006. Technology choice and the cost reduction potential of
photovoltaics. IEEE 4th World Conference on Photovoltaic Energy Conversion. 7-12 May
2006, Hawaii.
Watanabe, C., Nagamatsu, A. & Griffy-Brown, C. 2003. Behavior of technology in
reducing prices of innovative goods--an analysis of the governing factors of variance of
PV module prices. Technovation, 23, 423-436.
Werner, C., Gerlach, A., Adelmann, P. & Breyer, C. 2011. Global cumulative installed
photovoltaic capacity and respective international trade flows. 26th European
Photovoltaci Solar Energy Conference and Exhibition. September 2011, Hamburg
Williams, R. H. & Terzian, G. 1993. A benefit/cost analysis of accelerated development of
photovoltaic technology. Center for energy and environmental studies, Princeton
University. Princeton, NJ.
Woodcock, J., Schade, H., Maurus, M., Dimmler, B., Springer, J. & Ricaud, A. 1997. Study
of the upscaling of thin film solar cell manufacturing towards 500MW per annum. 14th
PV Solar Energy Conference. Barcelona.
Zweibel, K. 2000. Thin film PV manufacturing: Materials costs and their optimization.
Solar Energy Materials and Solar Cells, 63, 375-386.
Page 33
30
UK Energy Research Centre UKERC/WP/TPA/2013/009
Zweibel, K. 2005. The terawatt challenge for thin-film PV, NREL Technical Report.
National Renewable Energy Laboratory. Golden, CO.


![RE Technologies Cost Analysis-SOLAR PV[1]](https://static.documents.pub/doc/80x56/5529b0764a79599a158b47dd/re-technologies-cost-analysis-solar-pv1.jpg)


