Consider the following information developed Consider the following information developed by the accountant at Curl, Inc.:by the accountant at Curl, Inc.:
Total Per Unit PercentSales (500 surfboards) 250,000$ 500$ 100%Less: variable expenses 150,000 300 60%Contribution margin 100,000$ 200$ 40%Less: fixed expenses 80,000 Net income 20,000$
Total Per Unit PercentSales (500 surfboards) 250,000$ 500$ 100%Less: variable expenses 150,000 300 60%Contribution margin 100,000$ 200$ 40%Less: fixed expenses 80,000 Net income 20,000$
Total Per Unit PercentSales (500 surfboards) 250,000$ 500$ 100%Less: variable expenses 150,000 300 60%Contribution margin 100,000$ 200$ 40%Less: fixed expenses 80,000 Net income 20,000$
Total Per Unit PercentSales (500 surfboards) 250,000$ 500$ 100%Less: variable expenses 150,000 300 60%Contribution margin 100,000$ 200$ 40%Less: fixed expenses 80,000 Net income 20,000$
Contribution-Margin Approach
For each additional surf board sold, Curl For each additional surf board sold, Curl generates $200 in contribution margin.generates $200 in contribution margin.
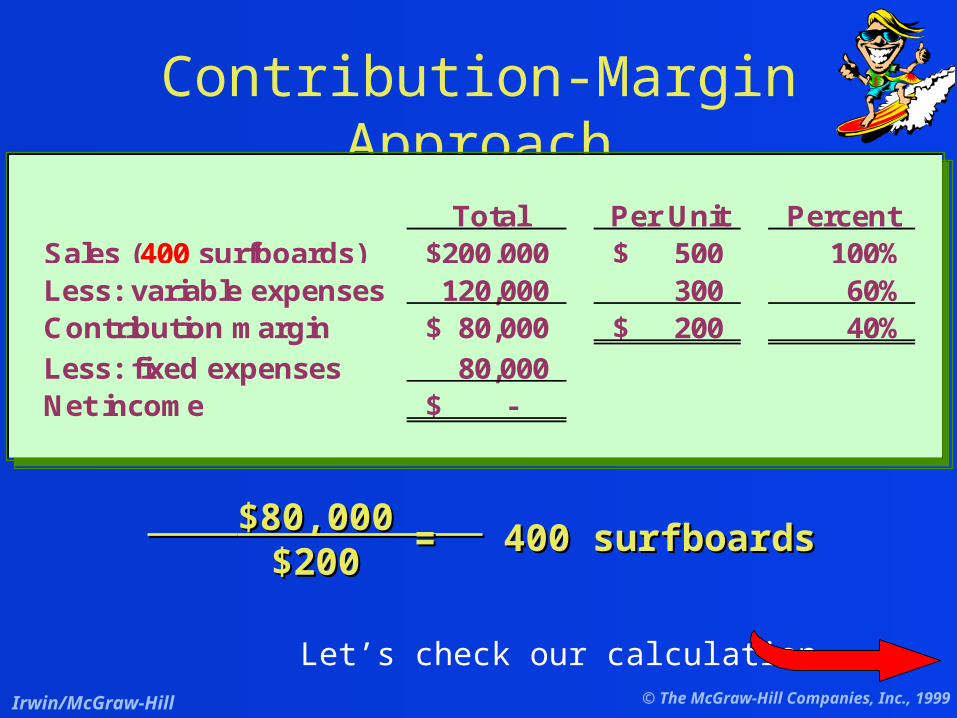
Total Per Unit PercentSales (400 surfboards) 200,000$ 500$ 100%Less: variable expenses 120,000 300 60%Contribution margin 80,000$ 200$ 40%Less: fixed expenses 80,000 Net income -$
Total Per Unit PercentSales (400 surfboards) 200,000$ 500$ 100%Less: variable expenses 120,000 300 60%Contribution margin 80,000$ 200$ 40%Less: fixed expenses 80,000 Net income -$
Total Per Unit PercentSales (400 surfboards) 200,000$ 500$ 100%Less: variable expenses 120,000 300 60%Contribution margin 80,000$ 200$ 40%Less: fixed expenses 80,000 Net income -$
Total Per Unit PercentSales (400 surfboards) 200,000$ 500$ 100%Less: variable expenses 120,000 300 60%Contribution margin 80,000$ 200$ 40%Less: fixed expenses 80,000 Net income -$
We can calculate the break-even point in We can calculate the break-even point in sales sales dollars dollars rather than units by using the rather than units by using the
We can calculate the break-even point in We can calculate the break-even point in sales sales dollars dollars rather than units by using the rather than units by using the
Total Per Unit PercentSales (400 surfboards) 200,000$ 500$ 100%Less: variable expenses 120,000 300 60%Contribution margin 80,000$ 200$ 40%Less: fixed expenses 80,000 Net income -$
Total Per Unit PercentSales (400 surfboards) 200,000$ 500$ 100%Less: variable expenses 120,000 300 60%Contribution margin 80,000$ 200$ 40%Less: fixed expenses 80,000 Net income -$
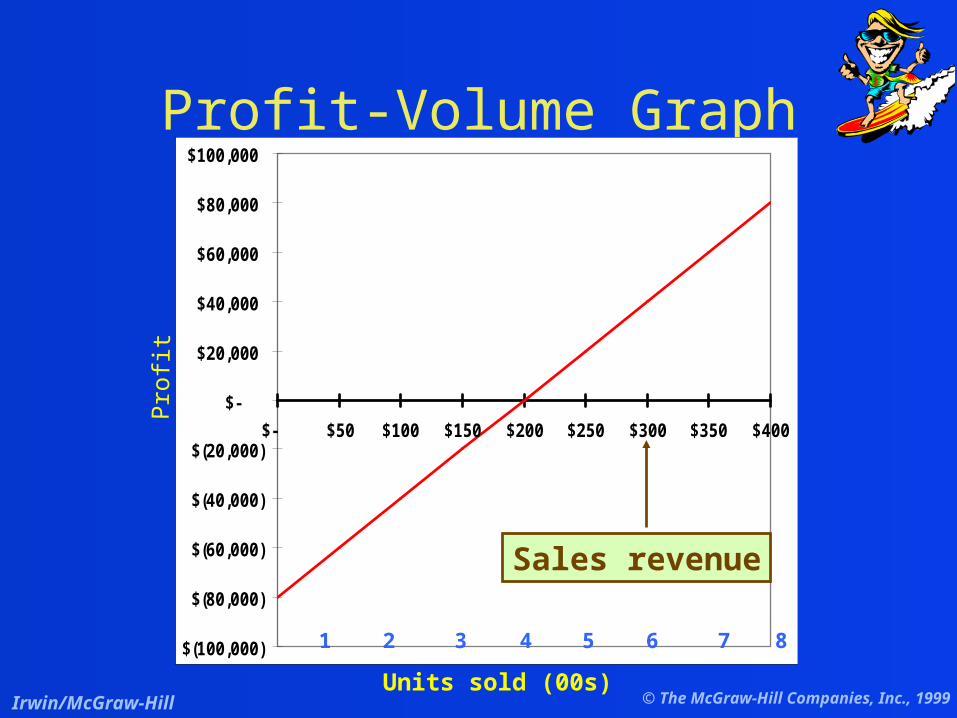
At the break-even point profit equals zero,At the break-even point profit equals zero,and the sales volume in units is unknown.and the sales volume in units is unknown.
At the break-even point profit equals zero,At the break-even point profit equals zero,and the sales volume in units is unknown.and the sales volume in units is unknown.
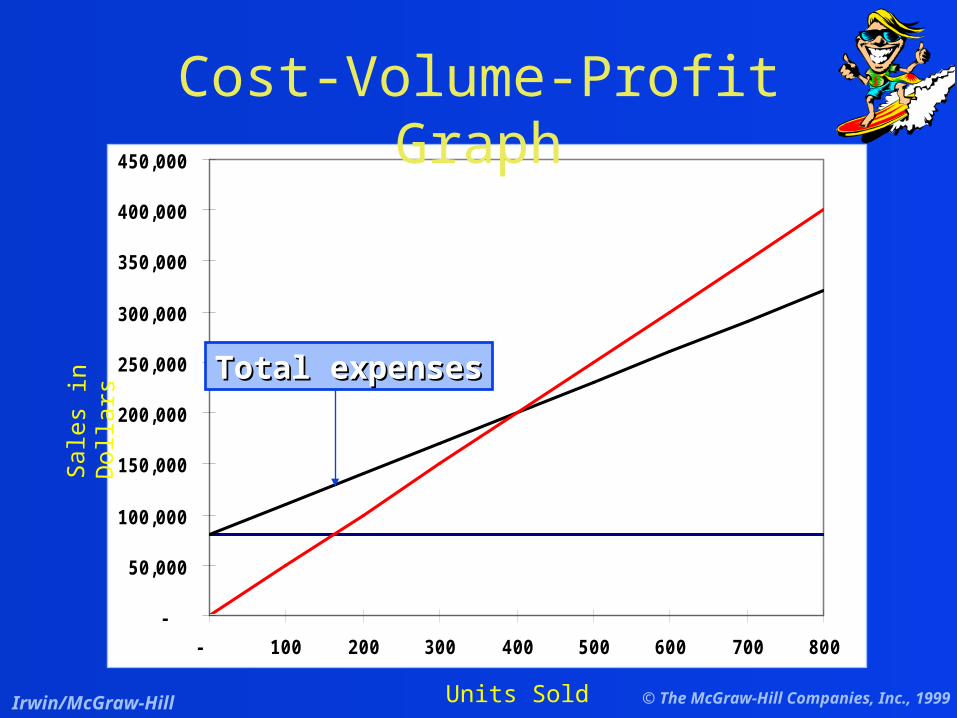
Viewing CVP relationships in a graph gives managers Viewing CVP relationships in a graph gives managers a perspective that can be obtained in no other way.a perspective that can be obtained in no other way.Consider the following information for Curl, Inc.:Consider the following information for Curl, Inc.:
Curl, Inc. has a break-even point of $200,000. If Curl, Inc. has a break-even point of $200,000. If actual sales are $250,000, the safety margin is actual sales are $250,000, the safety margin is
$50,000$50,000 or 100 surfboards. or 100 surfboards.Break-even
Because of increases in cost of raw materials, Because of increases in cost of raw materials, Curl’s variable cost per unit has increased Curl’s variable cost per unit has increased from $300 to $310 per surfboard. With no from $300 to $310 per surfboard. With no
change in selling price per unit, what will be change in selling price per unit, what will be the new break-even point?the new break-even point?
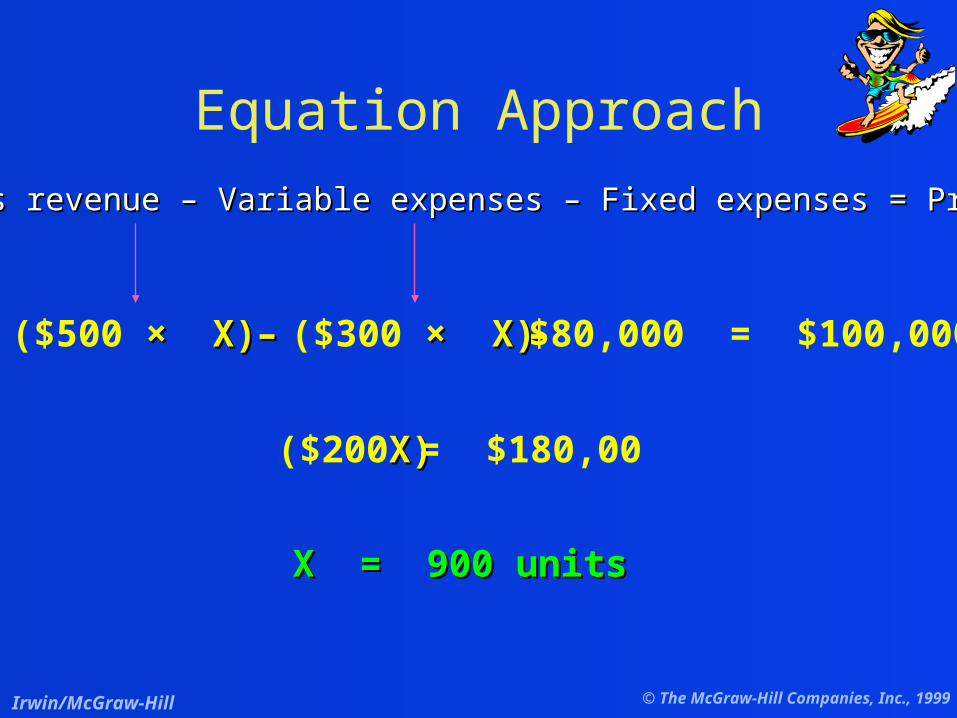
($500 × X)× X) ($310 × X)× X)–– –– $80,000 = $0
X = 422 units X = 422 units (rounded up)(rounded up)
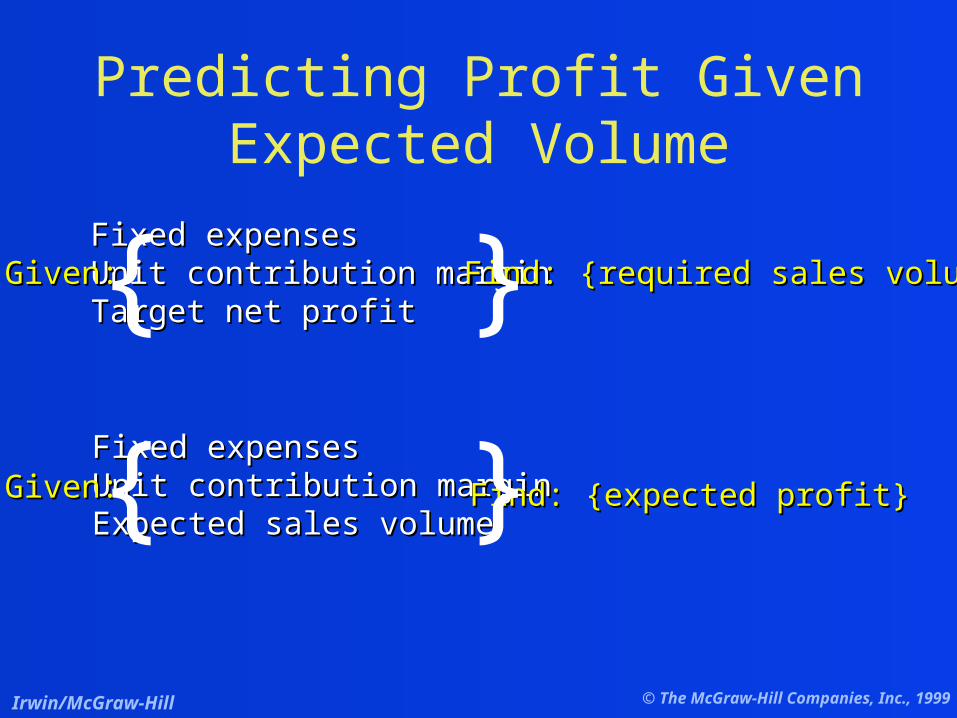
In the coming year, Curl’s owner expects to sell In the coming year, Curl’s owner expects to sell 525 surfboards. The unit contribution margin is 525 surfboards. The unit contribution margin is
expected to be $190, and fixed costs are expected to be $190, and fixed costs are expected to increase to $90,000.expected to increase to $90,000.
How much profit can we expect to earn?How much profit can we expect to earn?
In the coming year, Curl’s owner expects to sell In the coming year, Curl’s owner expects to sell 525 surfboards. The unit contribution margin is 525 surfboards. The unit contribution margin is
expected to be $190, and fixed costs are expected to be $190, and fixed costs are expected to increase to $90,000.expected to increase to $90,000.
For a company with more than one product, For a company with more than one product, sales mix is the relative combination in which sales mix is the relative combination in which
a company’s products are sold.a company’s products are sold.Different products have different selling prices, Different products have different selling prices,
cost structures, and contribution margins.cost structures, and contribution margins.
Let’s assume Curl sells surfboards and Let’s assume Curl sells surfboards and sailboards and see how we deal with sailboards and see how we deal with
Selling price is constant throughout Selling price is constant throughout the entire relevant range.the entire relevant range.
Costs are linear over the relevant Costs are linear over the relevant range.range.
In multiproduct companies, the sales In multiproduct companies, the sales mix is constant.mix is constant.
In manufacturing firms, inventories In manufacturing firms, inventories do not change (units produced = do not change (units produced = units sold).units sold).
The cost structure of an organization is the The cost structure of an organization is the relative proportion of its fixed and variable relative proportion of its fixed and variable costs.costs.
Operating leverage is . . .Operating leverage is . . . the extent to which an organization uses fixed the extent to which an organization uses fixed
costs in its cost structure.costs in its cost structure. greatest in companies that have a high proportion greatest in companies that have a high proportion
of fixed costs in relation to variable costs.of fixed costs in relation to variable costs.
A measure of how a percentage change in A measure of how a percentage change in sales will affect profits.sales will affect profits.
If Curl increases its sales by 10%, what If Curl increases its sales by 10%, what will be the percentage increase in net will be the percentage increase in net
CVP Analysis, Activity-Based Costing, and Advanced Manufacturing Systems
An activity-based costing system can An activity-based costing system can provide a much more complete picture of provide a much more complete picture of cost-volume-profit relationships and thus cost-volume-profit relationships and thus provide better information to managers.provide better information to managers.
Break-evenBreak-evenpointpoint
== Fixed costs Fixed costs Unit contribution marginUnit contribution margin
Overhead costs like setup, inspection, and Overhead costs like setup, inspection, and material handling are fixed with respect to material handling are fixed with respect to sales volumesales volume, but they are not fixed with , but they are not fixed with
respect to other respect to other cost driverscost drivers..
This is the fundamental distinction This is the fundamental distinction between a traditional CVP analysis and an between a traditional CVP analysis and an


![[ba] Validity date from [BA] COUNTRY [ba] Viet Nam 00068 ... · PDF file[ba] Name [ba] City [ba] Regions [ba] Activities [ba] Remark [ba] Date of request ... DL 115 Nha Trang FISCO](https://static.documents.pub/doc/80x56/5a791ef27f8b9a9d218e108a/ba-validity-date-from-ba-country-ba-viet-nam-00068-ba-name-ba-city.jpg)


