32
Costs And Returns Of Producing Market Hogs In Alabama / 4 ,d\ ~ "~~ BULLETIN 406 NOVEMBER 1970 Agricultural Experiment Station r AUBURN UNIVERSITY ~7 I E. V. Smith, Director/Auburn, Alabama

Costs And Returns OfProducing Market Hogs
In Alabama
/ 4
,d\ ~ "~~
BULLETIN 406
NOVEMBER 1970
Agricultural Experiment Station r
AUBURN UNIVERSITY ~7 IE. V. Smith, Director/Auburn, Alabama

CONTENTS
Page
IN TRODU CTION -------------------- - - - - - - - - - - - - 3
OBJECTIVES OF STUDY ----------------- ----- -3
M ETHOD OF STUDY---- --- ---- --- ---- --- ---- --- - - 4
Selection of Sam ple -- -- - -- -- - -- -- - -- -- - -- - - 4
C ost Procedures --- --- --- -- --- --- --- -- --- --- - 4
Description of Farms ----------------- ---- -5
COSTS AND RETURNS .--- -- -- -- -- -- --- -- -- - --- -- - 7
Pounds of Pork Sold -- -- - -- -- - -- -- - -- -- - -- - - 9
Optimum Size of Enterprise--------------------------14
C ost of Production -------------------- ---------------- 14
System of Finishing--------------- ------------------- 18
M arket H og Budgets -------------------------------- 21
SU M M A R Y ----------------------- ---------------------2 6
C O N CLU SIO N S .---------- -- -- -- ---- - ---- --- ---- - -- ----- 27A P P E +N D IX -- - - -- - - - - - - - - --- - - - - - -- - - - - -- - -- - - - - - - - - --- 2 8
FIRST PRINTING 3M, NOVEMBER 1970

Costs And Returns Of
Producing Market Hogs
In Alabama'
THOMAS A. HUGHES, JR. and SIDNEY C. BELL
INTRODUCTION
ALABAMA MARKET HOG prices have been fairly high since 1965,averaging about $20.00 per hundredweight. This higher price hasplaced hogs in a favorable profit position compared to other en-terprises. This factor as well as no market restrictions for begin-ning a market hog enterprise has contributed to increased interestin the market hog enterprise as a means to increase profit on afarm.3
The most common type of swine enterprise on Alabama farmsis the farrow-to-finish operation. Producers with these type op-erations raise and finish feeder pigs to a final market hog weightof 180-240 pounds. Rising costs of factors of production havecaused many producers to look for ways of improving their pro-duction efficiency.
OBJECTIVES OF THE STUDY
Many farmers are considering changes in the organization oftheir farm businesses to include a farrow-to-finish hog enterprisein order to obtain greater profits. Accurate and realistic budgets
SThis report is based on research work carried out under project Alabama 1-046supported by State research funds. Appreciation is expressed to the swine pro-ducers who supplied information for use in this study.
2 Former Graduate Assistant now in military service and Associate Professor,Department of Agricultural Economics and Rural Sociology.'100 Years Alabama Crop, Livestock and Income Data. Auburn University(Ala.) Agricultural Experiment Station, March 1968, p. 65.
4 ALABAMA AGRICULTURAL EXPERIMENT STATION
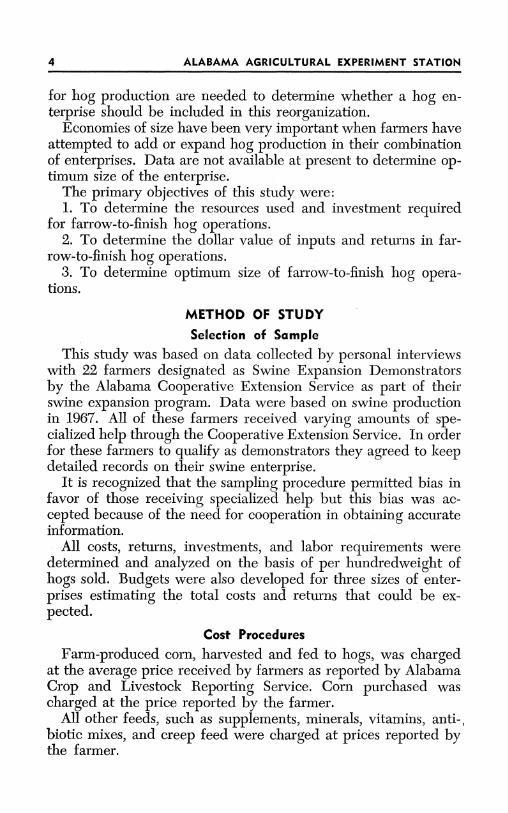
for hog production are needed to determine whether a hog en-terprise should be included in this reorganization.
Economies of size have been very important when farmers haveattempted to add or expand hog production in their combinationof enterprises. Data are not available at present to determine op-timum size of the enterprise.
The primary objectives of this study were:1. To determine the resources used and investment required
for farrow-to-finish hog operations.2. To determine the dollar value of inputs and returns in far-
row-to-finish hog operations.3. To determine optimum size of farrow-to-finish hog opera-
tions.
METHOD OF STUDYSelection of Sample
This study was based on data collected by personal interviewswith 22 farmers designated as Swine Expansion Demonstratorsby the Alabama Cooperative Extension Service as part of theirswine expansion program. Data were based on swine productionin 1967. All of these farmers received varying amounts of spe-cialized help through the Cooperative Extension Service. In orderfor these farmers to qualify as demonstrators they agreed to keepdetailed records on their swine enterprise.
It is recognized that the sampling procedure permitted bias infavor of those receiving specialized help but this bias was ac-cepted because of the need for cooperation in obtaining accurateinformation.
All costs, returns, investments, and labor requirements weredetermined and analyzed on the basis of per hundredweight ofhogs sold. Budgets were also developed for three sizes of enter-prises estimating the total costs and returns that could be ex-pected.
Cost ProceduresFarm-produced corn, harvested and fed to hogs, was charged
at the average price received by farmers as reported by AlabamaCrop and Livestock Reporting Service. Corn purchased wascharged at the price reported by the farmer.
All other feeds, such as supplements, minerals, vitamins, anti-,biotic mixes, and creep feed were charged at prices reported bythe farmer.

PRODUCING MARKET HOGS 5
Pasture charges were based on budgets developed as part ofthis study, Appendix Tables 1, 2, and 3. Only the variable expenseswere charged. Prices used for these expenses were those reportedby the farmers.
Interest on operating capital was charged at 8 per cent perannum for a 6-month period.
Variable expenses, other than feed, pasture, and interest onoperating capital, were charged at the rate reported by thefarmer.
Charges for buildings, equipment, and fences were based onthe annual rate of depreciation as calculated by the straight linemethod. An expected life of 20 years with a salvage value of 5per cent was used for calculating charges for the farrowing-nur-sery houses, finishing parlors, and fencing. Grain storage facilitieswere estimated to have an expected life of 15 years and 5 per centsalvage value. Charges for equipment and miscellaneous itemswere based on an estimated life of 10 years with no salvage value.
Interest was charged at a rate of 6 per cent on the average valueof fixed capital and the average value of the breeding herd.
Insurance was charged for buildings, equipment, and breedingherd. This charge was based on the estimated new value andcalculated at $0.375 per one hundred dollars.
Tax charges were based on the average value of land andbuildings. Taxes were calculated by assessing the items taxed at30 per cent of their average value and applying the millage rateof the county in which the farm was located.
All labor, both operator and hired, was charged at $1.50 perhour. The labor requirements were based on labor requirementsas reported by the farmers.
Description of Farms
The 22 farms ranged in size from 90 to 13,000 acres with theaverage size being 1,156 acres. These farms had an average of327 acres of cropland and 157 acres of improved pasture. Corn,with 19 of the 22 farmers producing it, was the most commonrow crop. Other crops grown were cotton on five farms, peanutson nine farms, soybeans on seven farms, small grains on eightfarms, and miscellaneous crops on eight farms.
All producers utilized permanent farrowing houses. Two-thirdsof the farrowing houses were of pole-type construction with opensides and concrete floors. All houses except one were provided

6 ALABAMA AGRICULTURAL EXPERIMENT STATIO;
with heating systems. Only nine of the farrowing houses wereequipped with cooling systems.
All producers were finishing hogs in confinement. Fifteen producers finished their hogs in hand-feeding parlors. All feedingparlors were of low cost pole-type construction with open sidesand concrete floors. Eight parlors were equipped with coolingsystems but none had a heating system. Seven producers provided field shelters for the brood herd, but most producers utilizednatural cover as field shelters.
All producers raised crossbred hogs. The most popular crosswas Hampshire and Landrace. However, many other crosses wercused. Some producers were using three- and four-way crosses.
Ten of the 22 producers were using performance tested boars(tested for rate and efficiency of gain). Carcass quality tests wercalso conducted on littermates.
Gross sales from the hog enterprise accounted for 50 per cenior more of total gross sales of the farm on 13 of the 22 farms.
Some of the personal characteristics of farmers interviewedwere as follows:
Characteristics Average no. of years
Age 45Formal education 12Experience operating farm 20Experience raising hogs 17
Fifteen of the producers indicated that they planned to expandproduction in the future. Reasons given for further expansionwere varied. However, the two predominant reasons were to im-prove labor efficiency and increase volume of business. Only oneproducer indicated that production would be decreased becauseof reduced labor available. Six producers planned to maintaintheir present level of production.
Pigs were weaned between 3 and 8 weeks of age with the aver-age age of 6.7 weeks. The average age of hogs at marketing was6 months.
Adoption of recommended production practices was high forthese producers. Some of the recommended production practicesand the per cent of producers using the practice are shown inTable 1.
All producers kept feed and water available free choice forhogs on feed. Most finishing houses were cleaned at intervals oftwo days or less.

g"ODUCING MARKET HOGS 7
TABLE 1. PER CENT OF FARROW-TO-FINISH SWINE PRODUCERS USINGSELECTED PRACTICES, ALABAMA, 1967
Practice Per cent of producersusing practice
)isinfect farrow ing houses------------------------------ -100' lip needle teeth ------------------------------------- -91Ireat pigs for anem ia------------------------------- -91
'lip avel cords------ ------ ------ ------ ----- - -- -77W orm m arket hogs------------------------ ---- ---- -75W orm brood herd------------------------------ --- -68V accinate for cholera ------------------------------------- -64Vaccinate for leptospirosis------------------------ -50Vaccinate for erysipelas-------- ------- ----- --- ---- -45R otate P astu res ------------ ---- ----- -------- ------- - -4 1
The amount of labor required for the swine enterprise de-pended upon the amount of labor saving equipment used, man-agement ability of the operator, and size of the enterprise. Hiredlabor was utilized on 11 of 22 farms enumerated. The amount oflabor hired varied from a few days a year to performing almostall the work. Hired labor performed more than 50 per cent of thework on six farms. The operator and/or his family performed allthe work required on 11 farms.
All returns, costs, investments, and labor requirements were de-
termined on the basis of per hundredweight of hogs sold.
COSTS AND RETURNS
The total cost of hogs produced varied from $15.88 to $33.87per hundredweight sold. The average total cost of production forthe 22 producers was $20.37, Table 2. This included a charge forland and labor. The largest single cost item was feed, accountingfor 68.3 per cent of the total. Labor was the second largest costitem, accounting for 16.3 per cent of the total cost.
The average gross receipts for the 22 producers was $20.24 perhundredweight sold, Table 3. This included the gross sales perhundredweight of pork sold plus the change in inventory perhundredweight. Gross sales included the sale of finished hogs,culled sows, and boars.
The average net returns to land, labor, and management was$3.33 per hundredweight of pork sold. This figure does not reflectany charge for land or labor. When land is charged at 6 per centof market value, the net return to labor and management is $3.19per hundredweight sold. Using a labor charge of $1.50 per hourfor the average labor requirements of 2.21 hours per hundred-

8 ALABAMA AGRICULTURAL EXPERIMENT STATION
TABLE 2. AVERAGE COSTS PER HUNDREDWEIGHT OF HOGS SOLD FOR22 FARROW-TO-FINISH Hoc ENTERPRISES, ALABAMA, 19671
Feed costsC o rn -- - - - - - - - - - - - - - -Protein supplementFeed additives2
Creep and starterO ther -- - --- --- - -
T otal -- -- - - -- - -- - -
Non-feed variable costsPasture-- -- - -- -- - - - -Replacement stockVaccination and veterinaryTrucking expensesE le ctricity--------------R epairs ------------ ----Other cash expenses ------Interest on oper. cap.-----T o tal - - - - - - - - - - - - - - - - - -Fixed costsCapital depreciation .-----Interest, taxes, insurance---T o ta l--- - - - - - - - - - - - - - - - -Other costsL an d -- - - - - - - - - - - - - - - - - -
T o ta l- -- - - - - - - - - - - - - - - --
Total cost--20.37
1 Average pounds of hogs sold per enterprise, 1,251.8 cwt.2 Vitamins, minerals, and antibiotics.
TABLE 3. AVERAGE COSTS AND RETURNS PER HUNDREDWEIGHT OF HOGS SOLDFOR 22 FARROW-TO-FINISH HOG ENTERPRISES, ALABAMA, 1967
Item Amount
DollarsGross receiptsG ro ss sales -- - - - - - - - - - - - - - - - - - - - - - - - - - - - - - - - - - - - - - - - - - - - 19 .7 1Inventory change ----------------------------------------. 53T o tal - - - - - - - - - - - - - - - - - - - - - - - - - - - - - - - - - -- 2 0 .2 4
CostsF e e d - - - - - - - - - - - - - - - - - - - - - - - - -- - - - - - - - - - - - - - - - - - - - - - - - -1 3 .9 2N on-feed variable------------------------------- -------- 1.94T otal fixed ---- --- --- ---- --- --- ---- --- --- -- 1.05T o ta l - - - - - - - - - - - - - - - --- - - - - - - - - - - - - - - - - - - - - - - 1 6 .9 1
ReturnsReturns to land, labor, and management.-------------------- 3.33C ost of land - --- - - - - - - - - - -- - - - - - - - - - - - - -. 14Return to labor and management--- 3.19Cost of labor- - -- 3.32--- --- -- -- -- --Return to m anagem ent----------------------------------- -. 13A verage investm ent------------------------------ -------- 9.33R eturn to investm ent-------------------------------------- - .43
Item Amount
Dollars
8.223.92
.581.16
.0413.92
.20
.24
.20
.18
.16
.12
.23
.611.94
.56.49
1.05
.143.323.46

PRODUCING MARKET HOGS 9
TABLE 4. AVERAGE INVESTMENT IN CAPITAL ASSETS (NEW) AND AVERAGE
LABOR REQUIREMENTS PER HUNDREDWEIGHT OF PORK SOLD FOR22 FARROW-TO-FINISH HOG ENTERPRISES, ALABAMA, 1967
Item Amount
DollarsBuildings and equipmentFencing --------------------------------. 60FarroWing houses2.05------Finishing parlors 1.97---Feed storage 0----------------1.60Equipment 2.28--------------------Miscellaneous -------------------. 25T o ta l- - - - - - - - - - - - - - - - - - - - - - - - - - - - - -- 8 .7 5
Brood stockB rood sow s ----- ---- ----- ---- ----- ---- ----- --- -2.10G ilts -- - - - - - - - - - - - - - - - - - - - - - - - - - - - - - - - - - - -. 2 9B o a rs - -- -- -- -- -- -- -- -- -- -- -- -- -- -- -- - -- -- .2 7T o ta l- - - - - - - - - - - - - - - - - - - - - - - - - - - - - -- 2 .6 6
Total investment -- ------------------ 11.41
Labor requirements HoursH ire d -- - - - - - - - - - - - - - - - - - - - - - - - - - - - - - -. 9 7Operator---------------- 1.---2--------------------4T o ta l -- - - - - - - - - - - - - - - - - - - - - - - - - - - - - - - - - - -2 .2 1
weight, Table 4, the labor charge was $3.32. When the laborcharge was subtracted, the average return to management was-$0.13. However, even with a negative return to management,operators were receiving an average labor income of $1.50 perhour and an average of 4.61 per cent return on investment.
The average investment in buildings and equipment (new)was $8.75 per hundredweight of pork sold. The average invest-ment in brood stock per one hundred pounds sold was $2.66.
Pounds of Pork Sold
To determine if economies of size were present, the data were.divided into three groupings. Analysis of these results indicatedthat economies of size were present, Table 5.
As size of enterprise increased, costs per hundredweight de-creased rapidly at first, then decreased slowly. The total cost de-creased significantly when the size of enterprise increased, Ap-pendix Table 4. Feed, non-feed variables, and fixed costs werenot significantly different for the three size groupings. However,when these costs were combined and analyzed, there was a sig-nificant reduction in their combined cost as the size of the enter-prise increased.

10 ALABAMA AGRICULTURAL EXPERIMENT STATION
TABLE 5. AVERAGE COSTS PER HUNDREDWEIGHT OF HOGS SOLD, FARROW-TO-FINISH SWINE PRODUCERS BY SIZE OF ENTERPRISE, ALABAMA, 1967
ItemSize of enterpriseSmall Middle Large
N o. of producers --------------------------------------- 7 9 6Av. 100 lb. of pork sold---------------------------- 473.60 959.92 2,597.46
DollarsFeed costsCorn -------------------- 9.51 8.58 7.74Protein supplem ent---------------------------------- 4.11 3.76 3.97Feed additives ---------1 ------------------------- .54 .24 .77Creep and starter----------- 1.14 1.02 1.24O th er -- --- ----- --- ----- --- --- -- -------- .13 .11Total------------------ 15.43 13.71 13.72
Non-feed variable costsP asture ----------------- ---------------------- .23 .20 .20Replacem ent stock----------------------------------- .35 .14 .29Vaccination and veterinary---------------------- .23 .20 .19Trucking expenses --- _---------------------- ---- .18 .17 .18E lectricity -------------------------------------------------- .1 8 .15 .15R epairs------------------------- ---- -- ----- ----- .12 .14 .10Other cash expenses ------------------------ ---- _. .13 .27 .24
Interest on oper. cap.--------_---------------- ----- .67 .60 .60
Total------------------- 2.09 1.87 1.95
Fixed costsCapital depreciation _------------------------------_ .74 .62 .49Interest, taxes, insurance-------------------------- .63 .54 .44Total----------- - - - 1.37 1.16 .93
Other costsLand----- - -- .18 .20 .12Labor---- - - - - - - 4.59 3.78 2.79Total----------------------- 4.77 3.98 2.91Total cost------ 23.66 20.72 19.51
Vitamins, minerals, and antibiotics.
Labor cost was the only individual item that decreased signifi-cantly as the size of enterprise increased. The cost of labor tendedto decrease at a decreasing rate.
The average net returns per hundredweight of hogs sold in-creased as the size of enterprise increased, Table 6. The averagenet return to management was -$2.12, -$0.30, and $0.35 perhundredweight sold for the small, middle, and large-size producergroups, respectively.
Investment in buildings and equipment (new) per hundred-weight of hogs sold demonstrated a marked decrease as size ofenterprise increased, Table 7. This was as expected because pro-ducers with larger herds could utilize facilities, more efficientlythan producers with smaller herds. Thus, almost the same fixed
10
PRODUCIIG MARKET HOGS 1
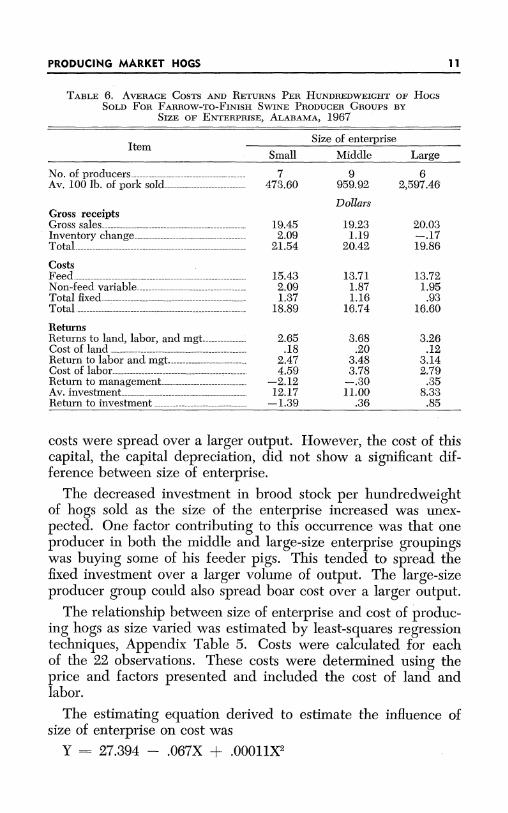
TABLE 6. AVERAGE COSTS AND RETURNS PER HUNDREDWEIGHT OF HOGSSOLD FOR FARROW-TO-FINISH SWINE PRODUCER GROUPS BY
SIZE OF ENTERPRISE, ALABAMA,1967
ItemSize of enterprise
Small Middle Large
N o. of producers------------------------------- 7 9 6Av. 100 lb. of pork sold---------------------------- 473.60 959.92 2,597.46
DollarsGross receiptsGross sales ---------------------------------- 19.45 19.23 20.03
Inventory change---------------------------------- 2.09 1.19 -. 17Total----------------------------------- 21.54 20.42 19.86
CostsFeed ----- --------------- ---------------- 15.43 13.71 13.72Non-feed variable-------------------------------- 2.09 1.87 1.95T otal fixed ----------------------------------- 1.37 1.16 .93T otal ---------------------------------------- 18.89 16.74 16.60
ReturnsReturns to land, labor, and mgt.-------- 2.65 3.68 3.26C ost of land ---------------------------------------- .18 .20 .12Return to labor and mgt. ------------- 2.47 3.48 3.14Cost of labor----------------------------------- 4.59 3.78 2.79Return to management------- -- 2.12 -. 30 .35Av. investm ent------------------------------ 12.17 11.00 8.33Return to investment .-------- - 1.39 .36 .85
costs were spread over a larger output. However, the cost of thiscapital, the capital depreciation, did not show a significant dif-ference between size of enterprise.
The decreased investment in brood stock per hundredweightof hogs sold as the size of the enterprise increased was unex-pected. One factor contributing to this occurrence was that oneproducer in both the middle and large-size enterprise groupingswas buying some of his feeder pigs. This tended to spread thefixed investment over a larger volume of output. The large-sizeproducer group could also spread boar cost over a larger output.
The relationship between size of enterprise and cost of produc-ing hogs as size varied was estimated by least-squares regressiontechniques, Appendix Table 5. Costs were calculated for eachof the 22 observations. These costs were determined using theprice and factors presented and included the cost of land andlabor.
The estimating equation derived to estimate the influence ofsize of enterprise on cost was
Y= 27.394 - .067X + .00011X 2
PRODUCING MARKET HOGS 11

12 ALABAMA AGRICULTURAL EXPERIMENT STATION
TABLE 7. AVERAGE INVESTMENT IN CAPITAL ASSETS (NEW) AND AVERAGELABOR REQUIREMENT PER HUNDREDWEIGHT OF PORK SOLD FOR
FARROW-TO-FINISH SWINE PRODUCER GROUPS BY SIZEOF ENTERPRISE, ALABAMA, 1967
Item Size of enterpriseSmall Middle Large
N o. of producers-------- ------------------- -- 7 9 6Av. 100 lb. of pork sold---------------------------- 473.60 959.92 2,597.46
DollarsBuildings and equipmentF encing ---------------------------------------- 1.05 .81 .42Farrowing houses------_--------------- - 3.22 2.14 1.76
Finishing parlors ------------- ------------------ 2.29 2.03 1.88
Feed storage--------------------------- ----_ 1.81 2.14 1.25E quipm ent----------------------------------------------- 3.13 2.53 1.97M iscellaneous _ -- _----------------------- .17 .10 .35Total----------------------------------- 11.67 9.75 7.63
Brood stockB rood suows ----------- ----------------- ---------- ------ 2.47 2.16 2.00
G ilts--- -- -- --- -- -- -- --- -- -- --- -- -- -- --- -- -- -- .4 6 .2 6 .2 7B oars ---- -- --- -- -- -- --- -- -- --- -- -- -- ----- -- -- .33 .30 .24T otal----------------------------------------- 3.26 2.72 2.51
Total investment (new) --------------------------- 14.93 12.47 10.14
HoursLabor requirementH ired --- ------- --- ---- ----- --- -- -- --- -- --- -- -- .18 .76 1.25Operator----------------------- 2.88 1.76 .61T otal --------------------------------- ------- 3.06 2 .52 1.86
where Y = Total cost per 100 pounds of hogs soldX - Size of enterprise (Pounds of hogs sold in thou-
sands of pounds).The calculated cost curve is shown in Figure 1. This curve
indicates economies of size were present up to 305,000 pounds ofhogs- sold.
The combined costs of feed inputs, non-feed variable inputs,and fixed inputs were also plotted in Figure 1. This curve alsoindicated economies of size were present for these inputs. Thesecosts did not decrease as rapidly as total cost because labor costswere not included.
Labor costs decreased rapidly as the size of enterprise increasedfrom 5,000 to 215,000 pounds of pork sold, Figure 2. This curveindicates that economies of size were present in cost of labor up to305,000 pounds of hogs sold.
The relationships between size of enterprise and the cost ofeach input factor were also estimated, Appendix Table 5. Labor
12

PRODUCING MARKET HOGS 1
Cost per cwt.(Dol.)
27.50
26.5025.5024.5023.50
22.50
21.50 Total cost20.5019.50
18.5017.50 (excluding land and
labor)16.50
15.50
14.50
50 650 1,250 1,850 2450O 3050 3650 4250 4850 54I50
Pounds of hogs sold (cwt.)
FIG. 1. Relationships between the unit costs of producing hogs and size of en-terprise for farrow-to-finish hog enterprises, Alabama, 1967.
Cost per cwt.(Dol.)
6.20
5.80
5.40-
5.00-
4.60-
4.20-
3.80-
3.40-
3 .00 0
2.20-
1.80L
Fit
Labor cost
50 650 X250 1,850 2450 3,050 32650 4250 4,850 5450
Pounds of hogs sold (cwt.)
FIG. 2. Relationship between the unit cost of labor and size of enterprise forfarrow-to-finish hog enterprises, Alabama, 1967.
ra
13PRODUCING MARKET HOGS

was the only input that demonstrated a significant trend whentested separately.
This analysis indicates that the total cost of producing a hun-dred pounds of hogs decreased as the size of the enterprise in-creased from 5,000 to 305,000 pounds. Thus, the producers wereable to utilize input factors more efficiently with larger outputs.
Optimum Size of Enterprise
The optimum size enterprise is found at the output where mar-ginal cost equals marginal return (MC = MR). This level of out-put may or may not be at the minimum point of the average costcurve. Only in the case when selling price and marginal revenueare equal to the minimum average cost would this be the opti-mum size enterprise.4 Assuming that the output where marginalcost equals marginal revenue is equal to or greater than the out-put at the minimum average cost, the optimum size enterprise iseither at the output corresponding to the minimum point of theaverage cost curve or larger. If the point where marginal revenueequals marginal cost is less than the minimum average cost, anoptimum size enterprise cannot be determined for the long run.Losses would occur at all levels of output.
The estimated average cost curve reached a minimum at anoutput of 305,000 pounds of hogs sold annually. Decreasing re-turns to size were indicated with larger outputs. This would in-dicate that the optimum size enterprise would have sales of 305,-000 pounds of hogs annually or greater. Since the marginal costand marginal revenue curves were not derived, it was not possi-ble to determine the exact level of output that would maximizeprofits.
Cost of Production
The 22 operations were divided into three groups according totheir cost of production. These groups consisted of eight pro-ducers in the high-cost group, eight in the middle-cost group, andsix in the low-cost group.
The average total costs of production for the three groups were$24.70, $20.66, and $17.54 per hundredweight sold for the high,middle, and low-cost groups, respectively, Table 8.
SEarl O. Heady, Economics of Agricultural Production and Resources Use,(New York: Prentice Hall, Inc., 1952), p. 329
14 ALABAMA AGRICULTURAL EXPERIMENT STATION

PRODUCING MARKET HOGS 15
TABLE 8. AVERAGE COSTS PER HUNDREDWEIGHT OF HOGS SOLD FOEFARROW-TO-FINISH SWINE PRODUCER GROUPS BY COST
OF PRODUCTION, ALABAMA, 1967
Item Producer groupLow-cost Middle-cost High-cost
N o. of -pro ducers--------------------------------------- 6 8 8Av. 100 lb. of pork sold---------------------------- 1,490.19 1,714.81 609.96
DollarsFeed costsC orn --------- -------------------------------- 7.51 8.14 9.71
Protein supplement--------------2---- - 3.44 4.07 4.38F eed additives1 ---------------------------------------- .20 .86 .45Creep and starter---------------------- - .92 1.28 1.26O th er---- - --- --- -- - -- - ----- - --- -- --- - -- - .05 .02 -. 13T otal ---------------------------------------- 12.12 14.37 15.93
Non-feed variable costsP astu re .--- --- -- --- -- --- --- -- ----- --- --- ----- -- .31 .17 .11Replacem ent stock .------------------------------____ 17 .31 .21Vaccination and veterinary---------------------- .10 .28 .15Trucking expenses------------------------- ----- .18 .19 .13
Electricity--------------------- .10 .17 .20R epairs------------- ------------ - .05 .13 .21
O ther cash expenses .------------------------------- _. .51 .08 .17Interest on oper. cap.-------------------------------- .54 .63 .68T otal ---------------------------------------- 1.96 1.96 1.86
Fixed costsCapital depreciation ------------------ _------------ .38 .57 .90
Interest, taxes, insurance-------------------------- .37 .47 .75T otal------------------------------ - .75 1.04 1.65
Other costsL a n d -- --- -- --- -- --- -- --- --- -- --- -- --- -- --- -- .12 .12 .19Labor----------------------------------- 2.59 3.17 5.07Total--------------------------- -- 2.71 3.29 5.26
Total cost ------------------------- 17.54 20.66 24.70
1Vitamins, minerals, and antibiotics.
The most significant cost reductions among these groups werefeed, labor, and fixed costs, Appendix Table 6. Feed costs weremuch less for the low-cost producer group than for the middle orhigh-cost producer groups. This would indicate that the low-costgroup was obtaining a better feed efficiency, because of less wast-age and higher quality hogs, than were the middle or high-costgroup. The labor cost was also significantly less for the low-costproducer group than for either the middle or high-cost group.Since labor was charged at a constant rate, this lower cost oflabor would indicate that the low-cost producer group obtained abetter labor efficiency.
PRODUCING MARKET HOGS 15

ALABAMA AGRICULTURAL EXPERIMENT STATION
The low-cost producer group had significantly lower fixed costsper hundredweight than did the middle or high-cost producers.The low-cost producers were probably using their buildings andequipment more fully than the other two groups.
Some of the basic differences in these cost reductions are be-cause of economies of size. As indicated previously as the size ofenterprise increased, average total cost of production decreased.The middle and low-cost producer groups were selling a muchlarger volume than the high-cost producer group. However, allof the reductions in costs cannot be attributed to economies ofsize. The increased efficiency demonstrated by the low-cost pro-ducer group was much greater than the efficiency gained throughincreased size of enterprise.
The gross sales per hundredweight of hogs sold for the highand low-cost producer groups were relatively the same, Table 9.The middle-cost producer group did have slightly higher grosssales. There was no apparent reason for this occurrence.
The average return to land, labor, and management was $2.48per hundredweight sold for the high-cost producer group as com-
TABLE 9. AVERAGE COSTS AND RETURNS PER HUNDREDWEIGHT OF HOGSSOLD FOR FARROW-TO-FINISH SWINE PRODUCER GROUPS BY
COST OF PRODUCTION, ALABAMA, 1967
Item Producer groupsLow-cost Middle-cost High-cost
No. of producers 6 8 8Av. 100 lb. of pork sold 1,490.19 1,714.81 609.96
DollarsGross receiptsGross sales 19.34 20.00 19.58Inventory change .37 -. 02 2.34Total 19.71 19.98 21.92
CostsFeed 12.12 14.37 15.93Non-feed variable------------------ 1.96 1.96 1.86Total fixed .75 1.04 1.65Total 14.83 17.37 19.44
ReturnsReturns to land, labor, and mgt.------- 4.88 2.61 2.48Cost of land .12 .12 .19Return to labor and mgt.------------- 4.76 2.49 2.29Cost of labor 2.59 3.17 5.07Return to management-------------- 2.17 -. 68 -2.78Av. investment -7.33 8.88 14.00Return to investment 2.61 -. 15 -1.94
16

pared with $4.88 for the low-cost producer group. This differencewas predominantly a result of the difference in cost of productionsince the gross receipts of the two producer groups were approxi-mately equal.
The difference in the cost of production was increased furtherby the improved labor efficiency of the low-cost producer group.This was reflected in the return to management. The high-costand middle-cost producer groups had average returns to manage-ment of -$2.78 and -$0.68 per hundredweight respectively,while the low-cost producer group had an average return to man-agement of $2.17 per hundredweight of hogs sold.
The low-cost producer group had an average investment inbuildings and equipment (new) of $5.75 per hundredweight ofhogs sold while the middle-cost group averaged $9.81 and thehigh-cost $14.27, Table 10. This was partially a result of econ-omies of size. Part of this increased capital efficiency could havebeen because of better utilization of existing facilities by the man-agers of the operations in the low-cost group.
TABLE 10. AVERAGE INVESTMENT IN CAPITAL ASSETS (NEW) AND AVERAGELABOR REQUIREMENT PER HUNDREDWEIGHT OF PORK SOLD FOR
FARROW-TO-FINISH SWINE PRODUCER GROUPS BY COST OF
PRODUCTION, ALABAMA, 1967
Item Producer groups
Low-cost Middle-cost High-cost
No. of producers 6 8 8Av. 100 lb. of pork sold 1,490.19 1,714.81 609.96
DollarsBuildings and equipmentFencing- ............................38 .63 1.02Farrowing houses 1.18 1.79 4.43Finishing parlors 1.63 2.97 2.62Feed storage .53 2.00 2.43Equipment. 1.88 2.09 3.57Miscellaneous .15 .33 .20Total - 5.75 9.81 14.27
Brood stockBrood sows 1.83 2.02 2.85Gilts .38 .17 .49Boars .27 .23 .84Total 2.48 2.42 3.69
Total investment 8.23 12.23 17.96
HoursLabor requirementHired --. 89 1.05 .87Operator -. 83 1.06 2.51Total -1.72 2.11 3.38
PRODUCING MARKET HOGS 17

The returns on the average investment varied drastically amongthe three groups. The high, middle, and low-cost producer groupsearned -13.86, -1.70, and 35.61 per cent return on the averageinvestment, respectively.
System of Finishing
All producers contacted in this study were finishing hogs inconfinement. However, two different systems of finishing hogswere used.
Fifteen producers were finishing hogs on concrete floors. Mostof these facilities were of pole-type construction with open sidesfor ventilation. The majority of these houses were equipped withfeed delivery systems that filled feeders automatically. The otherproducers utilized hand labor to fill feeders. All operations wereequipped with some type of self feeders and automatic waterers.
Seven producers were finishing hogs in drylot feedlots. Thesewere fenced lots with various amounts of protective facilities pro-vided. All were equipped with some type of self feeders and wa-terers. Hand labor was generally utilized to fill feeders.
It was assumed that the concrete finishing floors would be moreefficient than the drylot feedlots. The use of concrete floors couldreduce feed waste significantly more than drylot. Hogs on a con-crete feeding floor can be kept under more sanitary conditionsthan in a drylot. Generally, increased sanitation should hold dis-ease and parasite problems to a minimum. Thus, hogs shouldgain more efficiently under these conditions and have an increasedfeed efficiency. By using concrete finishing floors a greater con-centration of hogs can be fed on a given area. This allows for theuse of feed delivery systems to be used in conjunction with theconcrete feeding floors. By the use of this and other labor savingequipment applicable to concrete floors, labor efficiency shouldbe improved.
Producers utilizing the concrete feeding floors had an averagecost per hundredweight of hogs sold of $19.89, Table 11. Pro-ducers finishing hogs on drylot had an average cost of $22.22 perhundredweight.
The principal difference in cost of production for the systemswas feed cost. As expected, operators using concrete feeding floorshad significantly lower feed cost per hundredweight than pro-ducers with drylot systems, Appendix Table 7. Producers withconcrete feeding floors also had lower nonfeed variable expenses
18 ALABAMA AGRICULTURAL EXPERIMENT STATION

PRODUCING ARKET HOGS 1
TABLE 11. AVERAGE COSTS PER HUNDREDWEIGHT OF HOGS SOLD FORFARROW-TO-FINISH SWINE PRODUCER GROUPS BY TYPE
OF FEEDLOT, ALABAMA, 1967
ItemType of feedlotConcrete Drylot
N o. of producers------------------------- - 15 7Av. 100 lb. of pork sold-------------------- 1,453.86 818.76
DollarsFeed costsC orn ------------------------------- 7.92 9.34Protein supplement-------------------- 3.81 4.35Feed additives'---------------------- .65 .31Creep and starter----------------------- 1.06 1.51O th er-- ---- -- -- - -- -- -- -- - -- -- -- - -- -- -- -- - -- - .0 5 .0 3T otal----------------------------- 13.49 15.54
Non-feed variable costsPasture------------------------- .23 .11Replacem ent stock------------------------- - .13 .71Vaccination and veterinary-.19 .24---------Trucking expenses----------------------- - .19 .13Electricity--------------------- .15 .19R epairs-------------------------------- - .13 .07O ther cash expenses--------------------------_-- - - .25 .15
Interest on oper. cap.--------------------------- - .59 .69T otal ---- -------------------------- 1.86 2.29
Fixed costsCapital depreciation 8-----------------Interest, taxes, insurance---------------------- - .50 .46T o tal--- - -- - -- - -- - -- - -- - -- - -- - -- - -- -- 1.11 .84
Other costsL an d ------------------------ ---- .14 .12Labor ------------------------ 3.29 3.43T otal ------------------------------- 3.43 3.55
Total cost------------------------------ 19.89 22.22
1Vitamins, minerals, and antibiotics.
and labor costs. However, neither was significantly lower for theconcrete finishing system.
The cost of buildings and equipment per hundredweight wasgreater for the concrete finishing system than for the drylot sys-tem. This was because of the increased investment in specializedbuildings and equipment necessary for the concrete feeding floor.The increased cost of this capital, the capital depreciation, wassignificantly greater for the concrete feedlot system.
Even though gross receipts were relatively the same for the twosystems, net returns did vary significantly. Net returns to land,labor, and management varied from $0.79 per hundredweight forthe drylot system to $3.98 per hundredweight for the concrete
PRODUCING MARKET HOGS 19

20 ALBAMA AGRICU~LTURLEPIMN STIO
TABLE 12. AVERAGE COSTS AND RETURNS PER HUNDREDWEIGHT OF HOGSSOLD FOR FARROW-TO-FINISH SWINE PRODUCER GROUPS BY
TYPE OF FEEDLOT, ALABAMA, 1967
Item Type of feedlotConcrete Drylot
No. of producers------------------------ -- 15 7Av. 100 lb. of hogs sold ----------------------------------- 1,453.86 818.76
DollarsGross receiptsG ross sales----------------------------- 19.89 19.04Inventory change------------------------- - .55 .42T otal----------------------------- 20.44 19.46
CostsFeed ------------------------ 13.49 15.54Non-feed variable------------------------------ - 1.86 2.29T otal fixed-------------------------- 1.11 .84T o ta l ------------------------------------------------------- - 1 6 .4 6 1 8 .6 7
ReturnsReturns to land, labor, and mgt.------------ - 3.98 .79C ost of land -------------------------------- - .14 .12Return to labor and rgt.------------------------- - 3.84 .67Cost of labor------------------------------ - 3.29 3.43Return to management------------------- - .55 -2.76Av. investment-------------------- 9.50 8.67Return to investm ent------------------ - 1.12 -2.24
system, Table 12. The net return to management for the two sys-tems varied from -$2.76 per hundredweight for drylot to $0.55per hundredweight for concrete.
Capital investments were significantly different for the twosystems. The initial investment in buildings and equipment was$9.38 per hundredweight for the operators using the concretefloors as compared to $6.41 per hundredweight for those operatorsusing drylot feeding, Table 13. However, the drylot system op-erator had $3.48 per hundredweight invested in brood stock whilethe concrete system operator invested $2.45 per hundredweight.
The smaller investment in brood stock per hundredweight wasnot because of a smaller investment in sows, gilts, and boars. Theoperators with concrete feedlots were marketing more hogs andmore pounds of pork per sow than were drylot operators. Thus,the investment was spread over a larger volume.
Even though the drylot operations required a smaller invest-ment, the per cent earned on that investment was a -25.84 percent. This negative return to investment can be explained be-cause of the increased feed and labor cost of the drylot operations.
The concrete feedlots required a substantially greater initialinvestment than the drylot operations. However, the per cent
20 ALABAMA AGRICULTURAL EXPERIMENT STATION

PRODUCING MARKET HOGS 2
TABLE 13. AVERAGE INVESTMENT IN CAPITAL ASSETS (NEW) AND AVERAGELABOR REQUIREMENT PER HUNDREDWEIGHT OF PORK SOLD FOR
FARROW-TO-FINISH SWINE PRODUCER GROUPS BY TYPEOF FEEDLOT, ALABAMA, 1967.
Item
No. of producersAv. 100 lb. of pork sold
Buildings and equipmentFencing--- -- - - -- - -- - -FarroWing housesFinishing parlors-----------Feed storage---------------Equipm ent .---------------M iscellaneous--------------T o ta l . - - - - - - - - - - - - - - - - - - - -Brood stockBrood sows------------ ----
G ilts -- - - - - - - - - - - - - - - - - - - - -B o a rs -- - - - - - - - - - - - - - - - - - - -T o ta l ---------------------Total investment -----------
Type of feedlotConcrete Drylot
-- - - - -- - - - -- - - -1 5 7----------------- 1,453.86 818.76
Dollars
.531.88
1.582.59
.319.38
1.89.31.25
2.4511.83
HoursLabor requirementHired-- - - -Operator---------T otal ------------
return was 11.8Crete feedlot.
1.001.192.19
.862.75
1.671.11.02
6.41
2.92.20.36
3.489.89
.841.452.29
per cent for the average investment in the con-
Market Hog Budgets
Enterprise budgets were developed using the cost and invest-ment data developed in the analysis of economies of size. Thesebudgets indicated the costs and returns that could be expectedfrom- three different size enterprises. These three sizes of enter-prises were budgeted because they conform closely to the averagesize of operations analyzed for economies of size.
It was assumed that 16 pigs could be raised to a market weightof 220 pounds each per sow for all three sizes of enterprises. Sowswould be replaced every two years. This means that an averageof 15.5 hogs weighing 200 pounds each could be sold each year.Also, one-half of the sow herd will be sold each year at an aver-age weight of 325 pounds per sow with an average annual deathloss of 2 per cent subtracted from this. In order to prevent thecomplications that can arise from inbreeding, boars were assumedto be replaced annually. By using these assumptions it was pos-
PRODUCING MARKET HOGS 21

22 ALABAMA AGRICULTURAL EXPERIMENT STATION
TABLE 14. ESTIMATED COSTS, AND RETURNS, FOR A 14-SowFARROW-To-FINISH HOc ENTERPRISE, ALABAMA, 1967
Item Description Unit Quantity Rate Amount Per sow
Doi. Doll. Dol.ReceiptsH ogs------- -Sow s --------B oar-------- -Total receipts-
217 @ 220 lb. ea7 @ 325 lb. ea1 @4001b.
Variable expensesPastu re -- - -- - - - - - -- - - - - - -C o rn - - - - - - - - - - - - - - - - - - - - - - -Protein supplementCreep and starterfeed-Other feeds-- -- --- - - - --Vaccination and veterinaryElectricity-- -- - -- - -- - -- -Trucking .-- -- -- -- - - -B o a r - - - - - - - - - - - - - - - - - - - - - - -R ep airs--- - --- - - - - -- - - - -- - - -Other cash expenses-----------Jut, on oper. cap.
(8,487.04 for 6 mo. @ 8%1) ---Total variable expenses--------Fixed expenses (from Table 15)--Total expenses---------- -----.ReturnsReturms to land, labor, and mgt._Charge for land---------------Return to labor and mgt.-------Charge for labor--_----------.Return to management _-------
.cwt.. cwt.
cwt.
acrebu.cwt.cwt.
headmo.head
477.422.3
4.0503.7
5.253,397
384100
22412
217
201612
22.061.415.395.75
.527.55
.42
9,548.00356.80,48.00'
9,952.80
115.854,789.772,069.76
575.00337.48116.4890.6089.88
176.3060.4465.48
339.488,826.52
702.87
682.0025.483.43
710.91
8.28342.13147.8441.0724.11
8.326.476.42
12.594.324.68
24.25630.48
50.21
9,528.39 680.52
acre 7.5
hour 1,541
423.41 30.2411.88 89.10 6.36
334.31 23.881.50 2,311.50 165.11
-1,977.19 -141.23
TABLE 15. ESTIMATED INVESTMENT AND ANNUAL FIXED COSTS FOR A 14-Sow FARROW-TO-FINISH HOG ENTERPRISE, ALABAMA, 1967
Value Annual fixed costs
Item Interest, ercNew Average taxes, and Dpi- Total
insurance ation
Brood sows ------------C ilts -- - - - - - - - - - - - - - - -B oar- - - -- - - - - - -Farrowing-nursery parlorFinishing parlorFeed storage-Miscellaneous----------E quipment------------Fencing------------ ---
T o tal -- - - - - - - - - - - - - - --
Dal.1,244.14
231.70166.22
1,621.911,153.47
911.7085.63
1,576.58528.88
Dol.1,244.14
231.70166.22810.96576.74455.85
42.82788.29264.44
Dal.79.3114.7710.5960.8243.2535.992.60
53.2115.86
Dol. Dol._____ 79.31_____ 14.77
10.5977.04 137.8654.79 98.0457.74 93.73
8.56 11.16157.66 210.8725.12 46.54
7,520.23 4,581.16 316.40 380.91 702.87'---------------
22
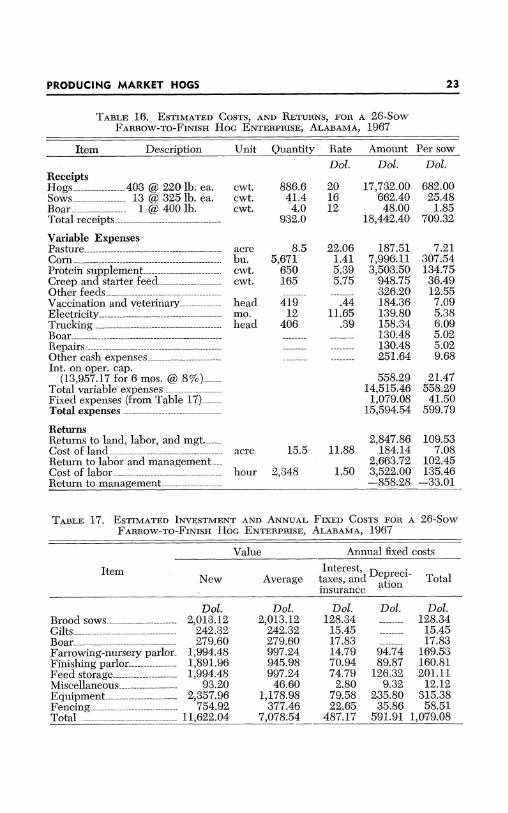
TABLE 16. ESTIMATED COSTS, AND RETURNS, FOR A 26-SowFARROW-TO-FINISH HOc ENTERPRISE, ALABAMA, 1967
Item Description Unit Quantity Rate Amount Per sow
Dot. Dot. Dot.
403 @ 220 lb. ea.13 @ 325 lb. ea.1 @ 400 lb.
Variable ExpensesPasture --C o rn -- - - - - - - - - - - - - - - - - - - - - - -Protein supplementCreep and starter feedO ther feeds-- - - - - - - - - - - -Vaccination and veterinaryElectricity-- -- - - - -- - - - -- -Trucking--------
R ep airs -- - - - - - -- - - - - - - - - - - - - -Other cash expenses------------Int. on oper. cap.
(13,957.17 for 6 mos. @ 8%)--Total variable expenses ---------Fixed expenses (from Table 17)---Total expenses.---------- -----.
ReturnsReturns to land, labor, and mgt.-.C ost of land-------------------Return to labor and management-C ost of labor------------------Return to management----------
cwt. 886.6cwt. 41.4cwt. 4.0
932.0
acrebu.cwt.cwt.
headmo.head
8.55,671
650165
41912
406
acre 15.5
hour 2,348
201612
22.061.415.395.75
.4411.65
.39
17,732.00662.4048.00
18,442.40
187.517,996.113,503.50
948.75326.20184.36139.80158.34130.48130.48251.64
558.2914,515.461,079.08
15,594.54
2, 847.8611.88 184.14
2,663.721.50 3,522.00
-858.28
682.0025.48
1.85709.32
7.21307.54134.7536.4912.557.095.386.095.025.029.68
21.47558.2941.50
599.79
109.537.08
102.45135.46
-33.01
TABLE 17. ESTIMATED INVESTMENT AND ANNUAL FIXED COSTS FOR A 26-SowFARROW-TO-FINISH HOc ENTERPRISE, ALABAMA, 1967
Value Annual fixed costs
New Average Interest, DeNwil Average taxes, and prci-Total
insurance
Brood sows ------------G ilts -- ----------- ---- -B oar -- - - - - -- - -- -- - - -Farrowing-nursery parlorFinishing parlor--------.Feed storageMiscellaneous----------E quipment------------Fencing----------T o ta l -- - - - - - - - - - - - - - --
Dot.2,013.12
242.32279.60
1,994.481,891.961,994.48
93.202,357.96
754.9211,622.04
Dot.2,013.12
242.32279.60997.24945.98997.2446.60
1,178.98377.46
7,078.54
Dot. Dot. Dot.128.34 _____ 128.34
15.45 15.4517.83 _____ 17.8314.79 94.74 169.5370.94 89.87 160.8174.79 126.32 201.11
2.80 9.32 12.1279.58 235.80 315.3822.65 35.86 58.51
487.17 591.91 1,079.08
ReceiptsH ogs --------Sow s --------B oar --------Total receipts-
K ~1~Cn r~ IY CIII~~TL~~T~OTIT
PRODUCING MARKET HOGS 23

sible, for practical purposes, to determine the number of sowsnecessary to attain a level of output equivalent to the averagesize of operations encountered in the analysis of economies of size.
The costs, returns, and investments were derived by multiply-ing the total number of hundredweights of hogs sold by the costper hundredweight determined in the analysis of size of enter-prise. Minor corrections were necessary because of rounding fig-ures.
These budgets indicate the total costs and returns that mightbe expected from these three size hog units. The costs and returnsper sow indicate the variation in cost at different levels of output.
There are several factors affecting the costs of producing hogsthat can be seen by comparing these budgets. One of the mostobvious variations was the cost of corn for the three enterprises.As the number of sows increased, the cost of corn per sow unitdecreased. The producers with larger operations obtained betterfeed efficiency than smaller producers. This was partly a resultof fewer producers with large enterprises having drylot feedlots.Feed efficiency is better on concrete feeding floors. Fixed ex-penses per pound of pork also decreased with the increased sizeof enterprise, because producers with large herds utilized theirfacilities more fully than producers with smaller herds. Com-parisons of the budget indicated that labor costs per sow unit de-creased greatly as the number of sows increased. Labor was usedmuch more efficiently with the larger enterprise.
These budgets were developed based on the average costs ofall 22 producers in the study. Thus, some of the producers hadhigher costs than those listed while others had lower costs. In theanalysis of producer groups based on cost of production it waspointed out that the low-cost group had significantly lower feed,labor, and fixed costs. Thus by improving the feed and labor ef-ficiency and more fully utilizing production facilities, the cost ofproduction can be reduced substantially.
Another important point is that these budgets indicate the aver-age costs of production in both drylot and concrete feedlots. Thecost of feed is significantly lower for enterprises with concretefeedlots than for operations with drylot feedlots because of betterfeed efficiency that can be attained on concrete feeding floors.This increased feed efficiency could decrease feed costs and thustotal costs below that indicated in these budgets for producerswith concrete feeding parlors.
24 ALABAMA AGRICULTURAL EXPERIMENT STATION

PRODUCING MARKET HOGS 2
TABLE 18. ESTIMATED COSTS, AND RETURNS, FOR AN 80-SowFARROW-TO-FINISH HOG ENTERPRISE, ALABAMA, 1967
Item Description Unit Quantity Rate Amount Per sow
Dotl. Dot. Dot.ReceiptsH ogs--------Sow s --------B oar --------Total receipts-
1,240 @ 220 lb. ea.40 @3251b. ea.4 @4001b.ea.
Variable expensesPasture -- - - - - - - - - - --C o rn -- - - - - - - - - - - - - - - - - - - - -Protein supplementCreep and starter feedO ther feeds-- -- - - - - - - - -Vaccination and veterinaryElectricity------ - -- ---Trucking -- - - -- -- - --B o a r .- ----------------------R ep airs -- - - - - - - - - - - - - - - - - - - -Other cash expenses-----------Iut, on oper. cap.
(21,635.87 for 6 mo. @ 8%)-.Total variable expenses ------Fixed expenses (from Table 19)--
Total expenses ---------------
ReturnsReturns to land, labor, and mgt.-C ost of land ------------ ---- -Return to labor and mgt.------.Cost of labor---- ------ ------Return to management--------
cwt.cwt.cwt.
acrebu.cwt.cwt.
headmo.headhead
2,728.0127.4
16.02,871.4
2615,7622,115
619
1,28012
1,2844
201612
22.061.415.395.75
.4335.89
.40208.18
54,560.002,038.40
192.0056,790.40
573.5622,224.4211,399.853,559.252,210.98
550.40430.68513.60832.7228i7.14689.14
682.0025.48
2.40709.88
7.17277.80142.5044.4927.64
6.885.386.42
10.413.598.61
1,730.87 21.6445,002.61 562.532,690.48 33.63
47,693.09 596.16
acre 29
hour 5,340
11.88
1.50
9,097.31344.52
8,752.798,010.00
742.79
113.724.31
109.41100.13
9.28
TABLE 19. ESTIMATED INVESTMENT AND ANNUAL FIXED COSTS FOR A 80-SowFARROW-TO-FINISH HOc ENTERPRISE, ALABAMA, 1967
Value Annual fixed costs
Item Interest, DpeiNew Average taxes, and Deri- Total
insuranceato
Brood sows------G ilts -- - - --- -----------B o ar - - - - - - - - -- - - - - - - -Farrowing-nursery parlorFinishing parlorFeed storageMiscellaneous----------Equipment------------Fencing ---------------T o tal - - - - - - - - - - - - - - - -
Dot.5,742.80
775.28689.14
5,053.665,398.253,589.251,005.005,656.661,206.00
29,116.04
Dot.5,742.80
775.28689.14
2,526.832,699.121,794.62
502.502,828.33
603.0018,161.62
Dot.366.1049.4343.93
189.51202.43134.6030.15
190.9136.18
1,243.24
Dot. Dot.----- 366.10----- 49.43-_-- 43.93
240.05 429.56256.42 458.85227.32 361.92100.50 130.65565.67 756.58
57.28 93.461,447.24 2,690.48-----~--- -v~--c.llch"" III
PRODUCING MARKET HOGS 25

ALABAMA AGRICULTURAL EXPERIMENT STATION
SUMMARY
The average total cost per hundredweight of hogs sold was$20.37. Feed made up 68.3 per cent of this cost and labor com-prised 16.3 per cent.
The average gross return per hundredweight of hogs sold was$20.24 with an average net return to land, labor, and managementof $3.33. The average return to management was minus $0.13 perhundredweight.
The average initial investment in capital assets was $11.41 perhundredweight sold with an average return on investment of 4.61per cent.
Economies of size were present in the farrow-to-finish enter-prises because the total costs per hundredweight decreased as thesize of enterprise increased. Labor costs decreased significantlyas the size of enterprise increased. The combined cost of feed,non-feed, and fixed inputs also had significant reduction in costs.
The relationship between size of enterprise and cost of produc-ing hogs was estimated. Cost per pound decreased as the size ofenterprise increased from 8,000 to 317,000 pounds of hogs sold.Diseconomies of size (cost per pound would increase as size in-creased) were indicated beyond this output.
The data were divided into three producer groups based oncost per hundredweight of pork to determine why some producerswere more efficient in producing hogs than others. The averagetotal costs for the high, middle, and low-cost producer groupswere $24.70, $20.66, and $17.54 per hundredweight sold, respec-tively.
Feed and labor costs made up nearly 85 per cent of the totalcosts and increased efficiency of these productive factors reducedcosts significantly.
The producers feeding hogs on concrete floors had an averagecost of $19.89 per hundredweight of hogs sold compared to$22.22 for producers feeding hogs in drylot. Feed cost was theonly significant difference in the cost of productive factors; it waslower on concrete floors.
Enterprise budgets were developed for 14, 26, and 80 sow far-row-to-finish hog enterprises. These budgets were based on thecosts, investments, and labor requirements determined for theanalysis of economies of size.
Factors affecting the costs of producing hogs can be seen bycomparing these budgets in the large enterprises. The large en-
26

PRODUCING MARKET HOGS 2
terprise had higher feed efficiency, thus lower fixed costs per sowunit and increased labor efficiency. Thus, lower corn cost persow unit resulted in better utilization of facilities. The costs offeed, fixed, and labor inputs can be reduced significantly belowthose indicated in the budgets through improved management.
CONCLUSIONSEconomies of size were indicated for the farrow-to-finish hog
enterprises. The average total cost decreased at a decreasing rateas the size of enterprise increased. This decreased cost of produc-tion results primarily from increased feed and labor efficiencyobtained with larger herds.
It was not possible to determine the optimum level of outputbecause the marginal cost and marginal revenue curves could notbe derived. However, the data indicated that the minimum sizewould be 317,000 pounds of hogs marketed annually. Disecon-omies of size were indicated beyond this level of output. Becauseof the insufficient number of observations at high levels of output,additional research is needed to determine the extent of thesediseconomies. This research would lend greater accuracy in esti-mating the optimum size of enterprise.
A sound management program concentrating on improvingfeed and labor efficiency is the best answer to increased profits inhog production.
PRODUCING MARKET HOGS27

28 ALABAMA AGRICULTURAL EXPERIMENT STATION
APPENDIX
APPENDIX TABLE 1. VARIABLE EXPENSES PER ACRE FOR TEMPORARYWINTER PASTURE FOR TEN HOG ENTERPRISES, ALABAMA, 1967
Item Variable expensesper acre
DollarsSe e d - - - - - - - - - - - - - - - - - - - - - - - - - - - - - - -- 4 .3 3L im e-- - -- - -- - -- - -- - - - - -- - -- - -- - --- 2 .32Fertilizer- - - - - - - - - - - - - - - - - - - - - - - -- 10.02Am m onium nitrate--- --- --- --- --- --- --- --- --- - - 2.25Tractor and equipment oper. expenses----------------- - --- 6.59T o ta l -- - - - - - - - - -- - - - - - - - - - - - - - - - - - - - - - -- 2 5 .5 1
APPENDIX TABLE 2. VARIABLE EXPENSES PER ACRE FOR TEMPORARYSUMMER PASTURE FOR SEVEN HOG ENTERPRISES, ALABAMA, 1967
Item Variable expensesper acre
N um ber of producers---- --- ---- --- ---- --- --- - --- - -7Dollars
Seed------------------------------------------------------- 3.23
L im e -- - - - - - - - - - - - - - - - - - - - - - - - - - - - - - - - - - - -. 8 6Fertilizer- - - - - - - - - - - - - - - - - - - - - - - - -- 8.64A m m onium nitrate--------------------------------------- 3.82Tractor and equipment oper. expenses---------------------- 5.86T o ta l - - - - - - - - - - - - - - - - - - - - - - - - -- - - - - - - - - - - - - - - - - - - - - - - - - 2 2 .4 1
APPENDIX TABLE 3. VARIABLE EXPENSES PER ACRE FOR IMPROVEDPERMANENT PASTURE FOR 17 HOc ENTERPRISES, ALABAMA, 1967
Itemi Variable expensesper acre
DollarsL im e . - - - - - - - - - - - - - - - - - - - - - - - - - - - - - - - - - - - - - - - - - - - - - - - - -2 .0 0Fertilizer(a) M ixed---------------- ---- 8.49
(b) Am m onium nitrate-------------------------------- 5.09Tractor and equipment oper. expenses---------------------- 2.69T o ta l - - - - - - - - - - - - - - - - - - - - - - - - - - - - - - - - - - - - - - - - - - - - - - - - - 1 8 .2 7
28

PRODUCING MARKET HOGS 2
APPENDIX TABLE 4. ANALYSIS OF VARIANCE AMONG FARROW-TO-FINISH
SWINE PRODUCER GROUPS BY SIZE OF ENTERPRISE, ALABAMA, 1967
Source of D.F.EFType of costs variation . variance
Feed ---------------------- Treatment 2 8.44Error 19 3.85
Non-feed variable------------------ Treatment 2 .111Error 19 .488
Capital depreciation--------------- Treatment 2 .092Error 19 .116
Fixed--------------------------------------- Treatm ent 2.3 5 1.18 N .S.Error 19 .291
Labor -------------------------------- _ Treatm ent 2 7.58Error 19 1.35
Total (excluding land Treatment 2 22.18and labor)--------------------------- Error 19 7.63
Total----------------------------------- Treatm ent 2 51.89Error 19 11.15
APPENDIX TABLE 5. RELATIONSHIPS BETWEEN THE UNIT COSTS OF FEED; NON-FEED VARIABLE INPUTS; CAPITAL DEPRECIATION; INTEREST, INSURANCE, AND
TAXES; LABOR; TOTAL EXPENSES EXCLUDING LABOR AND LAND; TOTALCOST WITH SIZE OF ENTERPRISE FOR FARROW-TO-FINISH
HOG ENTERPRISES, ALABAMA, 1967
Relationships between variables Correlation CommentscoefficientsA. Unit cost of feed and size of enterprise
Y = 16.33 - .024X + .00004X2S.E.1= ± $1.70 .263 Not sig. at .05 level
B. Unit cost of non-feed variables expensesand size of enterpriseY = 1.44 + .0062X - .000012X2
S.E. - ± $0.76 _---------------------- .347 Not sig. at .05 levelC. Unit cost of fixed inputs and size
of enterpriseY = 1.25 + .000541X - .00000452X2S.E. _ ± $0.52------------------------ .234 Not sig. at .05 level
D. Unit cost of labor and size of enterpriseY= 5.84 - .0246X + .000039X2
S.E._ ± $1.10 ------------ ---------- .595 Sig. at the .025 levelE. Total cost (excluding labor and land)
and size of enterpriseY= 21.25 - .042X + .000067X2S.E.= ± $2.49-------- - ------------ .534 Sig. at the .05 level
F. Total cost and size of enterpriseY = 27.39 - .067X + .00011X 2
S.E. = ± $2.37 ----------- .779 Sig. at the .001 level
1 Standard error of estimate.
PRODUCING MARKET HOGS 29

30 ALABAMA AGRICU~LTURLEPIMN STIO
APPENDIX TABLE 6. ANALYSIS OF VARIANCE BETWEEN FARROW-TO-FINISHSWINE PRODUCER GROUPS BY COST OF PRODUCTION, ALABAMA, 1967
Source of D EstimatedType of costs variation variance
Feed------------------------ Treatment 2 22.59Error 19 2.36
Non-feed variable------------------ Treatment 2 .46 1.02 N.S.Error 19 .45
Capital depreciation-------------- Treatment 2 .495Error 19 .074
Fixed----------------------- Treatment 2 1.58Error 19 .16
Labor----- -- ----------------------- Treatment 2 10.03 12.86 .001Error 19 .78
Total (excluding land Treatment 2 47.90 9.4 .01and labor) -------------------------- Error 19 4.92
Total----------------------------- Treatment 2 107.40 20.26 .001Error 19 5.30
APPENDIX TABLE 7. ANALYSIS OF VARIANCE BETWEEN FARROW-TO-FINISHSWINE PRODUCER GROUPS BY TYPE OF FEEDLOT, ALABAMA, 1967
Source of Estimated F PType of costs variation D.F. variance F P
Feed-------------------- Treatment 1 21.34 6.22 .025Error 20 3.43
Non-feed variable--------- Treatment 1 .024 .05 N.S.Error 20 .473 .
Capital depreciation------- Treatment 1 .376 3.74 .10Error 20 .101
Fixed-------------------- Treatment 1 .64 2.28 N.S.Error 20 .28
Labor------------------- Treatment 1 .27782 .137 N.S.Error 20 2.0295
Total-------------------- Treatment 1 40.4 29 1
Error 20 13.5 29 1
30 ALABAMA AGRICULTURAL EXPERIMENT STATION

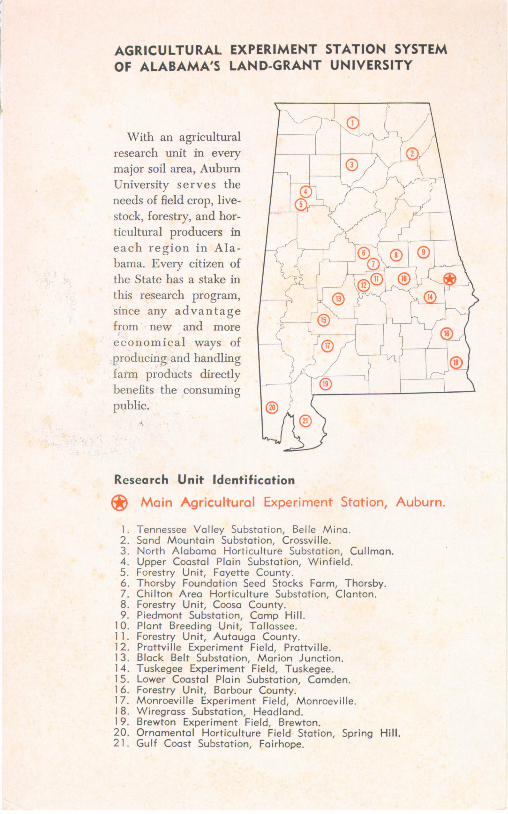
AGRICULTURAL EXPERIMENT STATION SYSTEMOF ALABAMA'S LAND-GRANT UNIVERSITY
With an agricultural
research unit in every
major soil area, Auburn
University serves the
needs of field crop, live-
stock, forestry, and hor- 1
ticultural producers in
each region in Ala- ® ®l~arna. Eveiy citizen of0the State has a stake in ( J isthis research program, 1 Qsince any advantage 3
from new and morecwaiyomical way f
prodlcing and handling
farm pr oducts directly
benlefits the consuming
public.
Research Unit Identification
1. Tennessee Valley Substation, Belie Mina.2. Sand Mountain Substation, Crossville.3. North Alabama Horticulture Substation, Cuilman.4. Upper Coastal Plain Substation, Winfield.5. Forestry Unit, Fayette County.6. Thorsby Foundation Seed Stocks Farm, Thorsby.7. Chilton Area Horticulture Substation, Clanton.8. Forestry Unit, Coosa County.9. Piedmont Substation, Camp Hill.
10. Plant Breeding Unit, Tallassee.11. Forestry Unit, Autauga County.12. Prattville Experiment Field, Prattville.13. Black Belt Substation, Marion Junction.14. Tuskegee Experiment Field, Tuskegee.15. Lower Coastal Plain Substation, Camden.16. Forestry Unit, Borbour County.17. Monroeville Experiment Field, Monroeville.18. Wiregrass Substation, Headland.19. Brewton Experiment Field, Brewton.20. Ornamental Horticulture Field Station, Spring Hill.21. Gulf Coast Substation, Fairhape.


