HAL Id: hal-01395184 https://hal.archives-ouvertes.fr/hal-01395184 Submitted on 10 Nov 2016 HAL is a multi-disciplinary open access archive for the deposit and dissemination of sci- entific research documents, whether they are pub- lished or not. The documents may come from teaching and research institutions in France or abroad, or from public or private research centers. L’archive ouverte pluridisciplinaire HAL, est destinée au dépôt et à la diffusion de documents scientifiques de niveau recherche, publiés ou non, émanant des établissements d’enseignement et de recherche français ou étrangers, des laboratoires publics ou privés. COSWEET TM: A New Process to Reach Very High COS Specification on Natural Gas Treatment Combined with Selective H 2 S Removal Julia Magné-Drisch, Jérémy Gazarian, Jérrémy Gonnard, Jean-Marc Schweitzer, David Chiche, Géraldine Laborie, Gauthier Perdu To cite this version: Julia Magné-Drisch, Jérémy Gazarian, Jérrémy Gonnard, Jean-Marc Schweitzer, David Chiche, et al.. COSWEET TM: A New Process to Reach Very High COS Specification on Natural Gas Treatment Combined with Selective H 2 S Removal. Oil & Gas Science and Technology - Revue d’IFP Energies nouvelles, Institut Français du Pétrole, 2016, 71 (3), 10.2516/ogst/2015038. hal-01395184
Transcript
HAL Id: hal-01395184https://hal.archives-ouvertes.fr/hal-01395184
Submitted on 10 Nov 2016
HAL is a multi-disciplinary open accessarchive for the deposit and dissemination of sci-entific research documents, whether they are pub-lished or not. The documents may come fromteaching and research institutions in France orabroad, or from public or private research centers.
L’archive ouverte pluridisciplinaire HAL, estdestinée au dépôt et à la diffusion de documentsscientifiques de niveau recherche, publiés ou non,émanant des établissements d’enseignement et derecherche français ou étrangers, des laboratoirespublics ou privés.
COSWEET TM : A New Process to Reach Very HighCOS Specification on Natural Gas Treatment Combined
with Selective H 2 S RemovalJulia Magné-Drisch, Jérémy Gazarian, Jérrémy Gonnard, Jean-Marc
Schweitzer, David Chiche, Géraldine Laborie, Gauthier Perdu
To cite this version:Julia Magné-Drisch, Jérémy Gazarian, Jérrémy Gonnard, Jean-Marc Schweitzer, David Chiche, et al..COSWEET TM : A New Process to Reach Very High COS Specification on Natural Gas TreatmentCombined with Selective H 2 S Removal. Oil & Gas Science and Technology - Revue d’IFP Energiesnouvelles, Institut Français du Pétrole, 2016, 71 (3), �10.2516/ogst/2015038�. �hal-01395184�
D o s s i e rMethodology for Process Development at IFP Energies nouvelles
Méthodologies pour le développement de procédés à IFP Energies nouvelles
COSWEETTM: A New Process to Reach Very High COS
Specification on Natural Gas Treatment Combined
with Selective H2S Removal
Julia Magné-Drisch1*, Jérémy Gazarian
1, Sébastien Gonnard
1, Jean-Marc Schweitzer
1,
David Chiche1, Géraldine Laborie
2and Gauthier Perdu
2
1 IFP Energies nouvelles, Rond-point de l’Échangeur de Solaize, BP 3, 69360 Solaize - France2 Prosernat, Tour Franklin, 100/101 Terrasse Boieldieu, 92042 Paris La Défense - France
Abstract — COSWEETTM, developed for the treatment of COS containing natural gases, is based on acombination of deacidification with any alkanolamine solution and COS hydrolysis on a metal oxidebased catalyst. Nearly complete COS conversion is reached, even at a relatively low operatingtemperature. Coupled with a classical sweetening unit, in which an adapted alkanolamine solvent isused in order to optimise the removal of H2S, CO2, as well as the H2S/CO2 selectivity, the highcatalyst activity and the original integration of the scheme secure the COS removal at minimumextra cost. Benefits on capital and operating expenditures of the plant result both from the reductionof the absorption column and solvent flow rate and from the quality of the acid gas which haspositive consequences on the design of the sulfur recovery facilities units, including Claus unit.This paper presents the complete development process approach and the results obtained on COSconversion, the model and simulation tool as well as a case study showing the advantages ofcoupling COSWEETTM to amine based solvent.
Résumé — COSWEETTM : procédé innovant de traitement du gaz naturel combinant uneélimination sélective de l’H2S et une spécification poussée sur le COS — COSWEETTM, procédédéveloppé pour le traitement du gaz naturel comportant du COS, est une intégration entre un procédéde désacidification à base d’une solution d’alcanolamine et une section catalytique assurant l’hydrolysedu COS à l’aide d’un catalyseur à base d’oxyde métallique. Ce procédé permet d’atteindre desconversions du COS proches de 100 % à basses températures. Lorsque la section catalytique estcouplée à une section de désacidification mettant en œuvre un solvant à base d’une alcanolamineadaptée de telle manière à optimiser l’élimination de l’H2S et du CO2 et également la sélectivitéH2S/CO2, la forte activité du catalyseur et l’intégration originale des deux sections permettent degarantir une spécification sur le COS tout en minimisant les coûts de traitement. Les gains sur les coûtsd’investissements et opératoires sont dus non seulement à la réduction de la taille de l’absorbeur et dudébit de solvant mais également à la qualité du gaz acide, qui impacte la chaîne soufre en aval,comprenant l’unité Claus.
Oil & Gas Science and Technology – Rev. IFP Energies nouvelles (2016) 71, 40� J. Magné-Drisch et al., published by IFP Energies nouvelles, 2016DOI: 10.2516/ogst/2015038
This is an Open Access article distributed under the terms of the Creative Commons Attribution License (http://creativecommons.org/licenses/by/4.0),which permits unrestricted use, distribution, and reproduction in any medium, provided the original work is properly cited.
Cet article présente la méthodologie de développement du procédé et les performances obtenues sur laconversion du COS, ainsi que les modèles et outils de simulation qui ont été développés et deux casd’études qui montrent les gains et avantages du procédé COSWEETTM selon le couplage réalisé avecune colonne d’absorption aux amines.
NOTATION
Ap Particle surface area (m2)
ai Thermodynamic parameterbi Thermodynamic parameterT Temperature (K)b7 Water adsorption coefficient in reaction 7 (bar�1)b8 Water adsorption coefficient in reaction 8 (bar�1)
Cgi Gas concentration of compound i (mol/m3)
Cpi Particle concentration of compound i (mol/m3)
Dgax Gas axial dispersion coefficient (m2/s)
Deff ;i Effective diffusion coefficient (m2/s)
dp Particle diameter (m)Dm Molecular diffusion coefficient (m2/s)k7 Kinetic constant of reaction 7 (SI)k8 Kinetic constant of reaction 8 (SI)
kgs Gas-solid mass transfer coefficient (m/s)Keq;i ith thermodynamic constantL Particle characteristic length (m)PCO2 CO2 partial pressure (bar)PCOS COS partial pressure (bar)
d Film thickness (m)li;j Stoichiometric coefficient
qg Gas density (kg/m3)qs Solid density (kg/m3)s Tortuosity
INTRODUCTION: THE GAS TREATMENT CHAINAND NEW CHALLENGES
Natural gases, when collected from the production wells, arecommonly polluted with many contaminants. Among thesecontaminants are sulfur compounds and CO2. Throughoutthe oil and gas treatment chain, various steps intend to sep-arate most of the undesired compounds from the profitablepart of the natural gas. The desulfurisation of natural gas isusually performed in generic treatment processes and con-sists of removing H2S and/or CO2 to meet the export gasspecifications.
Commercial gas specifications also focus on compoundsother than H2S and CO2. New specifications have beenimposed for many years to also remove most of other sulfurcompounds from the natural gas. One of these, CarbonylSulfide (COS) is usually present in sour natural gases con-taining both H2S and CO2, in quantities which may reach150 to 1 000 ppm vol., due to the exploitation of gas fieldswith an increase in acid gas compounds.
The market for natural gas is in constant increase,+3%/year for natural gas and +7%/year for LiquefiedNatural Gas (LNG), and we can assume that there is a corre-lation between H2S content and COS content such that 70%of raw acid gas world reserves are affected by this problem.
In addition to the total sulfur specification on the treatedgas, there are some specific constraints with COS:– after fractionation of the treated gas, 90% of residual COS
will be recovered in the C3 fraction and 10% in the C2fraction because of the respective boiling point(�50.2�C for COS and�44.5�C for propane) which couldentail problems on downstream petrochemical units,
– if the treated gas is aimed to be transformed into LNG, theliquefaction process does not admit COS.For H2S and CO2 deacidification combined with COS
constraint, different treatment processes can be envisaged.Hybrid or physical solvents present the advantage of
Page 2 of 21 Oil & Gas Science and Technology – Rev. IFP Energies nouvelles (2016) 71, 40
achieving both H2S, CO2 and COS elimination in one unit.However, for a selective application, it is not possible torespect the required H2S/CO2 selectivity and hydrocarbonco-absorption leads to economically unattractive processes.In addition, some of these solvents are not stable at high tem-peratures. Regarding these disadvantages, chemical solventsare in most cases more attractive solutions.
Amine solvents are very often used for natural gas deacid-ification purposes as they can be adapted to various specifi-cations and to a wide range of feed gas compositions.
When complete CO2 removal from the gas is required, forinstance to achieve LNGplant feed specifications, formulatedMDEA solvents are more frequently being used, replacingprimary or secondary amines.MDEA,when it is usedwithoutactivator, is a selective amine solvent. It targets H2S removal,but leaves some CO2 in the treated gas. This reduces thesweetening cost as some CO2 can be left in the treated gas,and increases H2S concentration in the produced acid gasesto Sulfur Recovery Units (SRU). MDEA is also used for anadditional acid gas enrichment step to prepare the feed loadof SRU for an optimised design of the Claus unit.
When MDEA is used for a selective H2S removal fromthe gas, a reduced fraction of the CO2 is separated fromthe feed gas but an even lower fraction of the COS isremoved. It is well known that MDEA has poor COSremoval capabilities. Severe COS specification cannot bereached for gases with fairly high initial COS content evenwith higher solvent circulation rate and/or high number ofmass transfer units in the contactor.
In other words, it is not possible to design a selectiveremoval plant that removes COS and leaves amounts ofCO2 in the treated gas, as a selective plant should aim todo. Therefore, the reduction of the sweetening cost by leav-ing some CO2 in the gas, so as to improve the quality of acidgas, is equally unachievable. The design will likely rely onthe use of a primary or secondary amine or a formulatedMDEA. If acid gas enrichment is needed to efficientlydesign the Claus unit, then a second acid gas enrichment unitusing selective solvent is compulsory to improve the qualityof acid gas and increase its H2S content.
The severe COS specifications in the export gas conse-quently affect the cost of gas treatment when this is carriedout with amines solvents, especially when a selective H2Sremoval unit should help to minimise the number of unitsof the Sulfur Recovery Facilities or to reduce the size ofthe high pressure acid gas removal unit.
Regarding this process analysis and following a review ofcatalytic solutions, IFP Energies nouvelles (IFPEN) hasdeveloped the COSWEETTM process that combines a verydeep COS removal through the complete hydrolysis of theCOS in a catalytic reactor integrated within the selectiveremoval of H2S by a MDEA amine unit. The COSWEETTM
reactor can also be integrated with an EnergizedMDEA unit
as it reduces the solvent flow rate to perform both acid gasremoval and COS removal.
At the screening phase, IFPEN has selected a specificmetal oxide based catalyst that is able to operate at moderatetemperatures. Numerous data have been acquired in the lab-oratory on the thermodynamics and the kinetics of thehydrolysis reaction taking place on the catalyst. Based onthese data, a specific prediction model (and an in-house sim-ulator) has been developed to allow the precise and optimaldesign of the catalytic reactor. Details of these developmentsare presented in this paper.
The last part of the paper focuses on the interest of theCOSWEETTM process when selective acid gas removal isrequired through a representative case study. The paper alsodiscusses interest in the COSWEETTM process in terms ofcapital and operating expenditures (CAPEX and OPEX)compared to a formulated amine application.
1 IDENTIFICATION OF THE CONCEPT AND PROCESSDEFINITION
The solvents based on alkanolamines are the most generallyaccepted and widely used of the many available solvents forremoval of acid gas H2S and CO2 from natural gas streams.However, alkanolamine based processes do not provide techno-logical solutions and attractive compromises between investmentand operational costs when they target tight COS specificationsfrom gas containing large amounts of COS [1]. When total CO2
removal is required, conventional amine processes can beadapted (using for instance primary and secondary amines or for-mulated MDEA), to remove COS down to very low levels intreated gas. This is generally achieved by increasing the solventflow rate along with the absorber height.
Some processes have also secured the COS transforma-tion into H2S and CO2 by hydrolysis in a hot zone of theamine absorber, as this is performed in a specific versionof the HiLoadDEA process licensed by Prosernat [2].
Some competitors [3] propose the use of physical solventsin selective treating by using differences in equilibrium con-stants (i.e. solubility), the advantage being the good absorp-tion of COS component but the two major drawbacks are:– hydrocarbon coabsorption which represents a loss of
valuable hydrocarbons into the acid gas (lost sales of nat-ural gas components (C1, C2) and lost sales of C3+, NGL,condensate;
– required high partial pressure of acid gas.Other competitors propose the use of hybrid solvents [4]
to remove the COS and mercaptans and maintaining theselectivity. However, the application of hybrid solvents is
Oil & Gas Science and Technology – Rev. IFP Energies nouvelles (2016) 71, 40 Page 3 of 21
adapted to acid gas enrichment units and these solvents havethe same problem of hydrocarbon coabsorption as physicalsolvents.
MDEA is the attractive solution for maintaining the selec-tivity but for gases containing COS, the use of selectiveMDEA processes faces two difficulties. The reactionbetween MDEA and COS is low and MDEA is not pronefor removing COS. Reaction mechanisms of COS withMDEA are the same as those of MDEA with CO2.
There is no direct reaction between MDEA andCO2. Absorption of CO2 is achieved through hydrolysis(Reaction 2) catalysed by MDEA. This reaction is very slowand this is the reason why MDEA solvent is selective:
CO2ðaqÞ þ HO� ! HCO3�
Reaction 1
CO2ðaqÞ þ R1R2R3Nþ H2O $ HCO3� þ R1R2R3NH
þ
Reaction 2
As noted by Sharma [5], reactions between COS andMDEA are based on the same mechanism. COS undergoeshydrolysis to yield carbon dioxide and hydrogen sulfide[6] according to Reaction 3:
COSðaqÞ þ HO� ! HCO2S�
Reaction 3
Al-Ghawas et al. [7] proposed that tertiary amines act asbase catalyst for the hydrolysis reaction of COS according toReaction 4:
COSðaqÞ þ R1R2R3Nþ H2O $ HCO2S� þ R1R2R3NH
þ
Reaction 4
Reaction 4 is even slower than the CO2 hydrolysis inReaction 2.
The existing sweetening processes do not have the capa-bility to remove all COS while maintaining high CO2/H2Sselectivity. The presence of the COS in the sour gas is amajor problem in the case of natural pipe gas specification.Most of the time, a total acid gas removal unit is designedto achieve COS elimination.
1.2 Evaluation of Different Schemes to Reach High COSElimination
Based on its experience of catalyst development, IFPEN hasinvestigated the possibility to remove the COS by hydrolysis(Reaction 5) through heterogeneous catalysis. Reaction 5
implies the removal of acid gases formed by the hydrolysisreaction:
COSðgÞ þ H2OðgÞ $ CO2ðgÞ þ H2SðgÞReaction 5
The philosophy of the development is to keep the highselective performance of MDEA solvent with a conventionalacid gas (CO2 and H2S) absorption and achieve significantCOS removal through a dedicated catalytic reactor. Both cat-alytic and process schemes were investigated to find the suit-able configuration.
1.2.1 First Configuration: COS Hydrolysis Followed by AmineTreatment
The first configuration investigates the possibility to performthe hydrolysis upstream of the absorber as a pretreatment.Figure 1 represents the first process scheme in which feedgas is sent into a feed/effluent heat exchanger and enters tothe reactor final a last heating step so as to reach the temper-ature required by the process. The COS free exhaust gas issent to the absorber to remove acid gas.
The feed gas composition treated by the hydrolysis reac-tor contains the highest quantity of acid gas. A typical acidgas composition in natural gas (Tab. 1) was taken intoaccount for the preliminary investigation of the processscheme.
The water content is 1 200 ppm vol. (saturation of the nat-ural gas). Due to high acid gas content (COS and H2S), andas COS hydrolysis reaction is an exothermic equilibriumreaction, either low temperature and/or higher water contentwould be required to reach high COS conversion. This ishowever unacceptable as in these conditions operating tem-peratures required to reach high COS conversion would bebelow gas dew point. At process scale, this would lead tocapillary condensation inside catalyst porosity. This is illus-trated in Figure 2, which represents the COS conversion atthermodynamic equilibrium for different water contents.These calculations underline that is not possible to reachhigh COS conversion by adding a huge amount of water(10 vol.%).
This explains the necessity to remove the CO2 and H2Scontent upstream the COS hydrolysis reactor due to the ther-modynamic constraint.
1.2.2 Second Configuration: Amine Treatment Followedby COS Hydrolysis
The second configuration proposes to hydrolyse the COSdownstream of the absorber contactor (Fig. 3). This config-uration favours the thermodynamic equilibrium of the
Page 4 of 21 Oil & Gas Science and Technology – Rev. IFP Energies nouvelles (2016) 71, 40
hydrolysis reaction because the absorber removes CO2 andH2S compounds by MDEA absorption.
The natural gas enters at the bottom of the absorber andflows upward through the column and is contacted at countercurrent with the lean solvent MDEA. At the top of thecolumn the gas has reached CO2 and H2S specifications.The gas is heated to the operating temperature of the process(100-180�C) and is sent to the hydrolysis reactor.The exhaust gas contains H2S produced by the hydrolysisreaction which should be removed by an additional reactorstep. The typical purification reactor to remove low H2S
concentration (� 100 ppm vol.) from a gas is a zinc oxide fixedbed reactor. Reaction 6 takes place at higher temperature thanthe hydrolysis reaction and requires an additional heater:
H2SðgÞ þ ZnOðsÞ ! ZnSðsÞ þ H2OðgÞReaction 6
Additionally, a lead-lag configuration is mandatorybecause zinc oxide is non-regenerable.
Figure 4 represents the COS conversion at equilibrium asa function of the temperature with the acid gas compositionat the inlet of the hydrolysis reactor. Contrary to the firstconfiguration, there is no thermodynamic limitation toreaching high COS conversion.
Acid gas
Fuel gas
Feed gas
Treated gas
Rich solvent
Lean solvent
Hydrolysisreactor
Absorbercontactor
Regeneratorcontactor
Figure 1
Process scheme 1: COS hydrolysis followed by amine treatment.
Oil & Gas Science and Technology – Rev. IFP Energies nouvelles (2016) 71, 40 Page 5 of 21
A preliminary design of the hydrolysis reactor and ZnOreactor was performed based on this configuration. A short-cut reactor model for the hydrolysis reactor was developedby IFPEN for the preliminary design based on a catalystand a kinetic law from the literature [8]. The compositionof the hydrolysis feed gas reactor is summarised in Table 2.
The hydrolysis reactor design is presented in Table 3 and theZnO reactor design is presented in Table 4.
The shortcut model validates the feasibility of the hydrolysisreactor in term of performance and the design is acceptable.
The zinc oxide reactor was designed with another shortcutmodel. The results of the design show that the configurationis not suitable for the H2S removal. Indeed, the huge amountof solid is not economically acceptable and implies a consid-erable size of the reactor. In fact, the residual H2S content(several tens of ppm) to be treated downstream of the hydro-lysis reactor is too important due to the huge natural gas flowrate. The CAPEX of hydrolysis section plus zinc oxide reac-tor and heat exchanger equipment could not be envisaged.
An alternative solution to remove H2S reformed by COSconversion should be envisaged. Other processes exist onthe market but the associated costs are not acceptable. Thesuitable solution will be to re-introduce the exhaust gas ofthe hydrolysis reactor into the upper part of the amine absor-ber in order to remove the last trace of the H2S.
1.2.3 Third Configuration: Combined COS Hydrolysisand Amine Treatment
The third configuration (Fig. 5) proposes to sweeten the acidgas from the hydrolysis reactor inside the absorber. The feed
Acid gas
Fuel gas
Feed gasTreated gas
Rich solvent
Lean solvent
Hydrolysisreactor
Absorbercontactor
Regeneratorcontactor
H2S removalreactor
Figure 3
Process scheme 2: amine treatment followed by COS hydrolysis.
Page 6 of 21 Oil & Gas Science and Technology – Rev. IFP Energies nouvelles (2016) 71, 40
natural gas enters at the bottom of the absorber column inorder to remove the bulk CO2 and H2S acid gases. Theobjective is the same as configuration 2 (amine treatment fol-lowed by COS hydrolysis) which is to avoid thermodynamiclimitation. In a second step, the gas is withdrawn from theabsorber and sent to the catalytic reactor after two heatingsteps. At the outlet of the hydrolysis reactor, the gas nolonger contains COS and is sent back to the upper part of
the absorber. H2S formed by the COS conversion is sweet-ened by MDEA lean solvent in countercurrent.
The advantage of this configuration is the use of thesame absorber column to remove the acid gas to reach thenatural gas specifications and to remove the last decades ofH2S ppm vol. present at the outlet of the catalytic hydrolysisreactor. This configuration implies two dedicated sections ofthe absorber, due to the pressure drop of the heat exchangerand the hydrolysis reactor.
The preliminary design of this last process scheme, with acombined COS hydrolysis and amine treatment, presents thebest performance and it is the preferable configuration.
1.3 Definition of the COSWEETTM Process
The COSWEETTM process (Fig. 6) is based on the preferredprocess scheme 3 (combined COS hydrolysis and aminetreatment) and is presented in the final configuration.
Most of the acid compounds from the sour gas are removedby the solvent in the lower section of the absorption column.The gas from this first bulk removing stage is heated to an opti-mised temperature before entering the catalytic reactor wherethe COS is hydrolysed into CO2 and H2S. The produced gasis introduced into the upper part of the absorption column tocomplete the H2S removal. Therefore the absorption columnneeds two solvent feeds. Because of the low acid gas contentin the upper section, the solvent flow rate in this section can bestrongly decreased, allowing a reduction in column diameter.
The COSWEETTM section is integrated to a very simpleand conventional amine unit. The configuration can be adaptedto any arrangement of Acid Gas Removal Unit (AGRU):– the solvent used in a COSWEETTM unit is the one produced
by the regenerator of the AGRU unit, with no need for extraduty or modified configuration of the stripping section;
– the absorber can be fitted with trays or with packing beds;– the hydrolysis of COS in a reactor destroys COS, and it
almost completely reduces the COS content in the flashgas and in the acid gas.Some special arrangements of the reactor section, especially
some dedicated arrangements to knock out the liquids upstreamof the reactor, mitigate the risk of any solvent carry-over whichcould drastically reduce the hydrolysis catalyst activity.
2 PROCESS DEVELOPMENT AND FIRST TECHNO-ECONOMIC EVALUATION
2.1 Validation of the Concept: Catalyst Choice and FirstTechno-Economic Evaluation
The first techno-economic comparison (Tab. 5) is based onthe COSWEETTM scheme versus a total removal absorptionscheme by use of the solvent DEA (reference case).
TABLE 2
Hydrolysis feed gas reactor
Molar flow rate (kmol/h) 2721
Molar fraction (%)
CO2 1.97
H2S 0.0002
H2O 0.17
N2 0.26
C1 89.2
C2 4.9
C3 1.5
C4 1.1
C5 0.5
C6 0.3
COS 0.0083
TABLE 3
Hydrolysis reactor design
CO2 outlet (mol%) 1.98
H2S outlet (ppm mol) 83
COS outlet (ppm mol) 1
Mass of the catalyst (kg) 3500
Reactor diameter (mm) 1100
Reactor length (m) 4.2
TABLE 4
ZnO reactor design
Mass of the ZnO (T) 472
Volume of ZnO bed (m3) 410.3
Diameter (m) 3.2
High (m) 50.7
Oil & Gas Science and Technology – Rev. IFP Energies nouvelles (2016) 71, 40 Page 7 of 21
Acid gas
Fuel gas
Feed gas
Treated gas
Rich solvent
Lean solvent
Hydrolysisreactor
Absorbercontactor
Regeneratorcontactor
Figure 5
Process scheme 3: Combined COS hydrolysis and amine treatment.
Acid gas
Fue
l gas
Treated gas
Rich solvent
Leansolvent
LPsteam
Lean solvent
Leansolvent
Figure 6
COSWEETTM process scheme.
Page 8 of 21 Oil & Gas Science and Technology – Rev. IFP Energies nouvelles (2016) 71, 40
The COSWEETTM process allows to maintain 1.8% ofCO2 in the treated gas by achieving a deep COS removal(1 ppm vol.). To reach 1 ppm vol. of COS in the treatedgas with DEA process implies the total removal of CO2.The CAPEX reduction is significant even when consideringthe cost increase due to the additional reactor and heatexchanger. Indeed, the reduction of the size of the columnand of the solvent flow rate balances the CAPEX increaseof the COSWEETTM equipments.
2.2 Definition of the Process Phase Development
The preliminary study resulted in high interest in theCOSWEETTM process for natural gas application toremove COS to meet very severe specifications (< 1 ppmvol.) allowing high H2S/CO2 selectivity to be kept. Theprocess development approach could be illustrated byFigure 7.
Based on a commercial catalyst, a shortcut reactor modelhas been developed to identify the best process scheme toremove COS in parallel to the AGRU. The technical evalua-tion allowed the determination of the suitable scheme thatcould be economically investigated. If the economic aspectis acceptable, the scheme is protected with a registered patentand a more thorough study could start.
Catalyst laboratory tests should be performed to deter-mine the activity of the catalyst in the process operating con-dition and a rigorous kinetic model should be developed.Based on the kinetic and process constraint a fixed bed reac-tor model was developed. Additional experimental lab testswere performed to validate the model at low and high con-version for several operating conditions.
Based on the preferred scheme a patent was registered toprotect the COSWEETTM process [9] (Fig. 8).
3 EXPERIMENTAL STUDY
Following techno-economic evaluation, an experimentalstudy has been carried out in order to obtain data on catalystactivity toward the COS hydrolysis reaction. Objectives
were primarily to validate the feasibility of COS conversionreaction under the industrial COSWEETTM process condi-tions. Experiments were also performed to obtain informa-tion on reaction kinetics to determine the criticalparameters that may affect COS conversion and to get datato be used to develop a kinetic modeling tool. From theseexperiments, the dependence of reaction kinetics toward aset of parameters that have to be considered for theCOSWEETTM process design has been underlined.
3.1 The Pilot Plant
A schematic representation of the experimental set-up usedfor kinetics measurements is reported in Figure 9.
This equipment can be divided into three sections, as rep-resented in Figure 9:1. a feed preparation zone where the different gas are
mixed to build the feed gas. COS, CO2, He and H2Sare supplied from gas tanks with specific gas composi-tions provided by Air Liquide. An helium and water mix-ture is prepared using a water saturator set-up where ahelium flow bubbles in water heated at a controlled tem-perature. This controlled water saturated helium flow ismixed to the mixture of dry COS-H2S-CO2-He gas toreach the desired water content;
2. a reaction zone, which basically consists of a cylindricalfixed bed reactor filled with the COS hydrolysis catalystand heated at the desired temperature;
3. an analytic set-up to analyse and quantify the reactionsproducts through mass spectrometry. Initial COS gas con-tents and COS gas contents downstream of the hydrolysisreaction zone are measured to determine COS conversionrates as a function of the operating conditions.
3.2 Experimental Results
COS hydrolysis is thermodynamically very favoured at lowtemperature as shown in Figure 10. Preliminary long resi-dence time tests have been first carried out to measure theoccurrence of any inhibition effect or lack of catalyst activityunder the industrial COSWEETTM process conditions. COSconversion rates have been measured for different tempera-tures from 100 to 200�C. These experiments show that theselected catalyst exhibited highly satisfactory activitytoward the operating conditions imposed as it allowed nearlycomplete COS conversion close to thermodynamic equilib-rium to be reached.
Lower residence time tests have been performed to evalu-ate the kinetics of COS conversion as a function ofexperimental parameters: temperature, GHSV (Gas HourlySpace Velocity) or residence time, pressures H2O, COS,H2S, CO2. The operating condition ranges explored are sum-marised in Table 6. These data were used to produce a design
TABLE 5
First techno-economic evaluation
HiLoadDEA COSWEETTM
CO2 outlet (mol%) 0 1.8
H2S outlet (ppm mol) 0 4
COS outlet (ppm mol) 1 1
CAPEX (%) 100 83
OPEX (%) 100 91
Oil & Gas Science and Technology – Rev. IFP Energies nouvelles (2016) 71, 40 Page 9 of 21
Preliminaryprocess scheme –AGRU integration
Preliminary technico-economicevaluation
Technical evaluation
Commercial catalyst identification
Hydrolysis heterogeneousshortcut model
COSWEETTM process scheme
Catalyst laboratory test in theCOSWEETTM (T and Partial pressure)
Kinetic model
Fixe bed reactor model(Hydrodynamic, kinetic, transfer)
Industrial scale-up based on IFPENrefinery experience
COSWEETTM process scheme costestimate
Case study
Figure 7
Process phase development.
R1
13
12
E5
11
E4 E3
E5
F1
E1
E2
C2
7
C115
4
52
6
8
Rb1
9
16
3
2b
C1b
17
19 18 P1P2
2a
C1a
1
14
10
Figure 8
COSWEETTM process scheme [9].
Page 10 of 21 Oil & Gas Science and Technology – Rev. IFP Energies nouvelles (2016) 71, 40
model of the COS hydrolysis reactor with the selectedcatalyst.
It was shown that the moderate presence of H2S and CO2
had no significant impact on the kinetics of the COShydrolysis reaction in the operating range tested. At higherconversions, the presence of H2S and CO2 can decreasethe conversion performances due to thermodynamicequilibrium.
The addition of water has a moderate impact on the con-version of COS, as water is already in large excess comparedwith the expected COS levels. It was verified that forindustrial residence time ranges, the hydrolysis reaction of
COS was not inhibited, and that the catalyst activity wasnot affected by the presence of water.
Experiments have also been performed on crushed and un-crushed catalyst particles to take into account potentialmacro-porous diffusion limitations inside catalyst particles. Indeed,significant transport limitations have been highlighted fromthese experiments, due to the high reaction rate. In agreementwith experimental observations, these transport limitationsare also demonstrated by the modeling performed for bothlab-scale experiments and industrial case study (Sect. 4).
Thiele modulus calculations have been performed inorder to have an estimation of the potential limitations
Zone 1: Feed preparation Zone 2: Plug flow reactor
Zone 3: Analytical set-up
Oven
Hydro
lysis
reaction z
one
Heated line
Atmospheric
vent
Atmospheric
vent
Mass
spectrometer
He + H2O
COS
CO2
H2S
He
Figure 9
Experimental equipment for kinetic measurements.
-40
-35
-30
-25
-20
-15
-10
-5
00 100 200 300 400
Temperature (°C)
ΔG (
kJ)
COS + H2O = CO2 + H2S
1
10
100
1000
10000
100000
1000000
10000000
0 100 200 300 400
Temperature (°C)
K
COS + H2O = CO2 + H2S
Figure 10
Free enthalpy and equilibrium constant of the COS hydrolysis reaction as a function of temperature (thermodynamic data obtained from HSCChemistry v6.1 [10]).
Oil & Gas Science and Technology – Rev. IFP Energies nouvelles (2016) 71, 40 Page 11 of 21
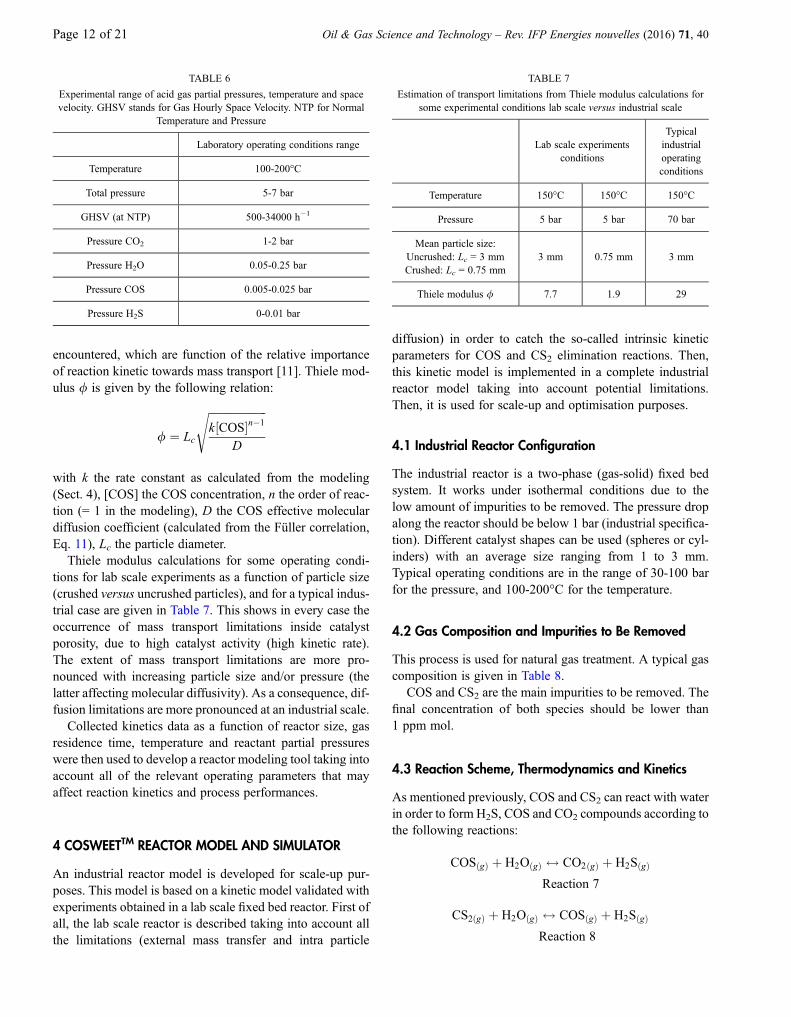
encountered, which are function of the relative importanceof reaction kinetic towards mass transport [11]. Thiele mod-ulus / is given by the following relation:
with k the rate constant as calculated from the modeling(Sect. 4), [COS] the COS concentration, n the order of reac-tion (= 1 in the modeling), D the COS effective moleculardiffusion coefficient (calculated from the Füller correlation,Eq. 11), Lc the particle diameter.
Thiele modulus calculations for some operating condi-tions for lab scale experiments as a function of particle size(crushed versus uncrushed particles), and for a typical indus-trial case are given in Table 7. This shows in every case theoccurrence of mass transport limitations inside catalystporosity, due to high catalyst activity (high kinetic rate).The extent of mass transport limitations are more pro-nounced with increasing particle size and/or pressure (thelatter affecting molecular diffusivity). As a consequence, dif-fusion limitations are more pronounced at an industrial scale.
Collected kinetics data as a function of reactor size, gasresidence time, temperature and reactant partial pressureswere then used to develop a reactor modeling tool taking intoaccount all of the relevant operating parameters that mayaffect reaction kinetics and process performances.
4 COSWEETTM REACTOR MODEL AND SIMULATOR
An industrial reactor model is developed for scale-up pur-poses. This model is based on a kinetic model validated withexperiments obtained in a lab scale fixed bed reactor. First ofall, the lab scale reactor is described taking into account allthe limitations (external mass transfer and intra particle
diffusion) in order to catch the so-called intrinsic kineticparameters for COS and CS2 elimination reactions. Then,this kinetic model is implemented in a complete industrialreactor model taking into account potential limitations.Then, it is used for scale-up and optimisation purposes.
4.1 Industrial Reactor Configuration
The industrial reactor is a two-phase (gas-solid) fixed bedsystem. It works under isothermal conditions due to thelow amount of impurities to be removed. The pressure dropalong the reactor should be below 1 bar (industrial specifica-tion). Different catalyst shapes can be used (spheres or cyl-inders) with an average size ranging from 1 to 3 mm.Typical operating conditions are in the range of 30-100 barfor the pressure, and 100-200�C for the temperature.
4.2 Gas Composition and Impurities to Be Removed
This process is used for natural gas treatment. A typical gascomposition is given in Table 8.
COS and CS2 are the main impurities to be removed. Thefinal concentration of both species should be lower than1 ppm mol.
4.3 Reaction Scheme, Thermodynamics and Kinetics
As mentioned previously, COS and CS2 can react with waterin order to form H2S, COS and CO2 compounds according tothe following reactions:
COSðgÞ þ H2OðgÞ $ CO2ðgÞ þ H2SðgÞReaction 7
CS2ðgÞ þ H2OðgÞ $ COSðgÞ þ H2SðgÞReaction 8
TABLE 7
Estimation of transport limitations from Thiele modulus calculations forsome experimental conditions lab scale versus industrial scale
Lab scale experimentsconditions
Typicalindustrialoperatingconditions
Temperature 150�C 150�C 150�C
Pressure 5 bar 5 bar 70 bar
Mean particle size:Uncrushed: Lc = 3 mmCrushed: Lc = 0.75 mm
3 mm 0.75 mm 3 mm
Thiele modulus / 7.7 1.9 29
TABLE 6
Experimental range of acid gas partial pressures, temperature and spacevelocity. GHSV stands for Gas Hourly Space Velocity. NTP for Normal
Temperature and Pressure
Laboratory operating conditions range
Temperature 100-200�C
Total pressure 5-7 bar
GHSV (at NTP) 500-34000 h�1
Pressure CO2 1-2 bar
Pressure H2O 0.05-0.25 bar
Pressure COS 0.005-0.025 bar
Pressure H2S 0-0.01 bar
Page 12 of 21 Oil & Gas Science and Technology – Rev. IFP Energies nouvelles (2016) 71, 40
Both reactions are reversible. Thermodynamic equilib-rium constants depend on the temperature as shown inEquation (1). Table 9 gives the corresponding thermody-namic parameters for the equilibrium constants:
ln Keq;i
� � ¼ aiT Kð Þ
þ bi
i ¼ reaction number ¼ 7; 8ð1Þ
For both reactions, an Eley-Rideal mechanism was usedin order to take into account the inhibition effect of water.Kinetic rate expressions are given in Equation (2):
r7 mol=s=kg catð Þ ¼b7 � k7 � PCOS � PH2O � 1
Keq;7� PH2S � PCO2
� �1þ b1 � PH2O
r8 mol=s=kg catð Þ ¼b8 � k8 � PCS2 � PH2O � 1
Keq;8� PCOS � PH2S
� �1þ b8 � PH2O
ð2Þ
Kinetic parameters for reaction 7 were estimated from labscale experiments (Tab. 10). For reaction 8, kinetic parame-ters are taken from the literature [12].
4.4 Reactor Modeling
Material balances are written for each compound at differentscales: in the gas flow, in the external mass transfer film
around the catalyst pellet, and inside the catalyst porous net-work. For the gas flow, a dispersed-plug flow model wasused to take into account a potential back-mixing effect.Equation (3) gives the corresponding gas material balance:
eg � @Cgi
@t¼ Dg
ax �@
@zeg � @C
gi
@z
� �� @ vsg � Cg
i
� �@z
� kgs � esL � Cgi � Cs
i
� � ð3Þ
Gas axial dispersion coefficient was estimated using theGunn correlation [13] (Eq. 4):
Dgax ¼
vsg=eg � dpPea
with1
Pea¼ X � 1� /ð Þ2 þ X 2 � / � 1� /ð Þ3
� e�
1
X � / � 1� /ð Þ� �
� 1
264
375þ eg
s � Re � Sc
and
X ¼ Re � Sc21:13 � eg ; Re ¼ qg � vsg � dp
lg; Sc ¼ lg
qg � Dm
/ ¼ 0:17þ 0:33 � e�24Re; s ¼ 1:4 for sphere
/ ¼ 0:17þ 0:29 � e�24Re; s ¼ 1:93 for cylinder
ð4Þ
The material balance in the external film is given byEquation (5):
d � @Csi
@t¼ kgs � Cg
i � Csi
� �� Deff ;i � @Cpi
@r
r¼Rp
with d ¼ Dm
kgsðfilm thicknessÞ
and L ¼ Vp
Apðcharacteristic length of the catalystÞ
ð5Þ
The mass transfer coefficient is given by the Yoshida cor-relation [14] which takes into account the gas flow patternaround the particle (Eq. 6):
Sh ¼ 0:983 � Re0:59 � Sc1=3 if Re > 190
Sh ¼ 1:66 � Re0:49 � Sc1=3 if Re < 190ð6Þ
with Sh ¼ kgs;i � dpDm;i
; Re ¼ qg � vsg � dplg
; Sc ¼ lgqg � Dm;i
Gas material balances should respect the equation of statePiCg
i ¼ PtR:T. Then, after summing all the gas equations and
TABLE 9
Equilibrium constants
a b Reference
Reaction 7 3796.1 �0.505 IFPEN data
Reaction 8 4163.9 1.063Fact sage data http://www.crct.
polymtl.ca/fact/
TABLE 8
Typical composition of natural gas
Feed composition
Compounds Vol.%
COS 0.0083
H2S 0.0002
CO2 2.0272
H2O 0.1738
CS2 0.0000
CH4 97.790
Total 100.000
Oil & Gas Science and Technology – Rev. IFP Energies nouvelles (2016) 71, 40 Page 13 of 21
introducing the equation of state, we obtain the correspond-ing equation for the gas velocity:
) @ vsg � Pt
� �@z
¼ Dgax �
@
@zeg � @Pt
@z
� �
� R � T �Xi
kgs;i � esL � Cgi � Cs
i
� � ð7Þ
Particle material balances (Eq. 8 and 9) are written for twoparticle shapes (cylinders and spheres):
Spheres ep � @Cpi
@t¼ Deff ;i
r2�@ r2 � @C
pi
@r
� �@r
þXj
li;j � rj � qs ð8Þ
Cylinders ep � @Cpi
@t¼ Deff ;i
r� @@r
r � @Cpi
@r
� �þXj
lij � rj � qs
ð9Þ
with ep ¼ particle porosity:
The effective diffusion coefficient is a function of themolecular diffusion coefficient of each compound, theporosity and the tortuosity of the catalyst (as shown inEq. 10):
Deff ;i ¼ Dm;i � eps
ð10Þ
Molecular diffusion coefficients are estimated using theFüller correlation [15] (Eq. 11):
DiB ¼ 1:43 � 10�3 � T1:75
Pt �M 1=2iB � Rvð Þ1=3i þ Rvð Þ1=3B
h i2
with MiB ¼ 21Mi
þ 1MB
ð11Þ
The effects of pressure and temperature were taken intoaccount for the molecular diffusion coefficient.
Reactor pressure drop is calculated using the Ergun equa-tion or the Handley equation according to the gas flowregime (Eq. 12):
Ergun:
dP
dz¼ 150
d2p� e2s1� esð Þ3 � lg � vsg
þ 1:75
dp� es1� esð Þ3 � qg � v
2sg 0 < Re=es < 1000
ð12ÞHandley et al.:
dP
dz¼ 368
d2p� e2s1� esð Þ3 � lg � vsg
þ 1:24
dp� es1� esð Þ3 � qg � v
2sg 1000 < Re=es < 5000
4.5 Numerical Aspects
A spatial discretisation of the partial derivative equationswas done using an upwind finite differences scheme forthe convection terms and a centered finite differencesscheme for the diffusion or dispersion terms. For time inte-gration, the Lsode solver was used based on a predictor-corrector algorithm [16]. An excel interface coupled withMatlab (for 3D visualisation) was developed.
4.6 COSWEETTM Simulator
Figure 11 shows the model interface. For one simulation, thereactor geometry, operating conditions, the catalyst geome-try and the gas composition can be changed.
Figure 12 shows the COS intra-particle concentration pro-file at different reactor elevations.
As discussed in Section 3, transport limitations are indeedhighlighted by the modeling performed for both lab-scaleexperiments and industrial case study. Significant transportlimitations are observed at the bed inlet due to the high reac-tion rate. At the reactor outlet, there are less limitations dueto lower COS gas content.
In both industrial and lab-scale, heat transfers have beenneglected (isothermal conditions), as COS concentrationsin every cases remain very low (<< 1%v).
4.7 Model Validation
The model was validated with experiments carried out in a labscale fixed bed reactor for non-crushed and crushed catalysts.
TABLE 10
Kinetic parameters
ki (mol/kg/s/Pa) E (J/mol) bi (Pa�1) DH ads (J/mol) Reference
Page 14 of 21 Oil & Gas Science and Technology – Rev. IFP Energies nouvelles (2016) 71, 40
Figure 13 shows a comparison between experimental and mod-eling data for COS conversion. A good agreement was obtained.
5 TECHNO-ECONOMIC EVALUATION
5.1 Case Study 1: Deep COS Removal with Bulk CO2Removal
The following example presents a CO2 bulk removal appli-cation. The solvent used for acid gas removal is a formulatedMDEA which is effective in absorbing H2S and CO2 andsome of the COS. The COSWEETTM process allows theremoval of COS down to very low levels. The treated gashas to meet typical pipeline gas specifications: less than4 ppm vol. H2S and less than 2.0 vol.% CO2. The COS spec-ification is less than 0.5 ppm vol. The feed gas compositionand conditions are given in Table 11.
The process scheme is as described in Figure 14. Theabsorber operates at relatively high temperature (85-90�C)
because there is constant and intensive reaction of CO2 withamine occurring on every stage of the column. The need forheating the extracted gas prior to entering the hydrolysisreactor is minimised, and no gas/gas exchanger is necessary,reducing the overall pressure drop.
If a traditional formulated MDEA process can easilyreach the CO2 and H2S specifications, it does not allowcomplete removal of COS, even if the initial content is verylow. Destruction of the COS by hydrolysis in aCOSWEETTM catalytic section allows slipping of therequired amount of CO2 with the treated gas, substantiallyreducing the size and the energy consumption of the aminesection that would be traditionally designed with formulatedMDEA. Table 12 presents the main sizing data of theCOSWEETTM process which guarantees the three requiredspecifications to be met.
The extra heat duty needed for the removal of COS is lessthan 6% of the amine solution regenerator reboiling duty.The pressure drop of the COSWEETTM hydrolysis sectionis less than 1 bar.
C_gas COS (ppm mol)
C_gas H2S (ppm mol)
C_gas CS2 (ppm mol)
Reactor height (m)
Concentr
ation (
ppm
)
Impurities profiles along the reactor
0
9080706050403020100
1 2 3 4
Particle profiles at reactor outletC_particle COS (ppm mol)
Oil & Gas Science and Technology – Rev. IFP Energies nouvelles (2016) 71, 40 Page 15 of 21
0.16
0.14
0.12
0.10
0.08
0.06
0.04
0.02
-1.5-0.5 -1.0
00.51.01.5
0-1.5
-1.0
-0.5
z (
m)
0
0.5
1.0
1.5
0.005
0.010
0.015
y (m) x (m)
COS inlet (mol/m3)
Inlet Middle
Outlet
x 10-3
x 10-3
0.16
0.14
0.12
0.10
0.08
0.06
0.04
0.02
-1.5-0.5 -1.0
00.51.01.5
0-1.5
-1.0
-0.5
z (
m)
0
0.5
1.0
1.5
0.005
0.010
0.015
y (m) x (m)
COS middle (mol/m3)
x 10-3
x 10-3
0.16
0.14
0.12
0.10
0.08
0.06
0.04
0.02
-1.5-0.5 -1.0
00.51.01.5
0-1.5
-1.0
-0.5
z (
m)
0
0.5
1.0
1.5
0.005
0.010
0.015
y (m) x (m)
COS outlet (mol/m3)
x 10-3
x 10-3
Figure 12
Particle COS concentration profiles at different axial positions in the reactor.
TABLE 11
Feed gas description
Component Vol.%
CO2 6.8
H2S 0.0002
COS 0.0005
C1 84.2
C2 6.7
C3 1.44
i+nC4 0.4
i+nC5 0.12
C6+ 0.1
H2O 0.24
Dry gas flow rate (MMm3/d @ 1 atm. 15�C) 4.0
Pressure (bar g.) 93
0
20
40
60
80
100
0 20 40 60 80 100
Cal
cula
ted
CO
S c
onve
rsio
n (%
)
Experimental COS conversion (%)
Crushed catalystUncrushed catalyst
Figure 13
Parity plot for COS conversion with crushed and non-crushedcatalyst.
Page 16 of 21 Oil & Gas Science and Technology – Rev. IFP Energies nouvelles (2016) 71, 40
5.2 Case Study 2: Deep COS Removal with SelectiveSweetening
The main purpose of the COSWEETTM process is theremoval of COS with the use of selective gas sweeteningschemes using amine solvent that can produce a rich acidgas to the SRU, achieving at the same time a severe COSspecification on the sweetened gas. The purpose of this casestudy is to explore the benefits of selective sweeteningschemes, in addition to the removal of COS in high pressureAGRU.
The raw gas is first sent to the Acid Gas Removal Unit(amine based AGRU) and the separated acid gases are sentto a claus SRU followed by a selective amine Tail Gas Treat-ment Unit (TGTU). The overall sulfur recovery (in term ofH2S conversion) must be higher than 99.9%. The case study,based on different AGRU schemes that remove COS (CO-SWEETTM or formulated MDEA) focuses on the impactof the different AGRU designs on the design of the sulfurrecovery chain.
The design bases are presented hereafter. The feed gascomposition on a wet basis along with conditions is givenin Table 13.
The treated gas has to meet typical pipeline gas specifica-tions for H2S and CO2: less than 4 ppm vol. H2S and lessthan 2.0 vol.% CO2. The COS specification is less than1 ppm vol. The incinerator effluent specifications impose
Acid gas
Fuel gas
Feed gas
Treated gas
Rich solvent
Lean solvent
Figure 14
Process scheme.
TABLE 12
Main sizing data - COSWEETTM
Bulk removal section (bottom)
Amine solution flow rate (m3/h) 150
Packing height (mm) 4000
COSWEETTM catalytic section
Mass of catalyst (tons) 16.3
Gas heater duty (MW) 1.0
Gas cooler duty (MW) �2.9
“On-spec” section (top)
Amine solution flow rate (m3/h) 65
Packing height (mm) 3000
Amine reboiler duty (MW) 12.2
Oil & Gas Science and Technology – Rev. IFP Energies nouvelles (2016) 71, 40 Page 17 of 21
an effective destruction of all hydrocarbons, a reducedamount of sulfur compounds, and low sulfur emissions.Treated gas and incinerator effluent specifications are sum-marised in Table 14.
Two treatment options are considered:– in base treatment case (Fig. 15), sweetening of the gas is
achieved with formulated MDEA. This unit is designed toachieve the COS specification: the solvent flow rate andnumber of stages in the absorber are increased to enhanceCOS removal. This results in an almost completeco-absorption of CO2 from the gas. As a consequencethe H2S content of the acid gas feeding the Claus unit islow, and the required overall sulfur recovery cannot beachieved. An Acid Gas Enrichment Unit (AGEU), usingselective MDEA (MDEAmax process), is installed priorto the sulfur recovery chain to produce an acid gas ofadequate quality to achieve the targeted sulfur recoveryefficiency;
– in the second treatment option (Fig. 16), sweetening of thegas is done with a COSWEETTM process combined withthe use of MDEA as amine solvent. This process achieves
AGRUselective MDEA +
COSWEETTM
Incinerator
SRUclaus
TGTUhydrogenation +
selective MDEA
Raw gas Treated gas on specs
Acid gas
Air
Tail gas
AirClaustail gas
Figure 16
Selective AGRU + COSWEETTM.
TABLE 13
Feed gas composition and conditions
Component Vol.%
CO2 4.4000
H2S 4.6000
N2 0.3948
COS 0.0025
C1 79.3916
C2 5.1586
C3 2.4191
iC4 0.4728
nC4 1.0025
i+nC5 0.2872
nC6 0.3202
Benzene 0.0349
nC7 0.0708
Toluene 0.0341
mXylene 0.0100
C8+ 0.0634
C1SH 0.0075
C2SH 0.0050
H2O 0.0030
Dry gas flow rate (MMm3/d @1 atm. 15�C)
12.98
Pressure (bar g.) 67.75
Temperature (�C) 25.0
AGRUformulated MDEA
AGEUselective MDEA
Incinerator
SRUclaus
TGTUhydrogenation +
selective MDEA
Raw gas Treated gas on specs
Complete CO2 removal
Acid gasAir
AGEUoff gas
Tail gasRich acid gas
Air Claustail gas
Figure 15
Base treatment case: formulated MDEA and AGEU.
TABLE 14
Treated gas and incinerator effluent specifications
Treated gasspecifications
H2S (ppm vol.) 4
CO2 (vol.%) 2
COS (ppm vol.) 1
Incineratoreffluent
specifications
H2S (mg/Nm3) 15
Total reduced S (CS2, COS, H2S)(mg/Nm3)
50
Unburnt hydrocarbons (mg/Nm3) 20
SO2 (mg/Nm3) 500
Page 18 of 21 Oil & Gas Science and Technology – Rev. IFP Energies nouvelles (2016) 71, 40
the severe COS specification and a sufficient CO2
slippage with the treated gas to eliminate the need foran AGEU prior to sulfur recovery.Units design and performances are presented in Tables 14
to 17. Significant sizing data and performances of the AGRUfor the 2 options are summarised in Table 15.
Main performance data of the sulfur recovery facilities arepresented in Table 16.
The capital costs of the treatment units for the 2 optionsare given in Table 17.
Table 18 indicates the yearly cost of steam and power, inthe same arbitrary unit as used in Table 17.
These results demonstrate that COSWEETTM offers anattractive solution for deep COS removal when selectiveH2S removal would be desired. It reduces the necessaryamine solution circulation rate and simplifies the sulfurrecovery facilities. CAPEX and OPEX savings of theCOSWEETTM/selective amine integrated scheme comparedto the usual formulated MDEA scheme are quite substantial(more than 7% for the CAPEX and more than 65% for theOPEX). This is due to the high efficiency of the hydrolysiscatalyst at low temperature and the fact that while aminecirculation rate in the AGRU is maintained at a low level,the H2S selectivity is increased without the need of anAGEU. This low temperature catalyst allows a good heatintegration of the COS removal section minimising energyconsumption.
TABLE 15
AGRU - sizing data and performances
Option Base case COSWEETTM
Bulk AG removal section
Solvent flow (% of base) 100 61
ID (mm) 4000 3800
Height (T/T) water wash sectionincluded (mm) 30500 19500
COSWEETTM reactor
ID (mm) - 3700
Polishing section
ID (mm) - 3100
Height (T/T) gas scrubber andwater wash section included (mm) - 19500
Treated gas quality
H2S (ppm vol.) 4 4
CO2 (ppm vol.) < 20 20000
COS (ppm vol.) 1 1
RSH (ppm vol.) 51 82
TABLE 16
Sulfur recovery - sizing data and performances
Option Base case COSWEETTM
AG from AGRU (kmol/h) 2290 1860
H2S content
AG from AGRU (vol.% wetbasis)
46.6 55.5
AG to SRU (vol.% wet basis) 58 47.8
BTX content
AG from AGRU (ppm vol.) 550 300
Solvent flow AGEU/TGTU(% of base) 100 45
Overall sulfur recovery (%) 99.9 99.9
Overall sulfur production (tons/d) 809 809
TABLE 17
CAPEX comparison
Option Base case COSWEETTM
CAPEX (arbitrary unit)
AGRU 137 143
AGEU 69 -
SRU + incinerator 94 103
TGT - 31
Total 300 277
TABLE 18
OPEX comparison
Option Base case COSWEETTM
OPEX (Arbitrary unit)
Steam 13.7 4.1
Power 2.6 1.5
Total 16.3 5.6
Oil & Gas Science and Technology – Rev. IFP Energies nouvelles (2016) 71, 40 Page 19 of 21
CONCLUSION
The COSWEETTM process development is an example ofthe result of teamwork that benefits from the skill set ofIFPEN, combined with an industrial approach integratingindustrial constraints.
After a complete analysis of the gas treatment market, thegas treatment chain, existing processes and new challengesregarding raw acid gas compositions – with increasingamounts of acid gas contents like H2S and CO2 but alsoCOS which contribute to the total sulfided compounds –an important challenge has been identified: what solutioncan be developed for COS removal while keeping a certainamount of CO2 to meet gas pipe specifications?
A complete internal review of existing technical solutionsfor removal of COS, combined with other technical andindustrial constraints such as hydrocarbon solubility, hasbeen performed in order to select the catalytic solution toachieve deep COS specification. The best catalyst has beenselected regarding its performance at low temperatures inorder to optimise the integration in an industrial gas treat-ment chain.
Then different process schemes have been identified andshort-cut models have been developed in order to check thetechnical capability of these different process schemes, tak-ing into account gas compositions and thermodynamic con-straints, but also the economic evaluation of each scheme, inorder to check the economic viability of each solution. Basedon this study, the COSWEETTM scheme has been identified,a reactor model has been developed integrating thermody-namic and kinetic models, and kinetic measurements havebeen performed in order to collect all required data to esti-mate the model parameters.
COSWEETTM is a process developed for the treatment ofnatural gases containing COS. It is based on a combinationof deacidification with any alkanolamine solution and ofCOS hydrolysis on a metal oxide based catalyst.
A characteristic of the COSWEETTM process is that itachieves almost complete COS hydrolysis at moderate tem-perature, making the process more attractive due to substan-tial heat transfer savings from lower heating of the gas tohydrolysis temperature and reduced cooling of the hydroly-sed gas back to amine absorber temperature.
The COSWEETTM process can be combined with anyamine, such as MDEA or formulated MDEA. This allowsremoval of COS down to very low specifications while main-taining some CO2 in the treated gas. When sulfur recovery isassociated with the gas sweetening, using COSWEETTM toconvert COS allows maintenance of a high H2S/CO2 ratioin the acid gas, which is required to optimise the gas treat-ment chain, including SRU. COSWEETTM removes COSin the gas phase, meeting strict COS specification withoutan increase in amine solvent flow rate and reboiler duty.
Evaluations have been performed on CAPEX and OPEXand they show that COSWEETTM allows a reduction inthe investment cost as well as the operating cost when com-pared to a formulated MDEA unit sized to reach the sameCOS specification.
When selectivity is required on a gas treatment,COSWEETTM provides an attractive and efficient solutionas it improves the design of selective amine plant, while stillensuring the quality of the acid gas. Significant savings canbe expected for the high pressure AGRU and also at the SRUsince the SRU feed has an increased H2S content and lowlevels of hydrocarbons contaminants, without needing a ded-icated acid gas enrichment unit.
2 Cadours R., Magné-Drisch J., Normand L., Roquet D., PerduG. (2006) COS removal from natural gases by absorption inalkanolamine solutions, 85th Annual GPA Convention,Grapevine, Texas, Marsh 5-8.
3 Korens N., Simbeck D.R., Wilhelm D.J. (2002) ProcessScreening Analysis of Alternative Gas Treating and SulfurRemoval for Gasification, Prepared for U.S. Department ofEnergy by SFA Pacific, Inc., Revised Final Report.
4 Torabi Angaji M., Ghanbarabadi H., Karimi Zad Gohari F.(2013) Optimizations of Sulfolane concentration in proposeSulfinol-M solvent instead of MDEA solvent in the refineriesof Sarakhs, Journal of Natural Gas Science and Engineering15, 22-26.
5 Sharma M.M. (1965) Kinetics of reactions of carbonyl sul-phide and carbon dioxide with amines and catalysis byBrönsted bases of the hydrolysis of COS, Transactions ofthe Faraday Society 61, 681-688.
6 Svoronos P.D.N., Bruno T.J. (2002) Carbonyl sulfide: AReview of its chemistry and properties, Industrial & Engineer-ing Chemistry Research 41, 5321-5336.
7 Al-Ghawas H.A., Ruiz-Ibanez G., Sandall O.C. (1989)Absorption of carbonyl sulfide in aqueous methyldiethanol-amine, Chemical Engineering Science 44, 3, 631-639.
8 Tong S., Dalla Lana I.G., Chuang K.T. (1993) Kinetic model-ing of the hydrolysis of carbonyl sulfide catalyzed by eithertitania or alumina, The Canadian Journal of Chemical Engi-neering 71, 392-400.
9 Gazarian J. (2009) Gas deacidizing method using an absorbentsolution with COS removal through hydrolysis, Patent appli-cation EP2480315.
10 HSC Chemistry, version 6.1 (2007) Outotec Research.
11 Thiele E.W. (1939) Relation between catalytic activity andsize of particle, Industrial & Engineering Chemistry 31, 7,916-920.
12 Tong S., Dalla Lana I.G., Chuang K.T. (1995) Kinetic model-ing of the hydrolysis of carbon disulfide catalyzed by eithertitania or alumina, The Canadian Journal of Chemical Engi-neering 73, 2, 220-227.
Page 20 of 21 Oil & Gas Science and Technology – Rev. IFP Energies nouvelles (2016) 71, 40
13 Gunn D.J. (1987) Axial and radial dispersion in fixed beds,Chemical Engineering Science 42, 2, 363-373.
14 Yoshida F., Koyanagi T. (1962) Mass transfer and effectiveinterfacial areas in packed columns, AIChE Journal 8, 3,309-316.
15 Fuller E.N., Giddings J.C. (1965) A comparison of methodsfor predicting gaseous diffusion coefficients, J. Chromatogr.Sci. 3, 7, 222-227.
16 Radhakrishnan K., Hindmarsh A.C. (1993) Description anduse of LSODE - the Livermore Solver for Ordinary Differen-tial Equations, NASA Reference Publication 1327, LawrenceLivermore National Laboratory Report UCRL-D-113855.
Manuscript submitted in February 2015
Manuscript accepted in October 2015
Published online in May 2016
Cite this article as: J. Magné-Drisch, J. Gazarian, S. Gonnard, J.-M. Schweitzer, D. Chiche, G. Laborie and G. Perdu (2016).COSWEETTM: A New Process to Reach Very High COS Specification on Natural Gas Treatment Combined with SelectiveH2S Removal, Oil Gas Sci. Technol 71, 40.
Oil & Gas Science and Technology – Rev. IFP Energies nouvelles (2016) 71, 40 Page 21 of 21


![U-substitutions€¦ · An example: Compute d dx [sin(x2)] = cos(x2) 2x Compute Z cos(x2)2xdx. Notice that we are very lucky! The derivative computation above gives us an antiderivative.](https://static.documents.pub/doc/80x56/600ac35c7900716318174035/u-substitutions-an-example-compute-d-dx-sinx2-cosx2-2x-compute-z-cosx22xdx.jpg)


