Council of State Governments Justice Center | 1 Coordinating Council on Juvenile Justice and Delinquency Prevention Michael Thompson, Director June 22, 2015 Closer to Home A Review of Findings
Transcript
Council of State Governments Justice Center | 1
Coordinating Council on Juvenile Justice and Delinquency Prevention
Michael Thompson, Director
June 22, 2015
Closer to HomeA Review of Findings
Council of State Governments Justice Center | 2
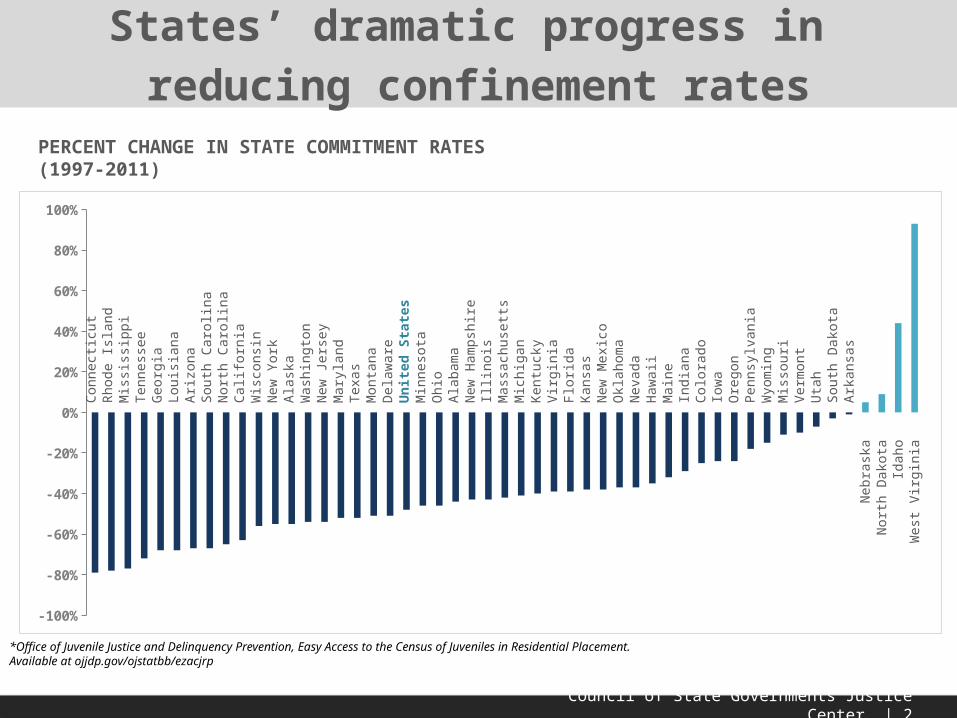
States’ dramatic progress in reducing confinement rates
Estimated Out-of-School Suspensions Nationally
Estimated In-School Suspensions Nationally
-100%
-80%
-60%
-40%
-20%
0%
20%
40%
60%
80%
100%
Conn
ectic
utRh
ode
Isla
ndM
issis
sipp
iTe
nnes
see
Geo
rgia
Loui
sian
aAr
izona
Sout
h Ca
rolin
aN
orth
Car
olin
aCa
lifor
nia
Wis
cons
inN
ew Y
ork
Alas
kaW
ashi
ngto
nN
ew Je
rsey
Mar
ylan
dTe
xas
Mon
tana
Del
awar
eU
nite
d St
ates
Min
neso
taO
hio
Alab
ama
New
Ham
pshi
reIll
inoi
sM
assa
chus
etts
Mic
higa
nKe
ntuc
kyVi
rgin
iaFl
orid
aKa
nsas
New
Mex
ico
Okl
ahom
aN
evad
aH
awai
iM
aine
Indi
ana
Colo
rado
Iow
aO
rego
nPe
nnsy
lvan
iaW
yom
ing
Miss
ouri
Verm
ont
Uta
hSo
uth
Dak
ota
Arka
nsas
Neb
rask
aN
orth
Dak
ota
Idah
oW
est V
irgin
ia
PERCENT CHANGE IN STATE COMMITMENT RATES (1997-2011)
*Office of Juvenile Justice and Delinquency Prevention, Easy Access to the Census of Juveniles in Residential Placement. Available at ojjdp.gov/ojstatbb/ezacjrp
Juvenile arrests in Texas droppedwhile number of youth incarcerated declined
JUVENILE ARREST RATE (PER 100,000 POPULATION) 2000-2012 FOR TEXAS, FLORIDA, AND CALIFORNIA
Source for juvenile population: www.ojjdp.gov, Easy Access to Juvenile Populations: 1990-2013
Council of State Governments Justice Center | 9
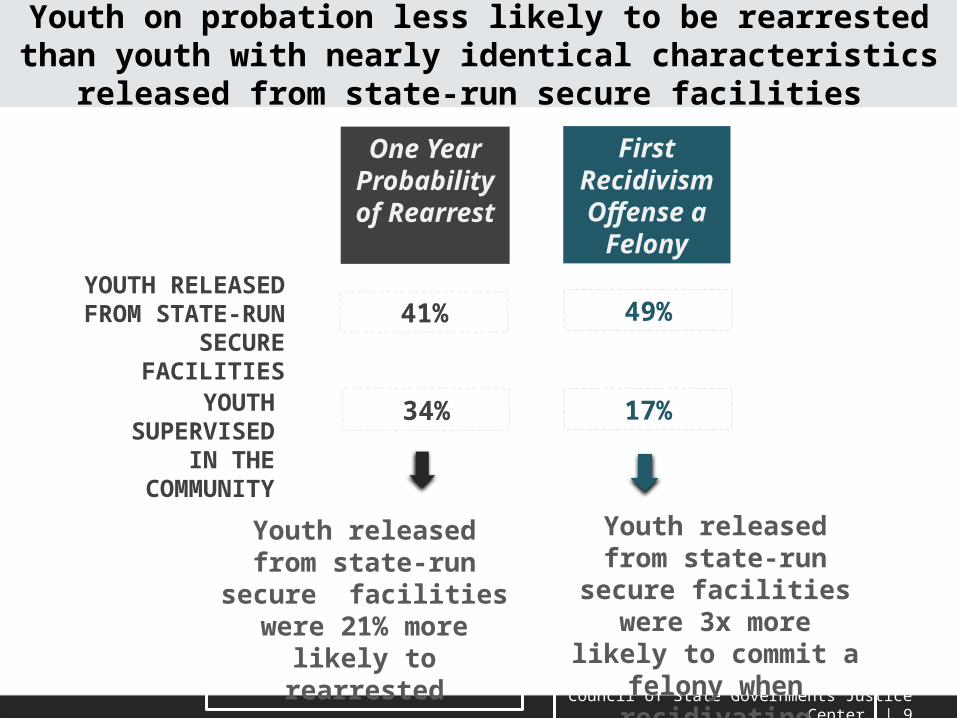
Youth on probation less likely to be rearrested than youth with nearly identical characteristics released from state-run secure facilities
One Year Probability of
Rearrest
First Recidivism Offense a
FelonyYOUTH RELEASED FROM STATE-RUN
SECURE FACILITIES41%
YOUTH SUPERVISED IN
THE COMMUNITY
49%
34% 17%
Youth released from state-run secure facilities were
21% more likely to rearrested
Youth released from state-run secure facilities were
3x more likely to commit a felony when recidivating
Council of State Governments Justice Center | 10
Per capita funding for juvenile probation increased significantly after reforms
FY2005 FY2012 % Change
Per capita expenditures for local juvenile probation departments $3,555 $7,023 98%
Council of State Governments Justice Center | 11
After reforms, rearrest rates did not improve and were comparable for all interventions
PRE-REFORMSTUDY GROUPOne Year Probability of Rearrest
Treatment Program
State Incarceration 41%
Skill-Based Program
Surveillance Program
Secure County Placement
Non-Secure County Placement
No Intervention
29%
28%
31%
33%
35%
33%
POST-REFORMSTUDY GROUPOne Year Probability of Rearrest
41%
27%
30%
29%
34%
35%
32%
Council of State Governments Justice Center | 12
28%32%
40%30%
Expected recidivism rates compared to actual recidivism rates
EXPECTEDREARREST RATE
Victoria
Tarrant 36%
Travis 37%
ACTUALREARREST RATE
46%
44% HIGHER
Harris 37%
Lubbock 33%
39%
33%AS
EXPECTED
El Paso
Cameron 34%Dallas 31%
28%
27% LOWER
Council of State Governments Justice Center | 13
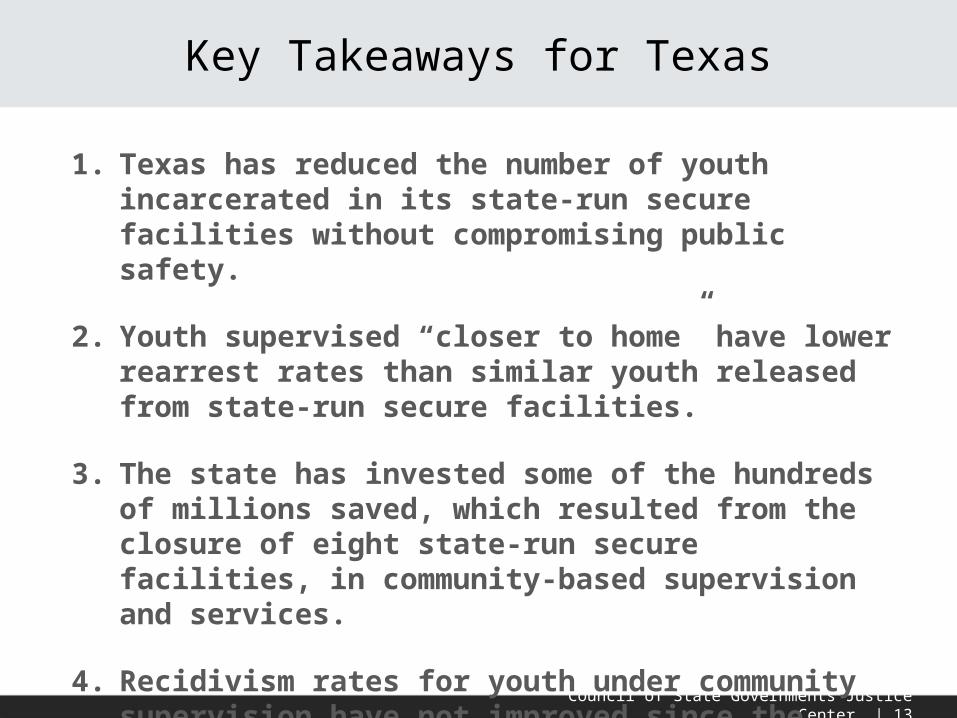
Key Takeaways for Texas
1. Texas has reduced the number of youth incarcerated in its state-run secure facilities without compromising public safety.
2. Youth supervised “closer to home” have lower rearrest rates than similar youth released from state-run secure facilities.
3. The state has invested some of the hundreds of millions saved, which resulted from the closure of eight state-run secure facilities, in community-based supervision and services.
4. Recidivism rates for youth under community supervision have not improved since the reforms. Texas is not realizing the full potential of its investment in community based supervision and services
Council of State Governments Justice Center | 14
Report released Jan. 29, 2015 at TX Supreme Court
Council of State Governments Justice Center | 15
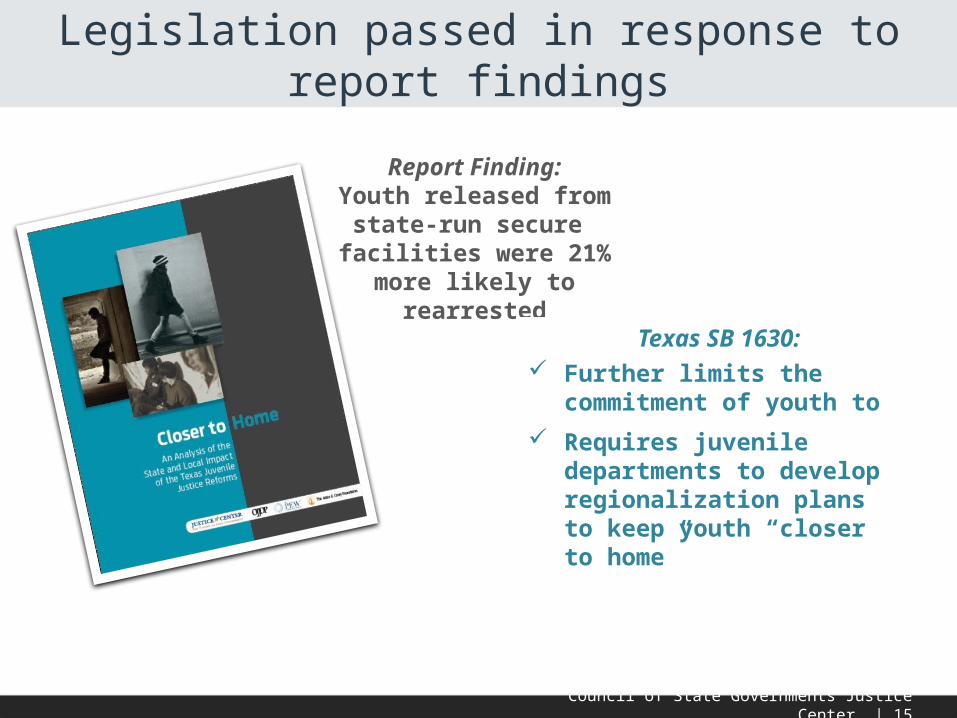
Report Finding:Youth released from state-run
secure facilities were 21% more likely to rearrested
Legislation passed in response to report findings
Texas SB 1630:
Further limits the commitment of youth to state secure facilities
Requires juvenile departments to develop regionalization plans to keep youth “closer to home”
Council of State Governments Justice Center | 16
Report Finding:Gaps in use of best practice
have kept Texas from realizing the full potential of
their investment in community interventions
Legislation passed in response to report findings
Texas SB 1630:
Requires the development of research- based programs for youth in the community and those committed
Establishes performance based goals and ties funding to these goals
Creates a new TJJD division responsible for monitoring program quality and accountability
Council of State Governments Justice Center | 17
DOJ can help states and counties to:
1. Take a hard look at impact of reforms they have enacted
2. Minimize incarceration of youth in state correctional facilities
3. Improve outcomes for youth under community-based supervision
Council of State Governments Justice Center | 18
Thank You
The presentation was developed by members of the Council of State Governments Justice Center staff. The statements made reflect the views of the authors, and should not be considered the official position of the Justice Center, the members of the Council of State
Governments, or the funding agency supporting the work. Citations available for statistics presented in preceding slides available on CSG Justice Center web site.