40
1 Counting Statistics and Error Propagation Nuclear Medicine Physics Lectures 10/4/11 Lawrence MacDonald, PhD [email protected] Imaging Research Laboratory, Radiology Dept.

1 Basics Science: Nuclear Counting Statistics & Error Propagation [email protected]
Counting Statistics and Error Propagation!
Nuclear Medicine Physics Lectures!10/4/11!
!
Lawrence MacDonald, [email protected]!
Imaging Research Laboratory, Radiology Dept. !
2 Basics Science: Nuclear Counting Statistics & Error Propagation [email protected]
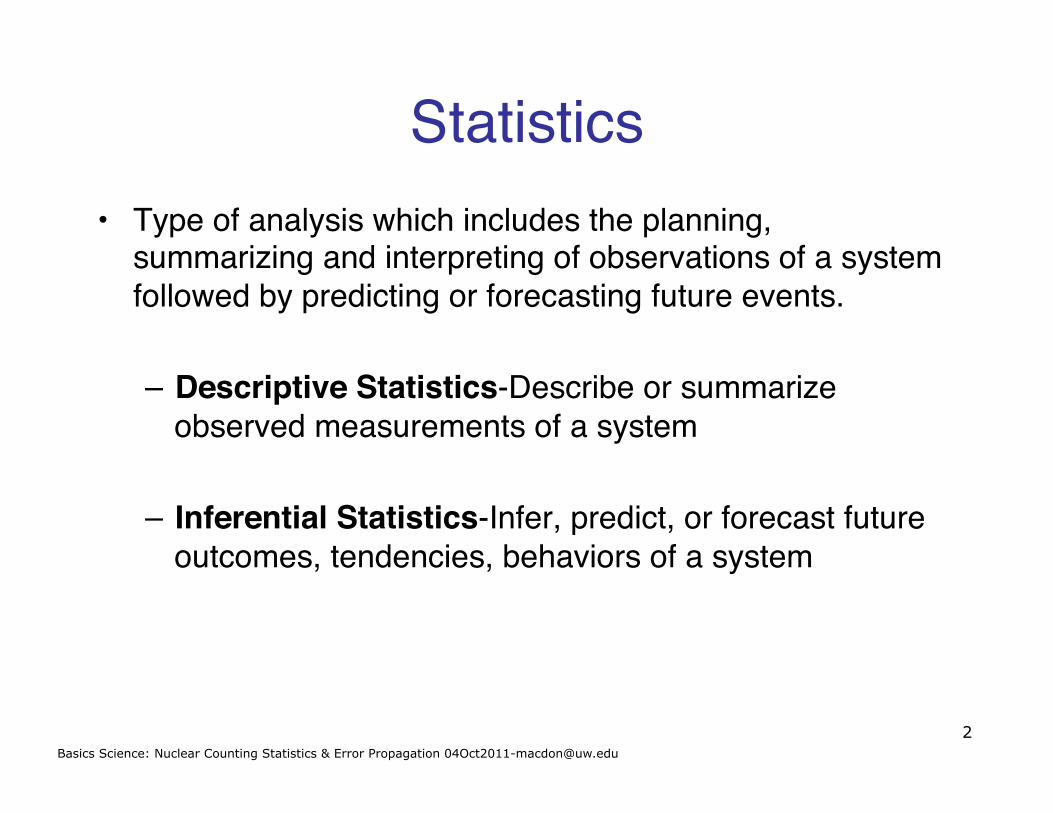
Statistics!• Type of analysis which includes the planning,
summarizing and interpreting of observations of a system followed by predicting or forecasting future events.!
– Descriptive Statistics-Describe or summarize observed measurements of a system !
– Inferential Statistics-Infer, predict, or forecast future outcomes, tendencies, behaviors of a system!

3 Basics Science: Nuclear Counting Statistics & Error Propagation [email protected]
• How much energy will a 1-MeV proton lose in its next collision with an atomic electron?!
• Will a 400-keV photon penetrate a 2-mm lead shield without interacting?!
• How many disintegrations will occur during the next minute with a given radioactive source?!
Repeated measurements result in a spread of values. How certain, then, is a measurement?!!ʻUncertaintiesʼ in scatter, photon penetration, and decay are inherent due to quantum physics that interprets such events as probabilistic.!
Questions Answered by Statistics!

4 Basics Science: Nuclear Counting Statistics & Error Propagation [email protected]
Types of Errors!Systematic Errors!
– uncertainties in the bias of the data, such as an unknown constant offset, instrument mis-calibration!
– implies that all measurements are shifted the same (but unknown) amount from the truth!
– measurements with a low level of systematic error, or bias, have a high accuracy.!
Random Errors!– arise from inherent instrument limitation (e.g. electronic noise)
and/or the inherent nature of the phenomena (e.g. biological variability, counting statistics)!
– each measurement fluctuates independently of previous measurements, i.e. no constant offset or bias!
– measurements with a low level of random error have a high precision.!
5 Basics Science: Nuclear Counting Statistics & Error Propagation [email protected]
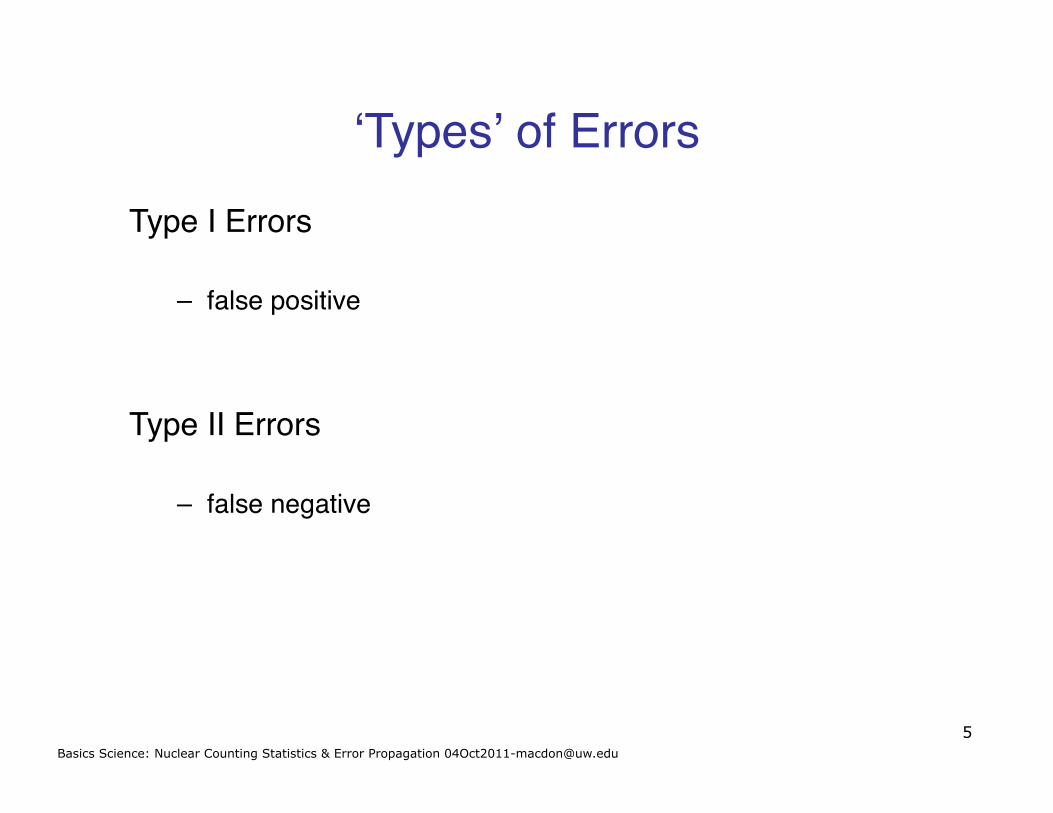
ʻTypesʼ of Errors!Type I Errors!!
– false positive!!!Type II Errors!!
– false negative!

6 Basics Science: Nuclear Counting Statistics & Error Propagation [email protected]
Systematic Errors!
• Systematic errors typically cannot be characterized with statistical methods but rather must be analyzed case-by-case.!
• Measurement standards should be used to avoid systematic errors as much as possible. !– double-check equipment against known values established
by standards.!• If there is a fatal flaw in a study, it is usually from an
overlooked systematic error (i.e. bias).!• Attention to experimental detail is the only defense!!
7 Basics Science: Nuclear Counting Statistics & Error Propagation [email protected]
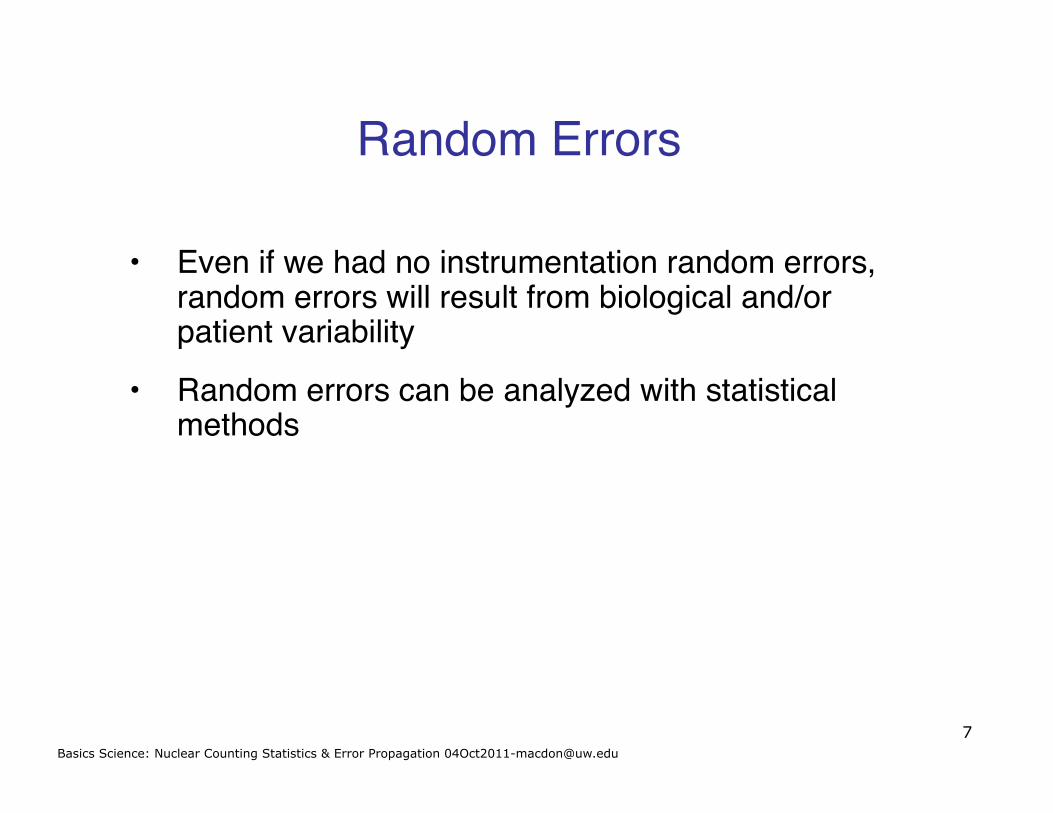
Random Errors!
• Even if we had no instrumentation random errors, random errors will result from biological and/or patient variability!
• Random errors can be analyzed with statistical methods!

8 Basics Science: Nuclear Counting Statistics & Error Propagation [email protected]
Error Examples!
True X
True Y x x x x x
x x x x
x x x
True X
True Y
x x x
x x x x
x x x x
x
True X
True Y
x x x
x x
x x
x
x
x
x x x x
x x x
x x x x
x x x x
x
True X
True Y
x x x
x x x x
x x x x x

9 Basics Science: Nuclear Counting Statistics & Error Propagation [email protected]
Illustration:Hypothetical tracer uptake from a PET scan!
measurements with:!Random Error: High!
Systematic Error: Low!--> Low Precision, High Accuracy!
--> High Noise, Low Bias!
measurements with:!Random Error: Low!
Systematic Error: High!-->High Precision, Low Accuracy!
--> Low Noise, High Bias!
measured!data points!
minutes!
SUV!
minutes!
SUV!
‘true’ uptake!
uptake curve estimated from measured data points!
estimated uptake curve!
bias!

10 Basics Science: Nuclear Counting Statistics & Error Propagation [email protected]
Characterizing Random Phenomena (and Errors)!
Measures of Central Tendency:!• Mode - Most Frequent Measurements (not necessarily unique)!
• Median - Central Value dividing data set into 2 equal parts (unique term)!
• Mean (Arithmetic Mean) !
!
x = 1n
xii=1
n
"

11 Basics Science: Nuclear Counting Statistics & Error Propagation [email protected]
Characterizing Random Phenomena (and Errors)!
Measures of Dispersion:!• Range - Difference of largest and smallest values!
• Variance - Measures dispersion around mean: !
!• Standard Deviation:!
• Standard Error of the mean:!
!
" 2 =1
n #1(xi # x )2
i=1
n
$
!
" = " 2
!
"M =" ( x ) ="
n
12 Basics Science: Nuclear Counting Statistics & Error Propagation [email protected]
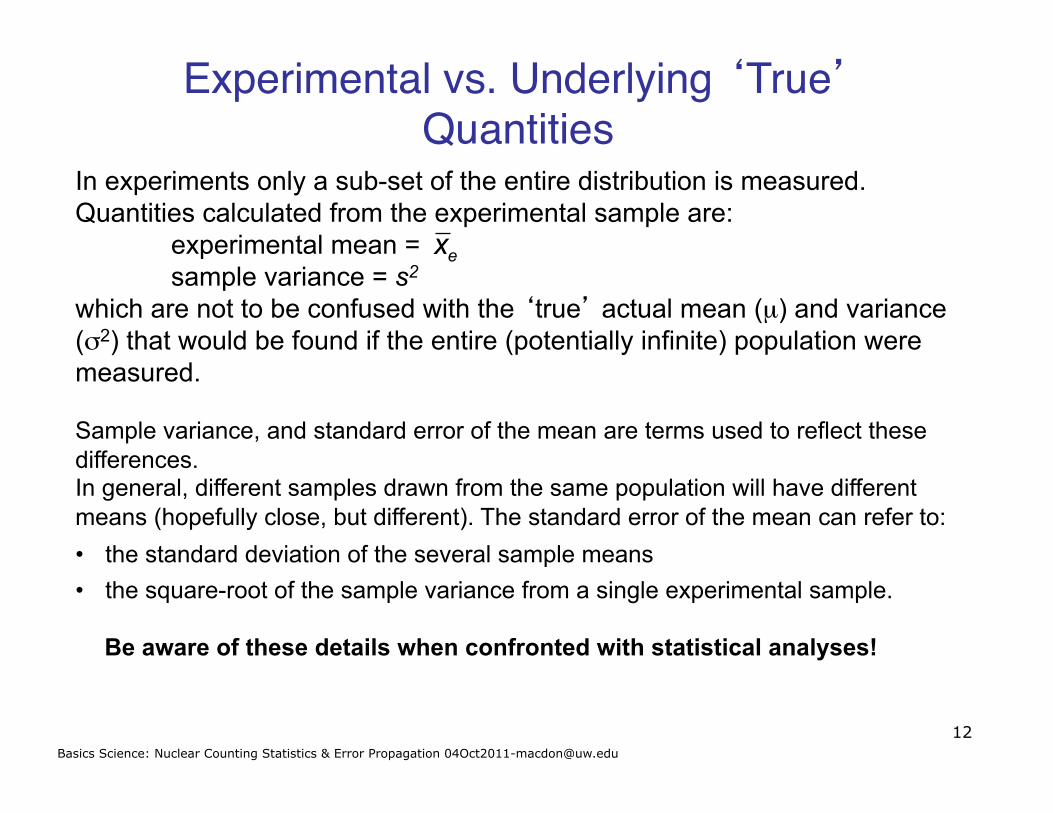
Experimental vs. Underlying ‘True’ Quantities!
In experiments only a sub-set of the entire distribution is measured. Quantities calculated from the experimental sample are:
experimental mean = sample variance = s2
which are not to be confused with the ‘true’ actual mean (µ) and variance (σ2) that would be found if the entire (potentially infinite) population were measured. Sample variance, and standard error of the mean are terms used to reflect these differences. In general, different samples drawn from the same population will have different means (hopefully close, but different). The standard error of the mean can refer to: • the standard deviation of the several sample means • the square-root of the sample variance from a single experimental sample.
Be aware of these details when confronted with statistical analyses!
!
x e

13 Basics Science: Nuclear Counting Statistics & Error Propagation [email protected]
Characterizing Random Errors With a Distribution Statistical Models for Random Trials!1. Binomial Distribution!
Random independent processes with two possible outcomes!
2. Poisson Distribution!Simplification of binomial distribution with certain constraints!
3. Gaussian or Normal Distribution!Further simplification if average number of successes is large (e.g. >20)!

14 Basics Science: Nuclear Counting Statistics & Error Propagation [email protected]
1. Binomial Distribution
!
Pbinomial(r)=n!
r!(n " r)!pr(1" p)n"r
Probability of r successes in n tries when p is probability of success in single trial
Example: What is the probability of rolling a 1 on a six sided die exactly 10 times when the die is rolled for a total of 24 times.
r = 10, n = 24, p = 1/6, Pbinom(r=10) = 0.0025 ~ 1 in 400
Example: What is the probability that a clinical trial will include 100 smokers in a random cohort of 10,000 when the probability a person is a smoker is X%.
r = 100, n = 10,000, p = X%
Independent trials with two possible outcomes
Binomial Density Function:

15 Basics Science: Nuclear Counting Statistics & Error Propagation [email protected]
Binomial process!Trial can have only two outcomes!
• you are free to define a‘successʼ or event of interest!• anything else is a ‘failureʼ!
!N(t) = N0e-λt!
Radioactive decay: != probability that N nuclei remain after time t!Photon penetration: != probability that N photons penetrate thickness t!
16 Basics Science: Nuclear Counting Statistics & Error Propagation [email protected]
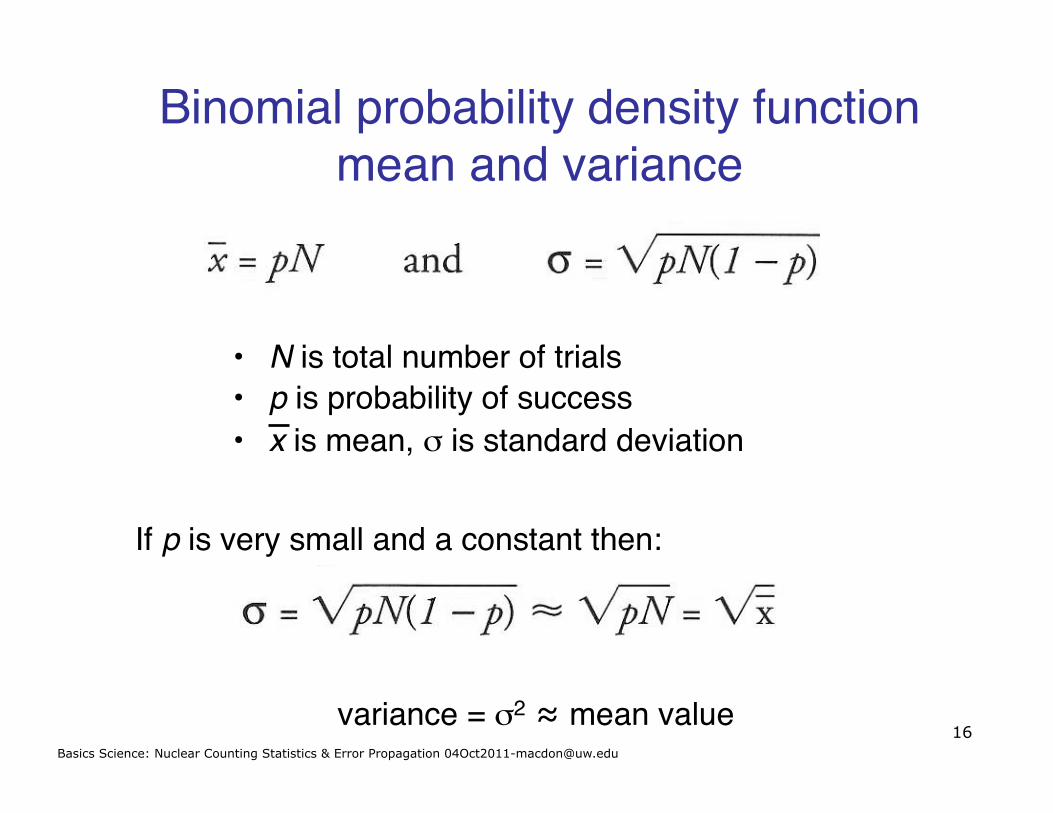
Binomial probability density function mean and variance!
• N is total number of trials!• p is probability of success!• x is mean, σ is standard deviation!
If p is very small and a constant then:!
variance = σ2 ≈ mean value!

17 Basics Science: Nuclear Counting Statistics & Error Propagation [email protected]
2. Poisson Distribution!• Limiting form of binomial distribution as p → 0 and N → ∞!– As in nuclear decay. Have many, many nuclei, probability of
decay and observation of decay very, very small !
!
PPoisson (r)=µr exp("µ)
r!
Only one parameter, µ.
In a Poisson Process
Mean = Variance

18 Basics Science: Nuclear Counting Statistics & Error Propagation [email protected]
Poisson Distribution vs. Binomial!
0.00
0.05
0.10
0.15
0.20
0 5 10 15 20 25 30 35
r
P(r)
Binomial N = 20
Poisson
P(r) = probability of measuring r
when mean µ = 10
Binomial: mean = pN
0
0.05
0.1
0.15
0.2
0 5 10 15 20 25 30 35
r
P(r)
Binomial N = 50
Poisson
0.00
0.05
0.10
0.15
0.20
0 5 10 15 20 25 30 35
r
P(r)
Binomial N = 100
Poisson

19 Basics Science: Nuclear Counting Statistics & Error Propagation [email protected]
!
PPoisson (r)=µr exp("µ)
r!Poisson: only for positive values; µ > 0 Asymmetric!
0
0.05
0.1
0.15
0.2
0.25
0.3
0.35
0.4
0 2 4 6 8 10 12 14 16 18
r
P(r)
µ = 1.0
0
0.1
0.2
0.3
0.4
0.5
0.6
0.7
0 2 4 6 8 10 12 14 16 18
r
P(r) µ = 0.5
0
0.05
0.1
0.15
0.2
0.25
0 2 4 6 8 10 12 14 16 18
r
P(r) µ = 4.0
0
0.02
0.04
0.06
0.08
0.1
0.12
0.14
0 2 4 6 8 10 12 14 16 18
r
P(r)
µ = 10.0
20 Basics Science: Nuclear Counting Statistics & Error Propagation [email protected]
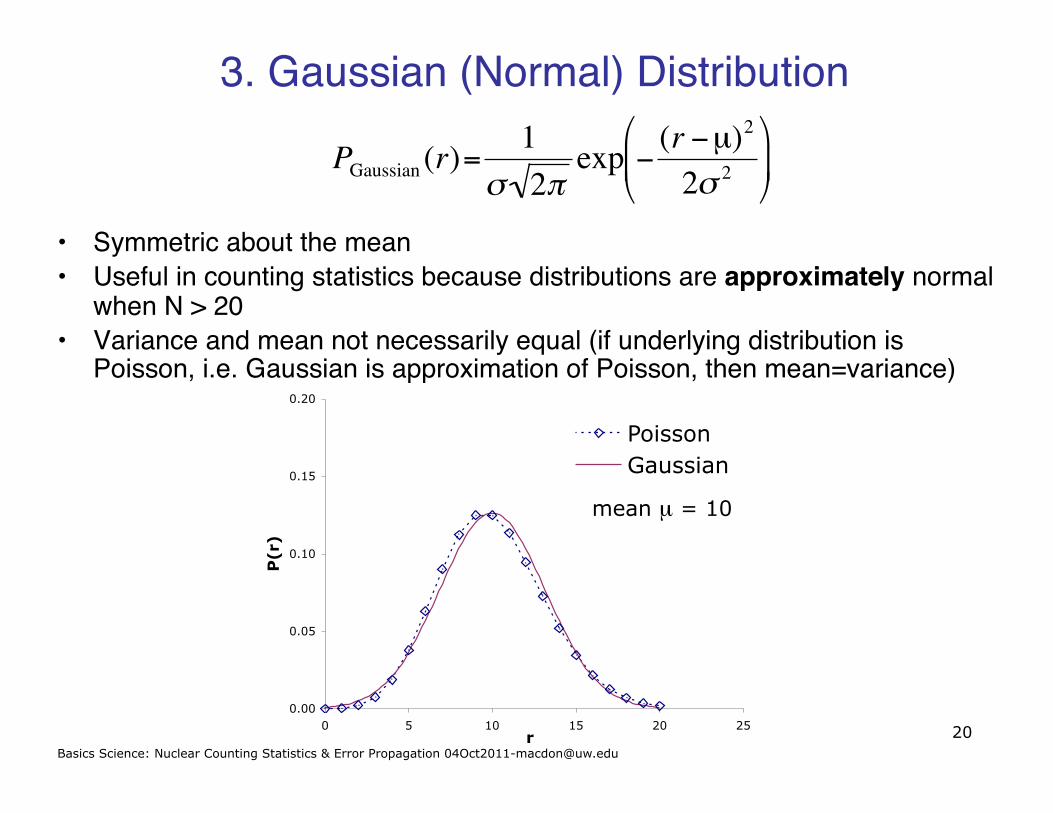
3. Gaussian (Normal) Distribution!
• Symmetric about the mean!• Useful in counting statistics because distributions are approximately normal
when N > 20!• Variance and mean not necessarily equal (if underlying distribution is
Poisson, i.e. Gaussian is approximation of Poisson, then mean=variance)!!
PGaussian (r)=1
" 2#exp $ (r $µ)2
2" 2
%
& '
(
) *
0.00
0.05
0.10
0.15
0.20
0 5 10 15 20 25
r
P(r)
Poisson
Gaussian
mean µ = 10

21 Basics Science: Nuclear Counting Statistics & Error Propagation [email protected]
Gaussian (Normal) Distribution Confidence Intervals!
Interval about measurement! Probability that mean is within interval (%)!
± 0.674σ! 50.0!± 1.0σ 68.3!
±1.64σ 90.0!± 1.96σ 95.0!± 2.58σ 99.0!± 3.0σ 99.7!
22 Basics Science: Nuclear Counting Statistics & Error Propagation [email protected]
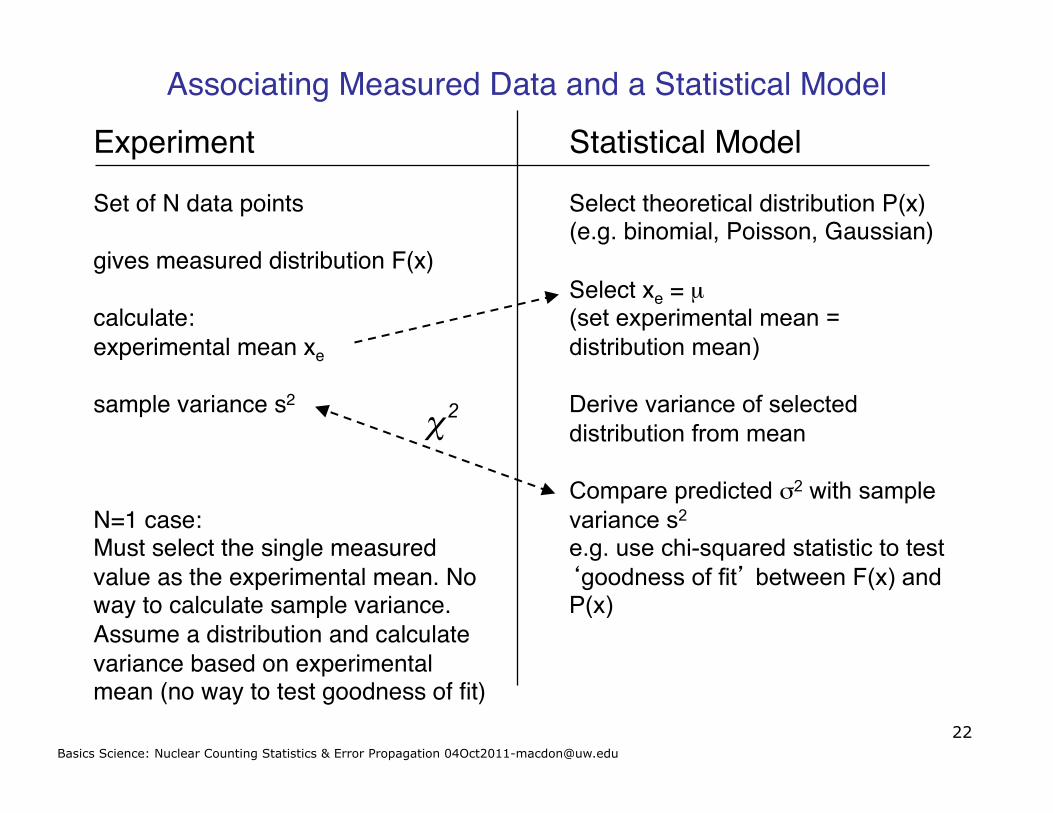
Experiment!!Set of N data points!!gives measured distribution F(x)!!calculate:!experimental mean xe!!sample variance s2!!!!N=1 case:!Must select the single measured value as the experimental mean. No way to calculate sample variance. Assume a distribution and calculate variance based on experimental mean (no way to test goodness of fit)!!
Statistical Model!!Select theoretical distribution P(x)!(e.g. binomial, Poisson, Gaussian)!!Select xe = µ (set experimental mean = distribution mean) Derive variance of selected distribution from mean Compare predicted σ2 with sample variance s2 e.g. use chi-squared statistic to test ‘goodness of fit’ between F(x) and P(x)!!
Associating Measured Data and a Statistical Model!
!
"2
23 Basics Science: Nuclear Counting Statistics & Error Propagation [email protected]
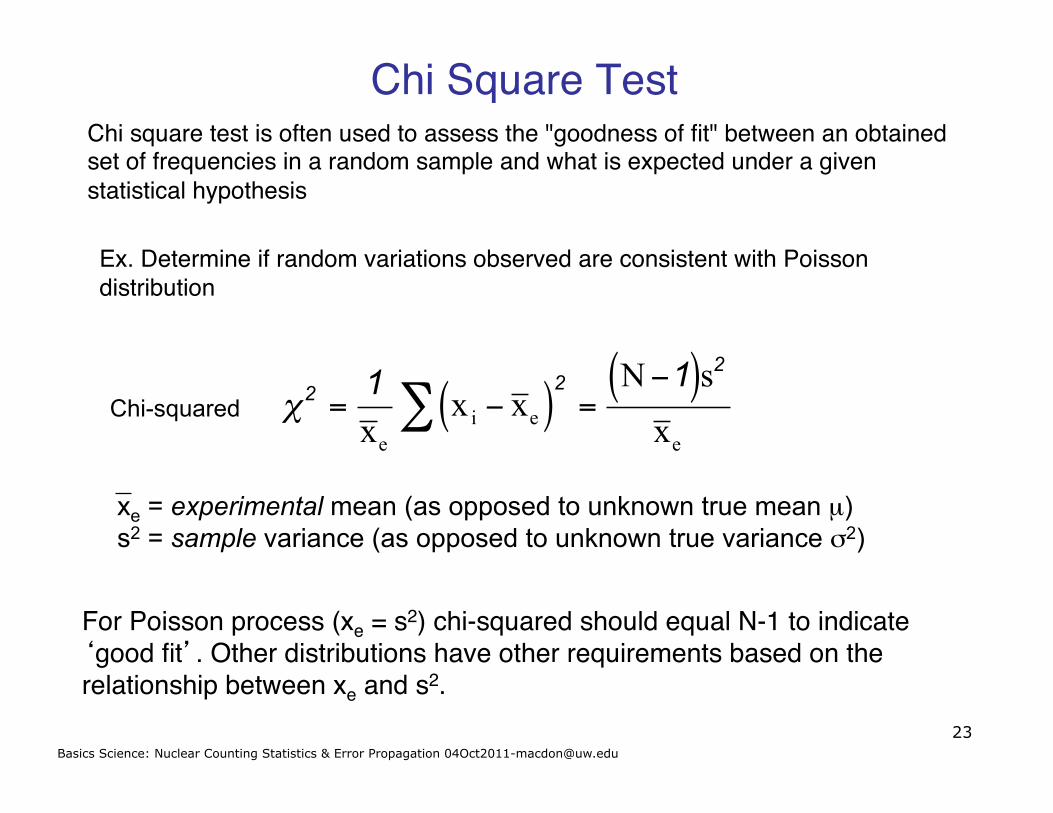
Chi Square Test!Chi square test is often used to assess the "goodness of fit" between an obtained set of frequencies in a random sample and what is expected under a given statistical hypothesis!!Ex. Determine if random variations observed are consistent with Poisson distribution!
!
"2 =1x e
xi # x e( )$2
=N#1( )s2
x eChi-squared
xe = experimental mean (as opposed to unknown true mean µ) s2 = sample variance (as opposed to unknown true variance σ2)
For Poisson process (xe = s2) chi-squared should equal N-1 to indicate ‘good fit’. Other distributions have other requirements based on the relationship between xe and s2. !
24 Basics Science: Nuclear Counting Statistics & Error Propagation [email protected]
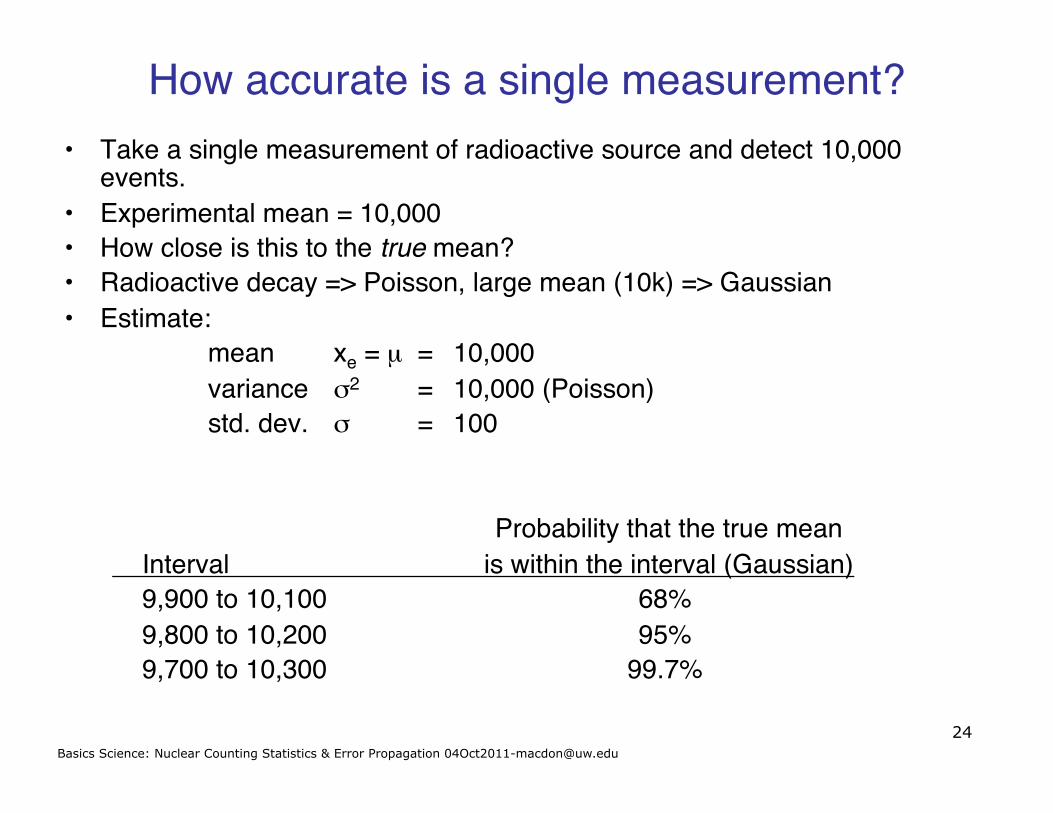
How accurate is a single measurement?!• Take a single measurement of radioactive source and detect 10,000
events.!• Experimental mean = 10,000!• How close is this to the true mean?!• Radioactive decay => Poisson, large mean (10k) => Gaussian!• Estimate: !! !mean !xe = µ = !10,000!! !variance !σ2 != !10,000 (Poisson)!! !std. dev. !σ != !100!!!! ! ! ! ! !Probability that the true mean!!Interval ! ! ! !is within the interval (Gaussian)!!9,900 to 10,100! ! ! !68% !!9,800 to 10,200! ! ! !95% !!9,700 to 10,300! ! ! !99.7% !!!

25 Basics Science: Nuclear Counting Statistics & Error Propagation [email protected]
A sample, counted for 10 min, registers 530 gross counts. A 30-min background reading gives 1500 counts.!(a) Does the sample have activity?!(b) Without changing the counting times, what minimum number of gross counts can be used as a decision level such that the risk of making a type-I error is no greater than 0.050?!
Example!
Solution posted on course web site
26 Basics Science: Nuclear Counting Statistics & Error Propagation [email protected]
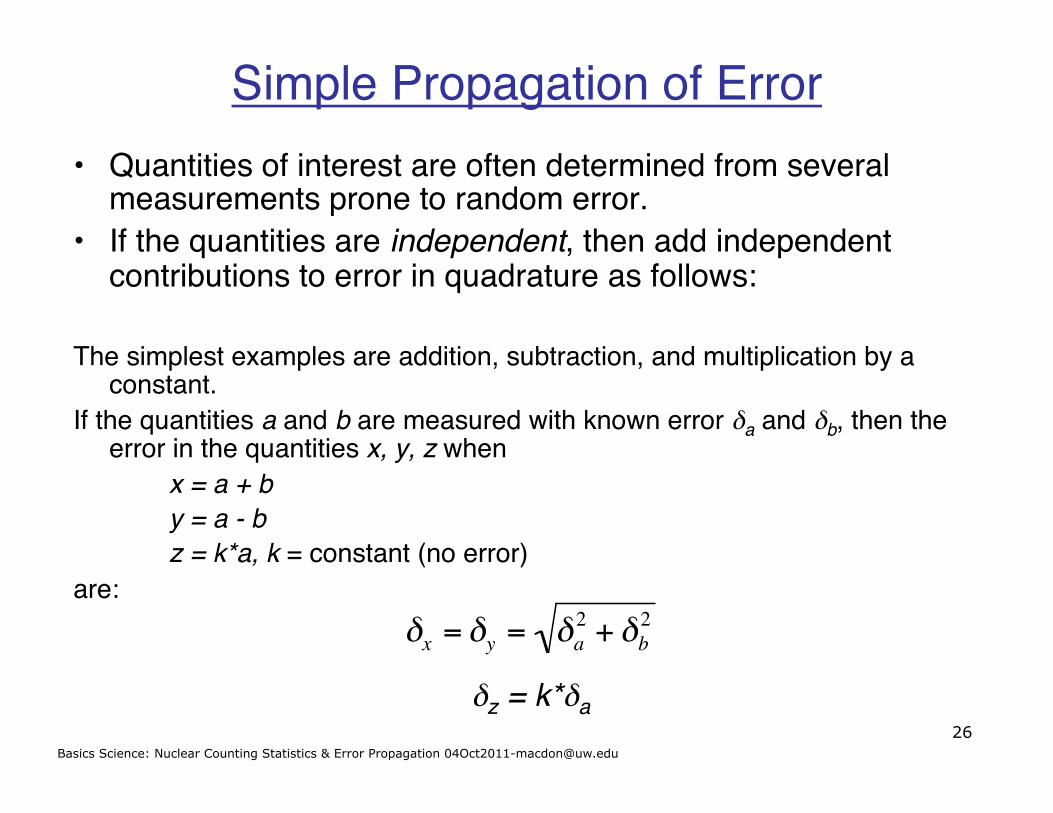
• Quantities of interest are often determined from several measurements prone to random error.!
• If the quantities are independent, then add independent contributions to error in quadrature as follows:!
!The simplest examples are addition, subtraction, and multiplication by a
constant.!If the quantities a and b are measured with known error δa and δb, then the
error in the quantities x, y, z when!! !x = a + b!! !y = a - b!! !z = k*a, k = constant (no error)!
are:!!!
Simple Propagation of Error!
!
"x = "y = "a2 + "b
2
δz = k*δa!

27 Basics Science: Nuclear Counting Statistics & Error Propagation [email protected]
General Propagation of Error!Still assuming the individual measurements (a,b,c,…) are independent of each other; and the desired quantity x is a function of a,b,c,…:!
x = x(a,b,c,…)!The contribution of measurement a to the error in x, δxa is given by:!
!
"xa =#x#a"a
!
"x = "xa2 + "xb
2 + "xc2 + ...
contributions add in quadrature:!

28 Basics Science: Nuclear Counting Statistics & Error Propagation [email protected]
Same for b. Note absolute value of partial derivative!---> cumulative error will be ≥ individual errors.!
!
"x = "xa2 + "xb
2 = "a2 + "b
2
!
x(a,b) = a ± b
General Propagation of Error!
!
"x"a
=1, "x"b
=1
!
"xa =#x#a"a = "a
Example 1: Addition & subtraction!
29 Basics Science: Nuclear Counting Statistics & Error Propagation [email protected]
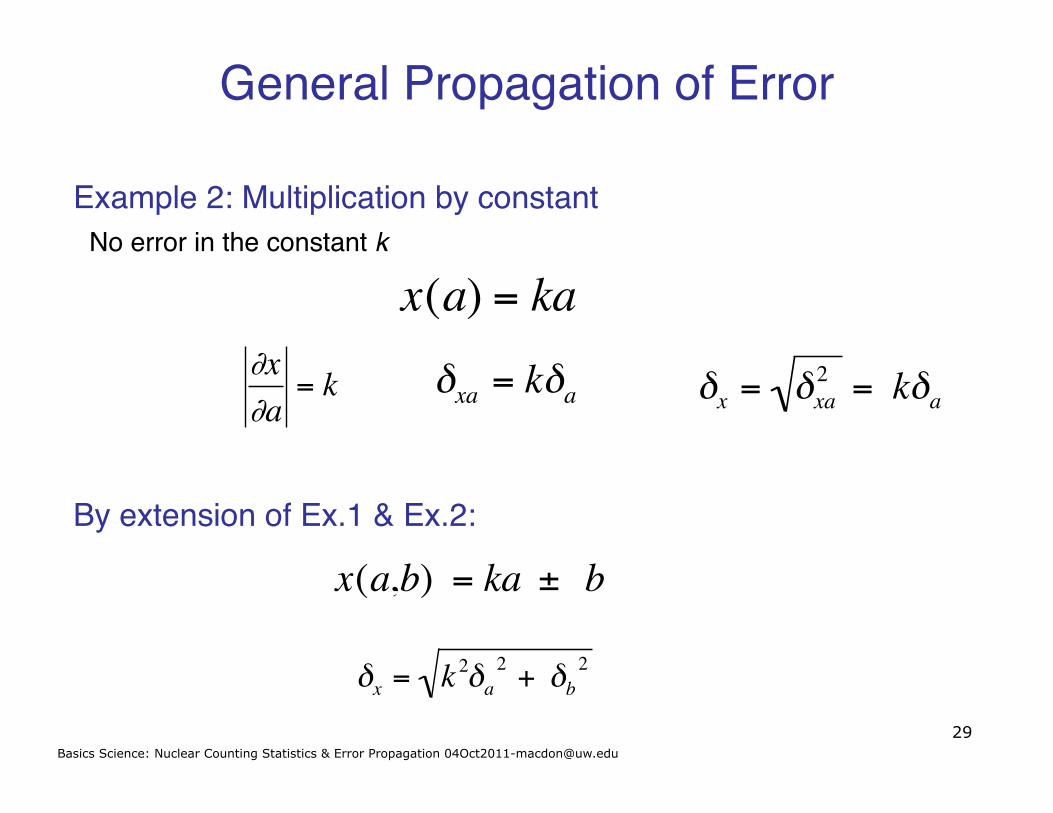
No error in the constant k!
!
x(a) = ka
!
"xa = k"a
Example 2: Multiplication by constant!
!
"x"a
= k
!
"x = "xa2 = k"a
By extension of Ex.1 & Ex.2:!
!
x(a,b) = ka ± b
!
"x = k 2"a2 + "b
2
General Propagation of Error!

30 Basics Science: Nuclear Counting Statistics & Error Propagation [email protected]
!
x(a,b) = a*b
!
"xa =#x#a"a = b"a
!
"x = "xa2 + "xb
2 = b2"a2 + a 2"b
2
!
"x =1b#
$ % &
' (
2
"a2 + a
b2
#
$ %
&
' (
2
"b2
General Propagation of Error!Example 3: Multiplication of error-prone variables:!
!
x(a,b) = a /bExample 4: Division of error-prone variables:!
!
"xb =#x#b"b =
ab2"b
!
"xa =#x#a"a =
1b"a

31 Basics Science: Nuclear Counting Statistics & Error Propagation [email protected]
Simple Examples!
• A radioactive source is found to have a count rate of 5 counts/second. What is probability of observing no counts in a period of 2 seconds? Five counts in 2 seconds?!– Mean count rate: 5 cnts/sec. --> 10 cnts/2 sec.!– mean = µ, observed cnts = r:!
!
PPoisson (r = 0)= (µ =10)r= 0 exp("(µ =10))(r = 0)!
= 4.54 *10"5
!
PPoisson (r = 5)= (10)5 exp("10)(5)!
= 0.038

32 Basics Science: Nuclear Counting Statistics & Error Propagation [email protected]
(Some Inferential Statistics)The Maximum Likelihood Estimator!
Suppose we have a set of N measurements (x1,…, xN) from a theoretical distribution f(x|θ), where θ is the parameter to be estimated (e.g. x1 is observed/detected counts from pixel θ ).!We first calculate the likelihood function,!!!which can be seen as the probability of measuring the sequence of values (x1,…, xN) for a value θ.!Maximum likelihood estimator is the value of θ that provides the maximum value for L(x|θ) !
!
L(x |") = f (x1,|") f (x2,|")… f (xN ,|")
E.g. ML Estimate of mean of a Gaussian distribution is just mean of measurements

33 Basics Science: Nuclear Counting Statistics & Error Propagation [email protected]
Summary: Counting Statistics & Error Propagation!• Types of Error!
– systematic error; eg bias in experiment, error with fixed tendency, cannot be treated with statistics, can be corrected for if known (calibration) -- effects accuracy !
– random error; inherent to instruments and/or nature of measurement (eg biological variability), cannot be ‘corrected’ but can be minimized with large samples/trials, treated with statistical approaches -- effects precision!
• Statistical Descriptions of Random Error!– probability distribution functions!
• Binomial; probability of observing certain outcome in N attempts when probability of single outcome is p.!
• Poisson (limiting case of binomial: p small, N large); mean = variance = (standard deviation)2, asymmetric, positive means only!
• Gaussian (Normal); widely used, symmetric, approximates Poisson for large means, mean and SD can be independent!
• Propagation of Error - errors from independent sources add in ‘quadrature’;!
error in f(x, y) due to errors in x (δx) and y (δy) is δf2 = |∂f/∂x|2δx
2 + |∂f/∂y|2δy2!
simplest case: f = ax ± by, then error in f: δf2 = (aδx)2 + (bδy)2 (a, b = const.)!
34 Basics Science: Nuclear Counting Statistics & Error Propagation [email protected]
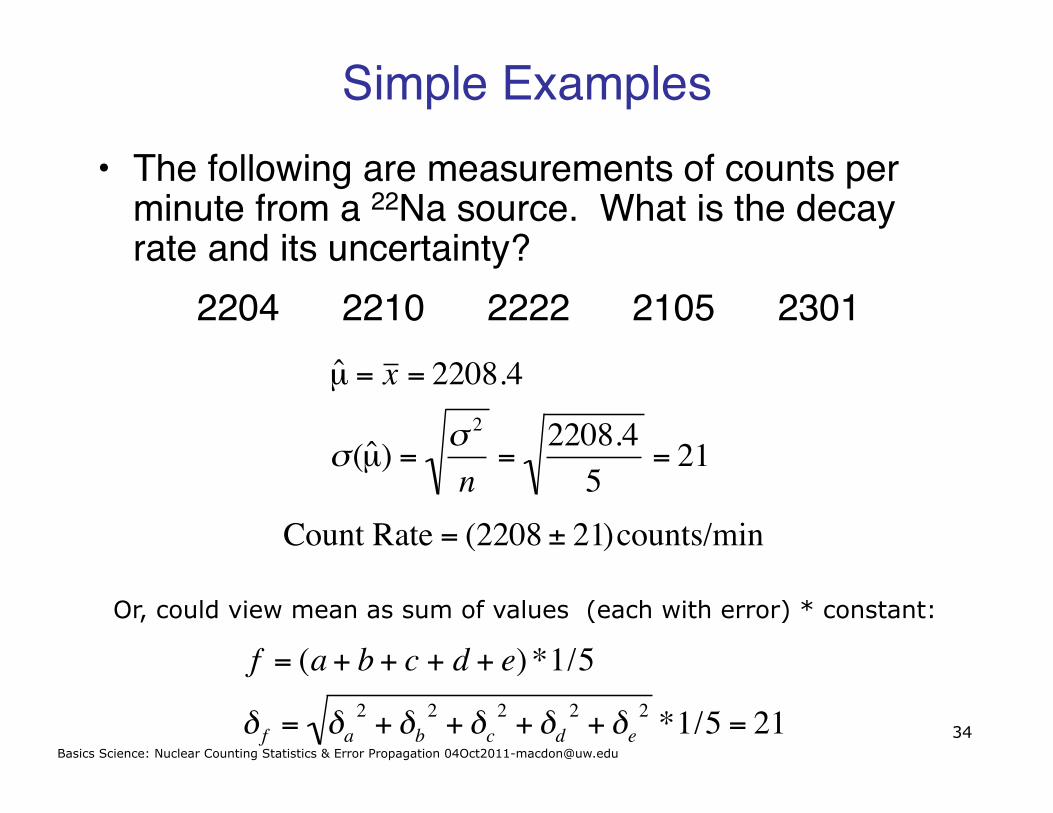
Simple Examples!• The following are measurements of counts per
minute from a 22Na source. What is the decay rate and its uncertainty?!
2204! 2210! 2222! 2105! 2301!
!
ˆ µ = x = 2208.4
"( ˆ µ ) =" 2
n=
2208.45
= 21
!
Count Rate = (2208 ± 21)counts/min
Or, could view mean as sum of values (each with error) * constant:
!
f = (a + b + c + d + e) *1/5
" f = "a2 + "b
2 + "c2 + "d
2 + "e2 *1/5 = 21

35 Basics Science: Nuclear Counting Statistics & Error Propagation [email protected]
Raphex Question!D70. How many counts must be collected in an instrument with zero background to obtain an error limit of 1% with a confidence interval of 95%? A. 1000 B. 3162 C. 10,000 D. 40,000 E. 100,000
CI = 95% --> measure within 2σ!!% Error = (error/measure) ≤ 1%;!!N > (2 / 1%)2 = (200)2!N > 40,000!
!
2"N
=2N#1%
!
(" = N )

36 Basics Science: Nuclear Counting Statistics & Error Propagation [email protected]
Raphex Answer!
D70. How many counts must be collected in an instrument with zero background to obtain an error limit of 1% with a confidence interval of 95%? D. A 95% confidence interval means the counts must fall within two standard
deviations (SD) of the mean (N). Error limit = 1% = 2 SD/N, but SD = N1/2. Thus 0.01 = 2(N1/2)/N = 2/ N1/2. Where [0.01]2 = 4/N and N = 40,000.

37 Basics Science: Nuclear Counting Statistics & Error Propagation [email protected]
Raphex question!G74. A radioactive sample is counted for 1 minute and produces 900 counts. The background is counted for 10 minutes and produces 100 counts. The net count rate and net standard deviation are about ____ and ____ counts. A. 800, 28 B. 800, 30 C. 890, 28 D. 890, 30 E. 899, 30
Measured value is best guess of the mean, std. dev. equals sqrt(mean):!N = measured counts, R = count rates (counts per min.)!!Gross counts Ng = 900 ± (900)1/2 --> 1 minute --> Rg = 900±30 cpm Background Nb = 100 ± (100)1/2 --> 10 min. --> Rb = 10±1 cpm!!Net count rate = gross rate - background rate: Rn = Rg - Rb!Rn = 900 cpm - 10 cpm = 890 cpm!
!
" n = " g2 +" b
2 = 302 +12 # 30

38 Basics Science: Nuclear Counting Statistics & Error Propagation [email protected]
Raphex answer!G74. A radioactive sample is counted for 1 minute and produces 900 c ounts. The background is cou nted for 10 minutes and p roduces 100 c ounts. The net count rate and net standard deviation are about ____ and ____ counts/min. D . The net count rate is: [ ( Ns/ts) - (Nb/tb)] = [(900/1) - (100/10)] = 890. The net standard deviation, is: [ (Ns/t2
s) + (Nb/t2b)] 1/2 = [(900) + (1)] = 30.
39 Basics Science: Nuclear Counting Statistics & Error Propagation [email protected]
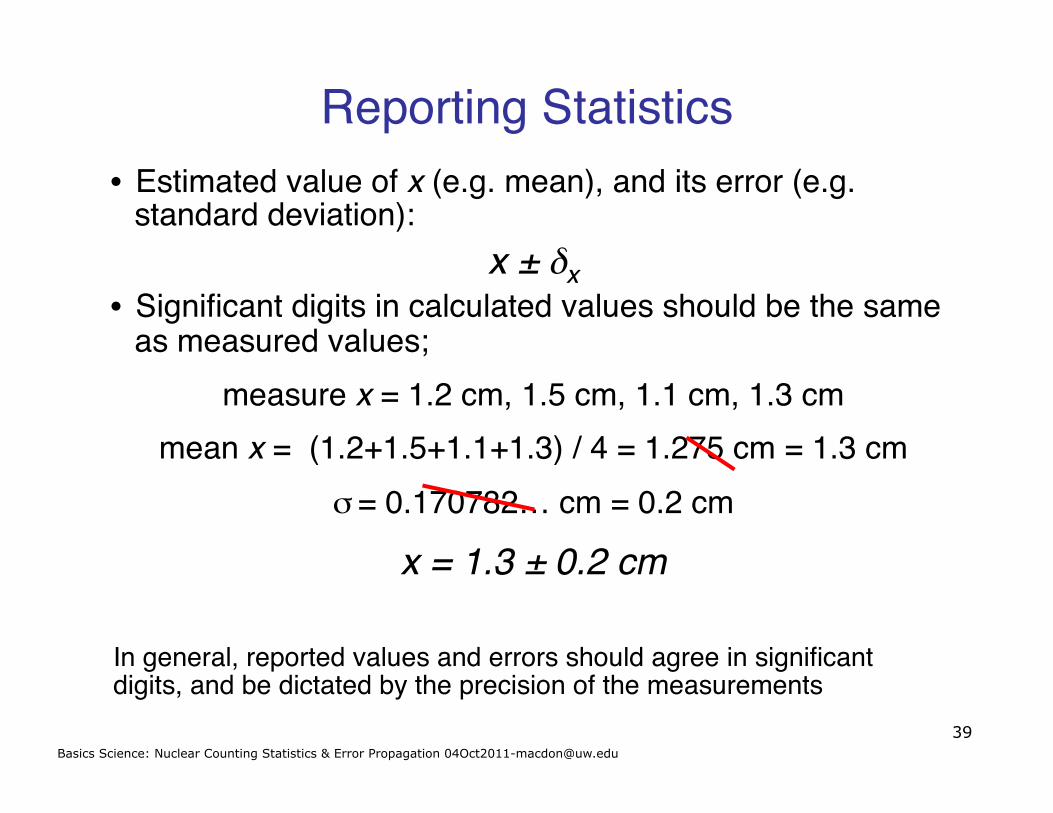
Reporting Statistics!• Estimated value of x (e.g. mean), and its error (e.g.
standard deviation):!x ± δx!
• Significant digits in calculated values should be the same as measured values;!
measure x = 1.2 cm, 1.5 cm, 1.1 cm, 1.3 cm!mean x = (1.2+1.5+1.1+1.3) / 4 = 1.275 cm = 1.3 cm!
σ = 0.170782… cm = 0.2 cm!
x = 1.3 ± 0.2 cm!
In general, reported values and errors should agree in significant digits, and be dictated by the precision of the measurements!

40 Basics Science: Nuclear Counting Statistics & Error Propagation [email protected]
Simple Example!• Following 4 numbers are maximum CT values (in HU) of the
same tumor measured in the same individual !250.1 255.6 223 224.1
What is the best estimate of the max CT value of this tumor?
Mean ± standard error of the mean
238.2 ± 8.5 HU
mean= 238.2000variance= 291.4067
standard deviation= 17.0706standard error of the mean = 8.5353
median= 237.1000
3 Scenarios:
1. Measured on 4 different scans from 4 different days at exactly same location?
2. Measured on same image volume by 4 individuals?
3. Measured on 4 different scans from same day at exactly same location?


