Country Cultural Effects on Deviant Workplace Behavior: Poland and France Perspective Kristianstad University College International Business and Economics Program Bachelor Dissertation FE 6080 Fall 2008 Tutors: Elin Smith Bengt Goransson Authors: Egle Bazaraite Oto Coubaneichvili
Transcript
Country Cultural Effects on Deviant Workplace Behavior:
Poland and France Perspective
Kristianstad University College International Business and Economics Program Bachelor Dissertation FE 6080 Fall 2008 Tutors: Elin Smith
Bengt Goransson Authors: Egle Bazaraite
Oto Coubaneichvili
2
Abstract Deviant workplace behavior has become an important problem of today’s businesses as it has both financial impacts and social and psychological effects on the organization. Therefore, it is a very important, but not very common research area. There is no research done on the nature of workplace deviance in terms of country culture; thus, it is interesting to explore country culture effects on deviant workplace behavior. The main purpose of this study is to investigate how country culture influences deviant workplace behavior. Firstly, we developed the link between the cultural diversity and deviant workplace behavior theories referring to the literature review and then we established the hypotheses which were tested in the survey of business students from different countries. This investigation led to the conclusions and solutions of the research problem. The research revealed that cultural similarities can explain deviant workplace behavior. Our study was limited to two countries, Poland and France, which represent two different blocks of Europe, Eastern and Western. These countries were chosen because they are economically and historically different, thus, they are linked with different prejudices about deviant behavior tendencies. However, culturally they are very similar. This research has identified the patterns of deviance in these countries and has contradicted the prejudice about the deviance inclinations in Western (France) and Eastern (Poland) Europe. As this study focused on two countries, future research findings should be verified with studies on other countries. This research will have both a theoretical and practical value. The theoretical value was created by connecting two research areas: deviant workplace behavior and cultural diversity theories. The practical value can be explained by a growing number of multinational enterprises and increasing internationalization of business environment. Thus, knowledge about possible trickery and its patterns in different cultures has increasing demand and value for companies in the global community. Key words: Deviant workplace behavior, typology of workplace deviance, cultural diversity, cultural diversity dimensions
3
Foreword
With this research we complete our Bachelor degree at Kristianstad University
College. During our studies in this establishment we gained a lot of experience
and knowledge in the International Business field.
Our main goal of writing this research was to acquire new knowledge and
improve on a personal and professional level. Writing this thesis was very fruitful
for us as it developed our organizational and critical thinking skills.
First of all, we would like to say special thanks to our families who always
supported, motivated and remained patient with us even during critical moments.
We are very grateful to our tutors, Elin Smith for her constructive remarks and
Bengt Göransson for the creative freedom. We would also like to thank Annika
Fjelkner for support and positive thinking, and, of course, for all, small and big,
language mistakes noticed which thanks to her escaped from our work. We are
also grateful for other tutors and teachers who developed our general
understanding about writing thesis.
We would also like to thank our friends (and not only) Poles and the French who
sacrificed some of their time to answer our questionnaire. Without their help we
could never implement this research.
Oto Coubaneichvili Egle Bazaraite
4
List of abbreviations p. page
etc. et cetera
et al. et alii
MAS Masculinity-Femininity Index
IDV Individualism-Collectivism Index
PDI Power Distance Index
UAI Uncertainty Avoidance Index
LTO Long and Short Term Orientation Index
List of tables
Table 1.1 Summary of limitations......................................................................... 12 Table 3.1 Factors and their relationship to workplace deviance........................... 33 Table 3.2 Explanation of scores and ranks according to dimensions’ index ........ 36 Table 3.3 Country cultural differences and similarities between France and Poland............................................................................................................................... 45 Table 3.4 Summary ............................................................................................... 60 Table 4.1 Main characteristics of the sample........................................................ 60 Table 4.2 Composition of the questionnaire ......................................................... 79 Table 5.1 Summary of question 7 analysis ........................................................... 92 Table 5.2 Summary of question 8 analysis ........................................................... 95 Table 5.3 Summary of data analysis results........................................................ 106 Table 5.4 Summary of hypotheses evaluation .................................................... 115
List of figures
Figure 1.1 The structure of the work..................................................................... 14 Figure 3.1 Structure of Hypotheses Developement .............................................. 20 Figure 3.2 Typology of deviant workplace behavior ............................................ 24 Figure 3.3 Results for Poland and France ............................................................. 37 Figure 3.4 Education in France and Poland .......................................................... 50 Figure 3.5 Employment rates by age group .......................................................... 51 Figure 5.1 Structure of the analysis ...................................................................... 86 Figure 5.2 Results of question 6............................................................................ 87 Figure 5.3 Results of question 7............................................................................ 89 Figure 5.4 Results of question 8............................................................................ 92 Figure 5.5 Results of question 9............................................................................ 95 Figure 5.6 Results of question 10.......................................................................... 97 Figure 5.7 Results of question 11.......................................................................... 99 Figure 5.8 Results of question 12........................................................................ 101 Figure 5.9 Results of question 13........................................................................ 102 Figure 5.10 Results of question 14...................................................................... 104
2.1 TYPE OF STUDY.....................................................................................................................15 2.2 RESEARCH PHILOSOPHY........................................................................................................16 2.3 RESEARCH APPROACH...........................................................................................................17 2.4 CHOICE OF DESIGN................................................................................................................17
3.1. INTRODUCTION TO DEVIANT WORKPLACE BEHAVIOR...........................................................20 3.1.1 Definition and concept..................................................................................................20 3.1.2 Classification and dimensions ......................................................................................23 3.1.3 Reasons and factors......................................................................................................25
3.2 COUNTRY’S CULTURAL DIFFERENCES AND SIMILARITIES BETWEEN EASTERN (POLAND) AND
WESTERN (FRANCE) EUROPE......................................................................................................34 3.2.1 Hofstede’s 5 dimensions: Poland and France perspective ...........................................35 3.2.2 Explanation of scores and ranks according to dimensions’ index................................35 3.2.3 Power distance .............................................................................................................36 3.2.4 Individualism and Collectivism ....................................................................................38 3.2.5 Masculinity and Femininity ..........................................................................................39 3.2.6 Avoidance of uncertainty ..............................................................................................41 3.2.7 Uncertainty avoidance effects on anxiety and happiness .............................................43 3.2.8 Long and short term orientation...................................................................................43 3.2.9 Summary .......................................................................................................................44
3.3 CROSS-ANALYSIS OF CULTURAL DIMENSIONS AND DEVIANT WORK PLACE BEHAVIOR
4.6.1 Types of questions.........................................................................................................77 4.6.2 Data types.....................................................................................................................78
4.7 RESPONSE RATE.....................................................................................................................79 4.8 DATA ANALYSIS ....................................................................................................................80 4.9 CREDIBILITY OF RESEARCH FINDINGS....................................................................................81
5.1 INTRODUCTION TO ANALYSIS................................................................................................85 5.2 DATA ANALYSIS ....................................................................................................................87
6.1 SUMMARY OF THE RESEARCH..............................................................................................118 6.2 ANSWERS TO RESEARCH QUESTIONS...................................................................................119 6.3 FINDINGS OF THE RESEARCH................................................................................................122 6.4 SUGGESTIONS......................................................................................................................123 6.5 THEORETICAL VALUE ..........................................................................................................125 6.6 PRACTICAL IMPLICATIONS...................................................................................................125 6.7 CRITICAL REFLECTIONS.......................................................................................................126 6.8 FURTHER RESEARCH............................................................................................................127 6.9 FINAL THOUGHTS ................................................................................................................127
APPENDIX 1: QUESTIONNAIRE ABOUT THE DEVIANCE ....... .....................................133
APPENDIX 2: RESEARCH ABOUT THE PREJUDICE OF DEVIANC E..........................136
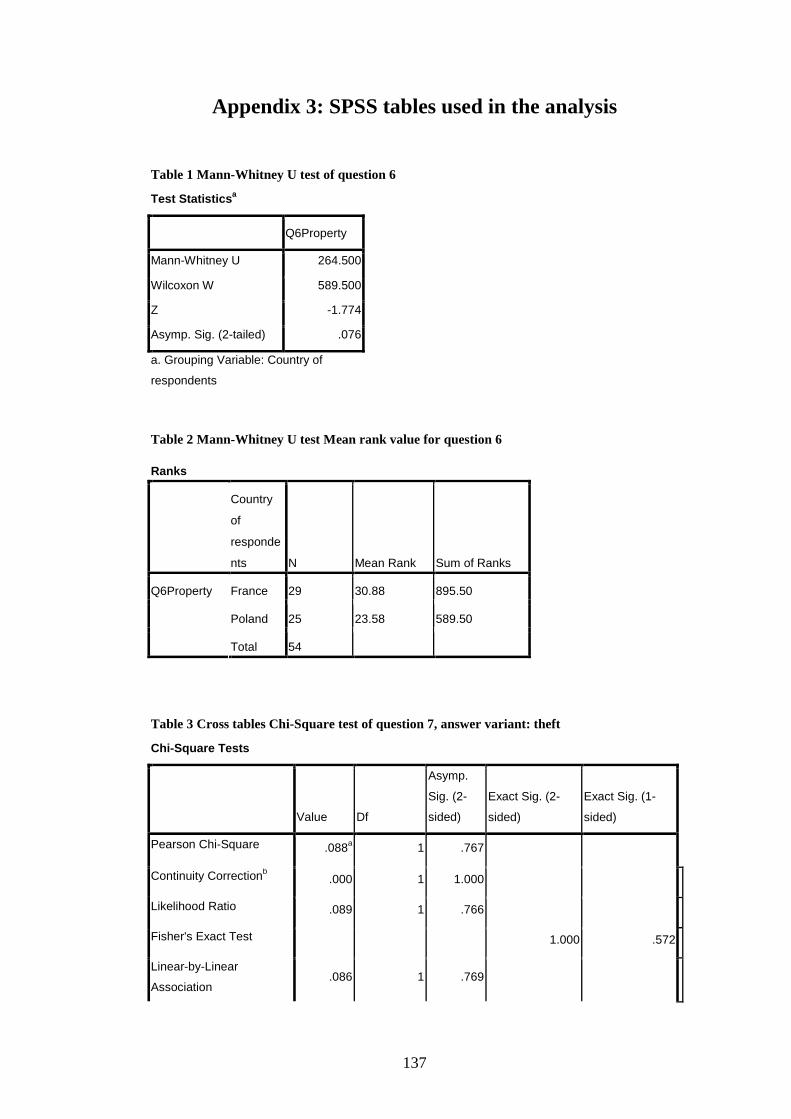
APPENDIX 3: SPSS TABLES USED IN THE ANALYSIS....................................................137
7
1. Introduction
It is an exordial chapter in which the background, problem, purpose of the
research are introduced. In addition, research questions and objectives are also
presented to give an overview of the work structure and key issues. In order to
define the focus area, limitations are discussed. Finally, the chapter ends with the
outline of the research.
1.1 Background
Deviant behavior remains underestimated risk and the consequences of workplace
deviance has both financial impacts and social and psychological effects on the
organization and its employees. Therefore, it is a serious problem of today’s
businesses. In fact, employees’ deviance causes 30% of all business failures
(Bolin and Heatherly, 2001) and according to Perrier (2007), from 2005 to 2007,
43% of organizations experienced internal or external fraud. However, the costs of
deviant behavior to businesses are difficult to estimate because not all parts of this
behavior are discovered, not all uncovered parts are reported, and civil or criminal
action is not always pursued. Thus, in the light of the cost and characteristics of
offenders, it is important to investigate the roots of deviance at the workplace and
develop strategies to detect the source of this behavior (Dungun, 2005). The
understanding of the origins of deviant behavior would improve prevention
methods and consequently reduce the costs related to deviance at workplace.
Therefore, we think that it is very substantial and interesting topic.
The causes for deviant behavior are, like human behavior, complex. And the key
here is that it is human behavior: deviant workplace behavior committed by
people, independent from processes and policies (Smart et al., 2007). According
to Linton (1998, p.36), “personality is an individual embodiment of culture and it
can explain an individual’s behavior”; thus, we expected that national culture
could influence deviant behavior. In addition, the reason of choosing culture as
8
deviant behavior predictor is that by revealing most common deviance forms in
different cultures we could assure trust in certain countries business environment.
We presume that different prejudices about deviant behavior in certain cultures
exist. There is a common belief in the business environment about corruption in
the former Soviet countries or property embezzlement in Western Europe. Thus, it
is interesting to focus on two different blocks of Europe, Eastern and Western,
which are represented by two countries in our case, Poland and France. These
countries were chosen because they are economically and historically quite
different; however, referring to Hofstede (2005) and Kolman et al. (2003),
culturally they are quite similar. We have done a preliminary survey in which we
asked respondents to answer which country is more tended to deviance: France,
Poland or they are equally predisposed to deviance. Half of respondents answered
that Poland is more tended to deviance and one third that they are equally
deviated. This small survey shows that prejudices about Eastern and Western
European countries still exist and perceptions about workplace deviance are
usually connected to economical and historical, but not cultural factors. Thus,
comparing Eastern and Western European countries we wanted to amplify
significance of cultural similarity effect on deviant behavior. As a consequence,
we will see if Eastern/Western European cultural similarities shape deviant
behavior.
Hence, we have chosen deviant workplace behavior theme because it is really
important problem in business environment and new insights of this conundrum
might help to reduce the extent of deviant workplace behavior. Moreover, as it is
also a very compulsive topic due to the existing prejudices about different
countries’ tendencies to deviant workplace, it seemed challenging and interesting
for us to conduct this study.
1.2 Problem
Even though deviant workplace behavior is a serious problem for business
owners, it is very sparse study field. Nevertheless, there were some studies which
9
attempted to predict which employees are more likely to exhibit deviant behavior
by exploring possible deviant behavior indicators. Several researchers have tried
to explain workplace deviance by personal traits (Appelbaum et al., 2007; Bolin
and Heatherly, 2001; Robinson and Bennett, 2000) or organizational culture
aspects (Robinson and O’Leary, 1998; Liao et al., 2004; Robinson and Bennett,
2000; Kulik et al., 2008; Peterson, 2002; Sims, 1992; Baucus and Near, 1991;
Trevino and Brown, 2005; Henle, 2005; Osgood et al., 1996; Thau et al., 2008);
however, there is no research done on the nature of deviant behavior in terms of
country culture, neither on organizational nor on individual level, even though the
need of this information has an increasing demand due to growing
internationalization of business environment. Therefore, in our research we aim to
investigate how country culture can affect the patterns of workplace deviance.
1.3 Purpose
In order to clarify and understand the problem described above, the purpose of
this study is to investigate how country culture influences deviant workplace
behavior. To be more precise, how Eastern (Poland) and Western (France)
European cultures could explain tendencies in deviant workplace behavior. After
the research has been completed, the relationship between deviant workplace
behavior and cultural dimensions will be displayed.
1.4 Research questions and objectives
To implement the project we must firstly identify the objectives which can help to
resolve the final problem. The main research question is how the country culture
of the employee affects the patterns of deviant behavior. In order to solve the
main research problem, more limited questions must be answered:
Question 1:
What are the attributes of deviant workplace behavior?
Objective 1:
10
To introduce the definitions and define dimensions, reasons and factors of deviant
workplace behavior.
Question 2:
What are the cultural differences and similarities between Poland and France?
Objective 2:
To define the cultural differences and similarities following cultural diversity
theories.
Question 3:
How French and Polish cultural similarities could explain deviant workplace
behavior referring to literature?
Objective 3:
To establish the link between the cultural diversity and deviant workplace
behavior theories.
Question 4:
How does country culture influence deviant workplace behavior in practice?
Objective 4:
To identify if and how country culture affect deviant workplace behavior referring
to empirical research. To verify the research assumptions and establish bases for
further research.
1.5 Contribution
This research will have both a theoretical and practical value. Theoretical value
will be created by connecting two research areas: deviant workplace behavior in
business and cultural diversity theories. The practical value can be explained by
increasing number of multinational enterprises and growing level of
internationalization. Thus, knowledge about possible trickery and its patterns in
different cultures has increasing demand and value.
11
1.6 Limitations
Due to the multidimensional character of deviant workplace behavior and the
variety of cultural diversity theories, it is necessary to identify the limitations of
the research. Since our research combined two research areas (deviant workplace
behavior and cultural diversity), limitations are also discussed from deviance and
cultural diversity perspectives.
To begin with, as there are two types of workplace deviance (negative and
positive)1 this paper is limited to the research about negative aspects of deviant
workplace behavior since the impacts of negative deviance are much more crucial
to business. We also mainly focused on the individual-level approach of deviance.
In order to avoid the influence of organization on deviant behavior, we explored
individuals’ (students’) behavior which is not affected by organizational factors.
This led to the results of country cultural effects on workplace deviance.
Cultural diversity theories were another key issue of the research. Due to the
growing diversity of ethnic groups in most countries, it is hard to identify what
culture is in terms of a specific country and nation. Therefore, country cultures
were in focus, not cultures in absolute sense as one country might contain many
cultures formed by ethnic groups. Thus, in our research we focus on a culture of a
precise nation and we limited the research to “pure” nationals eliminating the
influence of ethnic groups and their cultures. This study is limited to two country
cultures, Poland and France. These countries have been chosen because they are
linked with different prejudices in terms of deviant workplace behavior and they
represent two distinctive geographical areas with very different historical and
economic backgrounds (former Eastern and Western blocks). However, culturally
they are quite similar. Thus, focus on cultural resemblance could challenge the
prejudice and provide more interesting and unexpected results. In addition, in this
study we provided comparative, not absolute, results about tendencies of deviance
in Poland and France. It means that assumptions are based on the comparison of
these two country cultures, not cultures in general.
1 Negative and positive concepts of deviance will be discussed more in the part 3.1.
12
The summary of limitations is recapitulated in Table 1.1.
Table 1.1 Summary of limitations
Deviant workplace behavior perspective
Cultural diversity perspective
• Negative workplace deviance • Individual-level approach of
deviance
• Culture of a specific nation is in focus, not culture in general
• Research is limited to two countries: Poland and France
• Emphasis on cultural similarities • Comparative, not absolute, results
in terms of cultures
1.7 Outline
Chapter 1: Introduction
It is an exordial chapter of our research which introduces the background,
problem and purpose of the research. In addition, structure and key issues are
identified by deducing research questions and objectives. Furthermore, this
chapter proceeds with discussion about research limitations which define the
focus area. Finally, an overview of the work framework (which is also illustrated
in Figure 1.1) is presented in the outline of the research.
Chapter 2: Method
This part of our study deals with the methodology used for conducting the
research which is discussed referring to Saunders et al. (2007, p.132) proposed
research “onion”. The method is identified via the description and motivation of
type of study, research philosophy, approach and choice of method used in our
study.
Chapter 3: Theoretical framework
This section provides a theoretical base for our research. This chapter consists of
three main parts which include the presentation of deviant workplace behavior
attributes, an overview of cultural diversity theories which define similarities and
differences between Poland and France and compilation of common workplace
13
deviance and cultural diversity theories. The chapter ends with the discussion
about hypothesis development.
Chapter 4: Empirical method
In this chapter the method for the empirical research is explained. The alternatives
of collecting data and motivation of choice are discussed referring to the problem
and aim of our research. This chapter includes the research strategy and the data
collection method as well as the population and sample description. It continues
with the operationalization, questionnaire composition, response rate, credibility
and presentation of critique. The chapter ends with a summary of empirical
method used in the research.
Chapter 5: Analysis
This chapter presents the outcome of empirical research. It is composed of survey
data (quantitative) analysis followed by the evaluation of hypotheses. The chapter
ends with the summary of results and critical reflections.
Chapter 6: Conclusions
In this chapter final conclusions are presented. The final part of our study begins
with a summary of the findings and presentation of answers to the research
questions. Subsequently, recommendations how to solve the problem and
procedural drawbacks are disputed. The chapter ends up with the discussion about
practical implications and suggestions for further research.
14
The framework of the work is illustrated in Figure 1.1
Figure 1.1 The structure of the work
Introduction
Method
Deviant Behavior Cultural Diversity
Synthesis:
Deviant Behavior + Cultural Diversity
Empirical Research
Findings
15
2. Method In this chapter the method of the research is discussed referring to Saunders et
al.’s (2007, p.132) proposed research “onion”. The method is identified via the
description of type of study, research philosophy, as well as research approach,
strategy and choice of method.
2.1 Type of study
Type of study depends on the main research question. According to Saunders et
al. (2007, p.133), “the classification of research purpose most often used in
research methods literature is threefold one of explanatory, exploratory and
descriptive.”
“Studies that establish causal relationships between variables may be termed
explanatory studies. The emphasis here is on understanding a situation or a
problem in order to explain the relationship between variables” (Saunders et al.
(2007, p.134). This type of study is usually used to explain already identified and
confirmed relationship between variables; however, in our research we are trying
to find out if there is a connection between workplace deviance and cultural
dimensions. Consequently, this type of study is not suitable for our research.
An exploratory study is a valuable mean of finding out what is happening; to
seek new insights; to ask questions and to assess phenomena in a new light. It is
particularly useful clarifying the understanding of the problem. This type of
research has been chosen, as the main purpose of this paper is not to describe or to
explain why, but to explore how countries’ culture can be reflected in workplace
deviance. As workplace deviance has never been explored “in light” of country
culture, this type of research is the most suitable.
The objective of descriptive research is to portray an accurate profile of persons,
events or situations. This might be a forerunner to the other types of research
16
(Saunders et al., 2007). As it is significant to have a clear view about deviant
behavior and cultural diversity theories as a base for our research, descriptive
research will also be employed (in parts 3.1 and 3.2 of the theoretical framework)
as a forerunner for this exploratory study.
2.2 Research philosophy
According to Saunders et al. (2007, p.101), research philosophy “relates to the
development of knowledge and the nature of that knowledge” and depends on the
“particular view of the relationship between knowledge and the process by which it is
developed”. There are three prevalent philosophies: realism, positivism or
interpretivism. They are different, if not mutually exclusive, views about the way in
which knowledge is developed and judged as being acceptable (Saunders et al.,
2007).
The existence of a reality, independent of human thoughts and beliefs is the basic
idea of realism. Objects have an existence independent from human mind. It
assumes a scientific approach to the development of knowledge and underpins
collection and understanding of data (Saunders et al., 2007). This philosophy is
quite similar to positivism. Characteristic for the positivistic research philosophy
is that the researcher is more concerned with facts rather than impressions. The
research is undertaken in a value-free way. An important factor is that the
researcher is independent and not able to influence or be influenced by the subject
of the research. The results are law-like generalizations (Saunders et al., 2007).
The interpretivistic philosophy is characterized by the understanding of
processes. Referring to this approach, it is necessary to understand differences
between humans in our role as social actors and researcher has to adopt
empathetic stance (Saunders et al., 2007).
Saunders et al. (2007, p.116) claim that “business and management research is
often a mixture of between interpretivist and positivist.” Our research could also
be defined as “between interpretivist and positivist”, because to connect two
research areas in Chapter 3.3 we needed to interpret different deviant workplace
17
behavior and cultural diversity theories (hence we referred to interpretivistic
philosophy) and only then we could derive hypotheses for quantitative research in
which we reflected positivistic philosophy. Therefore, the empirical research
reflects value-free manner of collecting data and independence from the research
subject. However, as workplace deviance is a multidimensional and
miscellaneous topic, interpretivistic assumptions could not be avoided. According
to Saunders (2007), interpretivistic philosophy is highly appropriate in
organizational behavior and human resource management fields, as it is in this
case. Deviant workplace behavior is a very sensitive issue requiring tact and
caution because responds are not willing to reveal this part of their personality;
thus, we could not ask direct questions. As a consequence, we had to adopt
empathetic stance (which is interpretivist feature) while developing hypotheses,
building questionnaire and explaining results. However, our study also contains
numerical data. Therefore, a positivistic attitude was still be maintained. To
conclude, in this research both approaches are used in a complementary manner.
2.3 Research approach
The research design project depends on the extent to which the author is clear
about the theory at the beginning of the research. According to Saunders et al.
(2007), there are two main approaches: inductive and deductive. In a deductive
approach, the researcher develops theory and hypotheses and design approach to
test the hypotheses. In an inductive approach, the researcher first collects data
and then develops theory as a result of the data analysis. In this research we refer
to a deductive approach as we have firstly reviewed the literature and then
formulated testable hypotheses.
2.4 Choice of design
The research design or method is “the way in which research combines
quantitative and qualitative techniques and procedures” (Saunders et al., 2007,
p.145). There are two main types of research methods, mono method where only
18
one data collection technique and analysis procedures is used to answer research
question and multiple methods where more than one data collection technique
and analysis procedures are used to answer research question. In our study we
have applied mono method research design. It means that we have combined
single quantitative data collection technique (questionnaire) with quantitative data
analysis procedures (graphs and statistics). The choice of data collection
technique and analysis procedures is discussed in Chapter 5.
19
3. Theoretical framework
This chapter consists of four main parts. Firstly, attributes of deviant workplace
behavior are discussed. Then an overview of cultural diversity theories which
identify similarities and differences between Poland and France are presented.
The outcome of these parts is used for developing common workplace deviance
and cultural diversity theories which are evolved in cross-disciplinary analysis.
The outcome of the theoretical framework forms the hypotheses in the end of this
chapter.
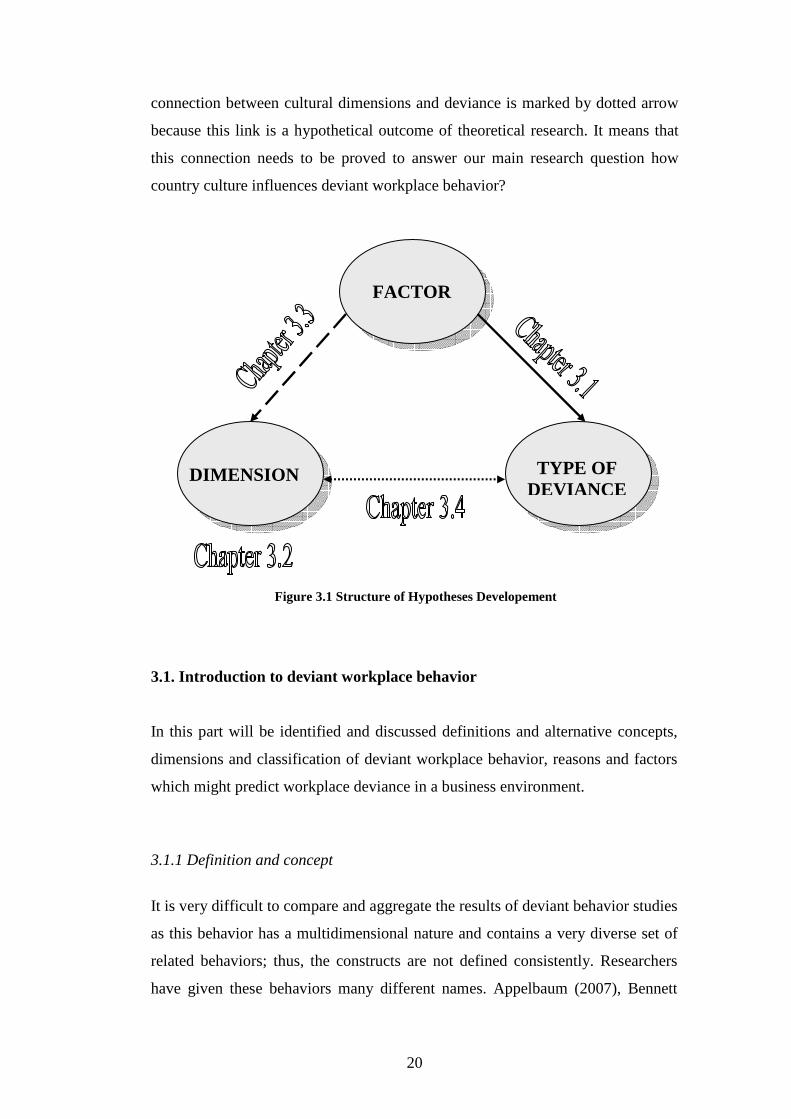
Theoretical background of this dissertation deals with two research areas, deviant
workplace behavior and cultural diversity. The main concern of this research is
connection between these two study fields. The process of developing this
connection is illustrated in figure below. In order to develop the linkage between
workplace deviance and cultural dimensions and verify the hypotheses, we had to
look at the roots (factors) of negative workplace behavior. Thus, first of all in
Chapter 3.1 we identified what deviant workplace behavior is and its types; then
we looked at the existing theories about factors which underline the conditions
under which workplace deviance occurs. As these theories are already proved by
researchers, additional research about these theories will not be provided. Thus,
the connection between factors and types of deviance presented in Figure 3.1 is
marked by full arrow. Secondly, in Chapter 3.2 we have identified cultural
differences and similarities between France and Poland referring to Hofstede’s
Five Dimensions Model. Thirdly, we have conducted a cross-analysis of cultural
diversity and deviant workplace behavior theories and established the connection
between factor conditions and cultural dimension features. This link in Figure 3.1
is marked by arrow with small gaps, as it is a compilation of theoretical review
and these theories are only one side proved, but not in combination with each
other. Hence the connection between factors and dimensions enabled to establish
a link between cultural dimensions and deviant workplace behavior, however, this
link is valid only under factor conditions. As it is illustrated in Figure 3.1, the
20
connection between cultural dimensions and deviance is marked by dotted arrow
because this link is a hypothetical outcome of theoretical research. It means that
this connection needs to be proved to answer our main research question how
country culture influences deviant workplace behavior?
3.1. Introduction to deviant workplace behavior
In this part will be identified and discussed definitions and alternative concepts,
dimensions and classification of deviant workplace behavior, reasons and factors
which might predict workplace deviance in a business environment.
3.1.1 Definition and concept
It is very difficult to compare and aggregate the results of deviant behavior studies
as this behavior has a multidimensional nature and contains a very diverse set of
related behaviors; thus, the constructs are not defined consistently. Researchers
have given these behaviors many different names. Appelbaum (2007), Bennett
FACTOR
TYPE OF DEVIANCE
DIMENSION
Figure 3.1 Structure of Hypotheses Developement
21
and Robinson (2003) call it “workplace deviance”, Mangione and Quinn (1975)
use the term “counterproductive behavior”; Giacolone and Greenberg (1997)
define it as “antisocial behavior”. Other synonyms of “bad” behavior could be
mentioned, such as negative, deceitful, unethical behavior (Peterson, 2002; Das,
2005; Appelbaum et al., 2007; Bolin & Heatherly, 2001; Appelbaum et al., 2005).
In this part we will try to define the meaning of deviant workplace behavior that
we will refer to in the rest of dissertation. The definitions and related constructs
are at first sight synonymous, thus, cognate concepts will be discussed.
In essence, behavior is deemed deviant when an “organization’s customs,
policies, or internal regulations are violated by an individual or a group that may
jeopardize the well-being of the organization or its citizens” (Robinson and
Bennett, 1995, p.556). Sometimes “deceitful behavior” expression is used as
alternative for deviant. Therefore, even though “ deceitful behavior” is less often
used, it is still an important construct to mention. According to Das (2005, p.706),
deceitful behavior refers to the “self-interest seeking behavior of firms and their
members that involve deceit”. The most important aspect of this concept is self-
interest which is not always the motivation for deviant behavior. Therefore, this
term will not be employed in this paper.
Robinson and Bennett (1995) defined employee or workplace deviance as a
“voluntary behavior that violates significant organizational norms and in so doing
threatens the well-being of an organization, its members, or both” (p. 556). This
concept was based on empirical investigations, developed by eminent researchers
of this field (Bennett and Robinson, 2000; Robinson and Bennett, 1995; Robinson
and Greenberg, 1998) who are widely cited and used for further investigations by
other famous scientists (Bolin and Heatherly, 2001; Appelbaum et al., 2005;
Peterson, 2002; Appelbaum et al., 2007). Thus, in this paper we also focused on
the construct of deviant workplace behavior as defined by Robinson and Bennett
(1995).
22
It is also important to note that deviance might be both positive and negative.
According to Peterson (2002, p. 48):
Negative workplace behavior has been referred to as antisocial behavior (Robinson & O’Leary-Kelly, 1998), organizational misbehavior (Vardi & Wiener, 1966), non-compliant behavior (Puffer, 1987), workplace deviance (Robinson & Greenberg, 1998) and dysfunctional workplace behavior (Griffin et al., 1998), to name a few.
According to Spreitzer and Sonenshein (2003), cited by Appelbaum et al. (2007,
p.587), positive deviance is defined as “intentional behaviors that depart from the
norms of a referent group in honorable ways.” In other words, positive deviant
behavior must be praiseworthy and must focus on actions with honorable
intentions, irrespective of the outcomes. As this study focuses on negative aspects
of deviant workplace behavior, positive deviance concept will not have a
significant impact on the research and, therefore, will not be further discussed.
Therefore, this paper will refer to negative workplace behavior as a direct
synonym of deviant behavior; therefore, both expressions will be used in this
paper.
Deviant workplace behavior is also often linked and alternately employed with
the other concept: “unethical behavior”; hence a distinction between these two
concepts must be discussed.
According to Victor and Cullen (1987), cited by Peterson (2002, p. 50), “the
ethical climate of an organization refers to the shared perceptions of what is
ethically correct behavior and how ethical issues should be handled in the
organization”. It has been suggested that the ethical climate of an organization
may be linked not only to the ethical behavior of employees, but also to a range of
behaviors including counterproductive behaviors such as tardiness, absenteeism,
and lax performance. The support for this notion is that several of the behaviors
that are considered deviant may also be considered unethical (Peterson, 2002;
Robinson & Bennett, 1995). The distinction between the two types of behavior
was most lucidly determined by Peterson (2002, p.50):
Ethics focuses on behavior that is right or wrong when judged in terms of justice, law, or other societal guidelines determining the morality of behavior whereas deviance focuses on behavior that violates significant organizational norms.
23
Hence deviance is defined in terms of departure from organizational norms.
Organizational norms are a grouping of “expected behaviors, languages,
principles and postulations that allow the workplace to perform at a suitable pace”
(Appelbaum et al., 2007, p. 587). To summarize, the rules and norms of the
organizations are the core variable in all the deviant behavior definitions. These
behaviors usually fall within the constructs of the norms of the organization.
3.1.2 Classification and dimensions
As mentioned above, workplace deviance is very multidimensional and comprises
many forms. In order to achieve more accurate results of the research and find the
linkages with cultural diversity theories, it is important to identify deviant
workplace behavior dimensions and typology.
Very roughly, as it was mentioned above, it is possible to divide workplace
deviance into positive and negative behavior. As mentioned in the limitations, this
research will focus on negative deviance; therefore, the typology of positive
workplace behavior will not be determined. Negative deviant behaviors include
employee delinquencies such as not following the manager's instructions,
intentionally slowing down the work cycle, arriving late, committing petty theft,
as well as, not treating co-workers with respect and/or acting rudely towards co-
workers (Appelbaum et al., 2007). Negative workplace behavior typology is
based on two dimensional configurations of workplace behaviors. This
empirically derived typology of workplace deviance has been developed using the
multidimensional scaling procedure (Peterson, 2002). Robinson and Bennett
developed a list of 45 deviant workplace behaviors. Participants then rated the
similarity of these behaviors to each of the other 44 behaviors. Bolin and
Heatherly (2001, p. 407) have briefly summarized their findings:
Using multidimensional scaling techniques to analyze these similarity ratings, the authors concluded that deviant workplace behaviors vary along two dimensions: (1) the minor/serious dimension identified by Boye and Slora (1993) and (2) a dimension that differentiates between behaviors that harm the organization and those that harm the individual. As an example,
24
employee theft is a serious offense and harms the organization, while gossiping about a co-worker is a minor offense that harms an individual.
The multidimensional scaling described above is summarized in Figure 3.2. One
axis of the perceptual map was labeled the organizational-interpersonal
dimension. This dimension represented the target of the deviant behavior. The
second dimension represented the severity of the deviant behavior. Deviant
behavior on this dimension varied on a continuum from minor forms of deviance
(e.g., gossiping) to serious forms of deviant behavior (e.g., physical abuse). The
perceptual configuration based on the two dimensions is displayed in four
quadrants, or four classifications of deviant behavior. Robinson and Bennett
(1995) refer to the four classes of deviant behavior as (1) Production Deviance,
(2) Political Deviance, (3) Property Deviance, and (4) Personal Aggression.
Most studies on negative deviant workplace behavior prior to Robinson’s and
Bennett’s findings were mostly concerned with isolated attempts to answer
Production deviance
• Leaving early • Taking excessive breaks • Intentionally working slow • Wasting resources
Property deviance
• Sabotaging equipment • Accepting kickbacks • Lying about hours worked • Stealing from company
• Sexual harassment • Verbal abuse • Stealing from co-workers • Endangering co-workers
SERIOUS MINOR
ORGANIZATIONAL
INTERPERSONAL
Figure 3.2 Typology of deviant workplace behavior (based on: Roberts and Bennett, 1995, p. 558)
25
specific questions about specific deviant acts such as theft, sexual harassment and
unethical decision making. Their research focused on negative behaviors that may
also be considered deviant such as absenteeism, withdrawal, withholding effort,
and behaviors that lead to corporate inequality; therefore, it is of high importance
for our research. Robinson and Bennett (1995) integrated the various deviant
workplace behaviors into a single framework in order to gather the increasingly
scattered research available on the subject into one comprehensive chart. In this
way, the researchers were able to integrate numerous deviant workplace behaviors
into a single framework.
This type of classification was widely used in many researches (Appelbaum et al.,
2005; Appelbaum et al., 2007; Bolin and Heatherly, 2001; Peterson, 2002; Thau
et al., 2008 and others), and it proved to be a convenient form of mapping
multidimensionality of workplace deviances. Therefore, this classification is also
employed in our study to reflect deviance diversity in different cultures.
3.1.3 Reasons and factors
There are a number of studies conducted in order to find out the reasons and
factors that could possibly predict employees’ deviance. According to Appelbaum
et al. (2005, p.47), “It is important to understand the reasons for deviant behavior
(as well as having established valid quantifiable measurements) as it intended to
assist researchers in finding better ways to promote an ethical and safe climate”.
In this part we will try to group various factors and identify the main reasons of
employee’s deviance referring to the findings of different researchers. In this
study deviant workplace behavior factors play an important role as they are used
later in our research (Chapter 3.3) to identify connections between cultural
diversity and workplace deviance. The review of the literature will end up in total
of 21 factors which are all summarised in Table 3.1.
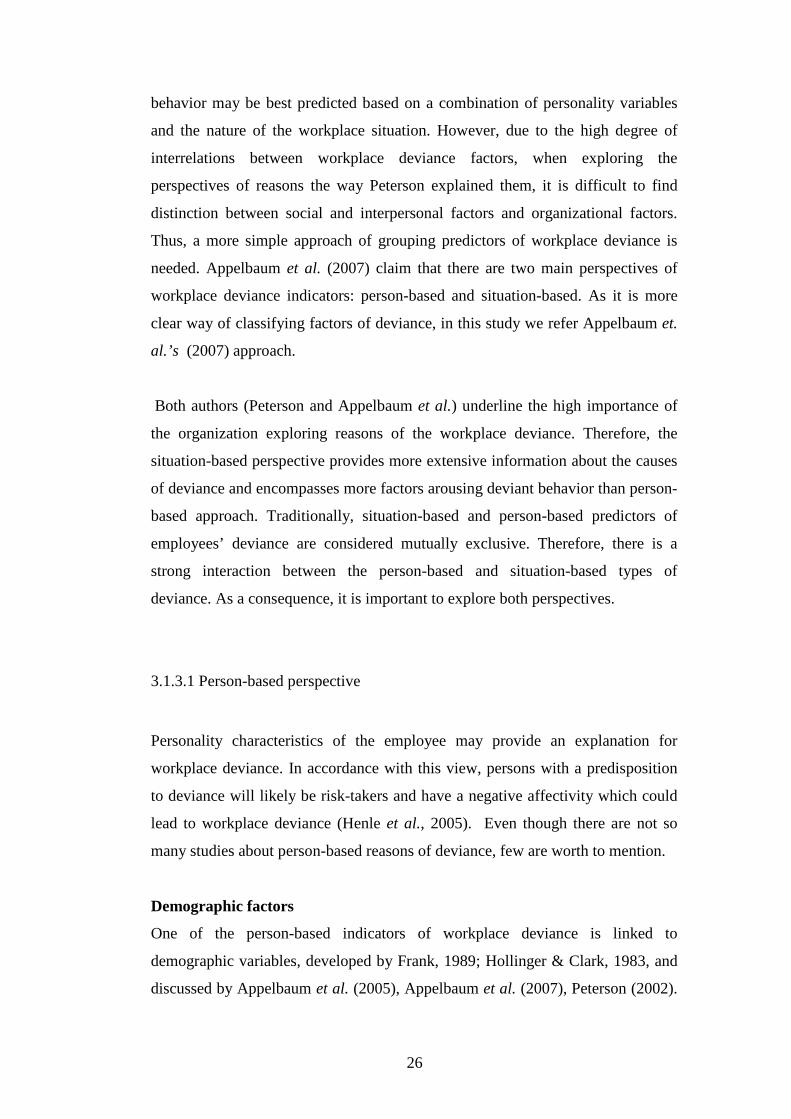
Peterson (2002) proposes three groups of reasons for possible explanations of
workplace deviance: individual factors, social and interpersonal factors, and
organizational factors. Peterson (2002) claims that it is more likely that deviant
26
behavior may be best predicted based on a combination of personality variables
and the nature of the workplace situation. However, due to the high degree of
interrelations between workplace deviance factors, when exploring the
perspectives of reasons the way Peterson explained them, it is difficult to find
distinction between social and interpersonal factors and organizational factors.
Thus, a more simple approach of grouping predictors of workplace deviance is
needed. Appelbaum et al. (2007) claim that there are two main perspectives of
workplace deviance indicators: person-based and situation-based. As it is more
clear way of classifying factors of deviance, in this study we refer Appelbaum et.
al.’s (2007) approach.
Both authors (Peterson and Appelbaum et al.) underline the high importance of
the organization exploring reasons of the workplace deviance. Therefore, the
situation-based perspective provides more extensive information about the causes
of deviance and encompasses more factors arousing deviant behavior than person-
based approach. Traditionally, situation-based and person-based predictors of
employees’ deviance are considered mutually exclusive. Therefore, there is a
strong interaction between the person-based and situation-based types of
deviance. As a consequence, it is important to explore both perspectives.
3.1.3.1 Person-based perspective
Personality characteristics of the employee may provide an explanation for
workplace deviance. In accordance with this view, persons with a predisposition
to deviance will likely be risk-takers and have a negative affectivity which could
lead to workplace deviance (Henle et al., 2005). Even though there are not so
many studies about person-based reasons of deviance, few are worth to mention.
Demographic factors
One of the person-based indicators of workplace deviance is linked to
demographic variables, developed by Frank, 1989; Hollinger & Clark, 1983, and
discussed by Appelbaum et al. (2005), Appelbaum et al. (2007), Peterson (2002).
27
According to these authors, demographic variables’ studies have reported that
some forms of production deviance and property deviance are more likely to
involve employees who are young, are new to their job, work part-time, and have
low-paying positions. There are four main demographic factors that may affect
ethical behavior in an organization. The first factor is gender, due to the fact that
males tend to engage in more aggressive behavior than females at work. KPMG
research (Ramoneda, 2007) showed that 85 percent of perpetrators of workplace
deviance are males. Tenure is an additional factor to consider, as employees with
less tenure are more likely to commit property deviance (aside from other
instances of destructive workplace deviance). Third, it has been shown that the
more educated the employee is, the less likely they will be involved in unethical
behavior. The same goes with age, older employees are likely to be more honest
than younger employees (Appelbaum et al., 2007).
Attitudes of the employees
Attitudes of the employees might also be a reason of deviance. Referring to the
research of Bolin and Heatherly (2001), attitudes can be used effectively to
predict employee deviance and screen out job applicants with a propensity toward
deviant behavior. Attitudes such as theft approval and intent to quit were shown
to predict at least one type of employee deviance. Bolins and Heatherly’s (2001)
study showed the relative strength of each attitude in predicting specific types of
deviance and revealed that theft approval is a good predictor of property deviance
(especially theft) while intent to quit also made significant contributions to the
prediction of organizational deviance (absenteeism, privilege abuse and theft).
Overall, these findings suggest that these two attitudes (theft approval and intent
to quit) predict employee deviance in a consistent manner.
Psychological state of employee
Robinson and Bennett (2000) have conducted a research about the psychological
state of employee, frustration. Frustration was predicted to be associated with
various forms of interpersonal deviance (in e.g., spreading rumors or acts of
aggression) as well as organizational deviance (i.e. vandalism, theft and
sabotage). Results of their experimentation show that frustration is in fact not
28
correlated with organizational deviance, as it is simply associated (albeit
significantly) to interpersonal deviance.
3.1.3.2 Situation-based perspective
According to Henle (2005), another view that has gained recognition as a reliable
predictor of workplace deviance is called situation-based behavior, and it
proposes that certain conditions of the organizational environment predispose
employees to deviance. Situation-based perspective of workplace deviance
indicators provides a more explicate reasoning of deviant behavior; in order to
make it more lucid, different theories were grouped in this study according to
prevailing causes.
Group behaviors
It is important to stress the influence of groups in the workplace when assessing
the reasons of deviant behavior within organizational structure. According to
LeBlanc and Kelloway (2002), cited by Appelbaum et al., (2005, p.47):
Groups play a large role in influencing their members and their organizations. Aggressors have lasting effects on personal (e.g. emotional well-being and psychosomatic well-being) and organizational (affective commitment) outcomes due to the close proximity the aggressor may share with the victim.
Research in social learning theory suggests that deviant role models within a
group setting will significantly influence others within the group to commit acts
of deviance as well. The degrees of this influence, and the similarities between
levels of group anti-social behaviors, are consistent among members of the group
(though the tendency to exert influence will still depend on the tenured individual
within the group) (Appelbaum et al., 2005; Appelbaum et al., 2007).
It was also demonstrated that the multitude of ethnic differences between workers
in an organization was inversely related with the likelihood of deviance (Liao et
al., 2004). It was shown that ethnic similarity actually increases the likelihood of
workplace deviance, possibly due to the fact that ethnically-different employees
29
feel they have the need to conform to organizational norms in order to avoid any
negative connotations with not abiding by such rules (Liao et al., 2004).
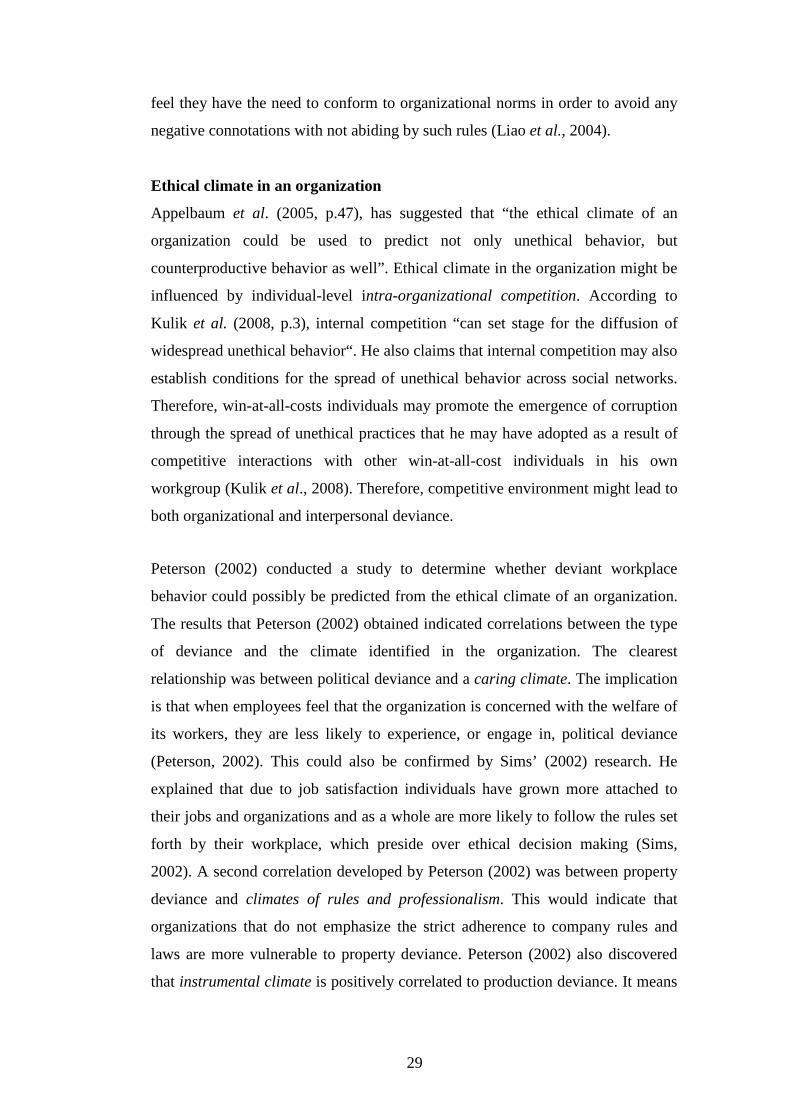
Ethical climate in an organization
Appelbaum et al. (2005, p.47), has suggested that “the ethical climate of an
organization could be used to predict not only unethical behavior, but
counterproductive behavior as well”. Ethical climate in the organization might be
influenced by individual-level intra-organizational competition. According to
Kulik et al. (2008, p.3), internal competition “can set stage for the diffusion of
widespread unethical behavior“. He also claims that internal competition may also
establish conditions for the spread of unethical behavior across social networks.
Therefore, win-at-all-costs individuals may promote the emergence of corruption
through the spread of unethical practices that he may have adopted as a result of
competitive interactions with other win-at-all-cost individuals in his own
workgroup (Kulik et al., 2008). Therefore, competitive environment might lead to
both organizational and interpersonal deviance.
Peterson (2002) conducted a study to determine whether deviant workplace
behavior could possibly be predicted from the ethical climate of an organization.
The results that Peterson (2002) obtained indicated correlations between the type
of deviance and the climate identified in the organization. The clearest
relationship was between political deviance and a caring climate. The implication
is that when employees feel that the organization is concerned with the welfare of
its workers, they are less likely to experience, or engage in, political deviance
(Peterson, 2002). This could also be confirmed by Sims’ (2002) research. He
explained that due to job satisfaction individuals have grown more attached to
their jobs and organizations and as a whole are more likely to follow the rules set
forth by their workplace, which preside over ethical decision making (Sims,
2002). A second correlation developed by Peterson (2002) was between property
deviance and climates of rules and professionalism. This would indicate that
organizations that do not emphasize the strict adherence to company rules and
laws are more vulnerable to property deviance. Peterson (2002) also discovered
that instrumental climate is positively correlated to production deviance. It means
30
that organizations in which individuals are primarily concerned with protecting
their own interests are more likely to suffer from production deviance.
Appelbaum et al. (2005), referring to Sims (1992), noticed that organizations
often reward behavior that is counter to what is generally accepted as ethical;
these are referred to as counter norms. A possible reason for these counter norms
is referred to as the “bottom-line mentality”. This mentality encourages financial
success at the expense of other values. It “promotes short-term solutions that are
financially sound, despite the fact that they cause problems for others within the
organization or the organization as a whole” (Appelbaum et al., 2005, p.48). The
mentality encourages employees to view ethics as an obstacle to profit.
(Appelbaum et al., 2007) In addition, there is the “Madison Avenue mentality”
that is a perspective suggesting that anything is right if the public can be
convinced that it is right. Instead of relying on legitimate morals, individuals
within organizations are concerned with whether they can manage to appear
ethical (Appelbaum et al., 2005). A possible result of a counter norm within the
deviant workplace behavior context would be the “effect/danger” ratio. The
aggressor generally seeks behaviors that are effective in harming the victim
(whether the victim is the organization or another individual) while incurring as
little danger to themselves as possible. This ratio is influenced by a few factors:
repeated contact with the victim and surrounding workforce-“highly-interested”
observers (Appelbaum et al., 2005). Thus in this case the reason of deviance in
the organizations depends on companies’ mentality.
Operational environment
According to Appelbaum et al. (2007), operational environment is also a good
predictor of negative deviant workplace behavior. In his earlier study, Appelbaum
et al. (2005 ) referred to Baucus and Near (1991) who postulated that larger firms,
operating in a dynamic environment, possessing unlimited resources are most
likely to engage in illegal behavior. According to Ernst & Young research (2008),
deviant practices are prevalent mostly in mining, utilities and insurance sectors.
Therefore, it is recognized that many organizations can wield a significant
influence on their employees, even if such employees tend to have solid ethical
values (Appelbaum et al., 2007).
31
Supervisory behavior and justice
The management and its supervision have a significant impact on organizations
“health”. Several studies have concluded that the basis of continuing unethical
behavior in the workplace is most likely linked to the lack of moral leadership in
an organization. According to Trevino and Brown (2005), leaders who engage in
unethical practices often create an atmosphere of allowance within the
organization that is conducive to deviant employee behavior that parallels that of
the leader.
When leaders exercise discipline on wrongful acts within an organization, a
powerful signal about the value of organizational norms is sent to others (Trevino
and Brown, 2005). If the same employees notice a colleague acting unacceptably
and subsequently going unpunished, they will rightly feel disappointed with the
justice served to those breaking the intra-organizational norms (Trevino and
Brown, 2005). Therefore, if an employee is caught committing a deviant act and
is terminated as a result of his actions, colleagues will clearly perceive the
message that such behavior will not be condoned within the workplace and
punishment will be harsh and fitting for the act (Trevino and Brown, 2005). This
theory could also be complemented by Henle’s (2005) Equity Theory. Many
researchers assert that workplace deviance occurs as a response to being treated
inequitably in the workplace. Equity Theory supports these researchers' claims,
since this theory hypothesizes that employees compare their ration of outcomes
(i.e. pay, raises, and promotions) to inputs (i.e. skill, training, education, and
effort) (Henle, 2005). When employees experience similar outcomes in response
to similar inputs as compared to other coworkers, employees experience equity.
Conversely, when there is a discrepancy between their input versus output ratio
and others, the employees experience inequity. In order to restore their sense of
inequity, employees will often turn to resorting to acts of deviance (Henle, 2005).
In addition, Robinson and Bennett’s (2000) research shows that perceived
injustice (perceived fairness and justice to the employee) are negatively associated
with interpersonal and organizational deviance.
32
Not only justice, but also task structure might be a reason behind deviant
behavior. According to Osgood et al. (1996), cited by Appelbaum et al., (2007),
company task structure is a major determinant for the likelihood of workplace
deviance taking place. First, activities within the workplace that are well
organized and allotted to specific individuals will often place these individuals in
roles that make them responsible for their own social control within that task. In
addition to this, structured activities will seldom offer opportunities to engage in
deviant activities. Therefore, it may be postulated that keeping workers occupied
with tasks that they will be asked to take responsibility for, will often lead to a
lower likelihood that such employees engage in deviant behaviors. Norms also
play an important role in task structure. Normlessness is the lack of acceptance of
social expectations about behavior; thus, when individuals feel “bonded” to a
social environment, employees are less inclined to commit deviant acts. As a
consequence, normlessness is strongly correlated to interpersonal deviance and
moderately correlated to organizational deviance (Appelbaum et al., 2007).
Thau et al. (2008) conducted a research about whether situational uncertainty
represented in perceptions of management style moderates the relationship
between abusive supervision and various forms of workplace deviance. According
to Thau et al. (2008), when employees are abused by authorities, they are more
likely to exhibit behaviors that harm the organization and its members due to the
social exchange theory (subordinates seek to rectify imbalance by engaging in
negative activities). Thau et al. (2008) tested whether a management style
depicting situational uncertainty moderates the relationship between abusive
supervision and workplace deviance. This study discovered positive relationship
between abusive supervision and supervisor- directed and organizational deviance
was stronger for employees who perceived high rather than low levels of
uncertainty with respect to management style.
In conclusion, among the different types of negative deviances there are many
variables within the workplace that may accommodate such deviant behaviors or
limit them; therefore, it is important to explore both person-based and situation-
based perspectives. The most significant person-based factors include
demographic variables, attitudes, psychological state of employee. The most
33
prevalent predictors of situation-based approach are group behaviors, ethical
climate in an organization, operational environment and supervisory behavior and
justice. The summary of deviance factors and their relations to deviant workplace
behavior together with the original authors is presented in Table 3.1.
Table 3.1 Factors and their relationship to workplace deviance
Factor Relationship to workplace deviance
Author
Person-based Perspective Demographic Factors Gender Males tend to engage in more
aggressive behavior than females Tenure Employees with less tenure are
more likely to commit property deviance
Education Higher education indicates a lower tendency for deviant behavior
Age Older employees are likely to be more honest than younger employees
Appelbaum et al., 2007
Attitudes of Employees Theft approval
Predictor of property deviance (especially theft)
Intent to quit
Predictor of organizational deviance (theft, absenteeism and privilege abuse).
Bolin and Heatherly, 2001
Psychological state of employee Frustration Predictor of interpersonal
deviance Robinson and Bennett, 2000
Situation-based Perspective Group Behaviors Deviant role models Influence others in the group to
commit acts of deviance as well Robinson and O’Leary, 1998
Multitude of ethnic differences between workers
Inversely related with the likelihood of deviance (ethnic similarity increases the likelihood of workplace deviance)
Liao et al., 2004
Ethical Climate In the Organization Competitive Environment: intra-organizational competition
Predictor of both organizational (corruption) and interpersonal deviance
Kulik et al., 2008
Caring climate Predictors of political deviance. In this climate, there is lower probability of deviance.
Peterson, 2002.
34
Climates of rules and professionalism
Predictors of property deviance. High adherence to company policies are at the lowest risk for property deviance
Instrumental climates Predictors of production deviance. Presence of Counter Norms (“bottom-line mentality”) and “Effect/danger” ratio
Financial success in the organization is encouraged at the expense of other values.
Sims, 1992.
Operational Environment Size of the Company Larger firms with greater
resources are related to increased occurrence of workplace deviance
Baucus and Near, 1991
Supervisory behavior and justice Discipline on Wrongful Acts
Inversely related to deviance. Due to Social Learning Theory, discipline encourages to act undeviating.
Trevino and Brown, 2005
Inequitable treatment Direct relationship to deviance. Henle, 2005 Perceived Injustice Negatively related with
interpersonal and organizational deviance
Robinson and Bennett, 2000
Company Task Structure Well organized task structure indicate a lower likelihood of deviant behaviors
Normlessness Strongly related to interpersonal deviance and moderately related to organizational deviance
Osgood et al., 1996
Abusive supervision and employee’s perceptions of management style in terms of uncertainty
A positive relationship between abusive supervision and supervisor-directed and organizational deviance was stronger when employees’ perceptions of their organization’s management style reflected high rather than low situational uncertainty.
Thau et al., 2008
3.2 Country’s cultural differences and similarities between Eastern (Poland)
and Western (France) Europe
This part of the dissertation will present the cultural differences and similarities
between two countries, Poland and France, according to Hofstede’s five
35
dimensions. We will analyze both countries, referring to Hofstede (2005), Mole
(2003) and Kolman et al. (2003).
3.2.1 Hofstede’s 5 dimensions: Poland and France perspective
Hofstede's (2005) studies show the existence of national and regional cultural
groupings that affect the behavior of societies and organizations. He proves that
these cultural groupings are very persistent across time. Hofstede (2005) makes
the difference between the term culture and country culture. He mentions that
culture itself can regroup different countries within it, and country culture deals
with the culture of a precise nation. As a consequence, the term country culture is
used as we make the comparison between two countries.
The concept of five dimensions created by Hofstede (2005) aims to assist in
differentiating these country cultures. We will try to find the differences and
similarities between the country cultures of France and Poland with the help of
Hofstede’s (2005), Mole’s (2003) and Kolman et al.’s (2003) findings and we will
classify these differences and similarities according to Hofstede’s (2005) five
dimensions.
The five dimensions are:
− Power Distance (PDI)
− Individualism and Collectivism (IDV)
− Masculinity and Femininity (MAS)
− Uncertainty avoidance (UAI)
− Long and short term orientation (LTO)
3.2.2 Explanation of scores and ranks according to dimensions’ index
Explanation of scores and ranks are presented in the table below:
36
Table 3.2 Explanation of scores and ranks according to dimensions’ index
Dimension index
Low score High score Low rank High rank
PDI Small PDI Large PDI Small PDI Large PDI IDV Collectivism Individualism Collectivism Individualism MAS Femininity Masculinity Femininity Masculinity UAI Weak UAI Strong UAI Weak UAI Strong UAI LTO Short-term
orientation Long-term orientation
Short-term orientation
Long-term orientation
3.2.3 Power distance
According to Hofstede (2005), “Power distance can be defined as the extent to
which the less powerful members of institutions and organizations within a
country expect and accept that power is distributed unequally.” (p.46)
In the country cultures with large PDI the hierarchy in organizations reflects
existential inequality between higher and lower levels; we can observe the
centralized system in the majority of companies. There is also more supervisory
of personal, subordinates expect to be told what to do. Managers rely on superiors
and on formal rules, and the top management is perceived as autocratic or
paternalistic. The difference between employees and managers is also seen
through the wide salary range between the top and bottom of organizations, in
societies with large PDI, white-collar jobs are valued more than blue-collar jobs,
and privileges and status symbols are normal and popular (Hofstede, 2005).
In the country cultures with small PDI the hierarchy in organizations means an
inequality of roles, established for convenience; we can observe the decentralized
system in the majority of companies concerned. There are less supervisory of
personal and subordinates expect to be consulted. Managers rely on their own
experience and subordinates, and the top management is perceived as a
resourceful democrat. There is a narrow salary range between top and bottom of
the organization. In societies with small PDI, manual work has the same status as
office work, and privileges and status symbols are frowned upon (Hofstede,
2005).
37
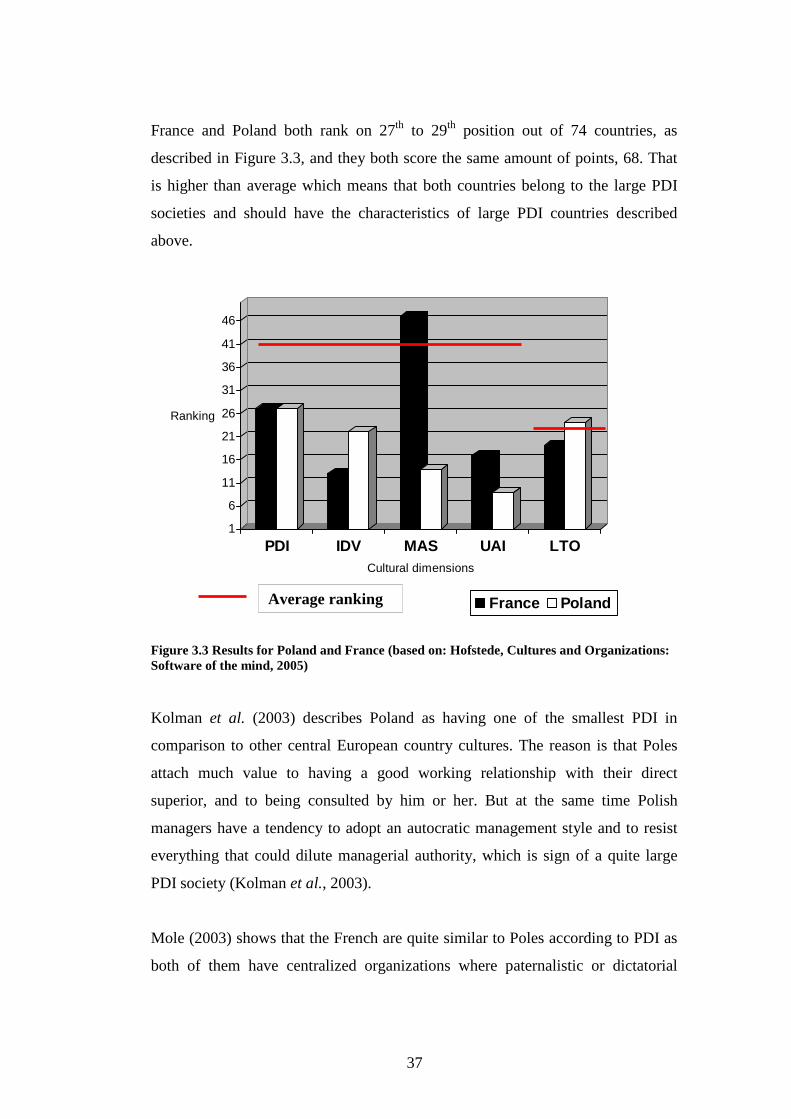
France and Poland both rank on 27th to 29th position out of 74 countries, as
described in Figure 3.3, and they both score the same amount of points, 68. That
is higher than average which means that both countries belong to the large PDI
societies and should have the characteristics of large PDI countries described
above.
1
6
11
16
21
26
31
36
41
46
Ranking
PDI IDV MAS UAI LTOCultural dimensions
France Poland
Figure 3.3 Results for Poland and France (based on: Hofstede, Cultures and Organizations: Software of the mind, 2005)
Kolman et al. (2003) describes Poland as having one of the smallest PDI in
comparison to other central European country cultures. The reason is that Poles
attach much value to having a good working relationship with their direct
superior, and to being consulted by him or her. But at the same time Polish
managers have a tendency to adopt an autocratic management style and to resist
everything that could dilute managerial authority, which is sign of a quite large
PDI society (Kolman et al., 2003).
Mole (2003) shows that the French are quite similar to Poles according to PDI as
both of them have centralized organizations where paternalistic or dictatorial
Average ranking
38
bosses and status are respected. Thus, according to Mole (2003), both Poles and
the French belong to the large PDI country cultures.
After analysis of the points of view of different authors we can consider Poland
and France as equal according to the PDI. As a result, they both belong to the
large PDI societies.
3.2.4 Individualism and Collectivism
Hofstede (2005) defines the difference between individualism and collectivism as
follows: “Individualism pertains to societies in which the ties between individuals
are loose: everyone is expected to look after himself or herself and his or her
immediate family. Collectivism as its opposite pertains to societies in which
people from birth onward are integrated into strong, cohesive in-groups, which
throughout people’s lifetimes continue to protect them in exchange for
unquestioning loyalty” (p.76).
On the one hand, in individualistic organizations occupational mobility is quite
high; employees are considered as “economic men” who will pursue the
employer’s interest if it coincides with their self-interest. The employer-employee
relationship is a contract between parties on a labor market and hiring and
promotion decisions are supposed to be based on skills and rules only. The
management of the organization is a management of individuals and the
management training teaches the honest sharing of feelings. Relating to customers
in individualistic companies every customer should get the same treatment
(universalism) and task will prevail over relationship (Hofstede, 2005).
On the other hand, in collectivistic organizations occupational mobility is lower;
employees are members of in-group’s interest. The employer-employee
relationship is basically moral, like a family link, and hiring and promotion
decisions take an employee’s in-group into account. The management of the
organization is a management of groups and in comparison to individualistic
countries direct appraisal of subordinates spoils harmony. Relating to customers
39
in collectivistic companies, in-group customers get better treatment
(particularism) and the relationship will prevail over task (Hofstede, 2005).
France ranks 13th and scores quite high (71), and Poland ranks 24th and scores 60
which is also considered as a high score. In this case, the high score and high rank
shows that the country is individualistic. Thus, both France and Poland belong to
the individualistic type of societies.
Mole (2003) confirms this fact by explaining that in French companies
competition prevails over collaboration which is according to Hofstede (2005)
related to the individualistic societies’ characteristics. Kolman et al. (2003),
contradicts Hofstede (2005), by showing that Poland is much more collectivistic
than a Western country culture, which is also reflected in the management
literature. Poles are more inclined to form a group with strong trust relations, and
work together in “beating the enemy”, individual responsibility is often avoided.
The ethic of shared responsibility of the socialist days may have promoted this
tendency. But it is likely that relatively strong collectivist values are more deeply
rooted in the Polish culture (Kolman et al., 2003).
Despite the fact that Kolman et al. (2003) claim that Poland is a collectivistic
country, we refer to Hofstede (2005) who claims that Poland is individualistic
because since Kolman et al.’s research was done the differences between business
environments in France and Poland became less visible; thus, both France and
Poland became less different in conducting business. Consequently, the results of
Hofstede’s classification (2005, p. 78) are followed.
3.2.5 Masculinity and Femininity
Hofstede (2005) defines the difference between masculine and feminine society as
follows: “A society is called masculine when emotional gender roles are clearly
distinct: men are supposed to be assertive, tough, and focused on material success,
whereas women are supposed to be more modest, tender, and concerned with the
quality of life. A society is called feminine when emotional gender roles overlap:
40
both men and women are supposed to be modest, tender, and concerned with the
quality of life” (p.120).
Masculine societies are described in the following way in the organizations: the
management is decisive and aggressive. Thus, the resolution of conflicts occurs
by letting the strongest win. In these societies people live in order to work, as
more money is preferred over more leisure time. Rewards are based on equity.
Careers are compulsory for men and optional for women, as a result there is a
lower share of working women in professional jobs. In general, there is a
preference for larger organizations in masculine societies and, finally,
humanization of work is expressed by job content enrichment (Hofstede, 2005).
Feminine societies are described in the following way in the organizations: the
management is based on intuition and consensus. Thus the resolution of conflicts
occurs by compromise and negotiation. In these societies people work in order to
live, as more leisure time is preferred over more money. Rewards are based on
equality. Careers are optional for both genders, and as a result there is a higher
share of working women in professional jobs. In general, there is a preference for
smaller organizations in feminine societies and, finally, humanization of work is
expressed by contact and cooperation (Hofstede, 2005).
If we consider the descriptions of feminine and masculine societies above we can
say that France is a feminine society with a score equal to 43, rank 47, and Poland
is a masculine society with a score equal to 64, rank 14. That means that French
organizations are more intuitive, diplomatic, and accord more importance to
cooperation, equality and contact than Polish organizations. The French prefer to
work in order to live rather than live in order to work. Poles, on the other hand,
are more aggressive in taking decisions, and accord more importance to work
itself. Men in Poland still have higher status then women in the workplace
environment.
Mole (2003) agrees with Hofstede (2005) about most of the characteristics of both
countries by mentioning that Poland has a male dominated workplace, while in
France one can find women as managers of the organizations. The author also
41
notices preference of French for life than for work (p.194, 2003), also mentioned
by Hofstede (2005). Kolman et al.’s (2003) findings suggest that the Polish
culture is strongly masculine. The high score of Poland on masculinity is mainly
caused by their agreeing more with the statement that “when people have failed in
life it is often their own fault” (Kolman et al., 2003). Consequently, referring to
all the authors, France is a Feminine society and Poland is a Masculine one.
3.2.6 Avoidance of uncertainty
According to Hofstede (2005) “Uncertainty avoidance can be defined as the
extent to which the members of a culture feel threatened by ambiguous or
unknown situations (Hofstede, 2005). The author mentions that “this feeling is,
among other things, expressed through nervous stress and in a need for
predictability: a need for written and unwritten rules”. (p. 167)
Societies with strong uncertainty avoidance (UAI) observe fewer changes of
employer and longer service in their organizations. There is an emotional need for
rules, even if these will not work; a need to be busy and an inner urge to work
hard. There is also a need for precision and formalization, and for these types of
organizations time is money. Top managers are concerned with daily operations
and entrepreneurs are constrained by existing rules. There are more self-employed
people in strong UAI societies. Workers in these country cultures are not very
good at invention, but better at implementation. They believe in experts and
technical solutions and focus on decision content rather than in decision process
(Hofstede, 2005).
Societies with weak uncertainty avoidance (UAI) observe more changes of
employer and shorter service in their organizations. There should be no more
rules than strictly necessary; these societies are hard-working only when it is
needed and they are tolerant for ambiguity and chaos. For these types of
organizations time is framework for orientation. Top managers are concerned
with strategy and entrepreneurs are relatively free from rules. There are fewer
self-employed people in weak UAI societies, they are worse at implementation
42
but better at invention; they believe in generalists and common sense and focus on
decision process rather than in decision content (Hofstede, 2005).
Poland and France both have quite strong UAI, according to Hofstede (2005);
especially Poland which scores 93 and is in top ten strongest UAI country
cultures, while France scores 86 and ranks 22nd, which is lower than Poland.
However, both country cultures believe in rules and are motivated by security. For
them, time is money and there is a need to be busy, to be precise and formalized.
In this case, they are good at implementation but not at invention.
After a survey about punctuality Mole (2003) noticed that Poles are usually up to
15 minutes late, and French workers are over 15 minutes late. The author
underlines that the punctuality depends on the nature of the organization, which
can be organic or systematic. The more punctual the people are, the more they
will tend toward the systematic end of the dimension and its mechanistic view of
organizations. This means that French organizations belong to the organic type of
companies and that Polish organizations belong to the more systematic type of
companies. The difference between the two types of organizations is that toward
the systematic end there is a belief that the basic elements of an organization are
functions that are coordinated by well-defined, logical relationships. Toward the
organic end of the dimension, the belief is that organizations are like living
organisms growing out of the needs of their members, their environment, and the
circumstances of the moment. Thus, systematic organizations are more likely to
follow the rules than the organic ones; as a consequence French workers should
be less formal than Polish ones. In addition, Mole (2003) describes Poles as
preferring formal communication and in general being comfortable with
formality.
Kolman et al. (2003) describe a relatively high score on uncertainty avoidance of
Poland. The observed strong uncertainty avoidance is in conformity with casual
observations, like the strong reference for experts in Poland. Signs of strong
uncertainty avoidance can also be seen in the Polish attitude towards authority.
“Legitimate power”, or “position power”, is very important in the Polish context
(Kolman et al, 2003).
43
Mole (2003) claims that there is a bigger difference between France and Poland
according to uncertainty avoidance dimension. However, lack of punctuality and
formality in communication of the French is not sufficient to explain the weak
UAI of the French. Thus, Hofstede’s classification (p. 168, 2005) of the country
cultures is taken into account.
3.2.7 Uncertainty avoidance effects on anxiety and happiness
Anxiety is a term taken from psychology and psychiatry that expresses a diffuse
“state of being uneasy or worried about what may happen” (Hofstede, 2005). The
factors like alcoholism and the rate of prisoners in a country are usually
considered as outcomes of anxiety. According to Hofstede (2005), the uncertainty
avoidance dimension is positively correlated with anxiety in a way that in weak
UAI societies anxiety levels are relatively low (Hofstede, 2005). Both Poles and
the French belong to strong UAI societies, thus, they should be more exposed to
anxiety at workplace.
Mole (2003) mentions humor as widely used way to create a relaxed atmosphere.
It lightens tedium, and defuses tension when things get difficult. It is also
employed to disguise aggression. Mole’s (2003) findings about country humor
rating show that both Poles and the French use humor quite seldom during the
formal meetings, as a result the chances to create a relaxed atmosphere and defuse
tension are lower in both countries.
Happiness is negatively correlated with UAI. A stronger UAI goes together with
less subjective well-being. So in country cultures with strong uncertainty
avoidance people feel less happy. Consequently, according to Hofstede (2005),
both Poles and the French, should be more anxious and less happy.
3.2.8 Long and short term orientation
44
According to Hofstede (2005) “long-term orientation stands for the fostering of
virtues oriented toward future rewards - in particular, perseverance and thrift. Its
opposite pole, short-term orientation, stands for the fostering of virtues related to
the past and present – in particular, respect for tradition, preservation of “face”,
and fulfilling social obligations” (p. 210).
In the societies with long-term orientation main work values include learning,
honesty, adaptiveness, accountability and self-discipline. The focus is on market
position and leisure time is not important. These organizations pay attention to
long term profits and owner-managers and workers share the same aspirations. In
these societies wide social and economic differences are not desirable (Hofstede,
2005).
In the societies with short-term orientation main work values include freedom,
rights, achievement and thinking for oneself. The focus is on bottom line and
leisure time is important for them. These organizations pay attention to short term
profits and owner-managers and workers are psychologically in two camps. In
these societies meritocracy is rewarded by abilities (Hofstede, 2005).
France is 19th in Hofstede’s classification (p.211, 2005), and it scores 39, it is a
long-term society. This means that French workers should have long-term views
about the future; they should be more self-disciplined and should have better
adaptability skills. French employees and employers should generally share the
same aspirations between co-workers and managers. Poland is 24th and scores 32,
it is a short-term society. This means that Poles should have short-term views
about the future; they should be less self-disciplined and should have achievement
as a strong value of work. In general, Polish managers and workers should be in
two different psychological camps.
3.2.9 Summary
If we generalize the five dimensions in perspective of both countries, France and
Poland, we can say that:
45
• France has a similar Power distance index to Poland.
• France and Poland belong to Individualistic society.
• France belongs to Feminine society and Poland to Masculine society.
• France and Poland belong both to strong Uncertainty avoidance index.
• France belongs to Long-term orientation societies and Poland to Short-term
orientation societies.
In this chapter (3.2) we have identified cultural likenesses and differences
between France and Poland (they are summarized in the table below). However,
in our research we concentrate on similarities between Poland and France. There
are three dimensions according to which the French and Poles are similar: Power
distance, Individualism-collectivism and Uncertainty avoidance. Consequently,
our hypotheses will also be focusing on similarities.
Table 3.3 Country cultural differences and similarities between France and Poland
FRANCE POLAND
PDI Hofstede
- Inequality in the hierarchy of an organization - Centralized system in the majority of companies - Supervisory of personal - Managers rely on superiors and on formal rules - Top management perceived as autocratic or paternalistic - Significant difference between the salaries of the top and bottom of organizations - White-collar jobs are valued more than blue-collar jobs - Privileges and status symbols are normal and popular
PDI Mole
- Centralized system in the majority of companies - Top management perceived as autocratic or paternalistic - Privileges and status symbols are normal and popular - Senior person dominates in decisions and meetings
PDI Kolman et
al.
- Better working relationship with superiors - Subordinates like to be consulted - Autocratic management style at the same time
46
IDV Hofstede
- Low occupational mobility - Employees pursue the employer’s interest if it coincides with their self-interest - Hiring and promotion decisions are supposed to be based on skills and rules - The management of the organization is a management of individuals - Every customer should get the same treatment (universalism) - Task prevails over relationship
IDV Mole
- Individualistic society - Competition prevails over collaboration
IDV Kolman et
al.
- Collectivistic society - Individual responsibility is often avoided - More inclined to form a group
MAS Hofstede
- Management is based on intuition and consensus - Resolution of conflicts occurs by compromise and negotiation - People work in order to live - More leisure time is preferred over more money - Rewards are based on equality - Careers are optional for both genders - Higher share of working women in professional jobs - Preference for smaller organizations - Humanization of work is expressed by contact and cooperation
- Management is decisive and aggressive - Resolution of conflicts occurs by letting the strongest win - People live in order to work - More money is preferred over more leisure time - Rewards are based on equity - Careers are compulsory for men and optional for women - Lower share of working women in professional jobs - Preference for larger organizations - Humanization of work is expressed by job content enrichment
MAS Mole
- Women can be managers - Preference for life than job
- Male domination at workplace
MAS Kolman et
al.
- Strongly masculine society - Less empathic
47
UAI Hofstede
- Fewer changes of employer and longer service in the organizations - Emotional need for rules, even if these will not work - Need to be busy and an inner urge to work hard - Need for precision and formalization - Time is money - Top managers are concerned with daily operations - Self-employed people - Better at implementation - Belief in experts and technical solutions - Focus on decision content
UAI Mole
- Less punctual - Organic companies
- More punctual - Systematic companies - Preference for formal communication
UAI Kolman et
al.
- Strong uncertainty index - Strong reference for experts - Importance of “position power”
UAI – Happiness
and Anxiety
- More anxious - Fewer use of humor during the formal meetings - People feel less happy - Motivated by security and esteem
LTO Hofstede
- Main work values include learning, honesty, adaptiveness, accountability and self-discipline. - Long term profit orientation. - Owner-managers and workers share the same aspirations. - Wide social and economic differences are not desirable.
- Main work values include freedom, rights, achievement and thinking for oneself. - Short term profit orientation. - Owner-managers and workers are psychologically in two camps - Meritocracy is rewarded by abilities.
LTO Mole
- Management and subordinates are in two different camps
- Management is a part of the work team - Positive responds to volatile circumstances
48
3.3 Cross-analysis of cultural dimensions and deviant work place behavior
theories
In this sub-chapter we will discuss how country cultural theories could be linked
with deviant workplace behavior theories. Therefore, we will discuss the factors
(presented in Table 3.1 of the Chapter 3.1) which indicate the four different types
of deviant behaviour (described in Chapter 3.1 and illustrated in Figure 3.2) and
cultural dimensions (discussed in Chapter 3.2 and summarized in Table 3.3). The
discussion will lead to the link between the types of deviance, arisen from the
factors stated above, and cultural dimensions. Factors’, types of deviance and
cultural dimensions’ connections are summarized in the end of this chapter in
Table 3.4.
3.3.1 Person-based perspective
3.3.1.1 Demographic factors
Appelbaum et al. (2007) found that there is a correlation between several person-
based factors and the deviant workplace behavior. The most important of them
are:
− Gender
− Tenure
− Education
− Age
The connections of these factors to the cultural diversity theories will be discussed
bellow.
Gender
According to Appelbaum et al., males tend to engage in more aggressive behavior
than females (Appelbaum et al., 2007); this means that masculine country cultures
should be more tended to apply the negative deviant behavior. Therefore, there is
a positive relationship between MAS and deviance. Thus, if we refer to Hofstede
49
(2005), Poland, as a masculine society, should be more tended to the negative
deviant behavior as their management is described as decisive and aggressive,
while in France, feminine country culture, the management is based on intuition
and consensus; thus, referring to gender factor, the French should be less tended
to commit deviance then Poles.
Tenure
Tenure is defined as length of time a position of an employee lasts. Appelbaum et
al.’s (2007) research proves that employees with less tenure are more likely to
commit property deviance. Tenure can be explained by the level of loyalty of an
employee. The loyalty could be predicted by the PDI of a country culture in a
following way: a country culture with large PDI shows significant difference
between salaries and status of employees and employers. Thus, organization is
less concerned with the welfare of its all employees. Therefore, there is a positive
relationship between PDI and property deviance. As a result, both Poles and the
French should be more tended to commit property deviance according to power
distance dimension. According to Hofstede (2005), there should be fewer changes
of employers and longer service in the countries with stronger UAI than in the
cultures with weaker UAI. This means that employees in strong UAI country
cultures have relatively long tenure; thus, they are less tended to commit property
deviance. Therefore, there is a negative relationship between UAI and property
deviance. As mentioned in Chapter 3.2, both France and Poland have quite strong
UAI. As a result, both Poles and the French are less tended to commit property
deviance.
Referring to Hofstede’s (2005) power distance dimension analysis, both Poles and
the French are more tended to commit property deviance. Nevertheless, according
to uncertainty avoidance dimension both Poles and the French are less tended to
commit property deviance. As a result, there is no lucid explanation for tenure in
terms of cultural dimensions. Therefore, it is not relevant for our research.
Education
More educated employees are less likely to be involved in deviant behavior
(Appelbaum et al., 2007). According to governmental statistics in Poland
50
(Olenski, 2007) and a survey of French national institute of statistics (Insee,
2007), described in Figure 3.4, it is noticed that the proportions of educated
people in France are higher than in Poland. It means that France should have more
educated employees. As a consequence, referring to Appelbaum et al. (2007),
French should be less tended to negative deviant behavior than Poles. Moreover,
according to Mole (2003) in France education is considered as the most important
factor in hiring employees while in Poland the most important factor is charisma
(2003, p. 64). As a result, Polish employees should be more tended to commit a
deviance than French due to educational factor.
0%
5%
10%
15%
20%
25%
30%
35%
40%
45%
Highereducation
Secondaryschool
Lowersecondaryeducation
Primaryeducation
Poland France
Figure 3.4 Education in France and Poland (based on: Insee, Niveau général de formation selon l’age, 2007 and Olenski, Demographic year book of Poland 2007, p. 159, 2007)
However, this factor cannot be explained by any of dimensions; thus, we do not
consider it for the further research.
Age
Appelbaum et al.’s (2007) research shows that older employees are likely to be
more honest than younger employees. This means that in a country with older
employees negative deviant behavior should be less common. According to
OECD survey, French employees are older than Polish ones, described in Figure
51
3.5; which means that in Polish organizations there should be a higher risk of
negative deviant behavior than in French ones.
0%
10%
20%
30%
40%
50%
60%
70%
80%
Employmentrates for agegroup 15-24
years old
Employmentrates for agegroup 25-54
years old
Employmentrates for agegroup 55-64
years old
Poland France
Figure 3.5 Employment rates by age group (based on: OECD, OECD Factbook 2007, p. 124, 2007)2
However, this factor, as well as age factor, cannot be explained by any of
dimensions; thus, we do not consider it for the further research.
3.3.1.2 Attitudes of employees
There are two most relevant attitudes of employees related to negative deviant
workplace behavior described by Bolin and Heatherly (2001). These attitudes are
Theft approval and Intent to quit.
Theft approval
Theft approval is the best predictor of property deviance, especially theft (Bolin
and Heatherly, 2001). In the majority of cases, this factor can be predicted by the
lack of rules and regulations within a society. A person, who does not have the
2 The employment rates in this figure show the percentage of persons of working age who are in employment, broken down into three age groups.
52
habit of following rules, could step over other regulations. In the country cultures
with stronger UAI there is an emotional need for rules. Thus, the employees in
these country cultures are used to follow the regulations and are more familiar
with formality (Hofstede, 2005). Therefore, there is a negative relationship
between UAI and property deviance. Consequently, both Poles and the French,
belonging to strong UAI country cultures, have lower tendency to approve the
theft.
Intent to quit
Intent to quit is a predictor of absenteeism, privilege abuse and theft (Bolin and
Heatherly, 2001). This factor can be predicted by loyalty of an employee. The
loyalty itself can be predicted by PDI of a country culture. The societies with
large PDI show significant difference between salaries and status of employees
and employers. Thus, there is lower attachment to the companies in this type of
societies. Consequently, employees feel less attached to the company and more
often intend to quit the job and commit organizational deviance related to this
factor. Therefore, there is a positive relationship between PDI and organizational
deviance. As a result, both Poles and the French should be more tended to commit
organizational deviance.
3.3.1.3 Psychological state of employee
Frustration
Frustration is associated with various forms of interpersonal deviance (Robinson
and Bennett, 2000). Frustration of employees can be also associated with anxiety.
A more anxious population is related to the country cultures with strong UAI.
This means that anxiety is more common in country culture with strong UAI;
thus, the risk of deviance is higher. Therefore, there is a positive relationship
between UAI and interpersonal deviance. Both France and Poland belong to
strong UAI societies (Hofstede, 2005); as a consequence, both French and Polish
employees are more exposed to the risk of interpersonal deviance. In addition,
according to Mole (2003), another way of avoiding frustration is the use of humor
inside the companies. Referring to his survey, both French and Polish companies
53
use humor quite seldom during the formal meetings. The use of humor reduces
tension and relaxes atmosphere. As a consequence, both French and Polish
employees are more frustrated; thus, more tended to commit interpersonal
deviance.
To summarize both Hofstede (2005) and Mole (2003) claim that French and
Polish employees are exposed to anxiety and consequently tended to commit
interpersonal deviance.
3.3.2 Situation-based perspective
Groups play an important role in influencing their members and their
organizations. Therefore, it is important to identify how deviance could be
predicted in different cultures referring to the patterns of group behaviors in these
countries.
3.3.2.1 Group behaviors
Deviant role models
Research in Social Learning Theory suggests that deviant role models within a
group setting will significantly influence others within the group to commit acts
of deviance as well (Appelbaum et al., 2005, Appelbaum et al., 2007). This can
happen in the companies with collectivistic views about the business environment
as in these societies in-group solidarity prevails. Therefore, there is a negative
relationship between IDV and deviance. According to Hofstede (2005), both
Poland and France belong to the group of individualistic societies, which means
that they both have individualistic traits. As a result, both country cultures are less
tended to commit acts of deviance within the group.
Multitude of ethnic differences between workers
Findings of Liao et al. (2004) about multitude of ethnic differences between
workers show that ethnic similarity increases the likelihood of deviant workplace
54
behavior. Hofstede (2005) found that in long-term orientation country cultures
wide social and economic differences are not desirable. However, it is quite
difficult to associate ethnic difference to social difference as ethnic difference
understands racial, national, religious, linguistic or cultural heritage while social
difference means different economic and political positions of individuals within
the same society, group or culture. Thus, multitude of ethnic differences between
workers factor could be considered as irrelevant for our further research.
3.3.2.2 Ethical climate in the organization
The ethical climate of an organization could be used to predict not only unethical
behavior, but counterproductive behavior as well (Wimbush and Shepard, 1994).
There are five main factors of ethical climate in the organizations:
− Competitive environment: intra organizational competition
− Caring climate
− Climates of rules and professionalism
− Instrumental climates
− Presence of counter norms and “effect/danger” ratio
Competitive environment: intra organizational competition
This factor is a predictor of both organizational (corruption) and interpersonal
deviance. Kulik et al. explained that the competition inside an organization
increases the risk of deviant behavior (Kulik et al., 2008). Referring to Hofstede’s
(2005) individualism-collectivism dimension, individualistic societies should be
more tended to deviant behavior than collectivistic ones, because in collectivistic
firms the in-group task prevails; thus, there is less competition between employees
of the same company. Self-interest is a key feature in individualistic cultures; as a
result, there is more competition between employees; thus, higher risk of
deviance. Therefore, there is a positive relationship between IDV and deviance.
Thus, both French and Polish employees should be more tended to commit both
organizational (corruption) and interpersonal deviance.
55
Caring climate
Sims (2002) and Peterson (2002) mention that high levels of caring climate relate
to lower levels of likelihood of workplace deviance within the organization.
According to Hofstede (2005) caring climate is more common in feminine
country cultures than in masculine ones. Feminine societies are based on
compromise, consensus and humanization of work in these country cultures is
expressed by cooperation. Thus, there is a lower risk of deviance in the feminine
country cultures. Therefore, there is a positive relationship between MAS and
political deviance. Thus, Poland belongs to the masculine country cultures, while
France belongs to the feminine ones. Thus, Poles should be more tended to
commit political deviance than the French.
Climates of rules and professionalism
According to Peterson (2002), companies that do not emphasize the strict
adherence to company rules and laws, are more vulnerable to property deviance.
Hofstede (2005), Kolman et al. (2003) and Mole (2003) described the companies
of the cultures belonging to strong UAI societies as organizations which accord
high importance to the rules; thus, there is lower risk of deviance in strong UAI
country cultures. Therefore, there is a negative relationship between UAI and
property deviance. Both Polish and French employees have an emotional need for
rules: they feel comfortable with precision, formalization and feel the need to be
leaded. As a consequence, Polish and French workers are less tended to commit
property deviance.
Instrumental climates
In the organizations with an instrumental climate, the individuals are concerned
with protecting their own interests, thus they are more likely to commit
production deviance (Peterson, 2002). In individualistic societies employees
pursue the employer’s interest only if it coincides with their self-interest
(Hofstede, 2005). It means that in individualistic country cultures employees and
employers protect at first their own interest; thus, there is a higher risk of
production deviance in these societies. Therefore, there is a positive relationship
between IDV and production deviance. Thus, France and Poland, as
individualistic country cultures, have higher tendency of production deviance.
56
Presence of counter norms and “effect/danger” ratio
As it was mentioned in Chapter 3.1.3.2 part of this work, the bottom-line
mentality encourages financial success at the expense of other values. Hofstede
(2005) claims that masculine society, has decisive and aggressive behavior in
business environment; thus, the resolution of conflicts occurs by letting the
strongest win. This kind of behavior can encourage the bottom-line mentality;
thus, it increases the risk of deviance. Therefore, there is a positive relationship
between MAS and deviant workplace behavior. Consequently, Poles should be
more tended to reach financial success at the expense of other values than the
French, as Poles belong to masculine society and the French to feminine one.
However, it does not clearly indicate which of the countries is more tended to
presence of counter norms and “effect/danger” ratio. As a consequence, it is
difficult to explain the effect/danger ratio referring to cultural factors explained by
Hofstede (2005). Thus, we will consider it meaningless in our research.
3.3.2.3 Operational environment
Size of the company
Larger firms with greater resources are related to increased occurrence of
workplace deviance (Appelbaum et al., 2005). Hofstede (2005) mentioned that in
masculine societies there is a preference for larger organizations. Thus, there is a
higher risk of deviance in masculine country cultures. Therefore, there is a
positive relationship between MAS and deviance in general. As a consequence, in
Poland (masculine country culture) larger companies should prevail. Thus, there
is a higher risk of deviance inside Polish firms. In France (feminine country
culture) preference for smaller firms should prevail, thus a risk of deviance is
lower.
3.3.2.4 Supervisory behavior and justice
Discipline on wrongful acts
57
When leaders exercise discipline on wrongful acts within an organization, a
powerful signal about the value of organizational norms is sent to others (Trevino
and Brown, 2005). Discipline on wrongful acts could occur in country cultures
with small PDI, as the top management in these societies is perceived as less
autocratic and paternalistic than in societies with large PDI. This means that
management in small PDI countries could be less tended to reprimand culpable
employees. Thus, the societies with small PDI should be more tended to commit
deviance. Therefore, there is a negative relationship between PDI and deviance in
general. France and Poland have similarly large PDI; this means that their
management should be more autocratic and paternalistic; thus, the French and
Poles should be similarly less tended to commit deviance.
In feminine societies management is based on intuition and consensus, resolution
of conflicts occurs by compromise and negotiation and the management appears
less strict (Hofstede, 2005). In these societies culpable employees could be left
unpunished and the co-workers could take it as an example of injustice and
commit deviance in their turn. Thus, in feminine country cultures employees
should be more tended to commit deviance. Therefore, there is a negative
relationship between MAS and workplace deviance. As a result, France should
have a higher risk of deviance than Poland, as the latter is a masculine country
culture.
Finally, in countries with weaker UAI there are fewer rules, employees are hard-
working when needed and they are less bounded to the rules, thus, enjoy more
freedom (Hofstede, 2005). As a result, there should be a higher risk to break
company’s rules (commit deviance) in weaker UAI country cultures. Therefore,
there is a negative relationship between UAI and workplace deviance. Thus, both
the French and Poles should be less tended to commit deviance due to stronger
UAI.
To sum up, two dimensions (power distance and uncertainty avoidance) out of
three described in this part, show that both French and Polish employees are less
tended to commit deviance. As a result, there is no lucid explanation for tenure in
terms of cultural dimensions. Therefore, it is not relevant for our research.
58
Inequitable treatment
Inequitable treatment indicates workplace deviance as a response to being treated
inequitably (Henle, 2005; Robinson and Bennett, 2000). According to Hofstede
(2005) collectivistic societies are considered as more egalitarian than
individualistic country cultures. Therefore, inequitable treatment causes stronger
employees’ reactions in the collectivistic countries as they are not used to
inequitable treatment. Therefore, there is a negative relationship between IDV and
workplace deviance. As a result, both the French and Poles are less tended to
commit deviance.
Perceived injustice
Perceived injustice is very closely related to inequitable treatment factor, as both
indicate the same conditions to commit deviance; thus, perceived injustice can be
explained the same way as inequitable treatment (through IDV).
Company task structure
Keeping workers occupied with tasks that they will be asked to take responsibility
for will often lead to a lower likelihood that such employees engage in deviant
behaviors (Osgood et al., 1996). In masculine societies people live in order to
work and in feminine societies they work in order to live, this means that the
degree of occupation in masculine societies should be higher than in feminine
societies. As a result, there should be higher risk of deviance in feminine country
cultures than in masculine ones. Therefore, there is a negative relationship
between MAS and workplace deviance. In addition, according to Hofstede
(2005), in the societies with strong UAI “time is money”. Moreover, there is a
need to be busy and an inner urge to work hard. As a consequence, the societies
with strong UAI should be less tended to commit deviance than country cultures
with weaker UAI. Therefore, there is a negative relationship between UAI and
workplace deviance. Consequently, both Poland and France are less tended to
deviance.
According to masculinity-femininity dimension analysis, Poles are more tended to
commit deviance than the French, while according to uncertainty avoidance
59
analysis both Poles and the French are less tended to commit deviance. Therefore,
it could be assumed that actual deviance level could depend on the dimension
which prevails in the company. As a result, there is no single explanation for this
factor in terms of cultural dimensions.
Normlessness
Normlessness is the lack of acceptance of social expectations about behavior, thus
when individuals feel “bonded” to a social environment they will be less inclined
to commit deviant acts. The companies in which the business has more respect for
norms and the organizations which are more formally organized should have a
lower risk of deviance (Appelbaum et al., 2005). As mentioned above, a society
with stronger UAI (Hofstede, 2005) has an emotional need for rules; thus, the risk
of deviance is lower in this type of country culture. Therefore, there is a negative
relationship between UAI and workplace deviance. As a consequence, both
Poland and France are less tended to deviance.
Abusive supervision and employee’s perceptions of management style in
terms of uncertainty
According to Thau et al. (2008), positive relationship between abusive
supervision and supervisor- directed and organizational deviance is stronger for
employees who perceived high rather than low levels of uncertainty with respect
to management style. This means that when the employees perceive certain type
of uncertainty and hesitation arising from their management, they should be more
tended to deviant behavior.
In the country cultures with weaker UAI the management is closer to its
employees, less formal and tolerant for ambiguity (Hofstede, 2005). The intra
organizational climate seems more relaxed than in societies with stronger UAI.
The level of uncertainty is higher in less formal country cultures, which means
that the risk of deviant workplace behavior should be higher in weaker UAI
societies. Therefore, there is a negative relationship between UAI and
organizational deviance. Both France and Poland have strong UAI; as a
consequence, both the French and Poles are less tended to commit deviance.
60
3.3.3 Summary
In this chapter we have discussed types of deviant behaviour for separate factors
and its relation to culture. This lead to the theoretical assumptions about the
cultural dimensions’ impacts on deviant workplace behavior. In the table below
the summary of the cross-disciplinary analysis is provided. The table is divided
into five columns: 1) Factor 2) Types of deviance 3) Dimensions explaining the
factor 4) France 5) Poland. Column (1) shows the factors (described in Chapter
3.1). Column (2) indicates the types of deviance which arise from the factors (this
relationship is also explained in Chapter 3.1). Column (3) shows cultural
dimensions which correspond to factors conditions and can explain deviances
triggered by these factors. “+” or “–” in front of the dimension index in column
(3) indicates the direction of relationship between deviance and dimension
(positive or negative). Columns (4) and (5) indicate cultural dimensions influence
on deviant workplace behavior in France and Poland in accordance with country
cultural specific features described in Chapter 3.2. In e.g., gender might be a
reason of all types of deviance. Gender factor conditions are closely linked with
masculinity-femininity dimension. Thus, when deviance arises from gender
factor, masculinity-femininity dimension is positively related with deviance;
consequently, high MAS indicates high risk of deviance. As a result, France, as
feminine society, is less tended to deviance than Poland, which is masculine
society. The references and arguments for the assumed relations have been
presented in Chapter 3.3.1.1.
Table 3.4 Summary
Factors (1) Types of deviance (2)
Dimensions explaining the factor
(3)
France (4) Poland (5)
Person-based Perspective Demographic Factors Gender All types of
deviance +MAS Less tended to deviance
More tended to deviance
Tenure Property deviance +PDI -UAI
Ambiguous connections
Ambiguous connections
61
to deviance to deviance Education
All types of deviance xxx
Less tended to deviance
More tended to deviance
Age All types of deviance xxx
Less tended to deviance
More tended to deviance
Attitudes of Employees Theft approval
Property deviance -UAI
Less tended to deviance
Less tended to deviance
Intent to quit
Organizational deviance +PDI
More tended to deviance
More tended to deviance
Psychological state of employee Frustration Interpersonal
deviance +UAI More tended to deviance
More tended to deviance
Situation-based Perspective Group behaviors Deviant role models
All types of deviance
-IDV Less tended to deviance
Less tended to deviance
Multitude of ethnic differences between workers
All types of deviance
xxx xxx xxx
Ethical Climate In the Organization Competitive Environment: intra-organizational competition
All types of deviance
+IDV
More tended to deviance
More tended to deviance
Caring climate
Political deviance +MAS
Less tended to deviance
More tended to deviance
Climates of rules and professionalism
Property deviance
-UAI
Less tended to deviance
Less tended to deviance
Instrumental climates
Production deviance +IDV
More tended to deviance
More tended to deviance
Presence of Counter Norms
All types of deviance xxx xxx xxx
Operational environment Size of the company
All types of deviance
+MAS Less tended to deviance
More tended to
62
deviance Supervisory behavior and justice Discipline on Wrongful Acts
All types of deviance
-PDI -MAS -UAI
Ambiguous connections to deviance
Ambiguous connections to deviance
Inequitable Treatment
All types of deviance
-IDV Less tended to deviance
Less tended to deviance
Perceived Injustice
All types of deviance
-IDV Less tended to deviance
Less tended to deviance
Company Task Structure
All types of deviance
-UAI -MAS
Ambiguous connections to deviance
Ambiguous connections to deviance
Normlessness All types of deviance
-UAI Less tended to deviance
Less tended to deviance
Abusive supervision and employee’s perceptions of management style in terms of uncertainty
Organizational deviance
-UAI
Less tended to deviance
Less tended to deviance
3.4 Hypotheses establishment
In total we have identified 21 factor of deviant workplace behavior. Four of them
(Age, Education, Multitude of ethnic differences between workers and Presence of
counter norms) could not be explained by cultural dimensions; however, not all
the rest 18 factor-dimension connections are appropriate to identify the country
culture influence on deviant workplace behavior. Thus, to verify the hypothesis,
we needed to reject the factor-dimension links which are irrelevant for our
research. Therefore, factor-dimension connections had to satisfy certain criteria:
• One of the criteria for not rejecting certain factors was lucidity of
connections to the cultural dimensions. This means that the factor has to
be linked only to one cultural dimension. The factors linked to more than
one dimension have to be excluded because they provide ambiguous
results; thus, we cannot define the relationship between types of deviance
and cultural dimensions. As it is summarized in the table 3.4, Tenure,
Company task structure and Discipline on wrongful acts factors can be
63
explained by more than one dimension; thus, we have rejected them from
further research.
• We wanted to conduct our research referring to the cultural similarities,
not differences between French and Polish societies. Thus, in order to be
relevant factor must be explained by one of three cultural dimensions PDI,
IDV and UAI, because both countries are similar according to these
dimensions. Due to this limitation, we exclude Gender, Multitude of ethnic
differences between workers, Effect/Danger ratio, Caring climate and Size
of the company factors.
Finally, from the remained factors we have identified the mainstream factors that
cover principal predictors of deviant workplace behavior and all types of deviance
(interpersonal and organizational) described in the Chapter 3.1. Hence, some of
the predictors were incorporated into one main factor. In this way eleven factors
were incorporated into nine mainstream factors. The factor Normlessness was
grouped with Climates of rules and professionalism as they both deal with the
rules inside the organization. The factor Perceived injustice is also incorporated as
justice inside organizations is closely related to Inequitable treatment factor.
Thus, the factors that will be used when deriving hypotheses are:
6. Climates of rules and professionalism (+ normlessness)
7. Instrumental climates
8. Inequitable treatment (+ perceived injustice)
9. Abusive supervision and employee’s perceptions of management style in
terms of uncertainty
After rejection of irrelevant factors and compilation of very closely related
predictors of deviance, referring to summary chart 3.4, we can develop the
hypotheses.
64
According to Bolin and Heatherly (2001), theft approval, which is linked to the
lack of rules and regulations within a society, is a predictor of property deviance.
This factor, described in part 3.3.1.2, is explained by uncertainty avoidance
dimension as, according to Hofstede (2005), strong UAI societies have an
emotional need for rules and are used to follow the regulations; thus, they are not
tended to theft approval and, consequently, to property deviance. Hence, strong
UAI should indicate low risk of property deviance. Thus, we assume:
Hypothesis 1: When the deviance arises from theft approval factor, there is a
negative relationship between UAI and property deviance.
According to Bolin and Heatherly (2001), intent to quit, which is linked to the
lack of loyalty of an employee, is a predictor of organizational deviance. This
factor, described in part 3.3.1.2, is explained by power distance dimension as,
according to Hofstede (2005), employees of large PDI societies are less loyal;
thus, more often intend to quit job and consequently are more tended to commit
organizational deviance. Hence, large PDI should indicate high risk of
organizational deviance. Thus, we assume:
Hypothesis 2: When the deviance arises due to intent to quit factor, there is a
positive relationship between PDI and organizational deviance.
According to Robinson and Bennett (2000), frustration, which occurs due to the
anxiety of an employee, is a predictor of interpersonal deviance. This factor,
described in part 3.3.1.3, is explained by uncertainty avoidance dimension as,
according to Hofstede (2005), strong UAI societies are more anxious; thus, they
are more tended to frustration and, consequently, to interpersonal deviance.
Hence, high UAI should indicate high risk of interpersonal deviance. Thus, we
assume:
Hypothesis 3: When the deviance arises from frustration factor, there is a
positive relationship between UAI and interpersonal deviance.
According to Appelbaum et al. (2005, 2007), deviant role models, which are liked
to an in-group commitment of an employee, predict all types of deviance. This
factor, described in part 3.3.2.1, is explained by individualism-collectivism
65
dimension because, according to Hofstede (2005), in collectivistic societies co-
workers have a bigger influence on each other; thus, employees induce others
within the group to commit acts of deviance. Hence, high IDV should indicate
low risk of all types of deviance. Thus, we assume:
Hypothesis 4: When the deviance arises from deviant role models factor, there is
a negative relationship between IDV and workplace deviance.
According to Kulik et al. (2008), competition is a predictor of all types of
deviance. This factor, described in part 3.3.2.2, is explained by individualism-
collectivism dimension as, according to Hofstede (2005), in collectivistic societies
there is less competition between employees of the same company; consequently,
collectivistic countries should be less tended to deviance. Hence, high IDV should
indicate high risk of all types of deviance. Thus, we assume:
Hypothesis 5: When the deviance arises from competition factor, there is a
positive relationship between IDV and workplace deviance.
According to Peterson (2002), instrumental climate, which is linked with a degree
of self-interest while accomplishing the tasks, is a predictor of production
deviance. This factor, described in part 3.3.2.2, is explained by individualism-
collectivism dimension as, according to Hofstede (2005), in individualistic
country cultures employees and employers protect at first their own interest; thus,
organizations of individualistic countries are more likely to suffer from production
deviance. Hence, high IDV should indicate high risk of production deviance.
Thus, we assume:
Hypothesis 6: When the deviance arises from instrumental climate factor, there is
a positive relationship between IDV and production deviance.
According to Peterson (2002), inequitable treatment is a predictor of all types of
deviance. This factor, described in part 3.3.2.4, is explained by individualism-
collectivism dimension because, according to Hofstede (2005), employees in
collectivistic societies are less used to be treated unfair; thus, inequitable
treatment in collectivistic countries causes stronger reactions and, consequently,
deviant behavior. Hence, high IDV should indicate low risk of all types of
deviance. Thus, we assume:
66
Hypothesis 7: When the deviance arises from inequitable treatment and perceived
injustice factor, there is a negative relationship between IDV and workplace
deviance.
According to Peterson (2002), climate of rules is a predictor of property deviance.
This factor, described in part 3.3.2.2, is explained by uncertainty avoidance
dimension as, according to Hofstede (2005), Kolman et al. (2003) and Mole
(2003) strong UAI societies accord high importance to the rules; thus, in these
societies climate of rules is strict and consequently employees should have limited
possibilities to commit property deviance. Hence, high UAI should indicate low
risk of property deviance. Thus, we assume:
Hypothesis 8: When the deviance arises from climates of rules factor, there is a
negative relationship between UAI and property deviance.
According to Thau et al. (2008), perceived management uncertainty is a predictor
of organizational deviance. This factor, described in part 3.3.2.4, is explained by
uncertainty avoidance dimension as, according to Hofstede (2005), in weaker UAI
societies the level of uncertainty is higher and consequently employees should be
more tended to organizational deviance. Hence, high UAI should indicate low
risk of organizational deviance. Thus, we assume:
Hypothesis 9: When the deviance arises from perceived management uncertainty
factor, there is a negative relationship between UAI and organizational deviance.
To conclude, within theoretical framework we have discussed different
connections: the relations between factors and types of deviance (presented in
Chapter 3.1), the interconnection between cultural dimensions and factor
conditions (evolved in Chapter 3.3) which lead to the link between cultural
dimensions and types of deviance. Through these connections we have developed
nine hypotheses that will be tested in Chapter 5.
67
4. Empirical method
In this chapter alternative approaches are discussed to collect information
referring to the problem and aim of our research. Motivated decisions about
what, why and how the data has been collected are provided. The chapter ends
with the summary of empirical method used in the research.
According to Jankowicz (2000, p.209), “empirical method is a systematic and
orderly approach taken towards the collection and analysis of data so that
information can be obtained from those data.” Our empirical research consists of a
survey of business students from different countries which should reflect the
problem on the individual level. Hence, our study is based on primary data which
was analyzed using quantitative techniques. The motivation for empirical method
choice is provided below.
4.1 Research strategy
There are several kinds of research strategies: experiment, survey, case study,
grounded theory, ethnography, action research, cross-sectional and longitudinal
studies, as well as explanatory, descriptive and exploratory studies (Saunders et
al., 2007; p. 135). In this research we needed a primary data; thus, we chose to use
the survey strategy.
There were different reasons for choosing survey strategy. According to Saunders
et al. (2007), a survey strategy is usually associated with a deductive approach. As
our research is basically deductive, a survey strategy was the most suitable. In
addition, as our research is quantitative, we needed a large number of respondents
and survey strategy enabled us to have a sufficient number of responses within a
short time frame and low costs. The choice to conduct survey is also based on the
need to easily reach our respondents as they are situated abroad (Poland and
France). Therefore, data was obtained through e-mail questionnaires. As we were
unable to conduct interviews with our respondents, data collected through a
68
survey strategy is unlikely to be as wide-ranging as data collected by other
research strategies. However, even though survey cannot provide in-depth look of
the situation, in our study the data collected via survey was sufficient as we aimed
at quantitative research.
4.2 Data Collection Method
To answer our research aim, we needed information about the patterns of deviance
arising from cultural traits. This information could be identified from the
individual’s general perceptions about the deviance not connected to certain
workplace. As there were no secondary data available, primary data research had
to be conducted. Hence, primary data was used to retrieve the information
concerning deviance on the individual, and not on the organizational level.
We have considered two options to collect primary data, using questionnaire or
interview. Out of these two types we have chosen questionnaire type of data
collection because it was the only way (also the easiest and cheapest) to reach our
respondents within the time frame, as they are all abroad. Moreover, a
questionnaire requires less skills and sensitivity to administer than semi-structured
or in depth interviews. In addition, the questions were standardized and close-
ended; therefore, we considered questionnaire more suitable as data collection
method than interviews.
Primary data was collected by self-administered internet-mediated
questionnaire3 which can be found in Appendix 1. “Self-administered internet-
mediated questionnaire” means that it was completed and administrated
electronically using the internet. We have chosen this type of questionnaire in
order to reach larger and geographically dispersed sample (French and Polish
students). Moreover, the likelihood of contamination and distortion of
respondents answers is low since it is not biased by the interviewers (us). Also it
takes less time for the respondents to answer than filling in a “Word document”;
3 The questionnaire could be retrieved on this website: http://www.publika.lt/lt/apklausa-15-26e0b9d63fec68473e9c049061fc2749.html
69
therefore, the response rate was expected to be higher than using other techniques.
Moreover, we think that the chance that right person has answered is high since it
was sent by email to existing contacts (e-mail addresses were found using sources
of the International Office at Kristianstad University College).
4.3 Population
According to Hussey (1997, p. 55), “population is any precisely set of people or
collection of items which is under consideration.” Our population consists of
Polish and French business students. We chose these countries due to their link
with different prejudices about Eastern/Western European blocks described in
Chapter 1.1. However, even though both countries are different referring to their
historical and economic backgrounds, culturally they are quite similar if we refer
to Hofstede (2005). Thus, focus on cultural resemblance could challenge the
prejudice and provide more interesting and unexpected results. The reason of
choosing French and Polish business students is that, in order to trace the patterns
of deviance in France and Poland arising from cultural traits, we needed a
population which is not affected by workplace environment, but which is aware
about the situation in business; thus, business students were the best choice in this
case.
To sum up, in this research the population could be identified as all business
students in France and Poland. As the total population is big, it was impossible to
collect data from every student. Therefore, we have chosen to use sampling
procedure instead of census.
4.4 Samples
As it was mentioned above, to collect the data about population, we have chosen
sampling procedure which, according to Hussey (1997, p.224), “is the study of
relationships existing between population and samples drawn from it”. Referring
to the same author (1997, p. 55), a sample “is a subset of a population and should
70
represent the main interest of the study.” Referring to this definition and
description of the population, we have two unrelated samples: Polish and French
business students samples. In this part we will discuss how the samples were
selected and provide their description.
4.4.1 Samples selection
As mentioned above, in order to achieve higher response rate and avoid distortion
of respondents, the questionnaire was sent to existing contacts. Therefore, non-
probability self-selection sampling technique was used for both samples. Non-
probability sampling means that probability of each case being selected from total
population is not known. For conclusions of sampling theory to be valid, the
chosen samples must be achieved through random sampling. However, we were
still able to make generalizations from our non-probability samples about the
population, but not on statistical grounds. Self-selection sampling occurs when
“we allow each case, usually individuals, to identify their desire to take part in the
research” (Saunders et al., 2007, p. 233). In our case, the survey was conducted
using internet based tool of collecting data. The link to the questionnaire was sent
by email; therefore, if the students wanted to participate in this survey, they could
retrieve the questionnaire webpage.
4.4.2 Samples description
In total we had 54 respondents. 56% of respondents are females and 44% males.
As you can see in Table 4.1, their age ranges from 20 to 26 years. The Average
age is 22. They are in their second to sixth year of studies. Most of students (72.2
%) had professional work experience.
Table 4.1 Main characteristics of the sample
Characteristics France Poland Total Number of respondents 29 25 54 Gender composition: Female Male
51.7% 48.3%
64% 36 %
56 % 44 %
71
Average age 21 years 23 years 22 years Average year of studies 3rd year 5th year 3rd year Professional experience 82,8% 60 % 72,2 % Average length of experience 4 months 4 months 5 months
France
The French sample consists of 29 respondents with almost equal gender
proportions. Their age ranges from 20 to 26 years. The average age is 21. They
are in their second to fifth year of studies. Majority (65 %) of them study business
in the third year. Most of the French students (82.8 %) had professional work
experience which on average lasted for four months. The longest work experience
was more than one year.
Poland
The Polish sample consists of 25 respondents with 64% females and 36 % males.
Their age ranges from 21 to 26 years. The average age is 23. They are in their
third to sixth year of studies. The majority (52 %) of them study business in the
fifth year. More than half of the Polish students (60 %) had professional work
experience which on average lasted for four months.
To compare the French and Polish samples, the French sample is bigger than
Polish by four respondents. Polish sample has slightly more females then the
French. However, gender dimension should not affect the final result because
none of the genders was obviously dominating. The Polish respondents are a little
bit older than the French; therefore, they are also further in their studies than
French. Paradoxically, even though French students are earlier in their studies,
more French than Polish respondents had professional work experience. This
could be explained by different educational systems. Most likely in Poland
practical placements are not incorporated in study programs. However, the
average length of professional work experience is equal and in general both
samples are not much affected by business environment as work experiences were
not long. Therefore, we can predict that their inclinations to deviant behavior arise
from cultural background, not from the business environment they are in.
72
To conclude, even though there are slight differences between the Polish and
French samples characteristics, the differences are not big. Therefore, both
samples could be considered relatively homogeneous and the characteristic which
mostly influences the result should be country of origin.
4.5 Operationalization
According to Saunders (2007, p. 605), operationalization is the “translation of
concepts into tangible indicators of their existence”. Thus, in this part we will
explain what we measured in each question of the survey and how it was used to
evaluate the hypotheses.
In order to verify the hypotheses, in each question of the survey we have
measured different types of data variable. According to Saunders (2007), there are
three types of data variable that can be collected through questionnaire: opinion,
behavior or attribute. Opinion variables record how respondents feel about
something or they think or believe is true or false (in our questionnaire questions
6, 10, 12 and 13 provide data on opinions). Behavior variables record concrete
experiences and these variables contain data on what people did in the past, are
doing now or will do in the future (in our case questions 7, 8, 9, 11 and 14 record
data on behaviors). By contrast, attribute variables contain data about
respondents’ characteristics. They are used to explore how opinions or behavior
differ between respondents as well as to check that the data collected are
representative of the total population (first five questions of our questionnaire are
attribute questions and they were used just for sample description). To sum up, in
our questionnaire we used all three types of data variable; however only opinion
and behavior types of data variable contribute to hypotheses testing as attribute
data variable were used just as background information, thus, we have not
discussed them more in this part (types of data variable revealed in different
questions are summarized in the Table 4.2).
73
In our research each hypothesis derived in Chapter 3.4 is examined by one
question which was tested by both samples. Therefore, in our empirical research
culture is measured by belongingness (country of origin of the sample), thus, each
hypotheses is evaluated based on the comparison of the samples’ (Poles and the
French) responses. Questions for these two samples measure a tendency to
commit a certain type of deviance arising from a specific factor. The questions
themselves describe the situations which reflect the conditions of the factor (in
e.g., question 6 inclines theft approval factor). We have nine hypotheses assessed
in nine questions (the answers to every question are segmented into two different
groups: France and Poland) that are described below in the same order as
established in questionnaire which is presented in Appendix 1.
Hypothesis 1
When the deviance arises from theft approval factor, there is a negative
relationship between UAI and property deviance
The sixth question, which reflects theft approval factor, analyzes the tendency of
both, Poles and the French, to commit property deviance. This question is built as
a statement and the answers were expressed in Likert-style rating scale. Thus, the
respondents had to choose between strongly agreeing and strongly disagreeing
with proposition. The answer “strongly agree” shows that respondent approves
theft and is strongly tended to commit property deviance, while “strongly
disagree” inclined honesty, thus no tendency to commit property deviance.
According to our theoretical assumptions (Table 3.4), both country cultures are
not tended to property deviance. Thus, the hypothesis will be accepted if
empirical research indicates similar results.
Hypothesis 2
The seventh question of our questionnaire analyzes the tendency of both Poles and
the French to commit organizational deviance arising from intent to quit factor.
The question is built as a scenario and the variants of answers represent different
types of organizational deviance. The first answer indicates the tendency to
commit a theft, the second answer - absenteeism, the third answer - privilege
abuse, and finally, the fourth answer shows that individuals are not tended to
commit deviance. Respondents were allowed to choose more than one answer;
74
thus, in addition to general review of answers, we analyzed every answer variant
as a separate question as each of the variants represents different types of
organizational deviance. According to our theoretical assumptions (Table 3.4),
both country cultures are tended to organizational deviance. Thus, the hypothesis
will be accepted if empirical research indicates similar results.
Hypothesis 3
Via frustration factor perspective the eighth question analyzes the tendency of the
French and Poles to commit interpersonal deviance. This question is built as a
scenario and the variants of answers represent both types of interpersonal
deviance (political deviance and personal aggression). First two answers show the
tendency to commit political deviance (gossiping (first variant) and favoritism
(second variant) within a company); the two following answers show the tendency
to commit personal aggression (verbal abuse (third variant) and harassment
(fourth variant) within a firm). The last answer indicates that respondent is not
tended to deviance. As students were allowed to choose more than one answer, in
addition to general review of answers, we analyzed every answer variant as a
separate question as each of the variants represent different types of interpersonal
deviance. According to our theoretical assumptions (Table 3.4), both country
cultures are tended to interpersonal deviance. Thus, the hypothesis will be
accepted if empirical research indicates similar results.
Hypothesis 4
The ninth question of our questionnaire analyzes the tendency of both, Poles and
Frenchmen, to commit all types of deviance in connection with in-group
behaviors (deviant role models factor). The question was built as a scenario and
the answers were expressed in an ordinal manner. The sample had to choose
between three different answers which indicate if they would deviate, and how
likely it is to happen. Answer one means that respondent disagrees with deviant
behavior within a group (consequently, this indicates no tendency to commit
deviant acts). Second answer is analogous to “neither agree nor disagree” in
Likert-style rating scale. Third answer shows that respondent would join the group
committing deviance (in-group solidarity).This indicates high possibility to act
deviantly. According to our theoretical assumptions (Table 3.4), both country
75
cultures are not tended to deviance. Thus, the hypothesis will be accepted if
empirical research indicates similar results.
Hypothesis 5
The tenth question of our questionnaire analyzes the tendency of both, Poles and
Frenchmen, to commit interpersonal and organizational deviance which arises
from competition. The answers to this question represent different opinions
concerning perceptions about world of business. According to Kulik et al. (2008),
high level of competitiveness indicates high possibility to commit deviance. First
answer indicates high competitiveness (high possibility for organizational and
interpersonal deviances), second answer shows high tendency to commit bribery
and corruption (organizational deviance), third answer indicates lower
competitiveness (lower possibility for deviance) and the last answer means that
individual is not tended to deviance arising from competition. According to our
theoretical assumptions (Table 3.4), both country cultures are tended to deviance.
Thus, the hypothesis will be accepted if empirical research indicates similar
results.
Hypothesis 6
The eleventh question of our questionnaire analyzes the tendency of both, Poles
and Frenchmen, to commit production deviance which arises due to instrumental
climate. The question was made as a scenario and respondents had to choose
between four different answers which indicate different types of production
deviance. Answer one, two and three show inclination to production deviance
while last answer shows no tendency to commit production deviance. According
to our theoretical assumptions (Table 3.4), both country cultures are tended to
production deviance. Thus, the hypothesis will be accepted if empirical research
indicates similar results.
Hypothesis 7
The twelfth question of our questionnaire analyzes the tendency of both, Poles
and Frenchmen, to commit all types of deviance as a response to inequitable
treatment. This question was made as a scenario externalized by the statement and
the answers were expressed in Likert-style rating scale. Thus, the respondents had
76
to choose between strongly agreeing and strongly disagreeing with proposition. It
is ordinal type of question in which answer “strongly agree” shows that
respondent is strongly tended to commit workplace deviance, while “strongly
disagree” inclined honesty, thus no tendency to commit workplace deviance
arising from inequitable and unjust treatment. According to our theoretical
assumptions (Table 3.4), both country cultures are not tended to deviance. Thus,
the hypothesis will be accepted if empirical research indicates similar results.
Hypothesis 8
The thirteenth question of our questionnaire analyzes the tendency of Poles and
Frenchmen to commit property deviance which arises due to climate of rules. The
question is formed as a statement and the sample had to choose between agreeing
and disagreeing to this statement which means that answers were expressed in
Likert-style rating scale. It is an ordinal type of question in which answer
“strongly agree” indicates that a respondent is strongly tended to property
deviance while “strongly disagree” inclined honesty, thus no tendency to commit
property deviance. According to our theoretical assumptions (Table 3.4), both
country cultures are not tended to property deviance. Thus, the hypothesis will be
accepted if empirical research indicates similar results.
Hypothesis 9
The fourteenth question of our questionnaire analyzes the tendency of both Poles
and the French to commit organizational deviance which arises from perceived
management uncertainty factor. The question was built as a scenario. The
respondents had to choose between five different answers which show if and how
they would deviate. First answer embodies hard property deviance and the second
one purports production deviance. Third answer does not show any tendency of
deviance and, if it was Likert-style rating scale answer, it would correspond to
“Neither agree, nor disagree” variant. The last two answers indicate that
respondent is not inclined to commit organizational deviance when he/she
perceives management’ uncertainty. According to our theoretical assumptions
(Table 3.4), both country cultures are not tended to organizational deviance. Thus,
the hypothesis will be accepted if empirical research indicates similar results.
77
The procedure how these hypotheses were verified will be explained in detail in
Chapter 5.
4.6 Questionnaire
As our research topic is quite sensitive (it requires caution and tact because
responds are not willing to reveal this part of their personality), the questionnaire
was formed not by asking direct questions concerning deviance but by giving
scenarios. Regardless of the country the questionnaire was sent to, it was written
in English in order to reduce translation mistakes. Together with the
questionnaire, a personal cover letter was delivered. In this cover letter a short
presentation of the research was provided, however, the real research topic
(workplace deviance) was not revealed in order to get less biased answers.
Confidentiality and anonymity were promised to all participants. Five days after
since the questionnaire was sent out, a follow-up email was written to thank the
respondents and remind about the questionnaire. On average, our respondents
needed around eight minutes to answer the questionnaire which consisted of 14
questions. More detailed explanation of the composition will follow below.
4.6.1 Types of questions
This questionnaire included a combination of open and closed questions;
however, closed questions dominated as out of 14 questions only one was open
(question 3). Open questions allow respondents to give answers in their own way.
Closed questions provide a number of alternative answers from which the
respondent is instructed to choose (Saunders et al., 2007). We have chosen to
have a majority of closed questions as they are best suited for quantitative type of
research, because it is easier and faster to answer closed questions and responses
are easier to compare as they are predetermined. We have used list, category and
rating types of closed questions. List questions (questions 7, 8) offered
respondents a list of responses, any of which they could choose. In contrast,
category questions (questions 1, 2, 4, 5, 10, 11) are designed so that each
78
respondent’s answers can fit only one category. Rating questions (questions 6, 9,
12, 13, 14) were used to collect opinion data. In our questionnaire we have used
Likert-style rating scale (in questions 6, 12, 13) in which the respondent was
asked how strongly he or she agrees or disagrees with a statement. In order to
have a true view about the situation, in Likert-style rating questions an odd
number of points (five) were used so that the respondents would not be forced to
have an opinion. We consider questions 9, 14 rating questions, as well, even
though Likert-style rating scale was not used; however, answers also show
ascending or descending tendency to deviance.
To generalize, in our questionnaire we have mostly used list or rating type
questions because in these type of questions it is easy to reverse qualitative
answers into quantitative data and which can than be analyzed.
4.6.2 Data types
According to Saunders et al. (2007), there are different levels of numerical
measurement which dictate the range of techniques available for the analysis of
data; therefore, before choosing data analysis techniques it is essential to identify
what data types different questionnaire questions provide. Quantitative data can
be divided into two distinct groups: quantifiable and categorical.
Quantifiable data are those whose values are measured numerically as quantities.
Only question 3 corresponded to quantifiable data, but it was only background
question; thus, quantifiable data will not be discussed further. According to
Saunders et al. (2007, p.409), categorical data refer to “data whose values cannot
be measured numerically but can be either classified into categories according to
the characteristics that identify or describe the variables or placed in rank order”.
It can be further subdivided into descriptive and ranked. According to Hussey
(1997, p.183), descriptive (nominal) data is “a measure which only permits data
to be classified into named categories.” Ranked (ordinal) data is “a measure
which permits nominal data to be ordered or ranked” (Hussey, 1997, p.183).
79
In our research values could not be measured as quantities, thus our data are
categorical. In this survey all list and category questions provide nominal data
while all rank questions provide ordinal data. The questionnaire composition is
summarized in the table below.
Table 4.2 Composition of the questionnaire
Question Types of data variable
Types of questions
Data types
1 Attribute Category Nominal
2 Attribute Category Nominal
3 Attribute Open Quantifiable
4 Attribute Category Nominal
5 Attribute Category Nominal
6 Opinions Rating Ordinal
7 Behavior List Nominal
8 Behavior List Nominal
9 Behavior Rating Ordinal
10 Opinions Category Nominal
11 Behavior Category Nominal
12 Opinions Rating Ordinal
13 Opinions Rating Ordinal
14 Behavior Rating Ordinal
4.7 Response rate
In total we have sent 30 e-mails to Polish and French business students with the
link to questionnaire. As we personally knew these students, we asked to forward
the link to the questionnaire to their classmates. Thus, we do not know how many
students exactly have received our covering letter and questionnaire. Therefore,
we counted response rate as a ratio between the responses to questionnaire and
total number of questionnaire visitors. In total 130 business students from France
and Poland visited the questionnaire website and we received 54 (25 Poles and 29
French) responses. Thus, the response rate was 41.5%. This is a very approximate
count; however, more accurate calculations are not possible. In general, the
number of responses was sufficient for quantitative analysis.
80
4.8 Data analysis
The survey data were analyzed using quantitative data analysis techniques.
According to Hussey (1997), there are two main ways to analyze quantitative
data-exploratory data analysis and confirmatory data analysis. We have
employed both types of analysis.
Exploratory data analysis was used to summarize and display survey data
(initial analysis) and it displays how countries tend to deviate. We have chosen to
use this type of analysis because it allows drawing some conclusions even if the
data do not justify statistical rigor in confirmatory data analysis. In the exploratory
analysis we use tables and graphical forms techniques to present frequencies of
the answers. In order to have more sophisticated and accurate results, we tested
survey data using confirmatory data analysis.
According to Hussey (1997, p.187), confirmatory data analysis is an analysis
which “involves using quantitative data collected from a sample about complete
population.” The aim of this confirmatory data analysis was to verify if the
difference between the French and Polish answers is statistically significant and
not merely due to random variables. We would like to underline that in
confirmatory data analysis we test Hypothesis 0 (H0) and Hypothesis 1 (H1)
which should not be mixed with our main nine hypotheses derived from
theoretical analysis. Confirmatory data analysis (with H0 and H1) is just a part of
our hypotheses testing procedure which were described in detail in part
“Operationalization”. Thus, H1 (which means that there is a significant difference
between Poles and the French answers) and H0 (which means that there is no
significant difference between Poles and the French answers) are used in all of the
nine main hypotheses testing procedures.
There are different tests that can be employed in a confirmatory data analysis. The
choice of the test mainly depends on the nature of the data and samples. Our
samples (French and Polish respondents) were independent; therefore, our
hypotheses could predict difference. As our data were categorical, there is not a
very big choice of tests that could be employed. Consequently, we decided to use
81
the cross tab Chi squared test for nominal data and the Mann-Whitney U test for
ordinal data, as these techniques are most commonly used for these types of data
in independent samples analysis.
After the exploratory and confirmatory data analysis, common exploratory and
confirmatory data analyses conclusions are made which enabled us to identify if
country culture influences deviant behavior and how.
4.9 Credibility of research findings
Problems of empirical evaluations arise when developed theory is transferred
through empirical testing into the reality. Some questions in the theory are
difficult to operationalize and it is possible to get wrong answers showing a
distorted picture of the reality. According to Saunders et al. (2007) “reducing the
possibility of getting the answer wrong means that attention has to be paid to two
particular emphases on research design: reliability and validity” (p.149).
Generalisability which also called “external validity” (Saunders et al., 2007, p.
151) is also has to be considered in the process of the research. Hence, reliability,
validity and generaliability are crucial parts of credibility discussion and will be
presented below.
4.9.1. Reliability
Reliability refers to extent to which the data collection techniques or analysis
procedures will yield consistent findings (Saunders et al., 2007, p. 149).
Reliability is given every time the operationalization for the same research topic
gives similar results and concerns with the robustness of the research and should
provide consistent findings under different conditions. It could be predicted that
repeated survey of this research should provide similar results because the
questionnaire is standardized and the focus group of respondents is quite
homogeneous. As re-test should still be done with business students (focus
group), their age, educational background, professional experience length
82
variables would not significantly differ from the primary sample; therefore, we
could expect similar results. Moreover, since the survey was mediated via
internet, there was no bias between respondents and operators of the research (us)
as it could be in the case of interview; therefore, respondents could not be
influenced by us and they would not respond differently if there was another
operator. Due to the factors mentioned above, we predict that this research is
reliable. Nevertheless, to prove reliability, a re-test under equivalent conditions
would be necessary; however, due to the time limitations such a test could not be
conducted.
4.9.2 Validity
“Validity is concerned with whether the findings are really about what they appear
to be about” (Saunders et al., 2007, p.151). This means that the operationalization
must be correct and the intended variables are measured.
In our research we expect a high validity because theoretical and empirical parts
are strongly connected. The hypotheses derived from the theoretical part were
used as bases for the empirical research. These hypotheses were developed
referring to in the theoretical framework discussed variables which include the
factors of deviance (summarized in Table 3.1), types of deviance (described in
Figure 3.2), three cultural dimensions (UAI, IDV, PDI) (described in Table 3.2)
that underline similarities between France and Poland and the interconnection
between types of deviance and dimensions presented in Table 3.4. Hence,
hypotheses reflect the theoretical assumptions which were tested in empirics. The
questionnaire of our survey was built referring to the hypotheses (as it was
explained in the “Operationalization”, each question corresponds to one
hypothesis). Thus, questions represented the most important deviance factors in
relation to types of deviance which were analyzed from cultural dimensions
perspective. As a consequence, empirical conclusions of the research were made
referring to the conclusions of the theoretical framework provided in the Table
3.4. To summarize the research process, theoretical framework was used to
establish hypotheses which were tested in empirical research and paralleled to
83
theoretical findings. Thus, the research process could be compared to closed
circle. Therefore, research findings correspond to our hypotheses and reflect how
country culture affects deviant workplace behavior. Consequently, this indicates
high validity.
4.9.3 Generalisibility
Generalisability expresses the extent to which research results are generalisable:
that is, whether your findings may be equally applicable to other research settings,
such as other organizations. (Saunders et al., 2007, p.151). It could also refer to
external validity. Hussey (1997, p.58) also explains it as “an extent to which you
can come to conclusions about population based about the information about
sample”. As our samples were not chosen randomly, probability of each case
being selected from total population is not known. Therefore, even though we are
still able to make generalizations from our non-probability sample, they do not
have statistical averment. Moreover, the sample is still relatively small. Hence, we
consider this research to have limited generalisability.
4.10 Critique
This research is very complex in general since it deals with a very delicate
problem. Even though we tried to avoid bigger mistakes, some improvements
could be made. Possible problems of the research are listed below:
- The response rate referred to an approximate estimation; however, a more
accurate number was not possible to retrieve.
- Even though the sample size was sufficient for statistical analysis, a bigger
sample could provide more accurate results and increase the level of
significance.
84
- To prove reliability, a re-test is needed. It was not conducted due to the
lack of time.
- The generalisability is limited. For conclusions of sampling theory to be
valid, the chosen samples must be achieved not through non-probability
but through random sampling.
- There might have been problems with language interpretation since the
respondents were not native speakers. However, we wanted to avoid
translation mistakes. Moreover, most of the respondents had studied
abroad, thus, we assumed that their language skills should be sufficient to
fill in this questionnaire.
4.11 Summary
In our quantitative research the survey strategy was used for primary data
collection. This data was collected by self-administered internet-mediated
questionnaire. The questionnaire was built referring to the hypotheses derived
from theoretical review. To select the respondents we have used non-probability
self-selection sampling technique. Approximate response rate was 42%. This
survey represented an individual level approach of the problem since the samples
consisted of Polish and French business students. As they are not affected by
organizational culture, the survey results should represent an outcome related only
to cultural background as an organizational influence was eliminated. Validity of
the research is high, while reliability can only be predicted to be relatively high as
a re-test is needed to prove it. Generalisability is limited because it does not have
the statistic proof; nevertheless, generalizations not on the statistical basis can be
done.
85
5. Analysis
In this chapter the analysis of the survey data about the workplace deviance in
Poland and France are discussed. First of all, data analysis which led to
empirical results is presented. After that, hypotheses evaluation and explanations
of the results are discussed. In the end of this chapter summary of the findings and
critical reflections are provided.
5.1 Introduction to analysis
The main goal of this research is to evaluate the hypotheses established in chapter
3.4 and consequently to identify the interconnection between cultural dimensions
and certain types of deviance. As we have discussed before, we have generated
nine questions (that correspond to our hypotheses) which have provided data for
the analysis of Polish and French samples tendencies towards certain types of
deviance.
In our research hypotheses testing and evaluation procedure contained several
steps. Firstly, we have checked the tendencies of both countries to commit certain
types of deviance referring to the exploratory data analysis outcome. Secondly,
we have tested the significance of difference between Poles and the French
tendencies to deviant behavior referring to confirmatory data analysis. As in our
study we focused on cultural similarities and the hypotheses contained only
cultural dimensions according to which France and Poland are similar, according
to the theory, the responses to the questions could not be significantly different. It
means that the significance level which indicates how significantly different are
Polish and French answers had to be higher than 10% (p-value>0.1), according to
our theoretical findings. Otherwise, the hypothesis had to be rejected. The next
steps in hypothesis evaluation procedure were to identify general tendency which
indicates if and how Poles and the French are tended to deviant workplace
behavior and to compare these results with theoretical outcome (provided in Table
3.4). It means that if it has been identified that there is no significant difference
between the French and Poles answers (significance level was higher than 10%),
86
then we have identified the general tendency for both countries (in e.g., both
tended or both not tended to deviance). This common tendency has been
identified referring to exploratory analysis results. Finally, empirically derived
general tendency to deviance had to be compared with theoretical assumptions
which were suggested after linking various theoretical parts. If theoretical and
empirical conclusions were not the same, (in e.g., theoretically they both, France
and Poland, are not tended to deviance but empirical results show that they are)
the hypothesis could not be confirmed. Hence, there two main conditions that had
to be satisfied in order not to reject the hypothesis: the French and Poles responses
could not be significantly different and both countries’ common empirical
tendency to deviant workplace behavior had to comply with theoretical
assumptions developed in theoretical analysis (Chapter 3.3) and provided in Table
3.4.
The structure of the analysis is visualized in Figure 5.1. First of all referring to the
exploratory and confirmatory data analysis we have identified empirical patterns
of deviant workplace behavior in Poland and France (Chapter 5.2). After that, we
compared empirical and theoretical findings in order to evaluate hypotheses
(Chapter 5.3). Then we provided the summary of findings (Chapter 5.4) and
discussed the drawbacks of the study (Chapter 5.5).
Figure 5.1 Structure of the analysis
Exploratory Data Analysis
Confirmatory Data Analysis
Theoretical Findings
Empirical Findings
Hypotheses Evaluation
87
5.2 Data analysis
In this part, referring to Poles and French samples exploratory and confirmatory
data analyses results, empirical findings of the research will be presented. These
results are the core part of our study and they will be used to evaluate the
hypotheses in Chapter 5.3.
5.2.1 Hypothesis 1
0%
5%
10%
15%
20%
25%
30%
35%
40%
45%
Stronglydisagree
Disagree Neitherdisagree nor
agree
Agree Strongly agree
Question 6
Poland France
Figure 5.2 Results of question 6
Exploratory data analysis
Referring to Figure 5.2, a majority of Poles and 21% of the French chose to
answer strongly disagree with the statement, which means that 40% of Polish and
only one fifth of French respondents have very low possibility to commit property
deviance. In total 72% of Poles and only 55 % of the French show the theft
disapproval. We also see that Frenchmen are more tended to take company’s
property because 17% of them agree with the statement; only 4% of Poles chose
this answer. Consequently, according to the exploratory analysis the French are
88
more tended to commit property deviance than Poles; however, in general both
samples are not predisposed to property deviance.
Confirmatory data analysis
As it is an ordinal type of question we used Mann-Whitney test to make
confirmatory data analysis. We established a two-tailed hypothesis: H1 which
indicates that there is a significant difference between tendencies of Poles and the
French to commit property deviance arisen from theft approval factor. H0
assumed that there is no significant difference between tendencies of Poles and
the French to commit property deviance.
H0: There is no significant difference between tendencies of Poles and the French
to commit property deviance.
H1: There is a significant difference between tendencies of Poles and the French
to commit property deviance in connection to theft approval.
The two-tailed significance shows p-value<0.1 (p-value=0.076) (see Appendix 3,
Table 1). This means that there is an indication to significant difference between
Polish and the French tendencies to commit property deviance. As a result, we
accept H1 which states that there is significant difference between tendencies of
Poles and the French to commit property deviance. Thus, in order to find out
which of two samples is relatively more tended to deviance, we compared the
mean rank values (see Appendix 3, Table 2). French sample’s mean value (30.88)
is higher than Poles (23.58). As in our case higher rank indicated higher tendency
to deviance, we can claim that Poles are less tended to property deviance than the
French.
Conclusion
Exploratory analyses shows that the French are relatively more tended to commit
property deviance than Poles; however, in general both samples are not
predisposed to property deviance. Nevertheless, confirmatory data analysis shows
that there is an indication to significant difference between French and Polish
samples. Hence, confirmatory analyses shows that the French are relatively more
89
predisposed to property deviance then Poles even though in general they are both
not tended to deviance.
5.2.2 Hypothesis 2
0%
10%
20%
30%
40%
50%
60%
70%
Take somestationary fromthe company
Leaveworkplace
earlier
Privatepurchase with
company funds
Working habitswill not change
Question 7
Poland France
Figure 5.3 Results of question 7
Exploratory data analysis
A majority answered that their working habits will not change (57% of
Frenchmen, 63% of Poles). Consequently, the general tendency is that both Poles
and the French are not tended to commit organizational deviance. Concerning
theft, there is a very small difference between Poles and the French. 9% of the
French and 7% of Poles seem to be tended to this type of deviance. As a result,
the French should be more tended to commit a theft than Poles. Concerning
absenteeism, we can see that 17% of the French and 11% of Poles are tended to
leave workplace earlier. As a consequence, the French answers indicate that they
are more inclined to absenteeism than Poles. The result concerning privilege
abuse shows that 19% of Poles and 17% of the French chose this answer. Thus,
Polish should be slightly more tended to commit privilege abuse than the French.
To sum up, the French and Poles have very similar attitudes. Exploratory analysis
shows that neither Poles nor the French are tended to deviance which could arise
from intent to quit factor. The clearest difference is that the French are more
90
tended to leave workplace earlier than Poles when they intend to quit the job.
However, the mainstream is that they are not tended to deviance.
Confirmatory data analysis
As it is a nominal type of question we used a Cross tables Chi-Square test to do a
confirmatory data analysis. We established a two-tailed hypothesis: H1 which
indicates that there is a significant difference between tendencies of Poles and the
French to commit organizational deviance (theft, absenteeism, privilege abuse)
arisen from intent to quit factor. H0 assumed that there is no significant difference
between tendencies of Poles and the French to commit organizational deviance.
Theft
H0: There is no significant difference between tendencies of Poles and the French
to commit theft when they intend to quit the job.
H1: There is a significant difference between tendencies of Poles and the French
to commit theft when they intend to quit the job.
The result shows p-value>0.05 (p-value=0.76) (see Appendix 3, Table 3). As a
consequence, we accept H0 which states that there is no significant difference
between tendencies of Poles and the French to commit theft when they intend to
quit the job. It means that Poles and Frenchmen are both similarly not tended to
commit theft when they intend to quit job.
Absenteeism
H0: There is no significant difference between Poles and the French tendencies of
absenteeism when they intend to quit the job.
H1: There is a significant difference between Poles and the French tendencies of
absenteeism when they intend to quit the job.
The result shows p-value>0.05 (p-value=0.393) (see Appendix 3, Table 4). As a
consequence, we accept H0 which states that there is no significant difference
between Poles and the French tendencies of absenteeism when they intend to quit
the job. It means that Poles and Frenchmen are both similarly not tended to
commit absenteeism when they intend to quit the job.
91
Privilege abuse
H0: There is no significant difference between tendencies of Poles and the French
to abuse privileges when they intend to quit the job.
H1: There is a significant difference between tendencies of Poles and the French
to abuse privileges when they intend to quit the job.
The result shows p-value>0.05 (p-value=0.950) (see Appendix 3, Table 5). P-
value is very high; therefore, with 95% possibility we can claim that these results
were obtained by chance. Therefore, we firmly accept H0 which states that there
is no significant difference between tendencies of Poles and the French to abuse
privileges when they intend to quit the job. It means that neither Poles nor
Frenchmen are tended to abuse privileges when they intend to quit the job.
No organizational deviance
H0: There is no significant difference between tendencies of Poles and the French
to not commit organizational deviance when they intend to quite the job.
H1: There is a significant difference between tendencies of Poles and the French
to not commit organizational deviance when they intend to quite the job.
The result shows p-value>0.05 (p-value=0.939) (see Appendix 3, Table 6). P-
value is very high; therefore, it is a big possibility that these results were obtained
by chance. Therefore, we firmly accept H0 which states that there is no significant
difference between tendencies of Poles and the French to not commit
organizational deviance when they intend to quit the job. It means that neither
Poles nor Frenchmen are tended commit organizational deviance when they
intend to quit the job.
Conclusion
According to the exploratory data analysis neither the French nor Poles are tended
to commit organizational deviance. The results are approved by the confirmatory
data analysis. Thus, the general tendency is that neither Frenchmen nor Poles are
tended to commit organizational deviance arisen from the intent to quit factor.
The summary of analysis of this question is presented in the table below.
92
Table 5.1 Summary of question 7 analysis
Type of deviance Conclusion Theft The results of exploratory data analysis show a very slight
difference between both Poles and the French and the confirmatory data analysis shows no difference between them. Thus, both Poles and the French are not tended to commit theft when they intend to quit job.
Absenteeism The results of exploratory data analysis and the percentage of answers within the country of respondents indicate that French are more tended to commit this deviance than Poles. But the confirmatory data analysis shows no difference between the tendencies of both Poles and the French.
Privilege abuse The results of exploratory data analysis show a very slight difference between both Poles and the French and the confirmatory data analysis shows no difference between them. Thus, both Poles and the French are not tended to commit this deviance.
No deviance Exploratory data analysis demonstrates that Poles answered that they are not tended to deviance more than the French. The confirmatory data show that there is no difference between the tendencies of both Poles and the French, thus both Poles and the French are not tended to commit organizational deviance.
5.2.3 Hypothesis 3
0%
5%
10%
15%
20%
25%
30%
35%
40%
45%
Politicaldeviance
(gossiping)
Politicaldeviance
(favoritism)
Personalagression
(verbal abuse)
Personalagression
(harassment)
No deviance
Question 8
Poland France
Figure 5.4 Results of question 8
93
Exploratory data analysis
72.5% of Poles and 62% of the French chose first two answers which show the
tendency to commit political deviance. Thus, both Poles and the French appear to
be inclined to commit political deviance, but Poles indicate a stronger tendency to
this type of deviance than the French. 21.5% of Poles and 29% of the French
chose the third and fourth answers which underline the tendency to commit
personal aggression. Thus, the French are more inclined to commit personal
aggression than Poles. Finally, only few respondents chose the last answer which
purports that they are not tended to commit interpersonal deviance. To
summarize, a majority of Poles and the French are inclined to commit political
deviance, especially gossiping; but Poles have a stronger tendency than the French
in this case. Concerning personal aggression, the French are more disposed to
commit this deviance, especially verbal abuse, than Poles. However, in general
Polish and French answers indicate that they are both tended to commit
interpersonal deviance arisen from frustration at workplace.
Confirmatory data analysis
As it is a nominal type of question we used Cross tables Chi-square test to make
confirmatory data analysis. We established a two-tailed hypothesis: H1 which
indicates that there is a significant difference between tendencies of Poles and the
French to commit interpersonal deviance (political deviance or personal
aggression) arisen from frustration factor. H0 assumed that there is no significant
difference between tendencies of Poles and the French to commit interpersonal
deviance.
Political deviance
H0: There is no significant difference between tendencies of Poles and the French
to commit political deviance arisen from frustration at workplace.
H1: There is a significant difference between tendencies of Poles and the French
to commit political deviance arisen from frustration at workplace.
The result indicates p-value>0.05 for both answers (p-value=0.389 for answer 1
and p-value=0.816 for answer 2) (see Appendix 3, Tables 7 and 8). Therefore, we
accept H0 which states that there is no significant difference between tendencies
94
of Poles and the French to commit political deviance arisen from frustration at
workplace. It means that Poles and Frenchmen are both very similarly inclined to
commit political deviance; however, the difference is bigger concerning gossiping
because p-value=0.389 is lower than the one regarding favoritism (p-
value=0.816).
Personal aggression
H0: There is no significant difference between tendencies of Poles and the French
to commit personal aggression arisen from frustration at workplace.
H1: There is a significant difference between tendencies of Poles and the French
to commit personal aggression arisen from frustration at workplace.
The result shows p-value>0.05 for both answers (p-value=0.516 for answer 3 and
p-value=0.589 for answer 4) (see Appendix 3, Tables 9 and 10). Therefore, we
accept H0 which stipulates that there is no significant difference between
tendencies of Poles and the French to commit personal aggression arisen from
frustration at workplace. It means that Poles and Frenchmen are both very
similarly inclined to commit personal aggression arisen from frustration at
workplace.
No interpersonal deviance
H0: There is no significant difference between tendencies of Poles and the French
to not commit interpersonal deviance arisen from frustration at workplace.
H1: There is a significant difference between tendencies of Poles and the French
to not commit interpersonal deviance arisen from frustration at workplace.
The result shows p-value>0.05 (p-value=0.499) (see Appendix 3, Table 11).
Therefore, we accept H0 which states that there is no significant difference
between tendencies of Poles and the French to not commit interpersonal deviance
in case of dissatisfaction and frustration at workplace. However, earlier analysis
showed that in fact both Poles and the French are tended to commit interpersonal
deviance.
Conclusion
95
According to the exploratory data analysis both the French and Poles are tended to
commit interpersonal deviance (especially political deviance). Referring to
confirmatory data analysis there is no significant difference between both the
French and Poles tendencies to commit interpersonal deviance. Thus, the general
tendency is that Frenchmen and Poles are tended to commit interpersonal
deviance (especially political deviance) arisen from frustration factor. The
summary of analysis of this question is presented in the table below.
Table 5.2 Summary of question 8 analysis
Type of deviance Conclusion Political deviance The results of the exploratory data analysis show that Poles
are more tended to commit political deviance than the French. The confirmatory data analysis shows no difference between them.
Personal aggression
The results of the exploratory data analysis show that the French are more tended to commit personal aggression than Poles. The confirmatory data analysis shows no difference between them.
No deviance The exploratory data analysis shows that both Poles and the French are tended to commit interpersonal deviance. The confirmatory data shows that there is no difference between the tendencies of both Poles and the French. Thus, Poles and the French are tended to commit interpersonal deviance.
5.2.4 Hypothesis 4
0%
10%
20%
30%
40%
50%
60%
70%
80%
Report to yoursupervisor
Pretend you don'tknow anything
Join the group
Question 9
Poland France
Figure 5.5 Results of question 9
96
Exploratory data analysis
The figure above shows that both Poles and the French would protect their
colleagues and would not report the deviance (76% of Poles and 55% of the
French). It means that they indirectly would support group behavior and balance
between in-group solidarity and individualistic inclination of deviance. Only 8%
of Poles and 21% of the French would report the deviance of their co-workers to
their superiors. 24% of the French and 16% of Poles would join the in-group
deviance. As a result, the general tendency is that both Poles and the French are
tended to commit deviance arisen from deviant role models factor; however, Poles
have a slightly stronger tendency for workplace deviance arisen from deviant role
models factor than Frenchmen.
Confirmatory data analysis
Even though this question is not expressed in Likert-style rating scale, it is an
ordinal type of question. Therefore, we used Mann-Whitney test to conduct
confirmatory data analysis. We established a two-tailed hypothesis: H1 which
indicates that there is a significant difference between tendencies of Poles and the
French to commit deviance arisen from deviant role models factor. H0 assumed
that there is no significant difference between tendencies of Poles and the French
to commit deviance.
H0: There is no significant difference between tendencies of Poles and the French
to commit deviance arisen from deviant role models factor.
H1: There is a significant difference between tendencies of Poles and the French
to commit deviance arisen from deviant role models factor.
Two-tailed significance shows p-value>0.05 (p-value=0.814) (see Appendix 3,
Table 12). As a result, we accept H0 which states that Poles and Frenchmen are
both similarly tended to commit deviance arisen from deviant role models factor.
Conclusion
Exploratory data shows both Poles and the French are tended to commit deviance
arisen from deviant roles models factor. Confirmatory data analysis showed that
97
there is no proof for statistically significant difference between Poles and the
French. Consequently, both Poles and the French are tended to commit deviance.
5.2.5 Hypothesis 5
0%
5%
10%
15%
20%
25%
30%
35%
40%
45%
50%
Business is aworld of sharks
Illegal means arejustifiable when
necessary
I am not verycompetitive
Business is beinghonest
Question 10
Poland France
Figure 5.6 Results of question 10
Exploratory data analysis
As described above higher competitiveness leads to stronger tendency to commit
deviance. 12% of Poles and 31% of Frenchmen answered to be very competitive.
In this case the French should be more tended to commit deviance than Poles. In
addition, 48% of Poles and 10% of the French answered to be not very
competitive, it still confirms that the French are more competitive than Poles. As a
result, French should be more tended to commit deviance. But on the other hand,
16% of Poles and 38% of the French are not competitive at all. To make the
clearer conclusion, we divided answers into two groups. First group is composed
of first two answers, which show a higher competitiveness, and second group is
composed of last two answers, which indicate lower competitiveness, thus, lower
possibility of deviance. In total 36% of Poles and 52% of the French chose first
two answers. Thus, the French are more tended to deviance, in this case.
98
Confirmatory data analysis
As it is a nominal question we used Cross tables Chi-square test to make
confirmatory data analysis. We established a two-tailed hypothesis: H1 which
indicates that there is a significant difference between tendencies of Poles and the
French to commit deviance arisen from competition factor. H0 assumed that there
is no significant difference between tendencies of Poles and the French to commit
deviance.
H0: There is no significant difference between tendencies of Poles and the French
to commit deviance arisen from competition factor.
H1: There is a significant difference between tendencies of Poles and the French
to commit deviance arisen from competition factor.
The result shows p-value<0,05 (p-value=0,010) (see Appendix 3, Table 13). As a
consequence, we confirm H1 which states that there is a significant difference
between Poles and the French answers concerning deviance arisen from
competition factor. It means that Frenchmen are significantly more tended to
commit deviance arisen from competition factor than Poles.
Conclusion
Exploratory data shows that the French are more tended to commit deviance than
Poles because the French are more competitive and they justify all means, also
deviant elements of behavior, to cope with competition. This attitude can be
explained by individualistic features of French society. The confirmatory data
analysis indicates that there is a significant difference between answers of this
question. Thus, we can conclude that Frenchmen are more tended to commit
deviance arisen from competition factor than Poles.
99
5.2.6 Hypothesis 6
0%
5%
10%
15%
20%
25%
30%
35%
40%
Leaveworkplace
earlier
Work onpersonalmatters
Discuss withco-workers
Work longer (nodeviance)
Question 11
Poland France
Figure 5.7 Results of question 11
Exploratory data analysis
In the figure above we can see that 36% of Poles and 14% of the French would
work on their personal matters if they finished the tasks of the day. Consequently,
Poles are more inclined to commit production deviance than the French. 38% of
the French and 28% of Poles would discuss some matters with their colleagues.
This answer indicated mild production deviance. The last answer describes how
many respondents would strictly not commit the production deviance; we can see
that 28% of the French and 20% of Poles chose this answer. As a result, Poles are
more tended to commit production deviance than the French. In addition, 52% of
Poles and 35% of the French chose first two answers which indicate a higher
tendency to commit production deviance. Consequently, according to this
question data Poles are relatively more tended to commit production deviance
than the French, however, the general tendency of both Poles and the French is
that they are tended to production deviance.
Confirmatory data analysis
As it is a nominal type of question we used Cross tables Chi-square test to make
confirmatory data analysis. We established a two-tailed hypothesis: H1 which
indicates that there is a significant difference between tendencies of Poles and the
100
French to commit production deviance arisen from instrumental climate factor.
H0 assumed that there is no significant difference between tendencies of Poles
and the French to commit production deviance.
H0: There is no significant difference between tendencies of Poles and the French
to commit production deviance arisen from instrumental climate factor.
H1: There is a significant difference between tendencies of Poles and the French
to commit production deviance arisen from instrumental climate factor.
The result shows p-value>0.05 (p-value=0.305) (see Appendix 3, Table 14). As a
consequence, we accept H0 which states that there is no significant difference
between Polish and French tendencies to commit production deviance arisen from
instrumental climate factor. It means that Poles and Frenchmen are both similarly
tended to commit production deviance.
Conclusion
Exploratory data analysis shows that the general tendency of both groups of
students is that they are tended to commit production deviance arisen from
instrumental climate. Confirmatory data analysis does not indicate significant
difference between answers. Thus, the general tendency is that both the French
and Poles are tended to commit production deviance arisen from instrumental
climate factor.
5.2.7 Hypothesis 7
Exploratory data analysis
In the figure below we can see that there are similar answers for both Poles and
the French. But there is still a visible difference in one of the answers; 40% of
Poles and 31% of French disagree with the question 12 statement. This fact shows
that the French are more tended to commit deviance than Poles when they
perceive that they are treated unfairly. But to have a more clear understanding of
the situation we had to regroup the answers. First two answers indicate lower
tendency to deviance and last two answers show higher tendency to deviance. The
101
result shows that 48% of the French and 56% of Poles chose first two answers.
Consequently, Poles are less tended to commit deviance arisen from inequitable
treatment factor than the French. If we look at the general tendency we can notice
that both the French and Poles are less tended to deviance.
0%
5%
10%
15%
20%
25%
30%
35%
40%
45%
Stronglydisagree
Disagree Neitherdisagree nor
agree
Agree Strongly agree
Question 12
Poland France
Figure 5.8 Results of question 12
Confirmatory data analysis
As it is an ordinal type of question we used Mann-Whitney U test to make
confirmatory data analysis. We established a two-tailed hypothesis: H1 which
indicates that there is a significant difference between tendencies of Poles and the
French to commit deviance arisen from inequitable treatment factor. H0 assumed
that there is no significant difference between tendencies of Poles and the French
to commit deviance.
H0: There is no significant difference between tendencies of Poles and the French
to commit deviance arisen from inequitable treatment factor.
H1: There is a significant difference between tendencies of Poles and the French
to commit deviance arisen from inequitable treatment factor.
Two-tailed significance shows p-value>0.05 (p-value=0.679) (see Appendix 3,
Table 15). As a result, we accept H0 which states that there is no significant
102
difference between tendencies of Poles and the French to commit deviance arisen
from inequitable treatment factor.
Conclusion
Exploratory data analysis shows that Poles are less tended to commit deviance
than the French when they perceive that they are treated inequitably. However,
confirmatory data analysis indicates that difference between Poles and the French
answers is not statistically significant. Therefore, the relative conclusion is that
Poles are less exposed to deviance than the French when they feel treated unfair
does not have statistical proof. Thus, we refer to the general tendency which
shows that neither Poles nor French are inclined to workplace deviance which
arises from inequitable treatment.
5.2.8 Hypothesis 8
0%
5%
10%
15%
20%
25%
30%
35%
40%
Stronglydisagree
Disagree Neitherdisagree nor
agree
Agree Strongly agree
Question 13
Poland France
Figure 5.9 Results of question 13
Exploratory data analysis
To analyze this question we grouped the first and last two answers; first two
answers show a lower tendency to commit property deviance and last two answers
display higher tendency to commit property deviance. We can notice that 36% of
Poles and 34% of the French chose the first two answers. It indicates that Poles
103
prefer to work in formalized companies and are not tended to commit property
deviance. 28% of the French and 40% of Poles chose last two answers.
Consequently, Poles prefer to work in a formalized company, so they are more
inclined to commit property deviance than the French, in this case. To conclude,
there are contradictory results as the answers are much spread, thus, it is difficult
to see tendencies.
Confirmatory data analysis
As it is an ordinal type of question we used Mann-Whitney test to make
confirmatory data analysis. We established a two-tailed hypothesis: H1 which
indicates that there is a significant difference between tendencies of Poles and the
French to commit property deviance arisen from climates of rules factor. H0
assumed that there is no significant difference between tendencies of Poles and
the French to commit property deviance.
H0: There is no significant difference between tendencies of Poles and the French
to commit property deviance arisen from the climates of rules.
H1: There is no significant difference between tendencies of Poles and the French
to commit property deviance arisen from the climates of rules.
Two-tailed significance shows p-value>0.05 (p-value=0.775) (see Appendix 3,
Table 16). As a result, we accept H0 which states that there is no significant
difference between tendencies of Poles and the French to commit property
deviance arisen from the climates of rules.
Conclusion
Exploratory data showed ambiguous results while confirmatory data analysis
indicates that difference between Poles and the French answers is not statistically
significant. Thus, it is complicated to identify general tendency for both Poles and
the French because the results are spread.
104
5.2.9 Hypothesis 9
0%
5%
10%
15%
20%
25%
30%
35%
40%
45%
Useuncertainty asmuch as I can
Useuncertainty tosome extent
I don't know ifI would use
theuncertainty
I don't think Iwould break
the rules
I woulddefinitely not
break therules
Question 14
Poland France
Figure 5.10 Results of question 14
Exploratory data analysis
If we combine two first answers which indicate very high possibility of deviance,
the results are that only 16% of Poles and 17% of the French would use
uncertainty situation to commit deviance. If we look at the last two answers which
show a very low tendency to commit deviance we notice that 44% of Poles and
45% of the French chose these answers. To sum up both Poles and the French
have a very low tendency to commit organizational deviance when they perceive
management’s uncertainty.
Confirmatory data analysis
As it is an ordinal type of question we used Mann-Whitney test to make
confirmatory data analysis. We established a two-tailed hypothesis: H1 which
indicates that there is a significant difference between tendencies of Poles and the
French to commit organizational deviance arisen from perceived management
uncertainty factor. H0 assumed that there is no significant difference between
tendencies of Poles and the French to commit organizational deviance.
105
H0: There is no significant difference between tendencies of Poles and the French
to commit organizational deviance arisen from perceived management uncertainty
factor.
H1: There is a significant difference between tendencies of Poles and the French
to commit organizational deviance arisen from perceived management uncertainty
factor.
Two-tailed significance shows p-value>0.05 (p-value=0.561) (see Appendix 3,
Table 17). As a result, we accept H0 which states that there is no significant
difference between tendencies of Poles and the French to commit organizational
deviance when management’s uncertainty is perceived. It means that Poles and
Frenchmen are both similarly tended to commit organizational deviance.
Conclusion
Exploratory data analysis shows that both Polish and French respondents are not
tended to commit organizational deviance. Confirmatory data analysis indicates
that Poles and Frenchmen are both similarly tended to commit organizational
deviance. Consequently, the common conclusion of exploratory and confirmatory
data analyses is that both French and Polish respondents are not tended to commit
organizational deviance arisen from perceived management uncertainty.
The summary of data analysis results is displayed in the table below.
106
Table 5.3 Summary of data analysis results
5.3 Hypotheses evaluation
In this part the outcome of the survey analysis is discussed in accordance with
their conformity to theoretical assumptions. This discussion allowed to verify the
hypotheses and to deduce conclusions.
Hypo-theses
Exploratory data general tendency
Confirmatory data conclusion
Empirical findings
1 Both not tended to commit deviance
Significant difference
The French are relatively more tended to commit property deviance than Poles
2 Both not tended to commit deviance
No significant difference
Both not tended to commit organizational deviance
3
Both tended to commit deviance (especially political)
No significant difference
Both tended to commit interpersonal deviance (especially political)
4 Both tended to commit deviance
No significant difference
Both tended to commit deviance
5 The French are more tended to commit deviance
Significant difference
The French are significantly more tended to commit deviance
6 Both tended to commit deviance
No significant difference
Both tended to commit production deviance
7 Both not tended to commit deviance
No significant difference
Both not tended to commit deviance
8 Ambiguous results No significant difference
Ambiguous results
9 Both not tended to commit deviance
No significant difference
Both not tended to commit organizational deviance
107
5.3.1 Hypothesis 1 evaluation
Hypothesis 1: When the deviance arises from theft approval factor, there is a
negative relationship between UAI and property deviance.
In the theoretical part theft approval and consequently property deviance is
explained by UAI. Theoretical analysis shows that in weak UAI country cultures
there is a lack of rules and regulations within society. Thus, individuals of these
societies do not have the habit to follow the rules and regulations and,
consequently, feel lower risk to approve theft and are more predisposed to
property deviance. As a result, weak UAI predicts property deviance. As the
French and Poles are both strong UAI societies, theoretical analysis assumes they
are less predisposed to the risk of property deviance which arises from theft
approval. Empirical research of theft approval factor shows that The French are
relatively more tended to commit property deviance than Poles even though none
of the samples is strongly predisposed to deviance.
To summarize, theoretical framework and empirical analysis do not both indicate
that Poles and the French are equally predisposed to property deviance which is
explained by theft approval factor. Even though exploratory analysis shows that
none of the samples is predisposed to property deviance (this matches with
theoretical findings), there is an indication of significant difference between both
samples’ answers which shows that the French are relatively more tended to
property deviance than Poles. It means that not both conditions described in the
introductory part of this chapter were satisfied. Thus, we cannot support the
Hypothesis 1.
This result could be explained by comparing the UAI scores of both country
cultures. In Chapter 3.2.6 we can see that France has a lower UAI (86) score than
Poland (93) and according to the theoretical framework strong UAI indicates low
risk of deviance, arisen from theft approval factor. Consequently, according to
theory, the French should have a higher risk of property deviance than Poles. This
explains why hypothesis could be partly supported because empirics also show
that French are relatively more tended to property deviance. However, there is an
108
indication to significant difference between these two samples answers which is
hard to explain since their UAI indexes are quite similar. Therefore, it would be
interesting to test this hypothesis with other respondents.
5.3.2 Hypothesis 2 evaluation
Hypothesis 2: When the deviance arises due to intent to quit factor, there is a
positive relationship between PDI and organizational deviance.
In the theoretical framework intent to quit factor and to it related organizational
deviance is explained by PDI. Theoretical framework shows that intent to quit can
be explained by loyalty of an employee. Due to power distance, climate in the
large PDI societies’ companies is less caring; thus, employees feel less attached to
the company and more often intend to quit the job and commit organizational
deviance related to this factor. Consequently, as the French and Poles belong to
large PDI societies, theoretical analysis assumes that they are predisposed to
organizational deviance. However, empirical analysis shows that neither French
nor Poles are tended to organizational deviance.
To summarize, as the theoretical and empirical research revealed contradictory
results, theory about positive relationship between PDI and organizational
deviance was not supported. In conclusion, as theoretical assumptions were not
verified by empirical findings, Hypothesis 2 is not supported. There might be few
explanations why this theory was not confirmed. Possibly intent to quite cannot
be explained only by PDI as their might various reasons why people want to quit
the job and not necessarily all these reasons are connected to deviant acts. Thus,
explanation of this factor requires to include more variables (not only the ones
that are linked to cultural dimensions). In addition, the theory about intent to quit
and organizational deviance was tested in the companies and as our sample
consists of students, they could not fully reflect the actual situation as students do
not have a lot of work experience and, thus, majority never intended to quit job.
Therefore, it is difficult for them to imagine how they would behave in that case.
109
5.3.3 Hypothesis 3 evaluation
Hypothesis 3: When the deviance arises from frustration factor, there is a
positive relationship between UAI and interpersonal deviance.
In the theoretical framework frustration, which is a reason of interpersonal
deviance, is explained by UAI. The theoretical findings indicate that societies
which have weaker UAI are happier and less anxious than the ones with strong
UAI. Both, France and Poland, have a strong UAI; thus, both are less “happy” and
more anxious at their workplace. Thus, referring to theoretical assumptions, Poles
and the French are more often frustrated inside the organizations and,
consequently, are tended to commit interpersonal deviance. Empirical analysis of
interpersonal deviance arising from frustration factor shows that both, Poles and
the French, are tended to commit interpersonal (especially political) deviance.
Theoretical framework and empirical analysis show that both, Poles and the
French, are tended to commit interpersonal deviance which arises from
frustration. As theory was confirmed by empirical findings, we can claim that that
there is a positive relationship between UAI and interpersonal deviance. It means
that individualism indicates tendency to commit interpersonal deviance. In
conclusion, as theoretical assumptions were verified by empirical findings, we
cannot reject Hypothesis 3.
5.3.4 Hypothesis 4 evaluation
Hypothesis 4: When the deviance arises from deviant role models factor, there is
a negative relationship between IDV and workplace deviance.
In theoretical framework deviant role models and to them related deviant behavior
is explained by IDV. Theoretical analysis shows that collectivistic societies have a
stronger tendency to commit deviance which arises due to deviant role models
factor than individualistic ones because in collectivistic societies employees
support and join their colleagues, also when it comes to deviant workplace
110
behavior. Both, the French and Poles, belong to individualistic country cultures;
consequently, referring to theoretical assumptions, they have a weaker tendency to
commit deviance arising from group behavior. However, empirical analysis
showed that both, French and Poles, are tended to deviant workplace behavior
which arises due to deviant role models.
To summarize, as the theoretical and empirical research revealed contradictory
results, theory about negative relationship between IDV and workplace deviance
arising due to deviant role models was not supported. There are several
explanations why this relationship was not confirmed. It might have happened
because deviant role models theory does not specify to which type of deviance it
leads and is very closely related to the situation in certain company; thus, this
factor also cannot be explained only by one cultural dimension (IDV) and most
likely explanation of this factor requires to include more variables. In addition,
perhaps if the structure of the question was expressed in Likert-style rating scale,
this would enable to reach more accurate results and lead to different outcome.
5.3.5 Hypothesis 5 evaluation
Hypothesis 5: When the deviance arises from competition factor, there is a
positive relationship between IDV and workplace deviance.
In the theoretical framework competition factor is linked with both interpersonal
and organizational deviance and is explained by IDV. Theoretical outcome shows
that individualistic societies are more tended to deviant behavior than
collectivistic because in firms of collectivistic country cultures the in-group task
prevails; thus, there is less competition which leads to deviant workplace behavior
in between employees of the same company. Consequently, as Poles and the
French have strong IDV, referring to theoretical assumptions, they should be
similarly tended to commit both organizational (especially corruption) and
interpersonal deviance. Empirical research of competition factor indicates that the
French are significantly more inclined to commit deviance than Poles.
111
To summarize, theoretical framework shows that both, the French and Poles, are
tended to commit deviance, while empirical analysis reveals that the French and
Poles are not equally predisposed to commit deviance (French are significantly
more tended to commit deviance than Poles). As it was explained in the
“Operationalization” part, since both French and Poles have similar IDV, they
should be equally tended to deviance. In our case empirical findings indicate
significant difference. Thus, the conclusion is that theoretical assumptions were
not verified by empirical findings and we cannot accept Hypothesis 5.
This conclusion reflects the fact some authors describe IDV in France and Poland
differently (in e.g., Kolman et al. (2003) claimed that Poland is collectivistic
society). However, our main reference (also mostly recognized by other
researchers) is Hofstede’s Five Dimensions Model; thus, we consider that both,
Poland and France, are individualistic societies. In this case, we could explain the
situation that French are more tended to deviance then Poles because of the fact
that Poles are less individualistic then French; therefore, French are more inclined
to deviance which arises from competition than Poles.
5.3.6 Hypothesis 6 evaluation
Hypothesis 6: When the deviance arises from instrumental climate factor, there is
a positive relationship between IDV and production deviance.
In the theoretical framework production deviance which arises due to instrumental
climate in the organization is explained by IDV. The theoretical analysis purport
that in individualistic societies employees pursue the employer’s interest only if it
coincides with their self-interest. Therefore, individualistic cultures are
predisposed to production deviance. Hence, referring to theoretical analysis, the
French and Poles have a tendency to commit production deviance. Empirical
analysis confirmed that both, the French and Poles, are inclined to commit
production deviance.
112
Theoretical framework and empirical analysis indicate that both Poles and the
French are tended to commit production deviance due to the instrumental climate
factor. As theory was confirmed by empirical findings, we can claim that there is
a positive relationship between IDV and production deviance. Hence,
individualistic country culture indicates stronger tendency to commit production
deviance which is explained by instrumental climate. In conclusion, as theoretical
assumptions were verified by empirical findings, we cannot reject Hypothesis 6.
5.3.7 Hypothesis 7 evaluation
Hypothesis 7: When the deviance arises from inequitable treatment and perceived
injustice factor, there is a negative relationship between IDV and workplace
deviance.
In the theoretical framework inequitable treatment and injustice factor indicate
workplace deviance which is explained by IDV. Theoretical analysis predicates
that collectivistic societies are considered as more egalitarian than individualistic
cultures. Therefore, inequitable treatment and perceived injustice causes stronger
employees’ reactions (which lead to workplace deviance) in the collectivistic
countries as they are not used to inequitable treatment. As both, the French and
Poles, are individualistic societies, referring to theoretical analysis, they should be
less predisposed to the risk of workplace deviance in case of inequitable
treatment. According to empirical analysis, both, Poles and the French, are not
tended to workplace deviance when they perceive that they are treated inequitably
and unjust.
Theoretical framework and empirical analysis show that both, Poles and the
French, are similarly not tended to deviant workplace behavior which arises from
inequitable treatment and perceived injustice factor. We can conclude that more
individualistic country culture indicates lower tendency to commit deviance
which arises due to the unjust behavior. As theory was confirmed by empirical
findings, we can claim that there is a negative relationship between IDV and
workplace deviance in case of inequitable treatment and perceived injustice. In
113
conclusion, as theoretical assumptions were verified by empirical findings, we
cannot reject Hypothesis 7.
5.3.8 Hypothesis 8 evaluation
Hypothesis 8: When the deviance arises from climates of rules factor, there is a
negative relationship between UAI and property deviance.
In theoretical framework climates of rules factor is related to property deviance
and is explained by UAI. Theoretical outcome shows that companies which do not
emphasize the strict adherence to company rules and laws are more vulnerable to
property deviance. Organizations from the countries belonging to strong UAI
societies accord high importance to the rules. Consequently, they are less tended
to commit property deviance. Both Poles and the French have strong UAI; as a
result, they are less tended to commit property deviance. Empirical analysis of
climates of rules factor provided ambiguous results. It means that even though
confirmatory analysis showed that French and Poland have similar inclination to
deviance, we could not see the direction of tendency.
Theoretical framework and empirical analysis did not provide sufficient
information. Thus, we cannot confirm theoretical assumption that strong UAI
indicates lower possibility of property deviance which is affected by climates of
rules. In conclusion, Hypothesis 8 cannot be accepted due to ambiguous
empirical results. It might be that interpretation of UAI connection to property
deviance could be incorrect or property deviance which arises from climates of
rules factor cannot be explained by one dimension or culture in general. Mostly
likely property deviance which arises due to climates of rules is affected by other
variables. It is also possible that some of the answers were not honest and it led to
ambiguous empirical results.
114
5.3.9 Hypothesis 9 evaluation
Hypothesis 9: When the deviance arises from perceived management uncertainty
factor, there is a negative relationship between UAI and organizational deviance.
In the theoretical analysis perceived management’s uncertainty factor is related to
organizational deviance and is explained by UAI. Theoretical framework
describes that in the societies with weak UAI the management is closer to its
employees, less formal and more tolerant for ambiguity; thus, employees perceive
management’s style as uncertain. In societies with strong UAI the risk of
organizational deviance is lower as the management is more formal and strict with
employees. Both, Poles and the French, have quite strong UAI; consequently,
referring to theoretical analysis, they should be less tended to commit
organizational deviance. Empirical analysis of perceived management’s
uncertainty factor revealed that France and Poland are not tended to organizational
deviance which arises from management’s uncertainty.
Theoretical framework and empirical analysis indicate that neither Poles nor
French are tended to commit organizational deviance which is explained by
perceived management’s uncertainty. As theory was confirmed by empirical
findings, we can claim that there is a negative relationship between UAI and
organizational deviance which arises from perceived management’s uncertainty. It
means that employees from societies with high UAI would not use management
uncertainty situation to commit organizational deviance. In conclusion, as
theoretical assumptions were verified by empirical findings, we cannot reject
Hypothesis 9.
The summary of hypotheses evaluation is provided below. This table illustrates
the final step of analyses procedure in which supreme conclusion to accept or to
reject the hypotheses was made. As you can see the hypothesis was supported
only if empirical results verified theoretical findings.
1 French are relatively more tended to property deviance
Both are not tended to property deviance
Hypothesis not supported
2 Both are not tended to organizational deviance
Both are tended to organizational deviance
Hypothesis not supported
3 Both are tended to interpersonal deviance
Both are tended to interpersonal deviance
Hypothesis supported
4 Both are tended to deviance
Both are not tended to deviance
Hypothesis not supported
5 French are significantly more tended to deviance
Both are tended to deviance
Hypothesis not supported
6 Both are tended to production deviance
Both are tended to production deviance
Hypothesis supported
7 Both are not tended to deviance
Both are not tended to deviance
Hypothesis supported
8 Ambiguous results Both are not tended to property deviance
Hypothesis not supported
9 Both are not tended to organizational deviance
Both are not tended to organizational deviance
Hypothesis supported
5.4 Summary of findings
The analysis of the research described in this chapter reflects our whole research
progress from theoretical research to findings confirmed by empirical conclusions.
The analysis revealed that four out of nine hypotheses were supported and that
there are two main dimensions, UAI and IDV, which can explain deviant
workplace behavior. The research results show that UAI is negatively related to
organizational deviance which arises due to perceived management uncertainty
factor but positively to interpersonal deviance which is caused by frustration. The
study revealed that IDV can also have both positive and negative relationship to
deviance depending on the reason of deviant workplace behavior. The analysis
results show that there is a positive relationship between IDV and production
deviance (which is an organizational type of deviance) which originates from
instrumental climate. However, IDV also indicates negative relationship to any
116
type of workplace deviance which arises from inequitable treatment and perceived
injustice.
5.5 Critical reflections
Cultural diversity and deviant workplace behavior are very complicated and
multi-perspective research areas; thus, the combination of them is very
challenging. The study process consists of many procedures and mistakes in any
of them could affect the whole result. We present some of the problems that could
have impacted the results:
− There could be problems with language and interpretations of concepts
since the respondents were not native English speakers. However, they all
have studied abroad in English; therefore, we consider that their
knowledge of the language was sufficient for this simple questionnaire.
Thus, language and interpretation of concepts should not dramatically
impact the results.
− Honesty of respondents. This problem could be avoided by testing the
same hypotheses in several questions (not only in one) or finding new
structure for questions.
− Perhaps qualitative analysis would enable to get more elaborate results and
deeper view of the research problem. However, quantitative research
allowed us to prove the hypotheses statistically and to establish the
relationship between cultural dimensions and deviant workplace behavior.
Thus, main research purpose was reached. Nevertheless, in the future
qualitative research could notice and display new in-sights of this
relationship.
− Probably some factors (in e.g., deviant role models) and to them related
workplace deviance cannot be explained only by cultural effects but other
variables must also be taken into account. Thus, social factors (in e.g., age,
gender, work experience and etc.) could also have been taken into account
in hypotheses evaluation procedure.
117
− More strict questions structure could provide more accurate results and
avoid ambiguities. Thus, ordinal questions expressed by Liker-style rating
scale could have been used instead.
− Each of the hypotheses could be tested by more questions, however in that
case the recommended number of questions (usually not more than 20)
would be exceeded. Therefore, it would be hard to attain high response
rate and also it would be difficult to implement this research within the
time frame as the research would be even more extensive.
118
6. Conclusions
In this chapter final conclusions are presented. The final part of this research
contains a summary of the research, answers to the research questions, overview
of research findings and recommendations how to solve the problem. In addition,
critical reflections about the research are discussed. The chapter ends with the
presentation of practical implications and suggestions for further research.
6.1 Summary of the research
Deviant behavior remains underestimated risk and the consequences of workplace
deviance has both financial impacts and social and psychological effects on the
organization and its’ employees. Thus, the need of information about the
tendencies of workplace deviances in different countries has a growing demand.
Due to the lack of information about the nature of deviant behavior in terms of
country culture, the aim of this study is to investigate how country culture
influences deviant workplace behavior.
In order to implement this exploratory study we combined the literature review
with the empirically based studies relating to the implications of how the country
culture can affect the patterns of deviant workplace behavior. Firstly, we
established the link between the cultural diversity and deviant workplace behavior
theories referring to the literature review, which enabled us to evolve nine
hypotheses. In order to verify these hypotheses, we have conducted the survey of
business students from Poland and France and compared our theoretical and
empirical findings. The result led to the conclusions and solutions of the research
problem.
In order to provide more extensive explanation of the problem, we have limited
our research to two countries, Poland and France, which represent two different
parts of Europe, Eastern and Western. These countries were chosen because they
are linked with different prejudices in terms of deviant workplace behavior.
However, as culturally they are quite similar. Thus, the focus on cultural
119
resemblance could challenge the prejudice and provide more interesting and
unexpected results.
The research revealed that country culture similarities can explain deviant
workplace behavior patterns. Compilation of literature and empirical analyses
discovered how cultural dimensions affect tendencies of workplace deviance. We
have also identified the comparative patterns of deviance in Poland and France on
the individual level and have contradicted the prejudice about the deviance
inclinations in Western (France) and Eastern (Poland) Europe. Empirical findings
revealed that even though France and Poland are historically and geographically
very different, both (the French and Poles) are very similarly predisposed to
deviance.
6.2 Answers to research questions
What are the attributes of deviant workplace behavior?
In order to find out the attributes of deviant workplace behavior, we have
discussed definitions of workplace deviance and alternative deviant workplace
behavior concepts, dimensions and classification of workplace deviance and
reasons and factors which might predict deviant workplace behavior in business
environment. These attributes were used to connect workplace deviance and
cultural dimensions theories; thus, they were crucial for our research.
Literature review revealed that there are many similar and alternatively employed
conceptions of deviant workplace behavior. We decided to refer to Robert’s and
Bennett’s (1995, p.556) definition of the deviant behavior: “voluntary behavior
that violates significant organizational norms and in so doing threatens the well-
being of an organization, its members, or both”. We have also discovered that
there are two main dimensions of deviance: organizational-interpersonal and
minor-serious. The first dimension (organizational-interpersonal) represents the
target of deviant behavior. The second dimension (minor-serious) represents the
severity of deviant behavior. Deviant behavior on this dimension varies on a
continuum from minor forms of deviance (e.g., gossiping) to serious forms of
120
deviance (e.g., physical abuse). The perceptual configuration based on these two
dimensions results in four classifications of deviant behavior: 1) Production
Deviance; 2) Political Deviance; 3) Property Deviance; 4) Personal Aggression.
We have also identified that reasons for deviance might be person-based and
situation-based. The most significant person-based factors include demographic
variables, attitudes and psychological state of employee. The most prevalent
predictors of situation-based approach are group behaviors, ethical climate in an
organization, operational environment and supervisory behavior and justice.
What are the cultural differences and similarities between Poland and France?
We have discussed the cultural differences and similarities between Poland and
France referring to Hofstede’s, Mole’s, Kolman et al.’s cultural diversity theories.
The differences and similarities of both nations are classified according to Power
Distance Index (PDI), Masculinity/Femininity Index (MAS),
Individualism/Collectivism Index (IDV), Uncertainty Avoidance Index (UAI) and
Long and Short-term Orientation Index (LTO).
Review of cultural diversity theories showed that there are differences and
similarities between both countries. France and Poland have similar large Power
distance index, which means that the level of inequalities is quite high in both
country cultures. France belongs to feminine and long-term orientation societies
while Poland belongs to masculine and short-term orientation society. As a result,
the French society is more intuitive and more tended to consensus while the
Polish society is more aggressive in its decisions. Both France and Poland are
individualistic according to Hofstede, and, as a result, self-interest prevails on in-
group interest. Finally, both France and Poland have similar uncertainty avoidance
index. As a consequence, French and Polish firms have a need for rules and are
strict within organizations. As a result, both France and Poland are considered
individualistic, large PDI and strong UAI countries, thus, share many common
cultural features.
121
How French and Polish cultural similarities could explain deviant workplace
behavior referring to the literature?
To answer this research question we have conducted a cross analysis of the
deviant workplace behavior and the cultural diversity theories which were
identified in the questions above. Referring to the findings of this cross-analysis
we have established nine hypotheses explaining the relationship between types of
deviance and cultural dimensions. These hypotheses reflect how country cultural
similarities affect deviant workplace behavior as they were based on dimensions
according to which both Poland and France are similar. In addition, they show
positive or negative relationship between types of deviance and cultural
dimensions. Below are presented the hypotheses of the theoretical framework
which also summarize how French and Polish cultural similarities could explain
deviant workplace behavior referring to the literature:
Hypothesis 1: When the deviance arises from theft approval factor, there is a
negative relationship between UAI and property deviance.
Hypothesis 2: When the deviance arises due to intent to quit factor, there is a
positive relationship between PDI and organizational deviance.
Hypothesis 3: When the deviance arises from frustration factor, there is a positive
relationship between UAI and interpersonal deviance.
Hypothesis 4: When the deviance arises from deviant role models factor, there is
a negative relationship between IDV and workplace deviance.
Hypothesis 5: When the deviance arises from competition factor, there is a
positive relationship between IDV and workplace deviance.
Hypothesis 6: When the deviance arises from instrumental climate factor, there is
a positive relationship between IDV and production deviance.
Hypothesis 7: When the deviance arises from inequitable treatment and perceived
injustice factor, there is a negative relationship between IDV and workplace
deviance.
Hypothesis 8: When the deviance arises from climates of rules factor, there is a
negative relationship between UAI and property deviance.
Hypothesis 9: When the deviance arises from perceived management uncertainty
factor, there is a negative relationship between UAI and organizational deviance.
122
How does country culture influence deviant workplace behavior in practice?
The survey data analysis revealed that four hypotheses were supported (3, 6, 7, 9)
and five were not supported (1, 2, 4, 5, 8). Hypotheses 3, 6, 7 and 9 are supported
as theoretical and empirical findings correspond and it indicates that theories were
proved by empirics. However, hypotheses 1, 2, 4 and 5 are not supported because
there is a discrepancy between theoretical and empirical findings. Finally,
hypothesis 8 is not supported due to the ambiguous results of the empirical
research concerning this proposition. Hypotheses analysis discovered that there
are two dimensions (UAI and IDV) which can explain workplace deviance. In
practice, country culture can have twofold influence on deviant workplace
behavior. Empirical research revealed that UAI and IDV can have both positive
and negative relationships with different types of deviance depending on the
reason of deviant workplace behavior. These relationships will be discussed in
detail in “Findings of the research” part.
6.3 Findings of the research
Our research revealed that country culture can influence deviant workplace
behavior. We have revealed that cultural similarities can explain the tendencies of
deviant behavior. Poland and France, representatives of Eastern and Western
Europe, initially thought to be culturally distant societies due to different
historical backgrounds, in fact are similar even in three cultural dimensions:
power distance, individualism/collectivism and uncertainty avoidance. Theoretical
analysis of deviant behavior factors revealed that these cultural dimensions
indicate different inclinations to deviance. Empirical research discovered that the
cultural dimension can have twofold directions (positive and negative) effects on
the workplace deviance depending on the factor of deviant behavior.
The study shows that the country cultures with strong UAI are exposed to the low
risk of organizational deviance when employees perceive that management is
uncertain; thus, there is a negative relationship between UAI and organizational
deviance. However, weak UAI country cultures are exposed to the high risk of
interpersonal deviance arisen from frustration factor; thus, there is a positive
123
relationship between UAI and interpersonal deviance. Moreover, the results show
that IDV can also have both positive and negative relationship to deviance
depending on the reason (factor) of deviant workplace behavior. The country
cultures with high IDV are exposed to the low risk of deviance which occurs as a
response to being treated inequitably in the workplace. However, they are also
exposed to the high risk of production deviance which arises when individuals are
primarily concerned with protecting their own interests in the organization
(instrumental climates factor). Thus, there is a negative relationship between IDV
and deviance in general, while there is a positive relationship between IDV and
production deviance. All these examples show that culture can have positive or
negative influence on the deviance depending on the cause (factor) of deviant
workplace behavior.
We have also discovered that prejudice that people from Eastern (Poland) Europe
are more tended to exercise deviant behavior than Western (France) Europeans
does not have scientific proof. The theoretical review and empirical research
showed that Poland and France are very similarly predisposed to deviant
workplace behavior. In fact, France is even more predisposed to deviance than
Poland due to the competition and theft approval factors. Thus, the prejudice
about different Eastern and Western cultures can be contradicted and it means that
former Eastern and Western blocks become homogeneous Europe.
6.4 Suggestions
Consideration of “cultural diversity-workplace deviance” connections and
adherence to actual situation in the company when solving deviant workplace
behavior problem should lead to the decrease of workplace deviance extent, and
consequently assure “healthy” climate in the organization. The survey analysis
showed that country culture affects deviant behavior. We discovered that there are
two cultural dimensions (individualism-collectivism and uncertainty avoidance)
which significantly effect deviant behavior of an employee. Therefore, the
suggestions are:
124
Solutions arising from uncertainty avoidance dimension
− The study showed that strong uncertainty avoidance indicates lower
tendency to organizational deviance. In this case, if the country culture has
low uncertainty avoidance, the solution for management could be to adapt
the characteristics of strong uncertainty avoidance country culture in the
organization. For example, establishing more formal rules, having
structured work schedule, staying concerned with daily operations and not
showing uncertainty in decision making and implementation process.
− However, if there is a tendency to interpersonal deviance that management
could recognize from growing frustration, then it is advisable to
demonstrate low uncertainty avoidance societies features, where top
managers should be concerned with strategy and entrepreneurs should be
relatively free from rules.
Solutions arising from individualism-collectivism dimension
− Individualism positively influences production deviance. In order to avoid
production deviance in individualistic societies, the solutions could be to
establish a moral relationship between managers and their employees in
order to establish mutual trust and create “collectivistic” environment.
Second, to focus on management of groups, by establishing a common
goal for employees in order to make them feel part of the same team.
− Managers working in collectivistic societies should be especially careful
not to treat employees inequitably because employees of collectivistic
societies are tended to overreact to inequitable and injustice management
behavior. Thus, this behavior can result in strong any type workplace
deviance.
125
6.5 Theoretical value
Theoretical value of this work was created by connecting two research areas:
deviant workplace behavior and cultural diversity theories by empirically
verifying hypotheses about the connections between cultural dimensions and
types of deviance. In order to achieve more generalisable and elaborate results in
this research area, further research must be done. Therefore, this study could be
used as a starting point for new researches.
6.6 Practical implications
The practical value of developed “Cultural dimensions-deviant behavior”
connection and the need for this information can be explained by an increasing
number of multinational enterprises and growing extent of globalization in
business environment. Thus, knowledge about possible trickery and its patterns in
different cultures has increasing demand and value for companies. Moreover,
there are different prejudices about the tendencies of deviance in different
countries. Our initiative survey revealed that half out of eighty three respondents
think that deviant behavior is more common in Poland than in France and only
one third suppose that these countries are equally tended to deviance. However,
empirical research showed that both the French and Poles are similarly tended to
commit deviance, and that the French are more tended to commit deviance than
Poles arisen from intra-organizational competition. Thus, our empirically
confirmed theories are also useful in practice because managers will be able to
make business decisions based on proved hypotheses, not prejudices.
In addition, in our research we did not only develop cultural dimensions-deviant
behavior link, but also suggested how extent of deviant workplace behavior
problem could be reduced without big costs for the company in different
countries. This could be a guideline for managers dealing with this problem.
126
6.7 Critical reflections
In any research there are elements that could be improved. As our research topic is
very delicate and complex, even though we tried to avoid critical mistakes, some
improvements could be done in the future research:
� One of the problems of this work is that it is too extensive; however, as it
is a new research area, detailed descriptions were needed to explain how
theories were developed and tested.
� The limitation of this study is that hypotheses are valid under certain
conditions (factors); thus, the reasons of workplace deviance must be
considered before making conclusions about workplace deviance in terms
of country culture. However, as it is the first study about the impact of
country culture on deviant workplace behavior, factors’ influence could
not be avoided.
� Another restraint of this study is that long-short term orientation and
femininity-masculinity dimensions were not tested because we were
focusing on similarities between France and Poland. Therefore, we did not
reflect these dimensions’ relations to workplace deviance as it would have
been contradictory to our plan to challenge the prejudice. However, it
would also be interesting to explore how long-short term orientation and
femininity-masculinity dimensions could affect workplace deviance.
� In some cases cultural dimensions could be interpreted incorrectly since
they are presented from many perspectives. Therefore, some of the results
were ambiguous.
� It would be interesting to involve more variables into this research as it is
based on the comparison of only two countries and their cultural
similarities.
� Moreover, perhaps qualitative research would be even more useful in this
research as it could provide a deeper understanding of deviant workplace
behavior problem and not always human behavior can be explained by
digits.
� Moreover, psychology specialist’s assistance would be useful in creation
of a questionnaire. This could help to extract honest answers and obtain
more trustworthy results.
127
6.8 Further research
Our actual research could be a base for the further research in which all critical
remarks could be re-considered. Stepwise suggestions for the further research are:
− To retest the hypothesis 1 (because it was partly supported) and
hypothesis 8 (because it showed ambiguous results and could not be
correctly analyzed).
− The research showed that both Poles and the French are similar in the
tendency to commit certain types of deviance. In order to test other
cultural dimensions, the research should be tested with cultures which
have different cultural dimensions combinations.
− The research did not take into account impacts of other factors than
cultural dimensions. Consequently, our suggestion for further research
could be to include more social variables in the work in order to test the
influence of other background effects on deviant workplace behavior.
− Finally, a similar research on the employees, instead of business students,
could be done. The aim of this research would be to compare the results of
both surveys and evaluate the difference between organizational and
individual approaches. This research could be of qualitative type and
reflect new in-sights of the problem.
6.9 Final thoughts
There is no universal recipe how to deal with workplace deviance. Thus, to solve
the problem of deviant behavior in the companies of different cultures, many
different aspects of deviant workplace behavior must be contemplated in order to
find the best solutions. Literature review shows that there are many different
factors that could predict deviant workplace behavior. Therefore, research which
analyzes the nature of deviance from cultural perspective cannot have one strict
explanation. As many different aspects of culture must be adhered in terms of
128
different deviance factors, cultural dimensions cannot explain the nature of
deviance in “one way”. That is why the same dimension can indicate various
tendencies of deviance depending on the factors. This study should provide a
wider perspective of the workplace deviance problem in global environment, and,
thus, lead to development of deviance control mechanism.
129
References Appelbaum, S. H, Iaconi, G. D, Matousek, A., 2007. Positive and negative deviant
workplace behaviors: causes, impacts, and solutions. Corporate Governance, [Online] 7 (5), p. 586 – 598. Available at: www.emeraldinsight.com/10.1108/14720700710827176 [accessed 12 September 2008]
Appelbaum, S.H., Deguire, K.J., Lay, M., 2005. The relationship of ethical
climate to deviant workplace behavior. Corporate Governance, [Online] 5 (4), p.43-56. Available at: www.emeraldinsight.com/10.1108/14720700510616587 [accessed 12 September 2008]
Bolin, A., Heatherly, L., 2001. Predictors of employee deviance: the relationship
between bad attitudes and bad behavior. Journal of Business and Psychology, [Online] 15(3), p. 405-418. Available at: http://web.ebscohost.com.ezproxy.bibl.hkr.se/ehost/detail?vid=14&hid=105&sid=fcf29ff9-7166-4760-bbd2-40add7cf2997%40sessionmgr108 [accessed 10 September 2008].
Das, T. K., 2005. Deceitful behaviors of alliance partners: potential and
prevention. Management Decision, [Online] 43 (5), p. 706 – 719. Available at: www.emeraldinsight.com/10.1108/14720700710827176 [accessed 12 September 2008]
Forensic Service. Available at: http://www.kpmg.com.my/kpmg/publications/fas/fsurvey_2004.pdf [accessed 20 September 2008].
Henle, C.A., 2005. Predicting workplace deviance from the interaction between
organizational justice and personality. Journal of Managerial Issues, [Online] 17 (2), p. 247. Available at: http://www.allbusiness.com/human-resources/careers/464519-1.html [accessed 14 September 2008].
Hofstede, G., Hofstede, G. J., 2005. Cultures and organizations: Software of the
mind. New York: McGraw-Hill, USA. Howitt, D., Cramer, D., 2001. A guide to computing statistics with SPSS for
Windows. Harlow: Pearson Education Limited. Hussey, J., Hussey, R., 1997. Business research: a practical guide for
undergraduate and postgraduate students. Basingstoke : Macmillan Business. Insee, enquêtes Emploi, 2007. Niveau général de formation selon l’age. [Online].
Institut national de la statistique et des études économiques. Available at: http://www.insee.fr/fr/themes/tableau.asp?reg_id=0&ref_id=NATTEF07232 [accessed 9 October 2008].
130
Jankowicz, A. D., 2000. Business research projects. 3d ed. Luton: Business Press, Thomson Learning.
Kolman et al. 2003. Cross cultural differences in Central Europe. [Online].
Journal of managerial psychology. MCB UP Ltd. Available at: http://www.emeraldinsight.com/Insight/viewContentItem.do?contentType=Article&contentId=881536 [accessed 12 October 2008].
Kulik, B.W, O’Fallon, M. J, Salimath, M.S., 2008. Do Competitive Environments
Lead to the Rise and Spread of Unethical Behavior? Parallels from Enron. Journal of Business Ethics, [Online] 10.1007/s10551-007-9659-y. Available at: http://springerlink.metapress.com.ezproxy.bibl.hkr.se/content/v22044q6j0431214/fulltext.pdf [accessed 14 September 2008].
Liao, H., Joshi, A., Chuang, A., 2004. Sticking out like a sore thumb: employee
dissimilarity and deviance at work. Personnel Psychology, [Online] Vol. 57 (4), p. 969-1000. Available at: http://www.allbusiness.com/labor-employment/human-resources-personnel-management/11425189-1.html [accessed 13 September 2008].
Linton, R., 1999. Cultural Background of Personality [Online], Florence, KY: Routledge. Available at: http://site.ebrary.com/lib/kristianstad/Doc?id=10017428&ppg=48 [accessed 10
November 2008]. Mole, J., 2003. Mind your manners, managing business cultures in the new global
Europe. London: Nicholas Brealey publishing, UK. OECD, Labor market. 2007. Employment rates by age group [Online]. OECD
Factbook 2007. Available at: http://www.thepresidency.gov.za/learning/reference/factbook/pdf/06-01-02.pdf [accessed 9 October 2008].
Olenski, J., 2007. Demographic year book of Poland 2007. [Online]. Editorial of
central statistic office. Available at: http://www.stat.gov.pl/cps/rde/xbcr/gus/PUBL_PUBL_Demographic_yearbook_of_Poland_2007.pdf [accessed 9 October 2008].
Perrier, D., 2007. PwC Global Economic Crime Survey 2007. 4e enquête sur la
fraude dans les entreprises en France, en Europe et dans le monde. [Online]. Price Water House Coopers. Available at: http://www.pwc.fr/etude_sur_la_fraude_dans_les_entreprises_en_france_en_europe_et_dans_le_monde_en_2007.html [accessed 16 September 2008].
Peterson, D., 2002. Deviant workplace behavior and the organization’s ethical
climate. Journal of Business and Psychology, [Online] 17 (1), p. 47-61. Available at: http://web.ebscohost.com.ezproxy.bibl.hkr.se/ehost/detail?vid=8&hid=105&si
131
d=fcf29ff9-7166-4760-bbd2-40add7cf2997%40sessionmgr108 [accessed 09 September 2008].
Ramoneda., P.B., 2007. Profile of a fraudster. Survey 2007. [Online]. KPMG
International, Forensic Service. Available at: http://www.kpmg.co.uk/pubs/ProfileofaFraudsterSurvey(web).pdf [accessed 20 September 2008].
Robinson, S., Bennett, R., 1995. A typology of deviant workplace behaviors: a
multi-dimensional scaling study. Academy of Management Journal, 38 (2), p. 555-572.
Robinson, S.L., Bennett, R.J., 2000. Development of a measure of workplace
deviance. Journal of Applied Psychology, [Online] 85 (3), p. 349-60. Available at: http://www.sciencedirect.com.ezproxy.bibl.hkr.se/science?_ob=ArticleListURL&_method=list&_ArticleListID=801243167&_sort=d&view=c&_acct=C000034818&_version=1&_urlVersion=0&_userid=646840&md5=347d6bba5d4d0df3899815450e9e0e62 [accessed 13 September 2008].
Saunders, M., Lewis, P., Thornhill, A., 2007. Research methods for business
students. 4. ed. Harlow : Financial Times/Prentice Hall. Sims, R. L., 2002. Ethical Rule Breaking by Employees: A Test of Social
Bonding Theory. Journal of Business Ethics, [Online] 40 (2), p.101-109. Available at: http://springerlink.metapress.com.ezproxy.bibl.hkr.se/content/m82527326t501016/fulltext.pdf [accessed 12 September 2008].
Smart J. et al. 2007. A survey into fraud risk mitigation in 13 European countries,
[Online]. Ernst & Young GM Limited. Available at: http://www.ey.com/global/assets.nsf/International/FIDS_Fraud_Risk_Mitigation/$file/FIDS_Fraud_Risk_Mitigation.pdf [accessed 20 September 2008].
Thau, S., Bennett, R. J., Mitchell, M. S., Marrs, M. B., 2008. How management
style moderates the relationship between abusive supervision and workplace deviance: An uncertainty management theory perspective. Organizational Behavior and Human Decision Processes, [Online] doi:10.1016/j.obhdp. Available at: http://www.sciencedirect.com.ezproxy.bibl.hkr.se/science?_ob=ArticleURL&_udi=B6WP2-4T0NGCW-2&_user=646840&_coverDate=07%2F16%2F2008&_alid=800540160&_rdoc=1&_fmt=high&_orig=search&_cdi=6978&_sort=d&_docanchor=&view=c&_ct=1&_acct=C000034818&_version=1&_urlVersion=0&_userid=646840&md5=0bb6f73963288cf2a5119057de1cc300 [accessed 14 September 2008].
Trevino, L.K., Brown, M.E, 2005. The role of leaders in influencing unethical
behavior in the workplace. In Kidwell, R.E., Martin, C.L. (Eds), Managing Organizational Deviance [Online], Sage Publishing, London, p.69-96.
132
Available at: http://www.sagepub.com/upm-data/4910_Kidwell_Chapter_3.pdf [accessed 16 September 2008].
133
Appendix 1: Questionnaire about the deviance
1*. Which country are you from?
France Poland
2*. What is your gender?
Male Female
3*. How old are you?
4*. In which year of studies are you?
First Second Third Fourth Fifth More than 5
5*. Have you had a work experience in your field of studies?
No
Yes (Please specify how long)
6*. It’s nothing wrong to take company’s property ( without permission).
Strongly disagree
Disagree
Neither agree nor disagree
Agree
Strongly agree
7*. Imagine that you were planning to quit your job as you found a better one. How will you behave? You can choose more than one answe r.
You will feel more free to take paper, pens, printer ink or other stationary home or to the new workplace
You will start leaving the workplace earlier than usual or take some days off pretending you are sick
You will go to the petrol station where your company has discount and fill in the tank of your private car at discounted rate
Your working habits will not change.
134
8*. Imagine that you are not satisfied with your wo rkplace; you feel that your organization does not pay enough attention to you, the ethical climate is bad thus you feel frustrated. To express your frustration yo u will (you can choose more than one answer):
Complain to your co-workers about supervision
Try to create a new circle of friends at the workplace and support each other
Make everybody understand that they cannot walk on your head, you will probably curse somebody to protect yourself
Try to defend yourself making harassing remarks or jokes at work
Handle it without any complains and without any help 9*. Imagine that in the company where you work your colleagues are lying about working hours to the boss. You will:
Report to your superior
Pretend that you do not know anything about it
Do the same as your colleagues as it is generally accepted (in-group solidarity)
10*. To which group of following opinions do you th ink you belong in terms of your competitiveness?
Business is a world of sharks, everybody is eating each other at all costs
Sometimes you have to make some sacrifice to reach your goal, therefore occasionally illegal means (in e.g. corruption, bribery) are justifiable when necessary
I am not very competitive; therefore I could step over the rules in order to reach my personal goals only when it’s a question of survival
Business is being honest and following all the necessary regulations and norms and competition could not force me to break them
11*. Imagine that you are at work and you finished all your tasks of the day. What will you do?
Leave workplace a bit earlier, since my main tasks were accomplished
Will work on my personal matter instead of finding some other things to do
I will discuss some matters with my colleagues to be aware about last changes inside the company (intra organizational information exchange)
I can find something to do, even if it makes me work longer
12*. My boss has raised my colleague who has less e xperience and lower educational level than me therefore I don’t see any thing wrong if I intentionally work less efficient, take longer breaks or feel mor e free to break other rules of the company. Anyway, I am not judged on my competence.
Strongly disagree
Disagree
135
Neither agree nor disagree
Agree
Strongly agree
13*. I wouldn’t like to work in a company with quit e formalized work structure, big emphasis on norms and regulations because I would h ave to give the detailed reports about the hours worked, money spent on busi ness trips and so on.
Strongly disagree
Disagree
Neither agree nor disagree
Agree
Strongly agree
14*. Imagine that you work in a company in which yo u do not feel that management is certain about situation and decision making and is not sure what they are doing. Would you then break company’s rules more often?
Yes, I would try to use the uncertainty situation as much as possible ( for example I would exaggerate expenses account to get more reimbursement for money than I spent on business expenses) since management doesn’t really understand anything
Yes, I would try to use uncertainty situation to some extent, for example to take additional or longer breaks than acceptable, work on personal matters instead of working for my employer.
I am not sure if I would or wouldn’t use uncertainty situation to break the rules.
I don’t think I would break the rules more often as I don’t feel any discomfort about management uncertainty.
I would definitely not break the rules or act unethically at any case.
136
Appendix 2: Research about the prejudice of deviance
137
Appendix 3: SPSS tables used in the analysis
Table 1 Mann-Whitney U test of question 6
Test Statistics a
Q6Property
Mann-Whitney U 264.500
Wilcoxon W 589.500
Z -1.774
Asymp. Sig. (2-tailed) .076
a. Grouping Variable: Country of
respondents
Table 2 Mann-Whitney U test Mean rank value for question 6
Ranks
Country
of
responde
nts N Mean Rank Sum of Ranks
France 29 30.88 895.50
Poland 25 23.58 589.50
Q6Property
Total 54
Table 3 Cross tables Chi-Square test of question 7, answer variant: theft
Chi-Square Tests
Value Df
Asymp.
Sig. (2-
sided)
Exact Sig. (2-
sided)
Exact Sig. (1-
sided)
Pearson Chi-Square .088a 1 .767
Continuity Correctionb .000 1 1.000
Likelihood Ratio .089 1 .766
Fisher's Exact Test 1.000 .572
Linear-by-Linear
Association .086 1 .769
138
N of Valid Casesb 54
a. 2 cells (50.0%) have expected count less than 5. The minimum expected count is 2.31.
b. Computed only for a 2x2 table
Table 4 Cross tables Chi-Square test of question 7, answer variant: absenteeism
Chi-Square Tests
Value Df
Asymp. Sig. (2-
sided)
Exact Sig.
(2-sided)
Exact Sig.
(1-sided)
Pearson Chi-Square .730a 1 .393
Continuity Correctionb .238 1 .625
Likelihood Ratio .745 1 .388
Fisher's Exact Test .480 .316
Linear-by-Linear Association .716 1 .397
N of Valid Casesb 54
a. 2 cells (50.0%) have expected count less than 5. The minimum expected count is 4.17.
b. Computed only for a 2x2 table
Table 5 Cross tables Chi-Square test of question 7, answer variant: privilege abuse
Chi-Square Tests
Value df
Asymp. Sig. (2-
sided)
Exact Sig.
(2-sided)
Exact Sig.
(1-sided)
Pearson Chi-Square .004a 1 .950
Continuity Correctionb .000 1 1.000
Likelihood Ratio .004 1 .950
Fisher's Exact Test 1.000 .610
Linear-by-Linear Association .004 1 .950
N of Valid Casesb 54
a. 0 cells (.0%) have expected count less than 5. The minimum expected count is 5.09.
b. Computed only for a 2x2 table
139
Table 6 Cross tables Chi-Square test of question 7, answer variant: no organizational
deviance
Chi-Square Tests
Value Df
Asymp. Sig.
(2-sided)
Exact Sig. (2-
sided)
Exact Sig.
(1-sided)
Pearson Chi-Square .006a 1 .939
Continuity Correctionb .000 1 1.000
Likelihood Ratio .006 1 .939
Fisher's Exact Test 1.000 .585
Linear-by-Linear Association .006 1 .940
N of Valid Casesb 54
a. 0 cells (.0%) have expected count less than 5. The minimum expected count is 7.87.
b. Computed only for a 2x2 table
Table 7 Cross tables Chi-Square test of question 8, answer variant: gossiping
Chi-Square Tests
Value Df
Asymp. Sig. (2-
sided)
Exact Sig.
(2-sided)
Exact Sig.
(1-sided)
Pearson Chi-Square .742a 1 .389
Continuity Correctionb .346 1 .557
Likelihood Ratio .745 1 .388
Fisher's Exact Test .425 .279
Linear-by-Linear Association .729 1 .393
N of Valid Casesb 54
a. 0 cells (.0%) have expected count less than 5. The minimum expected count is 11.57.
b. Computed only for a 2x2 table
Table 8 Cross tables Chi-Square test of question 8, answer variant: favoritism
Chi-Square Tests
Value Df
Asymp. Sig. (2-
sided)
Exact Sig.
(2-sided)
Exact Sig.
(1-sided)
Pearson Chi-Square .054a 1 .816
140
Continuity Correctionb .000 1 1.000
Likelihood Ratio .054 1 .816
Fisher's Exact Test 1.000 .516
Linear-by-Linear Association .053 1 .817
N of Valid Casesb 54
a. 0 cells (.0%) have expected count less than 5. The minimum expected count is 11.57.
b. Computed only for a 2x2 table
Table 9 Cross tables Chi-Square test of question 8, answer variant: verbal abuse
Chi-Square Tests
Value Df
Asymp. Sig. (2-
sided)
Exact Sig.
(2-sided)
Exact Sig.
(1-sided)
Pearson Chi-Square .423a 1 .516
Continuity Correctionb .110 1 .741
Likelihood Ratio .426 1 .514
Fisher's Exact Test .545 .372
Linear-by-Linear Association .415 1 .519
N of Valid Casesb 54
a. 0 cells (.0%) have expected count less than 5. The minimum expected count is 6.02.
b. Computed only for a 2x2 table
Table 10 Cross tables Chi-Square test of question 8, answer variant: harassment
Value Df
Asymp. Sig. (2-
sided)
Exact Sig.
(2-sided)
Exact Sig.
(1-sided)
Pearson Chi-Square .292a 1 .589
Continuity Correctionb .024 1 .876
Likelihood Ratio .296 1 .587
Fisher's Exact Test .711 .441
Linear-by-Linear Association .287 1 .592
N of Valid Casesb 54
141
a. 2 cells (50.0%) have expected count less than 5. The minimum expected count is 3.70.
b. Computed only for a 2x2 table
Table 11 Cross tables Chi-Square test of question 8, answer variant: no interpersonal deviance
Chi-Square Tests
Value df
Asymp. Sig. (2-
sided)
Exact Sig.
(2-sided)
Exact Sig.
(1-sided)
Pearson Chi-Square .456a 1 . 499
Continuity Correctionb .058 1 .809
Likelihood Ratio .466 1 .495
Fisher's Exact Test .675 .409
Linear-by-Linear Association .448 1 .503
N of Valid Casesb 54
a. 2 cells (50.0%) have expected count less than 5. The minimum expected count is 2.78.
b. Computed only for a 2x2 table
Table 12 Mann-Whitney U test of question 9
Test Statistics a
Q9GroupBehavior
Mann-Whitney U 351.000
Wilcoxon W 786.000
Z -.236
Asymp. Sig. (2-tailed) .814
a. Grouping Variable: Country of
respondents
Table 13 Cross tables Chi-square test for question 10
Chi-Square Tests
Value df
Asymp. Sig. (2-
sided)
Pearson Chi-Square 11.433a 3 .010
Likelihood Ratio 12.022 3 .007
Linear-by-Linear Association .175 1 .676
142
Chi-Square Tests
Value df
Asymp. Sig. (2-
sided)
Pearson Chi-Square 11.433a 3 .010
Likelihood Ratio 12.022 3 .007
Linear-by-Linear Association .175 1 .676
N of Valid Cases 54
a. 0 cells (.0%) have expected count less than 5. The minimum
expected count is 5.56.
Table 14 Cross tables Chi-square for question 11
Chi-Square Tests
Value Df
Asymp. Sig. (2-
sided)
Pearson Chi-Square 3.628a 3 .305
Likelihood Ratio 3.675 3 .299
Linear-by-Linear Association .506 1 .477
N of Valid Cases 54
a. 1 cells (12.5%) have expected count less than 5. The minimum