Country of Origin and Customer-based brand equity: A quantitative study on Chinese cars going global Marketing Master's thesis Ye Liu 2012 Department of Marketing Aalto University School of Economics
Transcript
Country of Origin and Customer-based brand equity: Aquantitative study on Chinese cars going global
Marketing
Master's thesis
Ye Liu
2012
Department of MarketingAalto UniversitySchool of Economics
AALTO UNIVERISTY SCHOOL OF ECONOMICS ABSTRACT Marketing Master’s Thesis 30 March 2012 Ye Liu Country of Origin and customer-based brand equity: a quantitative study on Chinese cars going global
Objectives: The objective of this study is to examine the role of brands’ Country of Origin (COO) effects on the brands customer-based brand equity. To be more specific, this study focuses on the consumer perceptions towards Chinese brands, automobile brands in particular, in the international market in order to understand how Chinese brands’ customer-based brand equity is influenced by brands’ Chinese identity and what are the strategies to effectively counter the negative influence provoked by the brands’ COO. The study is realized through three major research areas: 1) examination of current customer-based brand equity of Chinese brands in the international market 2) the Country of Origin effects on Chinese automobile brands 3) feasible strategies on improving the customer-based brand equity for Chinese automobile brands. In a word, this study aims to clearly underlie the relationship between Country of Origin effects and brands’ customer-based brand equity as well as to discover factors that hinder the growth of Chinese brands equity in the international market. Corresponding practical implications are presented in the end to provide feasible and market-based suggestions for future improvements. Research Method: This study uses a quantitative research method, which is realized through an online consumer questionnaire. A snowball sampling is applied in order to circulate the questionnaire through major social network platforms. The questionnaire received 212 respondents in the end and 204 of which are considered valid. Most questions are closed ended questions measured by a 1-5 likert scale while three questions are open ended, one of which was designed to collect consumer thoughts for the practical implications. Findings: The results provided by the questionnaire do not indicate an overall positive feedback on Chinese brands, which indicates inadequate customer-based brand equities for the brands that are associated with Chinese origin. The negative effects of China being the brands origin is discovered to be transferrable across brands from all kinds of categories, indicating the exclusion of product-category country association in this field. Additionally, it is proved that the Country of Origin effects and the customer-based brand equity share a bi-directional relationship, where mutual influences are detected to constantly shape and form consumers’ perceptions. Quality resulted to be the major factor that sabotage the brand image while brand image, on the other hand, is treated as an indicator of quality standard. Last but not least, factors that are essential to conduct improvements are discussed, and the channels through which the outcome could reach its best are listed. Research limitations: The fact that the main empirical data was collected in the form of consumer questionnaire could possibly generate bias, especially when it is approached by a snowball sampling method. Further, due to time and budget limit, interviews with experts in the filed were not realized. Professional insights are, thus, missing. As solutions provided in this study were solely based on consumers’ opinion without taking into account of experts’ suggestions, strategies stated here could be rather one-sided. Implications provided may not be suitable for all Chinese brands cross industries of all kinds and resources needed to realize the strategies may vary among different companies. Practical implications: Implications of this study is presented according to the results provided by factor analysis. Strategies concerning effectively counter negative Country of Origin effects are categorized into: product-related attributes, external association and brand differentiation while the marketing channels are discussed in terms of word of mouth and mass media. Keywords: Country of Origin, Customer-based brand equity, branding, Chinese brands
TABLE OF CONTENTS 1 INTRODUCTION ....................................................................................................... 1
1.1 Chinese cars going global ........................................................................................ 3 1.2 Objectives ................................................................................................................. 4 1.3 Structure of the study ............................................................................................... 6
2 LITERATURE REVIEW ........................................................................................... 7 2.1 Brand equity in a nutshell ........................................................................................ 7 2.2 Customer-based brand equity ................................................................................... 8
2.4 Country of origin (COO) as an effect on branding ................................................ 22 2.4.1 COO effects on the dimensions of CBBE ...................................................... 23
2.5 Countering country of origin (COO) effects .......................................................... 30 2.6 Theoretical synthesis and research framework ...................................................... 35
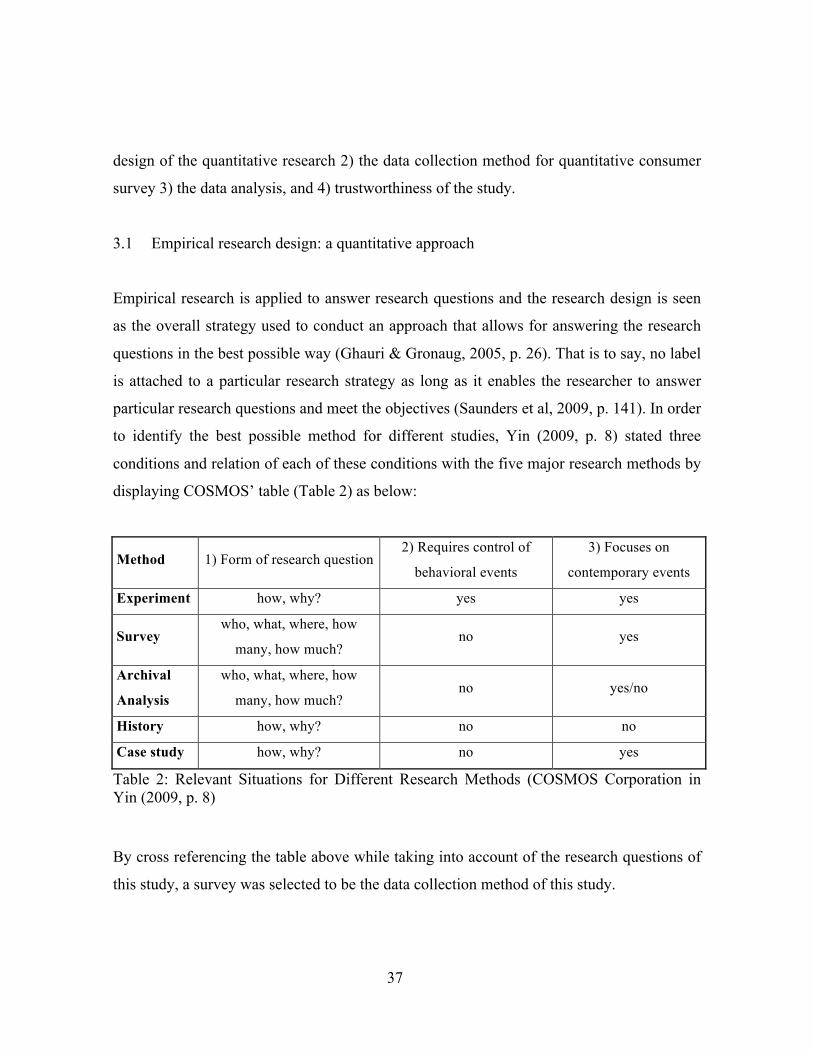
3 RESEARCH METHOD ............................................................................................ 36 3.1 Empirical research design: a quantitative approach ............................................... 37
3.1.1 Survey: a quantitative self – administered questionnaire ............................... 38 3.2 Data collection ....................................................................................................... 39
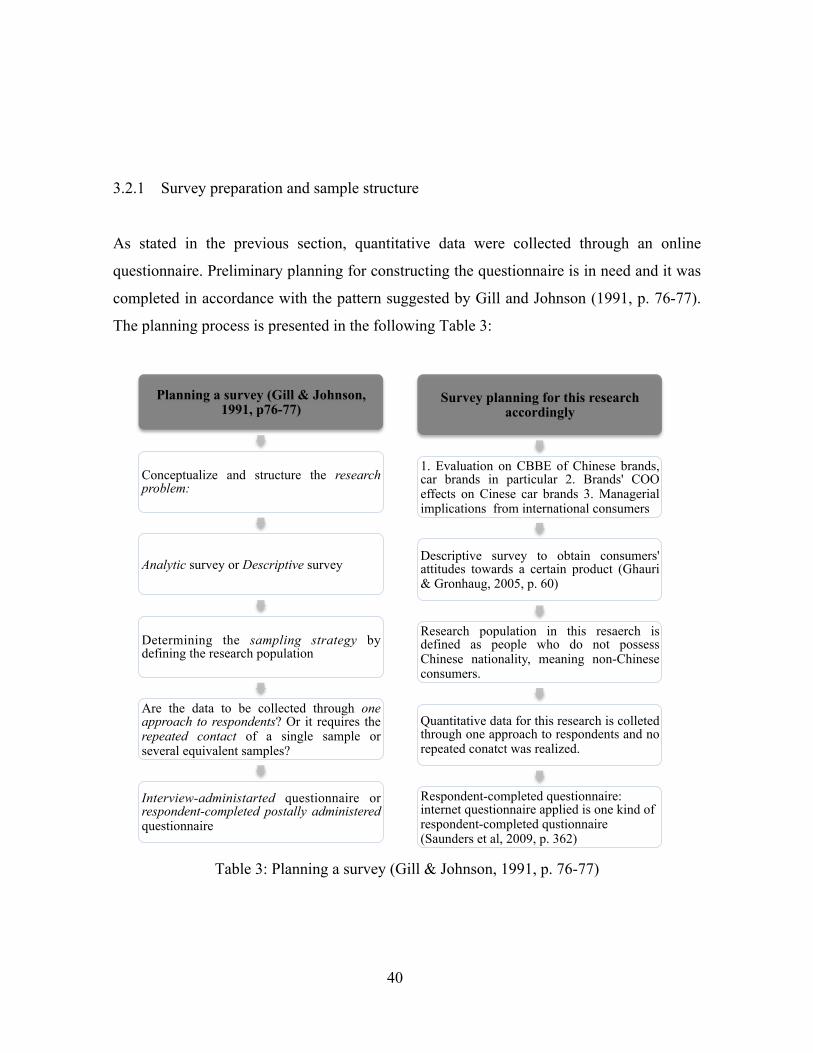
3.2.1 Survey preparation and sample structure ........................................................ 40 3.2.2 Constructing questionnaire and the tailored design method ........................... 44
3.3 Data analysis .......................................................................................................... 46 3.3.1 Questionnaire data analysis ............................................................................ 46
3.4 Trustworthiness of the study .................................................................................. 47 4 EMPIRICAL FINDINGS ......................................................................................... 49
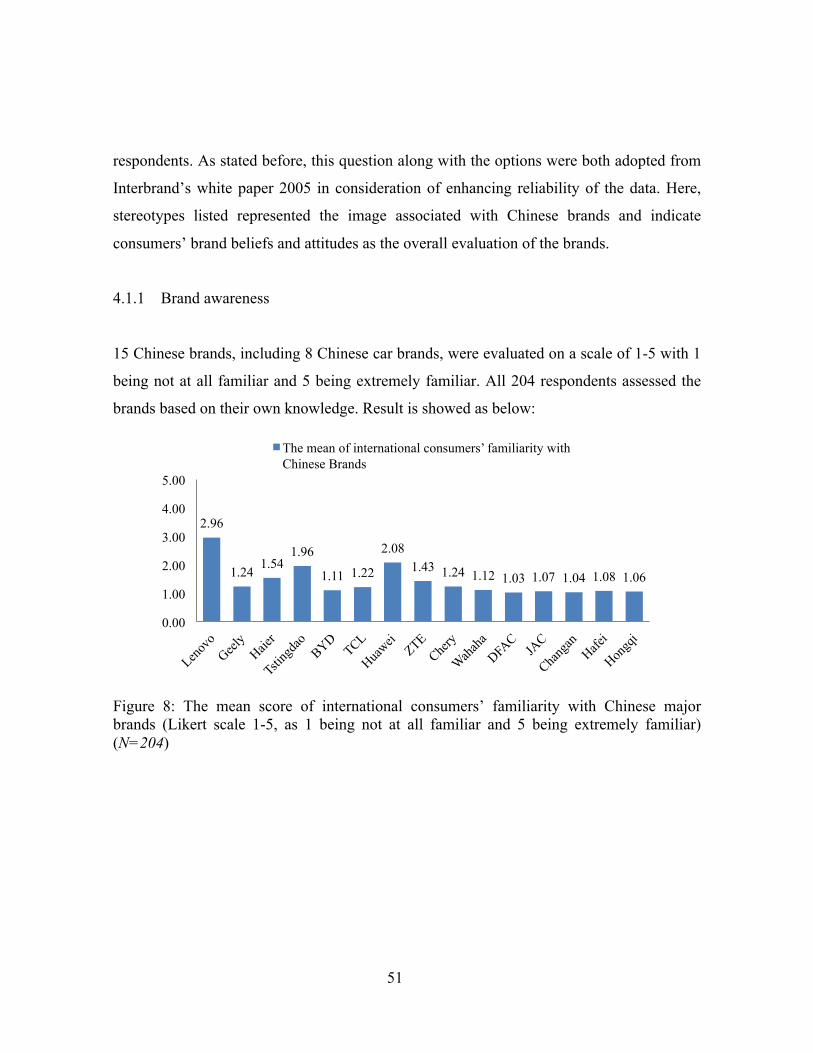
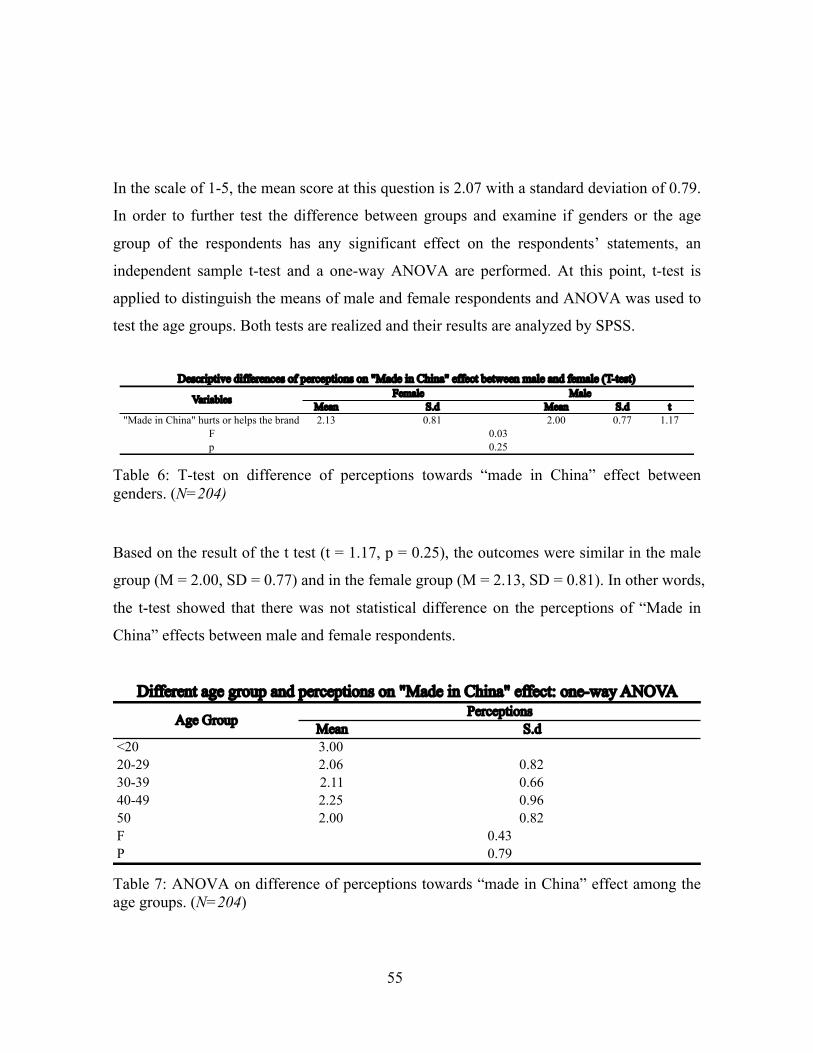
4.1 Customer-based brand equity of Chinese brands in general .................................. 50 4.1.1 Brand awareness ............................................................................................. 51 4.1.2 Brand image and its country of origin ............................................................ 54 4.1.3 Chinese brands and China as a COO .............................................................. 57 4.1.4 Summary ......................................................................................................... 59
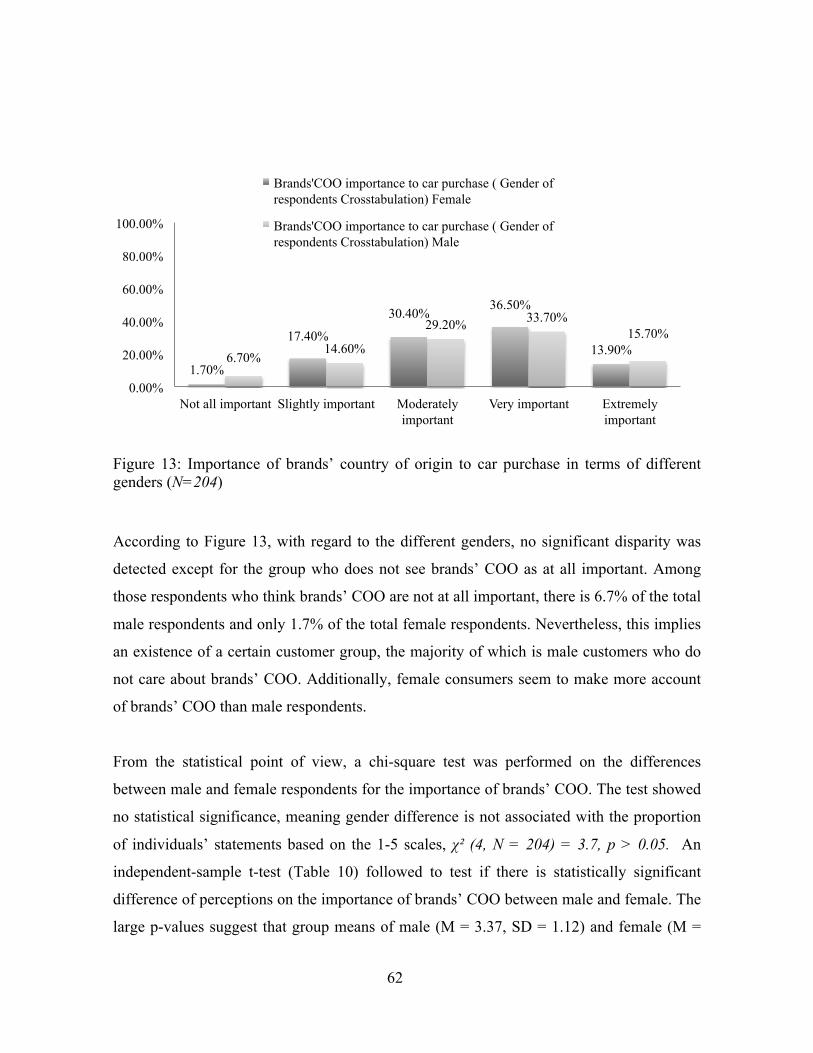
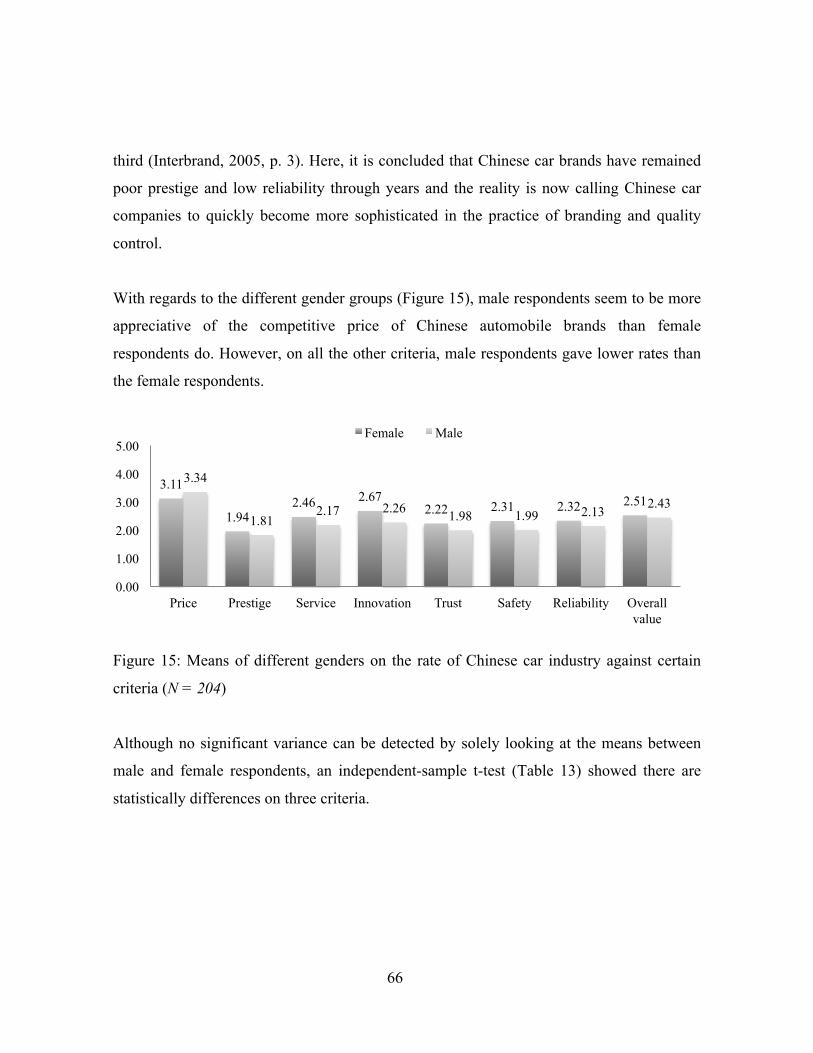
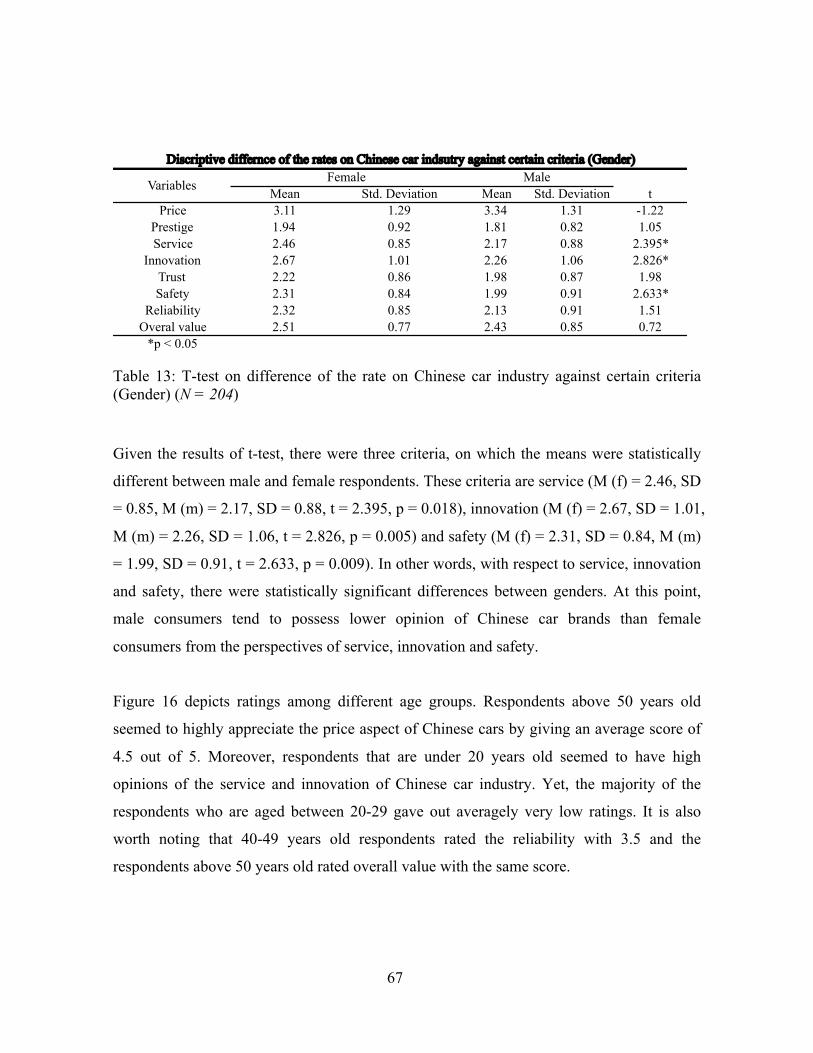
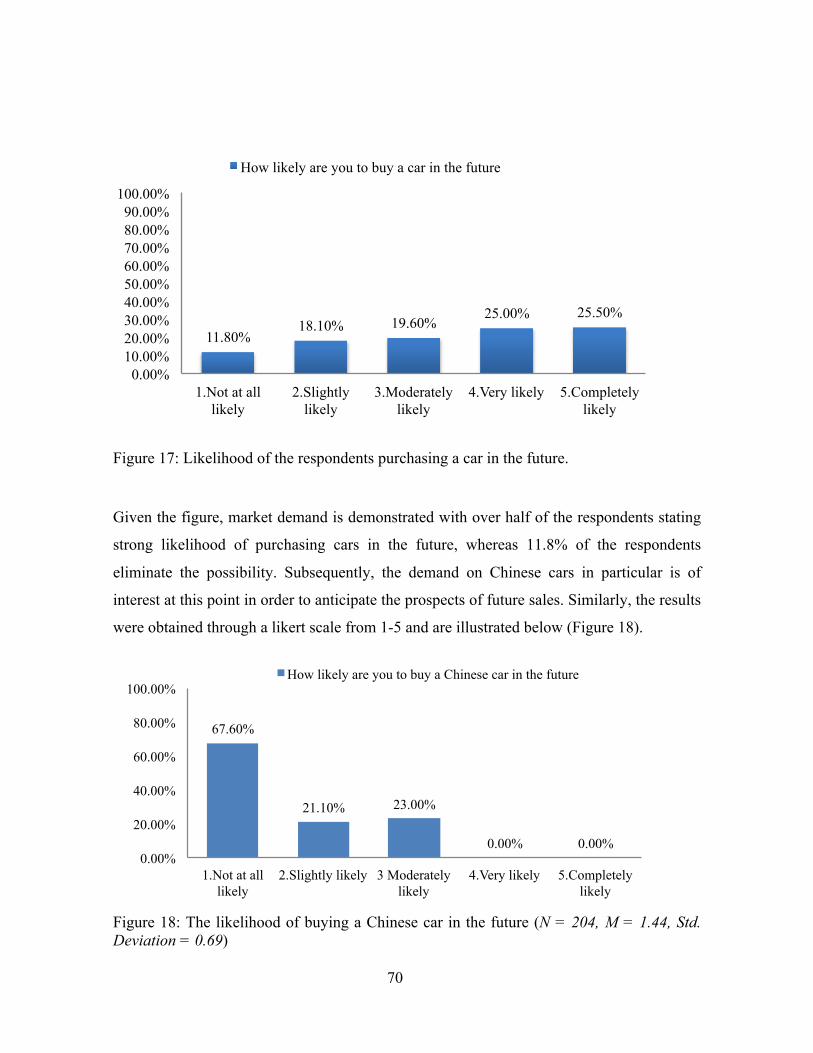
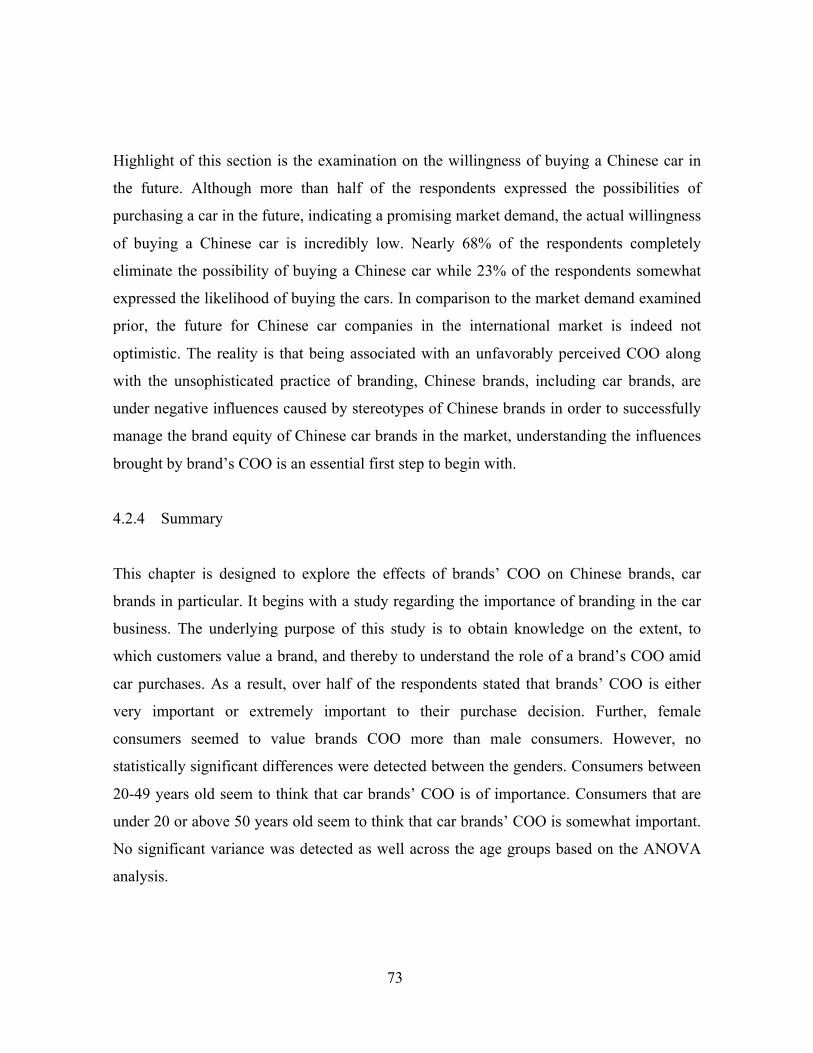
4.2 COO effects on Chinese automobile brands .......................................................... 60 4.2.1 Importance of brands’ country of origin in the car business .......................... 61 4.2.2 Consumers’ evaluation of Chinese car industry ............................................. 64 4.2.3 Market prospects for Chinese car brands ........................................................ 69 4.2.4 Summary ......................................................................................................... 73
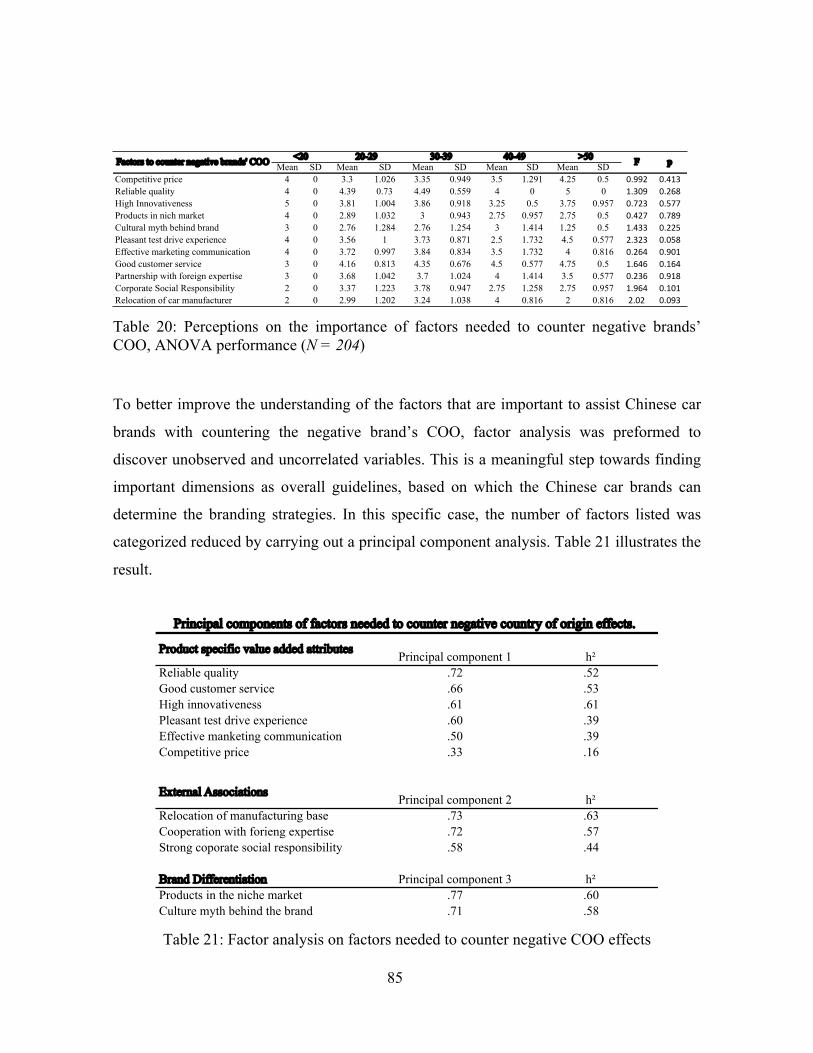
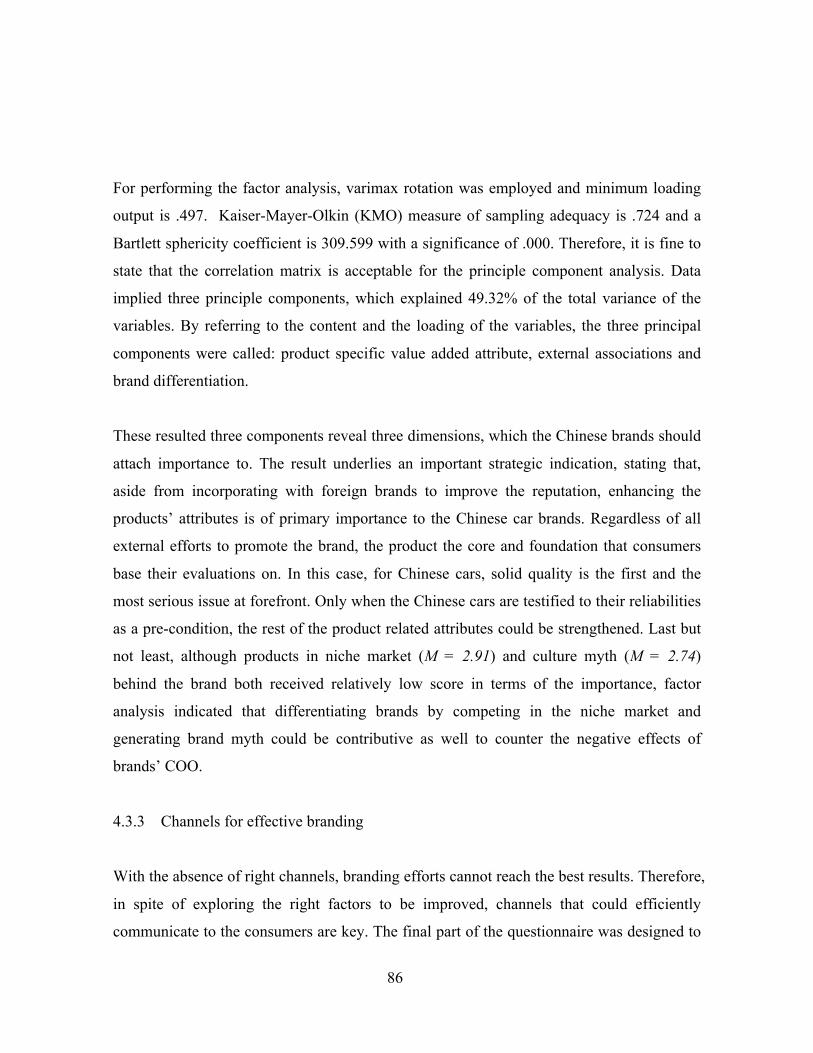
4.3 Improving customer-based brand equity of Chinese car brands ............................ 77 4.3.1 M&A on improving the image of a Chinese car brand ................................... 77 4.3.2 Factors needed to counter the negative brands’ country of origin effects ...... 80 4.3.3 Channels for effective branding ...................................................................... 86
4.3.4 Summary ......................................................................................................... 91 5 CONCLUSIONS AND DISCUSSIONS .................................................................. 93
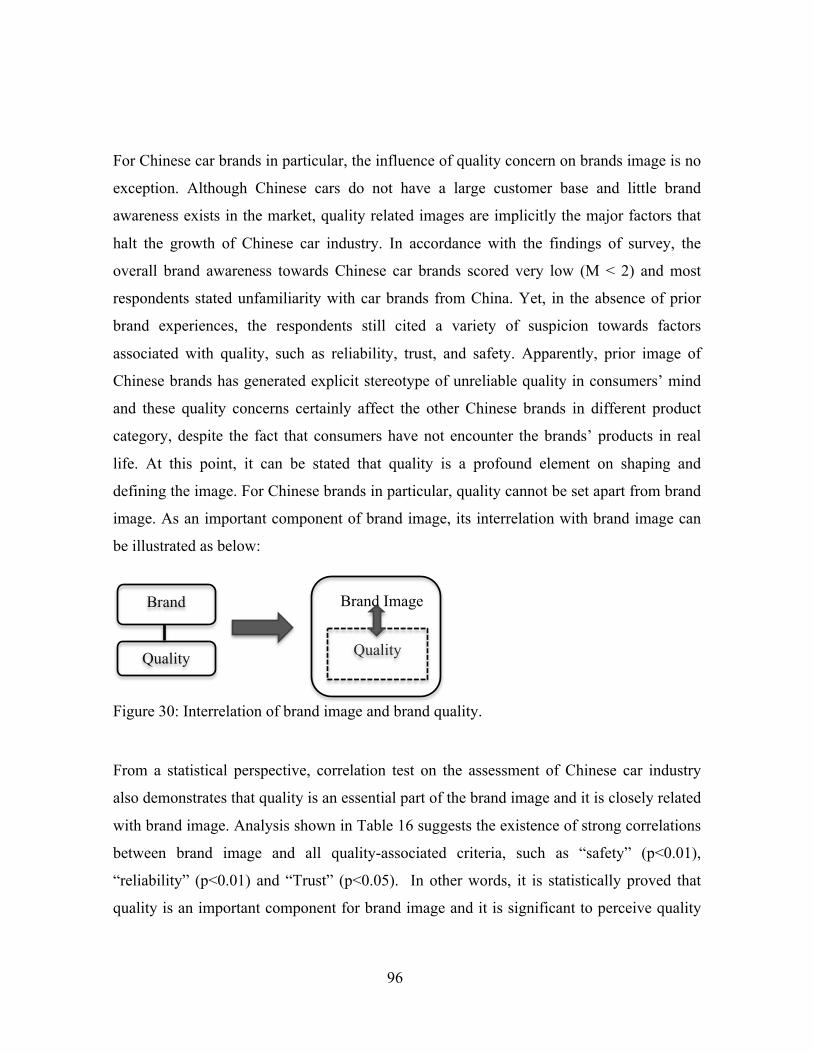
5.1 Revised framework ................................................................................................ 93 5.1.1 Relations between the brand image and country of origin effects .................. 93 5.1.2 The roles of brand image and brand quality ................................................... 95 5.1.3 The omission of product category– country association and brand loyalty ... 97 5.1.4 Determination of double negative brands ..................................................... 100
5.2 Strategic and managerial implications ................................................................. 102 5.2.1 Product specific value-added attributes ........................................................ 103 5.2.2 External association ...................................................................................... 108 5.2.3 Brand differentiation ..................................................................................... 108
5.3 Limitations and further research .......................................................................... 110 5.4 Conclusions .......................................................................................................... 112
REFERENCES .................................................................................................................. I APPENDICES ................................................................................................................ XX
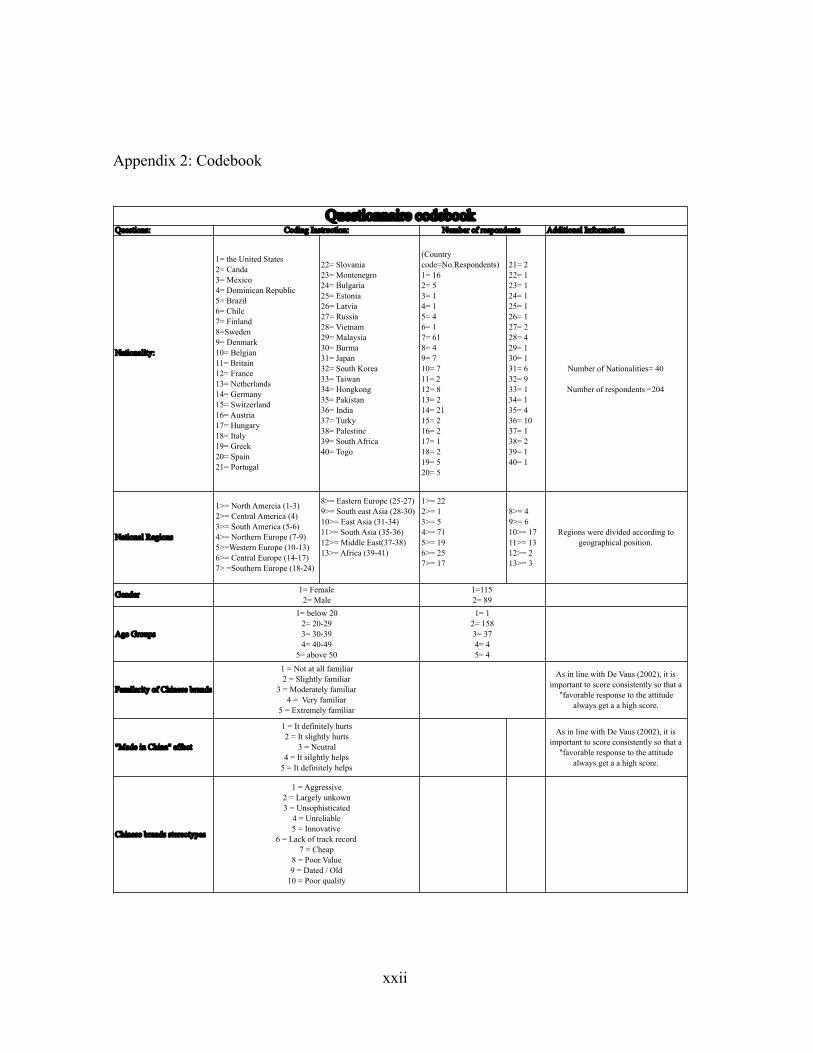
Appendix 1: Quantitative survey on consumer perceptions towards Chinese brands .... xx Appendix 2: Codebook ................................................................................................... xx
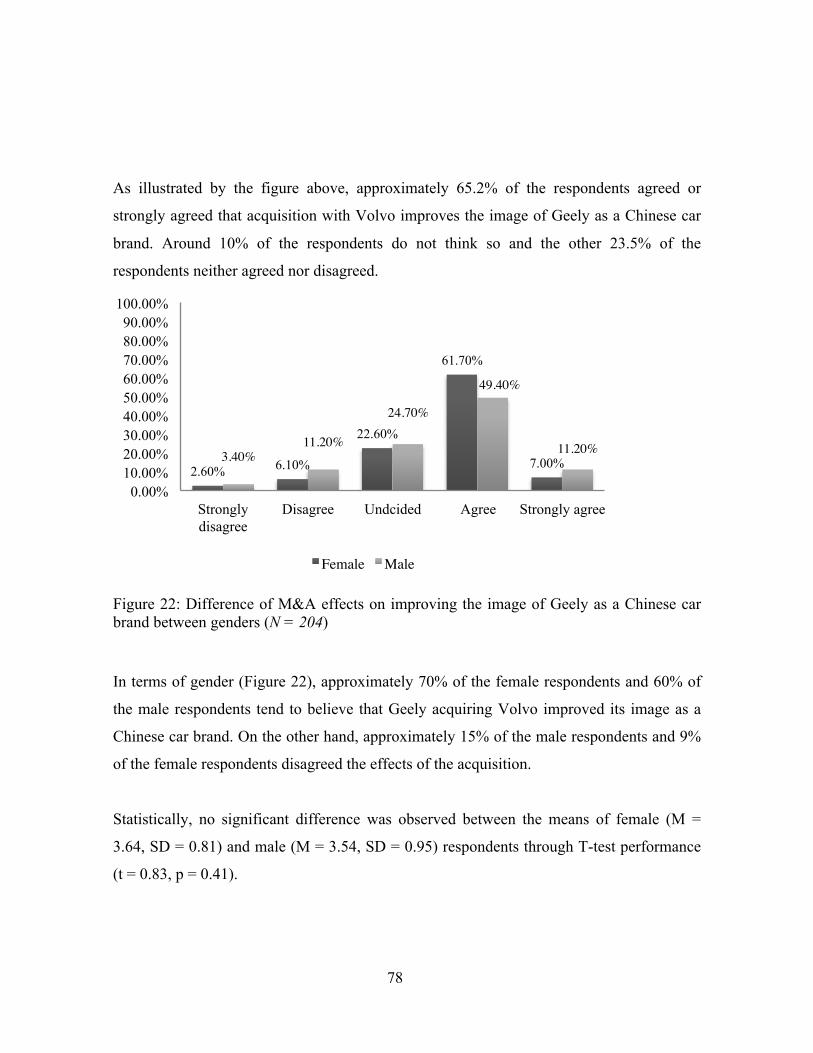
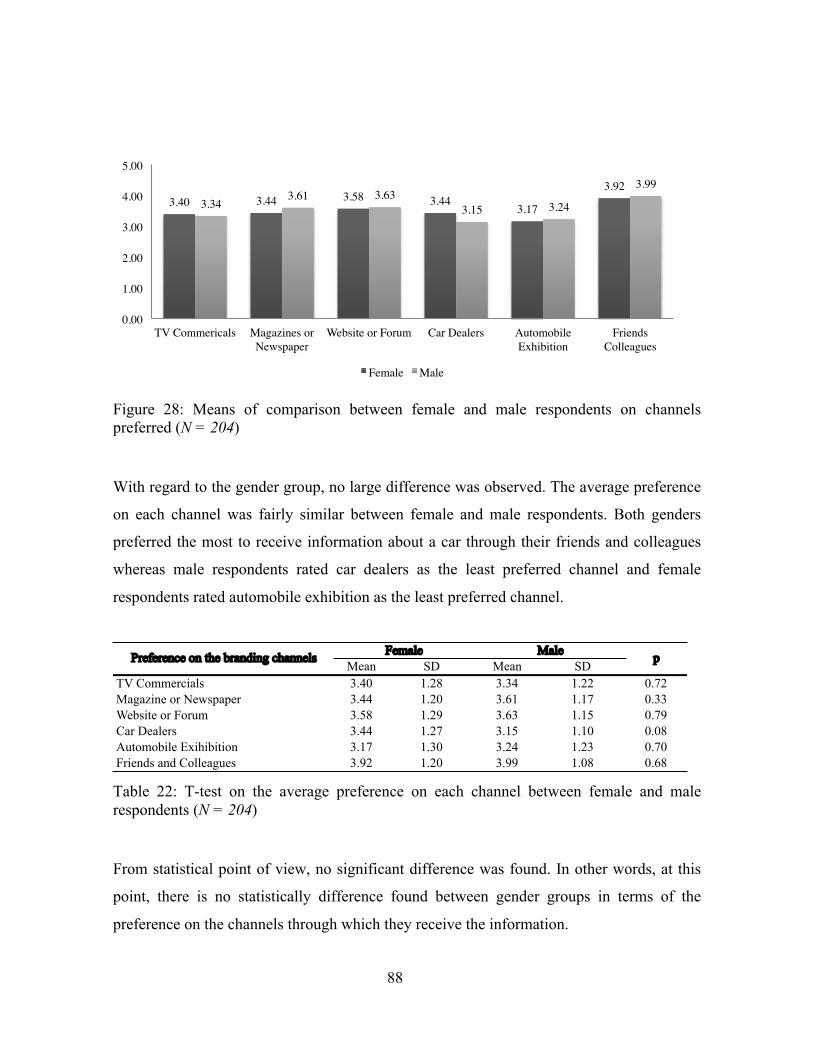
LIST OF FIGURES Figure 1: Brand Equity Model 9 Figure 2: Brand Equity Model 9 Figure 3: Proposed customer-based brand equity 10 Figure 4: A sequence of steps for building up the CBBE model 20 Figure 5: Customer-Based Brand Equity Pyramid 22 Figure 7: Building Customer-Based Brand Equity under negative impact of Country of Origin Framework 36 Figure 8: The mean score of international consumers’ familiarity with Chinese major brands 51 Figure 9: The means of different gender on the awareness of Chinese brands. 53 Figure 10: “Made in China” Effects on the Chinese brands 54 Figure 11: To what extent does consumers’ image of Chinese brands influence their attitudes towards China as the COO. 58 Figure 12: Importance of brands’ COO to car purchase 61 Figure 13: Importance of brands’ country of origin to car purchase in terms of different genders 62 Figure 14: Means of Chinese car industry on a scale of 1-5 against listed criteria 65 Figure 15: Means of different genders on the rate of Chinese car industry against certain criteria 66 Figure 16: Means of age groups on Chinese car industry against certain criteria 68 Figure 17: Likelihood of the respondents purchasing a car in the future. 70 Figure 18: The likelihood of buying a Chinese car in the future 70 Figure 19: The likelihood of different gender on buying Chinese car in the future 71 Figure 20: The likelihood of different genders on buying Chinese car in the future 72 Figure 21: Effect of merger and acquisition of Volvo on the image improvement of Geely as a Chinese car brand. 77 Figure 22: Difference of M&A effects on improving the image of Geely as a Chinese car brand between genders 78 Figure 23: Difference of M&A effects on improving the image of Geely as a Chinese car brand among age groups. 79 Figure 24: The means of importance of the factors needed to counter negative Country of Origin 81 Figure 25: Means of different gender on the importance of factors needed to counter negative image of brands’ country of origin 82 Figure 26: Means of different age groups on the importance of factors needed to counter negative image of brands’ country of image 84 Figure 27: The mean of preferences on channels through which consumers would like to receive information about cars 87 Figure 28: Means of comparison between female and male respondents on channels preferred 88 Figure 29: Preference on Channels in terms of different age groups 89 Figure 30: Interrelation of brand image and brand quality. 96 Figure 31: Modified relationship between the effect of Country of Origin and
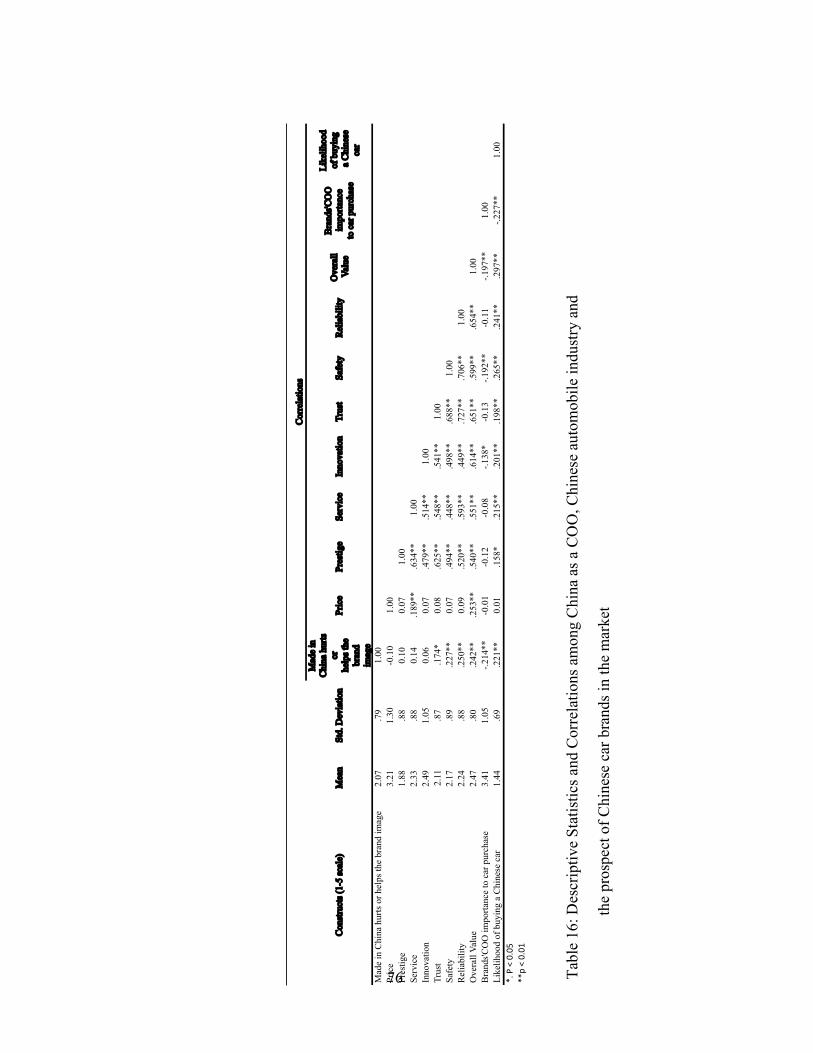
LIST OF TABLES Table 1: Brand popularity and country image 33 Table 2: Relevant Situations for Different Research Methods 37 Table 3: Planning a survey 40 Table 4: Demographics of the respondents to the quantitative questionnaire 43 Table 5: The standard deviation of international consumers’ familiarity with Chinese major brands 52 Table 6: T-test on difference of perceptions towards “made in China” effect between genders. 55 Table 7: ANOVA on difference of perceptions towards “made in China” effect among the age groups. 55 Table 8: Top five impression of Chinese brands today. 56 Table 9: Results obtained by Interbrand in 2005. 57 Table 10: Independent-sample t-test on the importance of car brands’ COO between different genders. 63 Table 11: Frequencies of different age groups on the importance of Car brands’ COO to car purchase. 63 Table 12: ANOVA of the Brands’ COO importance to car purchase among different age groups. 64 Table 13: T-test on difference of the rate on Chinese car industry against certain criteria. (Gender) 67 Table 14: Means differences on the ratings of Chinese automobile industry against certain criteria (age groups) 68 Table 15: ANOVA test on means of the likelihood of buying a Chinese car across the age groups 72 Table 16: Descriptive Statistics and Correlations among China as a COO, Chinese automobile industry and the prospect of Chinese car brands in the market 76 Table 17: ANOVA of the agreement on the actual effects of Geely acquiring Volvo on its brand image improvement 80 Table 18: Top 5 factors that are important to counter the negative brands’ COO 82 Table 19: Perceptions on the importance of factors needed to counter negative brands’ COO between gender groups, Independent sample t-test 83 Table 20: Perceptions on the importance of factors needed to counter negative brands’ COO, ANOVA performance 85 Table 21: Factor analysis on factors needed to counter negative COO effects 85 Table 22: T-test on the average preference on each channel between female and male respondents 88 Table 23: ANOVA to compare the average preference on each channel among different age groups. 89
Table 24: Principal components of channels consumers prefer to receive information about Chinese car brands 90 Table 25: Determination of the brands’ category 101
1
1 INTRODUCTION
“He who owns the brands owns the wealth”
(Cass Creative Report, 2004)
“China is always going to be an important element of the global advertisement
business…but we have been struck with the reverse potential: we do not see any reason
why Chinese brands cannot have the same impact in the US, as US brands have had in
China”
(Xinhua, 2004)
China, as the biggest emerging economy, is seen as the world’s factory. This world’s
factory manufactures cheap and low quality consumer goods for brands of well-known
global companies and well-known foreign retailers. According to Barboza (2006), China is
now the world’s number one producer in 172 categories of different consumer and
industrial products. Yet, as the world’s second largest economy, when talking about
successful Chinese brands in the global market, very few Chinese brands could be
recognized worldwide.
Branding awareness was not a well-recognized concept among Chinese companies dates
back to the establishment of People’s Republic. Enforcement of Russian-style centrally
planned economy and the following Culture Revolution severely restricted the development
of branding by stating advertising as evil and deceptive. Advertising was consequently
disappeared till the 1978 when the reform and open door policy started. Nevertheless,
compared to its neighboring country, such as Japan, China has already fallen behind in
many categories.
From a historical perspective, Fan (2005) identified three periods in the development of
branding in China after 1978, which was seen as three major phases of country’s
2
transformation to a market economy from the planned economy. During 80’s, the economy
mainly focused on eliminating shortages resulted from centrally planned economy and
branding was not perceived as a determinant by most of the companies. Consumers, at the
time, chose products mainly based on functionality, not brand. In the 90’s, as the open
policy going further, more foreign brands started invading the Chinese market and market
supply started to exceed demand, which consequently caused the selling and advertising
along with price competition. With no prior experiences, strategies of Chinese brands were
primarily focusing on corporate identity with little attention to product value. This directly
led to predicaments that few Chinese companies were able to survive in the increasingly
competitive market. Yet, with buyers started to recognize brand names and brand loyalty
started to conduct its natural outcome, last decade of the 20’s witnessed dramatic growth in
the advertising business, with average annual growth rates of around 40 percent. This could
be reflected on total advertising revenue that increased more than 28 times to 72.2 billion
RMB (US$ 9 billion) between 1990 and 2000, taking China into the top ten largest markets
for advertising services. However, in a big market as China, foreign brands still stay
dominant across most of the industries. In electronics industry, most of the Chinese
companies do not possess brands, but rather prefer to be original equipment manufacturers
(OEMs) for global brands. In the automotive industry, amid competitive turbulence in the
field, leading positions of German and Japanese brands have barely been challenged by
local Chinese brands. Those extended time of closed economy has resulted in deficient
branding expertise in most of the Chinese companies, and consequently inflicts damages on
their brand competitiveness.
Facing the increasingly competitive domestic market and realizing the development of
domestic brands is essential for the nation’s continuous economic growth, the Chinese
government announced the “go global” strategy, by which it tried to encourage the nation’s
most promising enterprises to go abroad and establish their own brands.
3
1.1 Chinese cars going global
“Here come Chinese cars, look out Detroit”
(Bloomberg Businessweek, 2005)
In November 2009, Ministry of Commerce of the People’s Republic of China (MOFCOM),
National Development and Reform Commission (NDRC) of China and other six ministries
jointly issued a paper called "Opinions on the promotion of sustained and healthy
development of China's auto exports”, in which point 7 explicitly stated governments’
intention on pushing Chinese cars to the international market. This signifies that Chinese
government is putting its heft behind the export push, encouraging and supporting domestic
car brands to develop their own brands overseas. The paper was seen as an important
announcement to the world that China is gearing up to be a big auto exporter as well as
being committed to take over the international market with its own automotive brands.
With techniques continued to mature and the experiences continued to accumulate through
foreign cooperation, and now with government’s push and support, Chinese top automotive
brands, such as Chery and Geely, going out and reaching the international market is no
longer impossibility.
Chery, a Chinese state-owned automobile manufacturer founded in 1997, made its first
export to Syria in 2001 and started its international departure ever since. So far, Chery is
the top exporter among Chinese automakers, a title it held since 2003. As of this year, the
company has already established dealership in some countries throughout Europe after
penetration in the South American market. The company’s major objective is to establish a
comprehensive distribution network all over the Europe by 2015. Geely, another major
Chinese automobile manufacturer who just started its automobile business in 2001, has
already been exploring international market since 2003. The company’s sales have been
continuously growing in Europe and America since 2007. In 2010, Geely successfully
acquired Swedish luxury brand Volvo with a total payment of $ 1.8 billion. For the record,
4
it is the largest overseas acquisition by Chinese automaker and a significant step to help
Geely’s going global ambition. By 2015, the company is expected to produce a total
amount of 200 million cars, half of which will be sold in the international market (China
Daily, 2009).
While most of the Chinese car brands have ambitiously started their intenational departure
and being aggressive on buying out foreign companies, it is necessary to observe from
another perspective and ask questions – is the international market ready for Chinese cars?
What do consumers know about Chinese car brands and how do they perceive another
round of product invasion from China?
In order to answer those questions, this study is designed to explore consumers’ perception
towards the phenomenon of Chinese cars going global as well as to observe effects of
brands’ Chinese identity on their customer-based brand equity (CBBE) in the international
market.
1.2 Objectives
This study provides several contributions that improve understanding of how international
consumers think about Chinese cars going global in terms of CBBE as well as to receive
knowledge on how Country of Origin (COO) affects brand equity and what are the
strategies to counter negative effects caused by brands’ COO images amid “Chinese cars
going global” phenomenon.
In the interest of comprehensiveness of this study, three different aspects need to be
considered. First, status quo of Chinese brands as a whole and China as a COO image are
investigated so as to receive knowledge of Chinese brands’ existing CBBE in the market.
Next, the study takes a further step to explore the role of COO on Chinese automobile
brands in particular, thereby providing insights into conditions of how consumers perceive
5
Chinese automobile industry and whether effects of COO has transferred onto the Chinese
automobile brands. Last but not least, given the status quo of Chinese automobile brands
and from the stand of international consumers, knowledge on improving the CBBE of
Chinese automobile brands is presented.
Thus, on the basis of above three aspects, research questions were formulated. Concerning
the research method for this study, information obtained through these questions is
considered as consumer-based so that the practicability of this study can be reached.
1. Existing customer-based brand equity of Chinese brands in the international market:
a. How are international consumers aware of Chinese brands?
b. What are the images of Chinese brands in the minds of international
consumers?
c. Does “China” label positively or negatively influence the Chinese brands in
the International market?
2. Country-Of-Origin effects on Chines car brands
a. How important is brands’ country-or-origin to car purchases?
b. How do international consumers think of Chinese car industry in general?
c. Prospects on Chinese cars’ international sales.
3. Improving customer-based brand equity for Chinese car brands
a. How do international consumers think of the acquisition between Geely and
Volvo?
b. What aspects should Chinese car brands improve the most in order to obtain
strong customer-based brand equity?
c. What communication channels are the most preferred by consumers for
success of branding effort?
Last but not least, from the managerial perspective, this study provides a framework that
captures the linkage between CBBE and the effects of brands’ country of origin images as
6
well as provides guidelines for Chinese automobile brands to effectively improve brands’
equity.
1.3 Structure of the study
In this section, structure of the study will be introduced as well as content of each section
will be briefly stated.
Chapter 1 introduces the background of why Chinese companies have been left behind in
the field of branding and why the Chinese government is urged to create globally
recognized brands in order to keep the growth of economy and create sustainability.
Discussion on the phenomenon of Chinese cars going global follows to further introduce
the objective of this study, according to which research questions are then listed at the end.
Chapter 2 outlines theories of CBBE and COO effects on brands’ equity, both of which
carry significant importance to brands’ cross boarder performance. Besides, theories
purported to different “brand popularity” and “Country of origin” effect combinations are
presented in an attempt to explore strategies for Chinese automobile brands. A framework
will be placed at the end of this chapter as an illustration of relationship among all the
theoretical constructs as well as a theoretical foundation of this study.
Chapter 3 presents the design of survey questionnaire and the process of data collection.
Data analysis will then follow to describe methods employed for interpreting the data.
Reliability and validity of the research method are presented at the end of this chapter to
justify the trustworthiness of this study.
Chapter 4 discloses the empirical findings of the study, which are analyzed and interpreted
in accordance with the theories outlined in Chapter 2.
7
Chapter 5 compares the theoretical framework with empirical findings, based on which a
revised framework will be proposed and justified. Managerial implications as important
guidelines for the brands are exclusively discussed afterwards. Limitations of the study and
conclusion then follow at last as closure of the study.
2 LITERATURE REVIEW
Literature review is dedicated to present the existing knowledge on CBBE and COO as an
effect. In the following sections, leading theories on conceptualization of CBBE and the
establishment of it will be presented. It is then followed by descriptions about the effects
that COO provokes on CBBE. Existing strategies that counter the negative effects of COO
are highlighted at the end in an attempt to provide practical insights for the study.
2.1 Brand equity in a nutshell
Brand equity has been an issue of importance in recent years. In a study done by Aaker
(1992, p. 56) who asked 250 business managers what is the biggest asset that gives firm a
sustainable competitive advantage, brand equity was given as an answer by most of the
managers. Being supported by statistics, Forgacs (2006) indicated the brand penetration in
the ratio of branded vs. non-branded properties is more than 70% in the US and around
40% in Canada regarding commercial lodging industry. Although in Europe it is under
25%, the ratio is growing at an accelerated rate (Frogacs, 2006).
Yoo and Donthu (2001) defined the brand equity as the difference in consumer choice
between the focal branded product and an unbranded product. Atilgan et al (2009, p. 115)
refined the definition by explaining the “difference” as “the utility difference in terms of a
positive marketing outcome, which is created by a branded product compared to that of the
generic version of the same product.” According to Keller (2008, p. 44), the utility
8
difference or a positive marketing outcome both refer to the “added value” that is placed on
a branded product derived from past marketing efforts.
In marketing literature, brand equity is viewed mainly from two perspectives: customer-
based perspective and firm-based perspective (Atilgan et al, 2009, p. 115). On account of
the scope of this study, literature review will be dedicated only to the study of CBBE
2.2 Customer-based brand equity
Keller and Lehmann (2001) stated that CBBE concentrates on the perspective that
represents customer mind-set. Theoretical understandings towards CBBE vary among
literatures. Yet, two conceptual models presented respectively by Aaker (1991) and Keller
(1993) are perceived as prominent and valuable insights provided into the body of CBBE
(Atilgan et al., 2009, p. 117).
Aaker (1991, p. 15) defined brand equity as “a set of brand assets and liabilities linked to a
brand, its name and symbol, that add to or detract from the value provided by a product or
service to a firm and/or to that firm’s customers.” This definition is subsequently illustrated
by a model (Figure 1) consists of four dimensions that are perceived quality, brand
awareness, brand associations and brand loyalty (Aaker, 1996, p. 103). All the dimensions
are designed and measured in relation to consumer perceptions and in the pursuit of
increasing brands’ value (Atilgan et al, 2009, p. 118, Aaker, 1992, p. 56).
9
Figure 1: Brand Equity Model (Aaker, 1991)
Another well-known theory on CBBE is raised by Keller (1993, p. 2), who defines CBBE
as “the differential effect of brand knowledge has on consumer response to the marketing of
that brand.” CBBE model developed by Keller (1993, p. 46) is treated as the key to create
brand equity. Compared to Aaker’s (1991) conceptualization (Figure 1) of brand equity,
Keller’s (1993) understanding underlines the effects of brand knowledge by emphasizing
that “the power of a brand lies in what customers have learned, felt, seen, and heard about
the brand as a result of their experiences over time” (Keller, 2001, p. 3) Accordingly, Keller
(1993) developed another brand equity model (Figure 2) by stating brand knowledge as the
base of creating brand equity and categorized brand knowledge into two dimensions: brand
awareness and brand image (Keller, 2008, p. 48).
Figure 2: Brand Equity Model (Keller, 1993)
Brand equity
Brand Awareness
Brand Association
Perceived Quality
Brand Loyalty
Brand knowledge
Brand Awareness
Brand image
10
Regardless of these seemingly different dimensions incorporated in the two models, Atilgan
et al (2009, p. 117) implicated that both CBBE models of Aaker (1991) and Keller (1993)
are strictly intersecting. As in Aaker (1993)’s model perceived quality and brand
association are treated as two dimensions, Keller (1993, p. 3) associated brand image with
brand associations by defining the previous as “perceptions about a brand as reflected by
the brand associations held in consumer memory (p. 3).” Therefore, the underlying
association between brand image and brand association represents the same brand
knowledge in terms of CBBE. What Keller (1993) really left out from Aaker (1991)’s
model in defining CBBE is the brand loyalty dimension.
By drawing upon the intersection of the two mentioned models and in order to complement
both models, a proposed CBBE model (Figure 3) is shown below as the key foundation of
understanding consumer perceptions towards a brand. Each dimension in this proposed
model will be stated and discussed next.
Figure 3: Proposed customer-based brand equity
Customer-based Brand Equity
Brand Awareness
Brand Image
Brand perceived quality
Brand loyalty
11
2.2.1 Brand awareness
As one of the two dimensions of Keller (1993)’s CBBE model, brand awareness is of
importance to consumers’ decision-making. In literature, brand awareness is stated as
carrying strategic significances, which contribute greatly to the determination of
consumers’ purchasing decisions.
In regard of low involvement decision settings, brand awareness could become a prevalent
choice tactic to make a brand prominent (Bettman & Park, 1998; Hoyer & Brown, 1990;
Park & Lessig, 1981), especially when consumers do not know anything about the brands
in category or just simply do not care about the product or service (Keller, 2001).
Moreover, high brand awareness can distinguish a brand from consumers’ consideration set
so the likelihood of that specific brand being considered for purchase will be increased
(Baker et al. 1986; Nedungadi 1990). Hoyer and Brown (1990) further strengthened the
importance of brand awareness by stating that consumers, who once are aware of the brand
in a choice set, tend to choose the known brand even when other brands with better quality
are presented. In practice, Aaker (1991) proved this statement by an experiment. Aaker
(1992) and his colleagues placed three jars of peanut butter in front of some subjects. Result
showed that 73% subjects chose the branded peanut butter over the other two, even the
quality of the branded one is much lower. Supported by both theories and real-life
experiment, brand awareness is demonstrated to be an essential contributor to consumer
purchase decisions. It ought to be emphasized by marketers.
Keller (1993, p. 3) stated that brand awareness is “related to the likelihood that a brand
name will come to mind and the ease with which it does so”. It is triggered by the brand
node or trace in memory, which will be reflected by consumers’ ability to identify the brand
amid different circumstances (Keller, 1998, p. 49). Hoyer and Brown (1990) considered
brand awareness denotes a state of knowledge about a specific brand possessed by the
consumers and represents the lowest end of a continuum of the brand knowledge. Last but
12
not least, Holden (1993) probed the importance of brand awareness in brand choice and
indicates, with the support of his qualitative research, that brand awareness appears to be
operating as a cue to brand retrieval.
Aside from various definitions, studies of brand awareness were mainly realized in regard
of its effects on brand choice. In the 60s, Bird & Ehrengerg (1966) already studied the
effect of brand awareness on consumer purchase behavior. In the 90’s, Percy & Rossiter
(1992) and Keller (1993) proposed that effects of brand awareness could be realized
through two components: brand recognition and brand recall. Brand recognition is built
through familiarity of brands’ repeated exposure. It reflects the ability of consumers to
confirm prior exposure to the brand (Keller, 1998, p. 49). In other words, brand recognition
will assist consumers on distinguishing one brand as having been seen or heard previously
(Keller, 1993, p. 3). Brand recall, on the other hand, occurs through strong associations
with the product category or other relevant consumption cues. It reflects the ability of
consumers to retrieve the brand when given the product category (Keller, 2008, p. 49)
By examining the relations between brand awareness and brand recognition, Percy &
Rossiter (1992) indicated that brand recognition is based on existing brand awareness,
meaning that brands are already presented to the consumers and their correspondent brand
awareness do exist in consumers’ minds. Here, brand recognition drives category need in
the condition of brand awareness as an important premise that enables brand recognition to
function. This statement is consistent with Hoyer & Brown’s (1990) claim, which indicates
brand recognition as a cognitive process resulting from brand awareness. Brand recall, on
the other hand, requires a preliminary experience on a category need first (Percy &
Rossiter, 1992, p. 265). This category need then acts as a primary drive that enables
consumers to recall a brand or several brands within this category in order to generate
purchase decisions. With all that said, it is critical to understand here that brand recognition
and brand recall are two separate types of brand awareness that they are determined by
13
whether or not recognition of the brand drives category need or whether category need
drives brand awareness (Percy & Rossiter, 1992, p. 265).
2.2.2 Brand image: association and belief
As another component of brand knowledge, brand image is thought to consist of brand
associations attached to a brand. Keller understands brand image as “the consumers’
perceptions of a brand, which stem from the brand association in consumers’ memory
(Keller, 2008, p. 49).” Brand associations are considered as “anything linked in memory to
a brand” (Aaker, 1991, p. 109), such as product attributes (Yoo et al., 2000), brand name
(Zinkhan & Prenshaw, 1994) and price (Aaker, 1996). According to Keller (1993, p. 5),
brand associations vary based on their favorability, strength and uniqueness. Keller
believed that favorable, strong and unique brand associations in consumers’ memory will
trigger CBBE, leading to different consumer responses towards brands (2008, p. 50).
Attributes, benefits and attitudes were determined as the three major categories of brand
association. Attributes are decomposed into product-related and non-product-related
(Myers & Shocker, 1981; Keller, 2008, p. 93).
Product-related attributes refer to the essential physical compositions that are necessary for
performing product function valued by the consumers. Non-product-related attributes, on
the other hand, refer to the external factors of the products or services that influence the
purchase or consumption process, but are not physically part of the product (O’cass & Lim,
2001, p. 43; Keller, 2008, p. 93; Olson, 1977). Because product-related attributes are
defined in relation to the ingredients embodied in a product, they are visible, easy to
identify and easily modified by companies in regard of design and manufacturing (O’cass
& Lim, 2001, p. 43). Non-product-related attributes, however, is intangible due to their
indirect relationship with product function. Nevertheless, they may affect the purchase or
consumption process (Keller, 2008, p. 95). Keller (2008, p. 95) categorized non-product-
related attributes into five dimensions (Figure 4): price, user imagery (what type of person
14
uses the product or service), Usage imagery (where and under what types of situations the
product or service is used), brand personality, feelings and experiences.
Benefits are the personal value consumers attach to, or derived from, the attributes of
products or services (Keller, 2008. p. 93). Here, attributes ought to fulfill personal needs
from perspectives of functional, experiential and symbolic dimensions. Therefore, attributes
are of descriptive features, which are indicative of the value involved in the attributes that
are appreciated by the consumers (O’Cass & Lim, 2001, p. 43). Attitudes, as the last
category of brand awareness, generally depend on specific considerations concerning the
attributes and functional benefits of the brand (Keller, 1998, p. 100). Brand attitudes can be
formed on the basis of beliefs (Keller, 1998, p. 102). Winchester et al (2006) suggested
using customer belief as the main perspective of understanding brand associations,
especially when these beliefs derive from information that are developed from customer
interactions/experiences with a given brand (Winchester et al, 2006, p. 553), therefore,
accounting for the product attributes, perceived benefits, and various summary evaluations
of that given brand (Cass & Lim, 2001, p. 42). Winchester et al (2006, p. 553) claimed
brand associations would evolve along with the beliefs, which the latter develops into three
categories: positive, negative and neutral based on information received (Winchester et al,
2006, p. 553). These three different beliefs then enable consumers to compare the benefits
and deficits of different brands and, at the same time, they act as a cue for retrieval during
purchase processes or as a part of an overall attitude to certain brand. Given diagnostic
information it holds, brand belief is considered as effective on measuring brand knowledge,
and therefore, an important part of CBBE (Ailawadi et al, 2003; Winchester & Romaniuk,
2008; Winchester et al, 2008).
Winchester et al (2008, p. 553) explained positive brand belief as the representation of
desired qualities entailed by brands, while negative beliefs are those qualities considered
undesirable. While consumers do use both positive and negative brand beliefs to direct the
purchase process in contrast to positive brand belief, negative belief receive very little
15
attention in the academic literature (Winchester & Romaniuk, 2008, p. 356; Winchester et
al, 2006, p. 554). This implies that the negative brand belief side of CBBE should be
distinctively explored in order to understand the role and effects that negative brand beliefs
play in the consumer choice process (Winchester & Romaniuk, 2008, p. 356).
Two stages are considered to consist of consumer choice process prior to purchase:
constitution of a set of preferred brands (consideration) and determination of one brand
from the set (selection) (Howard & Sheth 1969; Nedungadi 1990). Negative belief may
contribute at each of these stages in different way. Two models that are commonly used to
explain these two stages: non-compensatory model and compensatory model (Lussier &
Olshavsky 1979; Moorthy et al. 1997). Non-compensatory model is used when consumers
already eliminate brands during the first stage, which is consideration stage, based on
negative beliefs about those brands (Kahn & Baron, 1995; Laroche et al. 2003). On the
other hand, compensatory model suggests that consumers simultaneously utilize both
positive and negative information to evaluate a brand (Kahn & Baron, 1995; Laroche et al,
2003). While these two models imply how different that negative brand belief may
influence consumer purchase decision, they also indicate that negative brand belief are
mainly a result of past usage of the brand and such negative brand experiences are
considered to influence either the consideration or selection stage in the future
(Winchester& Romaniuk, 2008, p. 357).
Winchester & Romaniuk (2008) examined the level of negative brand beliefs in
conjunction with different usage experiences in the aim of investigating the relationship
between usage status and the propensity of having negative brand beliefs. They concluded
that those “Never trieds”, who have not had any real usage experience with the brand, are
less likely to respond to negative attribute if they have not used a brand (Winchester &
Romaniuk, 2008, p. 368). Furthermore, to those current users, the act of them behaviorally
rejecting a brand may become the cause for more negative belief, and these negative beliefs
would become either a prior trigger of defection or a post hoc rationalization (Winchester &
16
Romaniuk, 2008, p. 369). Aside from those findings above, Wincheste & Romaniuk (2008,
p. 369) also clarified that the usage of a brand not only increases the propensity for a
response to a positive brand attribute, but also increases the chances that negative brand
attribute will receive a response and these responses are likely to even increase after
consumers stop using the brand. Last but not least, because those “Never trieds” is the
group of consumers who have the lowest response level of negative attributes, it is one of
the biggest challenges for marketers to break through and generate brand associations
(Romanuik & Sharp, 2004). This implies a main barrier that needs to be overcome when
marketing to non-users (Winchester & Romanuik, 2008, p. 370).
2.2.3 Brand perceived quality
Of primary importance, perceived quality is cited as one of the four types of summary
brand judgments that represent customers’ personal opinion and evaluation with regard to
the brand (Keller, 2001, p. 13-14). Perceived quality is thought be different from real
quality of a brand because the unpleasant experience with a brand’s product prior will
affect consumers’ judgments on the brand’s quality in the future (Hsin et al. 2009, p. 136;
Aaker 1996). Perceived quality is a relative concept that possesses situational, comparative,
and individual attributes. It will be affected by factors such as previous experience,
education level, and perceived risk and situational variables, which include purchase
purpose, purchase situation, time pressure, and social background from consumers
(Holbrook & Corfman, 1985).
Garvin (1983) proposes that perceived quality is defined on the basis of users’ recognition
and it is influenced by intrinsic and extrinsic cues, which are the evaluation basis for
consumers (Olshavsky, 1985; Zeithaml, 1988). According to Olson and Jacoby (1972),
extrinsic cues are understood as the factors that are product-related, yet, are apart from the
physical product. Intrinsic cues, contrarily, are understood as product attributes, which
cannot be changed or manipulated without change of the products’ physical characteristics.
17
Consumers’ evaluation towards a brand with respect to its quality is often compounded by
complexity amid purchasing situation (Pecotich & Rosenthal, 2001, p. 37). Studies on the
relationship between product physical or intrinsic cues and customers’ brand or product
evaluation have cultivated mixed results (Pecotich & Rosenthal, 2001, p. 37). There are a
few studies showed that physical quality or intrinsic cues had little effects on customers’
perceptions of quality in multi-cue situation (Allison & Uhl 1964, Jcoby et al. 1971).
However, latter studies by Szybillo and Jacoby (1974) Wheatley et al. (1981) indicated that
intrinsic cues have profound positive effects on consumer perceived quality. Further, Olson
(1977) hypothesized that intrinsic cues are more influential and more important than
extrinsic cues. A number of articles (Szybillo & Jacoby, 1974; Rigaux-Bricmont, 1982;
Hatch & Roberts, 1985; Fiore & Damhorst, 1992) supported this statement by claiming that
intrinsic cues involve higher predictive value and are better influencers in evaluating
quality than extrinsic cues across different product categories. Moreover, intrinsic cues are
thought to be more importance until they cannot be sufficiently predictive or when
consumers do not have the ability to evaluate and assess those cues (Agrawal and
Kamakura, 1999; Bredahl, 2003; Srinivasan et al., 2004).
Nevertheless, Zeithmal (1988) suggested that, in the absence of adequate information about
intrinsic product attributes, consumers tend to depend on extrinsic cues more. Four major
extrinsic cues, which are price, name, retailer reputation and level of advertising, are
considered to be frequently associated with perceived quality in research, especially the
role of price in quality inference has been supported in numerous studies (Olson, 1977; Rao
and Monroe, 1988; Zeithaml, 1988; Dodds et al., 1991). In a very recent article, Olsen et al
(2001) have suggested that intrinsic cues are mainly responsible for developing consumers’
perception about variation in quality while extrinsic cues are playing minor roles.
In addition to the intrinsic and extrinsic cues of a product, other dimensions of quality exist.
Both Gavin (1987) and Bucks and Zeithaml (1991) proposed two conceptualizations of
perceived quality. Gavin (1987) suggested eight dimensions that conceptualize brands’
18
perceived quality and performance, durability, serviceability, functionality, prestige,
conformance, reliability and aesthetics. Among all these eight quality dimensions,
companies could choose on which they intend to compete on (Gavin, 1987). Brucks and
Zeithaml (1991) endeavored an exploratory research on perceived quality and the result did
show a few inconsistencies compared to Gavin’s findings. On the basis of the research,
Brucks and Zeithaml (1991) argued that Gavin’s “conformance” dimension does not belong
with the others since it is prone to be managerially dictated, rather than a consumer
perception. Moreover, Gavin may underestimate difficulties to discriminate between
reliability and durability dimensions of quality. Last but not least, the “aesthetics”
dimension raised by Gavin (1987) ought to be included in the prestige dimension (Brucks
& Zeithaml, 1991). Despite all those differences found, it is recognized, however, that
empirical studies have led to mixed results and that more research in this direction is
required (Thakor & Katsanis, 1997, p. 84).
2.2.4 Brand loyalty
Chi et al (2009) claimed that brand loyalty is the ultimate objective of brand management,
and it can be used to test companies’ loyalty by checking whether consumers still favor its
product in contrast to competitors. Among all the dimensions listed by Aaker (1991) for
conceptualizing CBBE, brand loyalty has been seen as the core (Moisescu 2006, p. 1128).
Aaker (1991) emphasizes that a loyal customer base is a barrier to entry, a pre-condition for
a price premium, time to respond to competitors, and a bulwark against deleterious price
completion. Travis (2000) supports the claim by pointing out that brand loyalty is “the
ultimate objective and meaning of brand equity”, adding that “brand loyalty is brand
equity”. Assael (1998) defined brand loyalty is that consumers satisfy their past experiences
in use of the same brand and incur repurchase behavior. Deighton et al. (1994) and Oliver
(1999) concluded that brand loyalty represents consumer attitudes on a brand preference
based upon previous use and shopping experience of a product, which can lead to a
19
repurchase commitment in the future purchase that will not be changed due to the change of
situations.
Brand loyalty is perceived from the term of behavior and attitude. Behavior loyalty
normally is realized through repurchase behavior while loyal attitudes express
psychological commitment to a brand (Aaker, 1991; Assael, 1998; Oliver, 1999). This is to
say that pure purchase frequency cannot be counted as loyalty (Tseng et al., 2004). Instead,
a true brand loyalty can be called when both behavior and attitude loyalty occur (Baldinger
& Rubinson, 1996). Additionally, Jones & Sasser, (1995) claimed that brand loyalty can
also be distinguished despite short-term loyalty and long-term loyalty whilst short-term
loyalty is considered a unreal brand loyalty as a long term customer will not switch other
brands in disregard of availabilities of better brands.
The other three descriptive dimensions of brand equity, perceived quality, brand
associations and awareness, are thought to be the foundation for loyalty enhancement
taking into account of their influences on customer satisfaction. Nonetheless, brand loyalty
can also provoke higher perceived quality, stronger associations and increase awareness
(Moisescu, 2006, p. 1128). Therefore, it is concluded that brand loyalty plays both roles as
an input and an output of brand equity and it is both affected and affects the other
dimensions of brand equity. It is worth nothing, however, that brand loyalty is strongly
experience based while the other three dimensions may be present or in the case of a brand
that has not been even used yet (Moisescu, 2006, p. 1129).
2.3 Building customer-based brand equity
Known as the important asset of many companies, a strong brand with significant equity is
thought to provide possible sources of benefits to a company (Keller, 2001, p. 3). To
marketers, the biggest challenge for building up a strong brand is to ensure that target
customers have the right type of experiences with products / services and their
20
accompanying marketing programs so the intended thoughts, feelings, images, beliefs,
perceptions, opinions, become linked to the brand (Keller, 2001, p. 3).
2.3.1 Establish brand-building blocks
In order to assist companies to successfully establish CBBE model, Keller (2001, p. 5)
stated four steps needed to be accomplished while each of which is contingent upon the
successful completion of the precious step (Figure 4).
Figure 4: A sequence of steps for building up the CBBE model (Keller, 2001, p. 5)
Consumers’ knowledge of products’ category is considered as important factor that
complement brand awareness (Keller, 2001, p. 8). Companies need to ensure that customers
know which of their needs could be fulfilled through purchasing these brands, concerning
many brands are usually forgotten or ignored during possible usage situation, increasing
brand salience can effectively drive consumption of the brand and enhance its sales volume
(Keller, 2001, p. 8-9).
Brand meaning, on the other hand, is thought to be brand image relevant and can be
distinguished in terms of functional, performance-related considerations versus abstract,
1. Identtiy = Who are you?
2.Meaning = What are you
3. Responses = What about you
4. Relationships = What about you and me
Deep, Broad Brand Awareness
Strong, Favoralbe, & Unique Brand Associatios
Postive, Accessible Responses
Intense, Active Relationships
21
imagery-related considerations. Differently speaking, brand meaning is made up of two
major categories of brand associations, which are performance and imagery (Keller, 2001,
p. 9).
The third step is in relation with the brand response. According to Keller (2001, p. 13),
brand responses are the indicators of what customers think of or feel about the brand and
any brand related activities, and usually consists of brand judgment and brand feelings.
Brand judgment represents customers’ opinion and evaluation with regard to the brand,
which emerge from the brand performance and its imagery associations. In order to create
positive brand judgment, four aspects, categorized into brand quality, brand credibility,
brand consideration and brand superiority, are particularly important (Keller, 2001, p. 13).
Brand feelings, on the other hand, focuses on customers’ emotional aspects with respect to
the brand and it can be categorized into six important types: warmth, fun, excitement,
security, social approval and self-respect (Keller, 2001, p. 14).
As the final step of building blocks, brand relationship represents the ultimate relationship
and level of identification that the customers have with the brand. Brand relationship can be
perceived in terms of brand resonance, which indicates the nature of the relationship that
customers have with the brand and the extent to which they feel they are “n synch” with the
brand (Keller, 2001, p. 15).
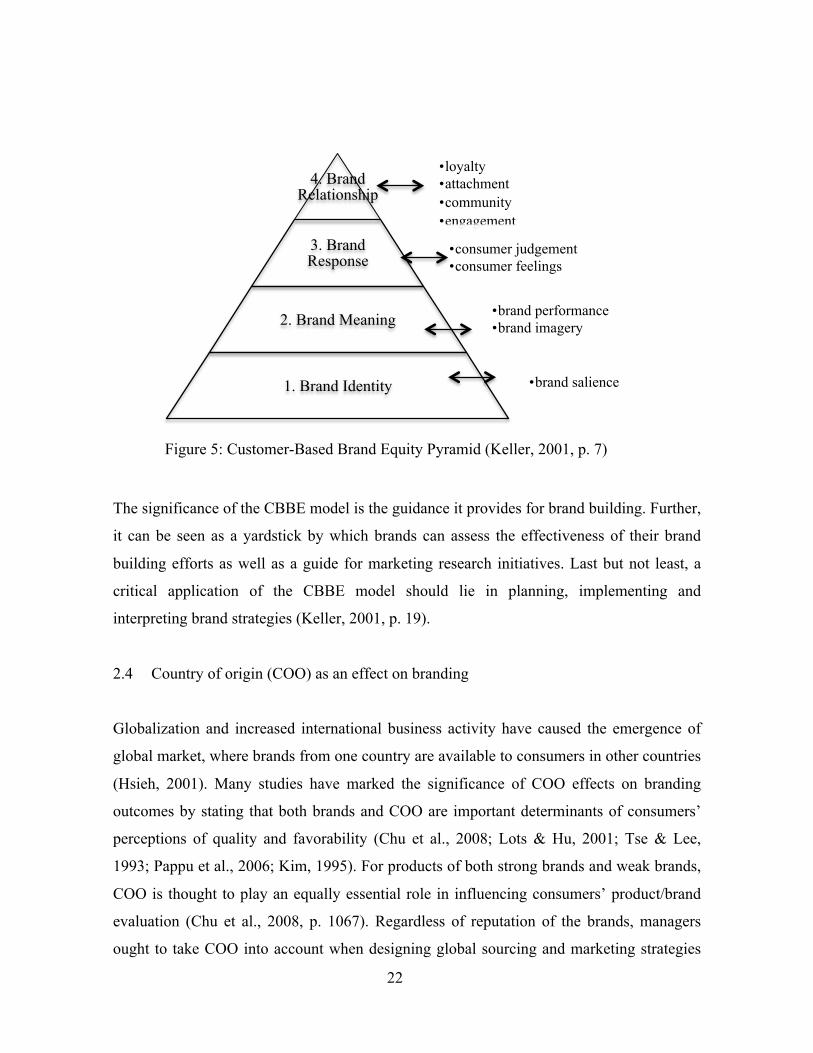
With four steps for establishing branding blocks being discussed above, Keller (2011, p. 7)
created a CBBE pyramid to further illustrate the process (Figure 5).
22
Figure 5: Customer-Based Brand Equity Pyramid (Keller, 2001, p. 7)
The significance of the CBBE model is the guidance it provides for brand building. Further,
it can be seen as a yardstick by which brands can assess the effectiveness of their brand
building efforts as well as a guide for marketing research initiatives. Last but not least, a
critical application of the CBBE model should lie in planning, implementing and
interpreting brand strategies (Keller, 2001, p. 19).
2.4 Country of origin (COO) as an effect on branding
Globalization and increased international business activity have caused the emergence of
global market, where brands from one country are available to consumers in other countries
(Hsieh, 2001). Many studies have marked the significance of COO effects on branding
outcomes by stating that both brands and COO are important determinants of consumers’
perceptions of quality and favorability (Chu et al., 2008; Lots & Hu, 2001; Tse & Lee,
1993; Pappu et al., 2006; Kim, 1995). For products of both strong brands and weak brands,
COO is thought to play an equally essential role in influencing consumers’ product/brand
evaluation (Chu et al., 2008, p. 1067). Regardless of reputation of the brands, managers
ought to take COO into account when designing global sourcing and marketing strategies
• loyalty • attachment • community • engagement
4. Brand Relationship
• consumer judgement • consumer feelings
3. Brand Response
• brand performance • brand imagery 2. Brand Meaning
• brand salience 1. Brand Identity
23
(Chu et al., 2008, p. 1068). Especially when the brands with negative COO image, it
becomes imperative for marketing managers to design adequate marketing programs to
alleviate the negative impact of unfavorable COO (Chu et al., 2008, p. 1068).
Bilkey and Nes (1982) concluded that the evaluation of products is influenced by country
stereotyping, which is, the image that consumers hold about a certain country will influence
their perception of brands from that country. While firms are introducing brands to other
countries, it is important for them to understand the relationships between consumers’
country images and consumer based brand equity (Pappu et al., 2006, p. 727). Except for
the fact that firms from developed countries have been increasingly shifted their production
to other developing countries for the benefits of cheaper costs (Haubl, 1996), brands
originated from developing countries have gradually started its international departure since
recent decades. Given the stereotype as conventional manufacturers, understanding the
effects of COO on the customer based brand equity is exclusively essential to those brands
with unfavorably perceived COO (Pappu et al., 2006, p. 727).
2.4.1 COO effects on the dimensions of CBBE
Brand equity is seen as a key indicator of consumers’ perceptions about a brand (Keller,
2008, p. 49). COO, in this study, refers to “the country where brand is perceived to belong
and where the brands products are made by its target consumers” (Takhor, 1996). COO is
considered another important variable influencing consumer perception of brands (Hulland,
1999). Both Aker (1991) and Keller (1993) claimed that COO could emerge as the second
brand association that affects a brand’ equity. By examining the relationship between COO
of a brand and its CBBE, market practitioners would be able to understand the way of
protecting and enhancing the core essence of the brand (Pappu et al, 2006, p. 697) with a
better comprehension on two important issues, which are “quantification of a brand equity”
and “identification of elements that could change consumer behavior and cause changes in
brand equity” (Biel, 1993, p. 77).
24
Srikatanyaoo and Gnoth (2002) claimed that “consumers are known to develop
stereotypical beliefs about products from particular countries and the attributes of those
products.” and therefore, the COO represents the home country for a company or the
country that consumers infer from brand name (Han & Terpstra, 1988). The COO effects
are thought to be an extrinsic cue (Thorelli et al., 1989) that brings out associations,
influencing consumers’ perceptions and leading consumers to cognitive elaboration (Hong
& Wyer, 1989). These COO associations in consumers’ mind could therefore influence
dimensions of CBBE based upon a specific country level. For example, consumers may
think of France and Spain differently in terms of the degrees of reliability and durability
(Pappu et al, 2006, p. 699).
With the presence of country specific association in consumers’ minds, the COO effects
could be of essence to either nurture a brand name (Shocker et al, 1994, p. 150) or tarnish it
(Thakor & Katsanis, 1997). As consumers’ perceptions toward Japanese brands have
improved significantly over the years (Kamis & Nagashima, 1995), brand names, such as
Sony or Toyota, certainly remind consumers of its Japanese originality (Pappu, 2006, p.
699). Conversely, if the COO of a brand was to change from consumers’ favored country to
a consumers’ less favored country, the brand’s name and its corresponding brand’s equity
could be eroded (Pappu, 2006, p. 699). However, Pappu (2006, p. 698) emphasized that the
COO and its effects on certain brands’ names should be measured within a given product
category as consumers have so called Product category-country associations.
Product Category-Country Associations
Product category-country associations refer to consumers’ ability to evoke a country when
the product category is mentioned (Pappu, 2006, p. 698). Here, product category-country
associations can be bi-directional (Farquhar and Herr, 1993). This is to say, consumers
could recall a particular product category when think of certain brands and they may also
recall certain brands when think of a product category (Pappu et al, 2006, p. 698).
25
Similarly, consumers are also known to associate countries with certain product categories
and vice versa (Terpstra & Sarathy, 2000). Pappu et al (2006, p. 708) argued that
consumers hold significantly different perceptions towards countries in terms of product
category-country associations. To be more specific, CBBE of certain brands made in a
country with stronger product category-country associations is higher than that of the same
brand but made in a country with weaker product category-country associations (Pappu et
al, 2006, p. 708). Moreover, consumers’ product category-country associations are
considered as moderation for the effect of the COO on CBBE dimensions indicated by
Figure 5. It illustrates the relationship between COO and CBBE could be extended to a
more micro-related level (Pappu et al, 2006, p. 700), given four dimensions of CBBE by
Keller (1993) and Aaker (1992) which are brand awareness, brand image, brand loyalty and
perceived quality. Further research showed that each of the CBBE dimensions contributes
differently to the COO - CBBE relationship based on product category, indicating that
observation and research on COO effect ought to be product category specific (Pappu et al,
2007, p. 7)
Consumer-Based Brand Equity (CBBE)
Country-of-Origin
Product Category-Country
Associations
Brand Image/Associations
Brand Awareness
Perceived Loyalty
Brand Quality
Figure 6: A model of country-of-origin effects on Consumer-based brand equity (Pappu
et al, 2006, p. 700)
26
2.4.1.1 COO and brand awareness
Pappu et al (2006, p. 701) did not address substantively about the impacts of COO on
consumers’ brand awareness due to technical difficulties. It is claimed that consumers are
possible to address a brand’s home country without the availabilities of the COO
information (Pappu et al, 2006. p. 701). Keller (1998, p. 277) stated that many countries
have successfully managed to create expertise in certain product categories, which lead to a
so called “culture bazaar” where consumers are aware of and can choose those brands
whose COO possesses expertise within particular product category. Yasin et al (2007)
determined that relationship exists between country image and brand awareness and
country image is found to have a significant effect on the brand awareness. They further
pointed that countries with good image are often familiar to the consumers and often
perceived as producers of quality brands (Yasin et al, 2007). In order to fully take
advantage of the COO to build up brand awareness, the country name can actually appear
together or be embedded in the brand name, such as Irish Spring soap or Bailey’s Irish
Cream, and the country name can even dominate the brand advertising (Keller, 1998, 277).
Therefore, under the effects of COO, a number of brands are able to differentiate itself from
the others in the same category during consumers’ brand recall or brand recognition process
(Keller, 1998, p. 277).
2.4.1.2 COO and brand image/associations
Brand image refers to the reasoned or emotional perceptions consumers attach to a specific
brand and it consists of functional and symbolic beliefs (Dobni & Zinkhan, 1990). Koubaa
(2008) stated that image held in consumer mind is manifested by human beliefs, which are
derived from experiences related to the brand and serve as basis for judgment in future
brand evaluation. Yasin et al (2007) stated that consumers develop their interest and
preference for a brand on the basis of their perception of the COO and the available
information pertaining to the brand. As such, favorable information about the country then
27
helps creates positive attitude toward the brand, which leads to favorable image of the
brand (Yasin, 2007). Previous researches have revealed strong associations between the
brand and its COO (Takhor, 1996; O’Shaughnessy & O’Shaughnessy, 2000) and the
significant effect of COO information on brand image (Anderson & Chao, 2003; Cervino et
al., 2005). As concerns as COO effects, Thakor and Lavack (2003) declared that brand’s
COO image is one such cue that plays potentially important role in determining a brand’s
image.
Researches indicated that consumer brand image shifts when the COO of the brands
changes (Pappu et al, 2007, p. 729). These researchers have also pointed out that consumers
have country-specific brand images (Pappu et al, 2007, p. 729). Being seen as a secondary
association of a brand (Aaker, 1991; Keller, 1993), COO is seen as one source to generate
brand image. Similarly, Pappu et al (2006, p. 701; 2007, p. 729) emphasized that while
consumers’ COO associations emerge as secondary associations, they would affect brand
image/associations and subsequently brand equity as consumers with knowledge of COO of
the brand will possess positive/negative associations towards the image of that brand.
Meenghan (1995) viewed product features and the brands’ COO image as external factors,
also called “umbrella brand-image. Koubaa (2008) described the umbrella brand image as
to underline the fact that the brand image perception is under influence of country image
perceptions, which is premature to the brand image perception in consumer mind. Scott and
Keith (2005) explained that consumers are known to recall the stored information about the
brand and the country and then relate the brand name with the COO to form a brand image
and infer the product evaluation.
Koubaa (2008) thinks that brand image is multi-dimensional rather than an overall concept
and the structure of brand image could be significantly different in relation to brands,
brands’ COO. This claim is established based on Hsieh and Lindridge (2005), who found
that dimensions of a brand image differ across countries of brands’ origin. A study by
Hsieh in 2002 has proved the multi-dimensional brand image structure by revealing that
28
those dimensions transfer consumers’ sensory, utilitarian, and symbolic and economic
needs about a brand. Further, in consideration of the set of those dimensions (the brand
image structure), Koubaa (2008) argued that the image structure also differs across brands
and across countries and this change is more intense with less reputed brands.
Last but not least, different from Pappu et al (2006, p. 736)’s claim that COO effects are
product category specific, Agarwal and Sikri (1996) argued that the image of COO has
been found transferrable between product categories. This is to say, consumers’ country
image beliefs related to a specific product category can be transferred to another new
products from the same country. Such transference of beliefs is seen as a sign of consumer
loyalty to brands that are from countries with favorable images (Pappu et al, 2007, p. 729).
2.4.1.3 COO and perceived quality
As a key dimension of CBBE (Aaker, 1991), perceived quality is believed to set apart a
brand from the others by providing enhanced value. Some researchers view COO image as
consumers’ general perceptions about the quality of products made in a particular country
(Han & Terpastra, 1988; Parameswaran and Yapark, 1987) while some others view it as the
“defined beliefs about a country’s industrialization and national quality standard”
(Srikatanyoo & Gnoth, 2002). Pappu et al (2006, p. 701) argued that the level of perceived
quality varies according to the COO of the brand. For example, within the product category
of “mobile phones”, perceived quality level of a brand that originates from Finland is likely
higher than the perceived quality level of a brand that is from Mexico or Hungary.
Therefore, it is suggested that consumers are likely to hold favorable perceptions towards
the quality of a brand that is from a country with a strong association in a particular product
category, compared to the brand that originates from a country with a weaker association in
the same product category (Pappu et al, 2006, p. 701). Yasin et al (2007) supported this
claim by indicating a positive relationship, which implies consumers see countries with
good image as technologically advanced countries and brands that are originate from these
29
countries are reliable and high quality. Consumers’ perception towards COO is often
transferred to the brands originate from that country because of carry-over effects. Due to
this, consumers feel that brands from countries with good image are more reliable than
brands from countries with less favorable image.
Furthermore, in terms of the impact of COO on the four dimensions of CBBE, perceived
quality is considered to be the one that is mostly affected (Lim et al, 1994). Similarly,
Pappu et al (2006, p. 708) also pointed out that the differences by COO were the largest for
perceived quality. For example, with the product category of TV, the magnitude of
difference for perceived quality could approximately twice that observed for brand loyalty,
and one and half times that observed for brand associations (Pappu et al, 2006, p. 708).
2.4.1.4 COO and brand loyalty
Present researches seem to lack insights into the relationship between COO and brand
loyalty (Pappu et al, 2006, p. 701; Pappu et al, 2007, p. 729). Nonetheless, literatures never
lack hints of possible link between these two constructs (Pappu et al, 2007, p. 729). Kim
(1995) argued that country with a positive country image would cause brand popularity,
and consequently led to consumer brand loyalty. It was also suggested and is recently
demonstrated (Paswan et al, 2003; Pappu et al, 2006, p. 702) that consumers could develop
country loyalty based on the preferences and loyalty over brands originated from that
country. This is also consistent with the Ahmed and d’Astous’s (1996, p. 199) opinion that
consumers may develop loyalty towards certain countries and lead to continuous purchase
preferences from that countries. Yet, one important premise of creating country loyalty at
this point is that consumers must have experienced and be in favor of the features or
benefits offered by the brand from the particular country (Pappu et al, 2006, p. 702). On the
other hand, COO image could be used as one determinant during consumers’ brand
evaluation process while information of that country’s products is limited to consumers’
knowledge (Erickson et al., 1984). This is to say, consumers’ brand loyalty could also be
30
increased on the basis of familiarity and favorability of the COO image (Pappu et al, 2007,
p. 729).
As one of the most widely studied phenomena in the International business, marketing and
consumer behavior literature during the past a few years, the brand’s effect of COO on
consumers’ perception, evaluations and intentions has drawn a great deal of attention from
the management (Kabadayi & Lerman, 2011, p. 6). With the growing impact of
globalization, significance of brands’ COO images in influencing consumers’ behavior is
growing rapidly (Erdener et al, 2000, p. 1). Consumers are increasingly aware of the
brands’ COO and are known to use COO information as an extrinsic cue to evaluate the
value of products (Lin and Sternquist, 1994) and brands (Han and Terpstra, 1988). Many
studies have concluded that consumers particularly perceive brands originate from
developing countries less dependable and, as a result, less favorable (Cordell, 1992; Wang
and Lamb, 1980). Therefore, it is important for companies, especially companies from
developing countries, to develop effective branding strategies in order to counteract the
damage, such as negative consumer attitudes and perceptions, caused by the negative COO
image (Kabadayi & Lerman, 2011, p. 5; Cordell, 1992).
2.5 Countering country of origin (COO) effects
As a negative COO image will distort a consumer’s product evaluation within a certain
product category (Kabadayi & Lerman, 2011, p. 5; Cordell, 1992), it is necessary to come
up with strategies to counter the negative sides of the COO image for those affected brands.
Tse and Lee (1993, p.1) argued that the negative effect of COO can be weakened when
country image is decomposed. According to their research, the negative effects caused by
unfavorable COO image could be lessened by decomposing the origin information into
“component origin” and “assembly origin” (Tse & Lee, 1993, p. 43). Tse and Lee (1993, p.
43), however, noted in their study that after certain period of product experiences, a brand
31
from a less favored COO could even embody higher purchase value than the one originated
from a COO with better image. Besides confirming the possibility of removing negative
COO effects, above findings contain important significances from a perspective of brand
management. First, it suggested that consumers may hold weaker and/or less distinct
concepts on component and/or assembly origins when “made in” concept is decomposed.
Along with the decomposition, it is also suggested that a strong global brand and product
experience were also in favor of removing negative “made-in” images (Tse & Lee, 1993, p.
44). Compared to other product information cues such as pricing, decomposition is
considered as more cost efficient to the marketer and more comprehensive in a sense that it
avoids other unwanted effects such as lowered quality perception caused by lowering price
(Tse & Lee, 1993, p. 44). To the management, it implies that biases and hurdle in branding
products originated from less favorable COOs could be overcome cost effectively by
decomposing the “made-in” concept, which may even enhance purchase value to create a
niche market for their brands especially when consumers are able to attain the opportunities
to try the products (Tse & Lee, 1993, p. 44-45).
Further, there are other approaches discovered to dilute negative COO stereotypes in order
to promote brands from developing countries or unfavorably –perceived countries. In light
of Lots and Hu’s study (2001), changes in negative COO stereotypes could be triggered by
promoting “extremely different” or “unique” products (2001, p. 128). Lots & Hu (2001, p.
128) argued that brands associated with unfavorably perceived countries could be benefited
from the “unique product” strategy in conjunction with other strategies that either have
weak results or require trade-offs. For example, a promotional campaign could be realized
in a way that focuses on the uniqueness of the brand originated from a less favored COO
along with a decomposition of the “made-in” product cue (Lots & Hu, 2001, p. 129).
Further, the study noted that the negative image of COO as a producer of variable quality
products is actually easier to be reversed than the image of COO which is believed to
produce consistent quality products (Lots & Hu, 2001, p. 129). All the other researches
aside, Lots and Hu (2001, p. 130) inferred the possibility that products with brands that
32
carry negative country image could be in a better position to reverse poor perceptions
through producing and promoting unique products than those brands that carry marginally
better evaluations. Last but not least, Lots and Hu (2001) presented a very interesting view,
indicating important effects of country policies on promoting the brands and products. As
most promotional campaigns have been largely generic in nature rather than product
specific (Lots & Hu, 2001, p. 130), they suggested that country policy maker ought to
implement a program that is aimed at a two-pronged audience, which, for example, could
be the companies carrying national brands and their targeted global customers or
purchasing agents. Taiwan’s “Image Enhancement Program” is one of the cases that
confirm the trend as it allows its national brands with superior qualities carry special labels
with phrases, such as “It’s very well made in Taiwan” (Lots & Hu, 2001, p. 130).
Kim (1995, p. 29) developed a strategic model for global brands in terms of two aspects,
which are country image, brand popularity. Kim (1995, p. 30) argued that country image is
not controllable by a company’s effort. Instead, it is affected by external factors such as
country’s economic status, technology and so on. On top of the relations between COO
image and product categories, Kim noted (1995, p. 30) that COO image is also affected by
the major brands originating from the country. A COO image would be improved if its
associated brand images or brand qualities were enhanced with small variance (Kim, 1995,
p. 30). Although country equity is thought to be difficult to control at a company’s
corporate level, brand popularity, on the other hand, is manageable through company’s
corporate level (Kim, 1995, p. 30). In order to not only manage its current brands and brand
extensions in other product category but also effectively manage its brand equity in other
countries, brand managers ought to focus on managing brand equity in conjunction with the
country equity or liability, without which, branding in a global market would be misleading
(Kim, 1995, p. 30). Table 1 presents the model designed by Kim (1995, p. 29).
33
Brand Popularity Country Image
High Low
High
Double positive brands
• Maintaining popularity
• Premium Pricing
• Defensive strategy
• Possibility of foreign sourcing
from low-cost countries
Country-deficit brands
• Maintaining popularity
• Competitive pricing
• Differentiation with quality
• Foreign direct investment in
favorable countries
Low
Popularity-deficit brands
• Building shares
• Creating images consistent
with country associations
• Offensive strategy
• Identifying key success
factors
Double negative brands
• Building shares
• Niche marketing strategy with
continuous upgrading
• Creating functional images
• Foreign direct investment in
favorable countries or joint venturing
Table 1: Brand popularity and country image (Kim, 1995, p. 29)
In light of the model, brands associated with low COO image could be categorized into
“Country – deficit brands” and “Double negative brands” (Kim, 1995, p. 29). “Country –
deficit brands” here refer to those brands that are popular but carry negative COO image
while “Double negative brands” refer to those brands that suffer from both negative COO
image and brand popularity (Kim, 1995, p. 31).
Kim (1995, p. 30) suggested that companies hold country-deficit brands should always
maintain market shares of these brands and make the task as the first priority. There are
four strategies, which are raised to serve the purpose. First, Kim (1995, p. 30) suggested
that companies differentiate the brands from the other brands by providing exclusive
bundles of products that are not associated with their COO image. Simultaneously,
functional quality from the perspectives of product related and service-related quality.
Besides, the companies may adjust their sourcing strategies by involving foreign
34
manufacturers and suppliers from more favorably perceived countries and make their
brands competitive in price (Kim, 1995, p. 30).
For those brands, which are not popular in the global market and are carrying negative
COO image, Kim (1995, p. 31) noted that the companies should develop a brand
management strategy from a global and long - term perspective, which ought to focus on
both brand components and COO image. Due to the difficulties of building country image,
Kim (1995, p. 31) emphasized that brands of this kind should be more active in establishing
brand share and brand reputation in a niche market that is usually ignored by major brands.
Yet, it is important that the brands and their products are supported by continuous quality
improvement and service quality upgrade (Kim, 1995, p. 31). Last but not least, although it
is difficult for those brands which carry negative COO images to reverse the reputation of
the country, it is suggested that companies are better off to form joint venture with
companies possessing positive country image or get their products / components
manufactured in a country with positive equity (Kim, 1995, p. 31).
Aside from those strategies discussed above, Lots and Hu (2001, p. 128) also listed a few
tools that assist the marketers with promoting brands from a negatively perceived country,
e.g. modifying the country image of the brand, promotional campaigns and moving
production facilities to positively perceived locations. There are also a few other literatures
on how to alleviate the negative effect of COO (Chu et al, 2008, Fetscherin & Toncar, 2009,
Kim, 1995). Chu et al. (2008, p. 1069) suggested that marketers should avoid displaying
brands originated from less developed countries with those brands made in more advanced
countries to prevent comparison. It is claimed that doing so will help consumers’ evaluation
on quality and favorability of brands from developing countries (Chu et al., 2008, p. 1070).
35
2.6 Theoretical synthesis and research framework
In this chapter, three major theoretical aspects have been discussed. The major objective of
this discussion is to first conceptualize the Customer-Based Brand Equity (CBBE) as an
overall context of branding management while taking into consideration of effects of the
COO as an additional variable. Strategic knowledge on countering the negative COO image
with respect to brands’ equity is discussed at the end.
To begin with, concept of brand equity was introduced and emphasis was given to the
CBBE model, which is proposed based on both Keller (1993) and Aaker (1996) CBBE
theories. Justification is presented in order to rationalize the proposal of the combined
model. Keller’s theory of building CBBE is then followed with a corresponding CBBE
Pyramid.
Seen as an extrinsic cue of a brand, COO effect on CBBE is introduced to bridge the
concept of CBBE and COO effects. The relationship between COO image and each
dimension of the CBBE model is analyzed with great attention towards the effects of this
relation on consumers’ purchasing behavior.
Last but not least, knowledge on countering COO effects is discussed, aiming at providing
practical insights for brands that are under strong effects of COO and whose brand equity is
in need of a lift.
The following Figure 7 devotes to portray the theoretical framework that is built upon the
essence of the literature review. It represents the major structure of the theories utilized for
the subject of this study.
36
Figure 7: Building Customer-Based Brand Equity under negative impact of Country of Origin Framework
Given the above framework, CBBE should be first examined in terms of brand awareness,
brand image, brand quality and brand loyalty in order to determine the overall brand
popularity and customer perceptions of the brand. At this point, brand’s COO effects
should be evaluated within certain product category so its impacts on the brand can be
detected in advance and corresponding strategies can be conducted accordingly.
3 RESEARCH METHOD
This chapter outlines the research method applied in this study. Considering the objective
of the study, a quantitative research is conducted. Reasons of doing so will then be
presented to justify the research strategies. The following sections will describe 1) the
37
design of the quantitative research 2) the data collection method for quantitative consumer
survey 3) the data analysis, and 4) trustworthiness of the study.
3.1 Empirical research design: a quantitative approach
Empirical research is applied to answer research questions and the research design is seen
as the overall strategy used to conduct an approach that allows for answering the research
questions in the best possible way (Ghauri & Gronaug, 2005, p. 26). That is to say, no label
is attached to a particular research strategy as long as it enables the researcher to answer
particular research questions and meet the objectives (Saunders et al, 2009, p. 141). In order
to identify the best possible method for different studies, Yin (2009, p. 8) stated three
conditions and relation of each of these conditions with the five major research methods by
displaying COSMOS’ table (Table 2) as below:
Method 1) Form of research question 2) Requires control of
behavioral events
3) Focuses on
contemporary events
Experiment how, why? yes yes
Survey who, what, where, how
many, how much? no yes
Archival
Analysis
who, what, where, how
many, how much? no yes/no
History how, why? no no
Case study how, why? no yes
Table 2: Relevant Situations for Different Research Methods (COSMOS Corporation in Yin (2009, p. 8)
By cross referencing the table above while taking into account of the research questions of
this study, a survey was selected to be the data collection method of this study.
38
3.1.1 Survey: a quantitative self – administered questionnaire
As indicated by Figure 10, survey is most frequently used to answer who, what, where, how
much and how many, and therefore, it tends to be used for exploratory and descriptive
research (Saunders et al, 2009, p. 144). In business studies, descriptive surveys, such as
attitude and opinion questionnaires, are often used to obtain consumer attitudes towards a
certain product or to identify and describe the variability in different phenomena (Saunders
et al, 2009, p. 362; Ghauri & Gronaug, 2005, p. 59). Thus, a quantitative consumer
questionnaire was designed in this study in an attempt to examine consumer perceptions
towards the phenomena of Chinese cars going global and the impacts of brands’ COO on
Chinese (automobile) brands. Using a survey gives the researcher more control over the
research process while the data collected can be used to present possible reasons for
particular relationships between variables and to produce models of these relationships
(Saunders et al, 2009, p. 145).
Saunders et al (2009, p.362) stated that the design of a questionnaire differs based on the
way it is administered and the amount of contacts the researcher has with the respondents.
In light of the definition given to the types of questionnaires by Saunders et al (2009, p.
362), self-administered questionnaires are usually completed by the respondents and are
administered electronically using the Internet or intranet. As the quantitative consumer
questionnaire for this study was realized electronically through Internet, it can be concluded
that the type of the quantitative survey here is a self – administered questionnaire. The self-
administered questionnaire is designed to address issues from three perspectives: 1)
evaluation of current CBBE of Chinese brands in the International market, 2) country-of-
origin effects on Chinese car brands in the International market. 3) International
consumers’ perspectives on managerial implications for improving CBBE of Chinese car
brands.
39
Like any other research methods, survey holds its own imperfections. According to De
Vaus (2002, p. 7), flaws exist in terms of philosophical, technique-based and political
aspects. De Vaus (2002, p.7-9) indicated survey as intrinsically manipulative, which lacks
solid grounds to establish causal connections between variables, ignores the context in
which a particular aspects of people’s beliefs and actions occur, assumes that human action
is determined by external forces without realizing the role of human consciousness. Further,
in order to avoid misleading results, the four sources of survey error listed as sampling
error, coverage error, measurement error and nonresponse error should be reduced to an
acceptable level with the greatest attentions towards nonresponse error and measurement
error (Dillman, 2007. p. 9-11).
3.2 Data collection
This section is dedicated to present details of data collection procedure of this study. As
stated, a quantitative consumer survey is applied in the study to collect data, meaning that
processes of conducting this method is described here in order to provide rationale of the
approach, in which data are collected.
For this study, a quantitative consumer survey was conducted in the form of an online
questionnaire. This subsection indicates the survey process, sample structure and questions
design of the questionnaire. Due to the subject of this study, gaining consumers’
perspective on Chinese automobile brands is key. This questionnaire serves as a strategic
indicator, whose results will not only assist the discussion of the subjects of the study,
making the data collected more market oriented, but also complement the overall findings
of the study by examining, comparing and analyzing data from both consumers and the
case company point of view, which will result to a more practical and market-based
conclusions. Just as Eisenhardt (1989, p. 538) argued, “quantitative evidence can keep
researchers from being carried away by vivid, but false, impression in qualitative data and it
can bolster findings when it corroborates those findings from qualitative evidence”.
40
3.2.1 Survey preparation and sample structure
As stated in the previous section, quantitative data were collected through an online
questionnaire. Preliminary planning for constructing the questionnaire is in need and it was
completed in accordance with the pattern suggested by Gill and Johnson (1991, p. 76-77).
The planning process is presented in the following Table 3:
Table 3: Planning a survey (Gill & Johnson, 1991, p. 76-77)
Planning a survey (Gill & Johnson, 1991, p76-77)
Conceptualize and structure the research problem:
Analytic survey or Descriptive survey
Determining the sampling strategy by defining the research population
Are the data to be collected through one approach to respondents? Or it requires the repeated contact of a single sample or several equivalent samples?
Interview-administarted questionnaire or respondent-completed postally administered questionnaire
Survey planning for this research accordingly
1. Evaluation on CBBE of Chinese brands, car brands in particular 2. Brands' COO effects on Cinese car brands 3. Managerial implications from international consumers
Descriptive survey to obtain consumers' attitudes towards a certain product (Ghauri & Gronhaug, 2005, p. 60)
Research population in this resaerch is defined as people who do not possess Chinese nationality, meaning non-Chinese consumers.
Quantitative data for this research is colleted through one approach to respondents and no repeated conatct was realized.
Respondent-completed questionnaire: internet questionnaire applied is one kind of respondent-completed qustionnaire (Saunders et al, 2009, p. 362)
41
According to the plan, an online questionnaire was delivered to the respondents, the
majority of which was reached through Facebook, and the rest was reached through twitter
and email. Internet questionnaire was chosen because it enables researchers to survey a
large random sample of a population at a relatively low cost. Moreover, placing the Internet
questionnaire through some packages delivers convenience to researchers who are able to
design questionnaire, collect, enter and analyze the data within the same platform (Saunders
et al, 2009, p. 365; De Vaus, 2002, p. 124). Saunders et al (2009, p. 365) further argued that
it is a rough rule that data should be analyzed through computer if they have been collected
from more than 30 respondents and the intended number of respondents of this
questionnaire is 200 for the conclusiveness of data analysis. Therefore, a questionnaire
through Internet is determined as the most suitable means. For this specific study, the
online platform employed for the entire survey process is titled Webropol.
Any contamination of respondents’ answers will reduce data’s reliability. Although
respondents to online questionnaire are relatively unlikely to answer to please the
researcher (Dillman 2007), potential low response rate can still bias the sample (De Vaus,
2002, p. 128, Saunders et al, 2009, p. 365). Internet survey and mail surveys are especially
prone to this type of bias due to the fact that mail survey requires reading and writing and
Internet survey requires Internet access (De Vaus, 2002, p. 128). To ensure that the
questionnaire receives adequate answers, the Tailored Designed Method (Dillman, 2007)
was applied. This approach has been considered as an effective approach that is derived
from rational of social exchange in an attempt to collect adequate amount of responses and
quality data for the Internet questionnaire (Dillman, 2007). Details about applying this
approach will be introduced in the Questionnaire Design section.
Since the questionnaire was distributed primarily through Facebook contacts and was
afterward passed onto additional respondents based on referrals from those initial
respondents, it is not possible to obtain the response rate and form a frame population for
probability-based sampling. Thus, snowball sampling as a type of non-probability sampling
42
is undertaken. However, it is worth noting that applying snowball sampling will cause bias,
which are largely attributed to the technique itself that increases the likelihood of sample
not being representative of the population (Saunders et al, 2009, p. 240) As Lee (1993)
exemplified that “respondents are most likely to identify other potential respondents who
are similar to themselves, resulting in a homogeneous sample”.
The online questionnaire was designed and its link was circulated on the 18th. October 2011.
Till the 31st October 2011, a total of 212 respondents had completed the questionnaire. As
stated before that the target respondents are non-Chinese consumers, three Chinese
respondents were removed from the list. Five non-Chinese respondents’ answers were
discarded due to their uncompleted questionnaire. Therefore, as the final result, the final
amount of respondents for the quantitative study is 204.
Among these 204 respondents whose answers were considered valid, the most common
respondents’ nationality was Finnish (n=61), followed by German (n=20) and American
(n=16). The questionnaire has received more answers from female respondents than male
respondents and majority of the total respondents is between 20 – 29 years old. A summary
of respondent’s demographical information can be found in the Table 4:
43
Table 4: Demographics of the respondents to the quantitative questionnaire
Given the demographical information of the respondents, side effects of “snowball
sampling” can be detected. Although the respondents are geographically dispersed,
covering 40 countries, larger number of respondents with certain nationality or from a
specific region is likely to cause bias. This also applies to the uneven age groups of the
Frequency
Absolute Relative (Percent)
North America 22 10.8
Central America 1 0.5
South America 5 2.5
Northern Europe 71 34.8
Western Europe 19 9.3
Central Europe 25 12.3
Southern Europe 17 8.3
Eastern Europe 4 2.0
East Asia 17 8.3
South East Asia 6 2.9
South Asia 13 6.4
Africa 2 1.0
Middle East 2 1.0
Total number of respondents 204 100
Gender: Absolute Relative (Percent)
Female 115 56.4
Male 89 43.6
Total number of respondents 204 100
Age Group: Absolute Relative (Percent)
Below 20 1 0.5
20-29 158 77.5
30-39 37 18.1
40-49 4 2.0
Above 50 4 2.0
Total number of respondents 204 100
Demographical Characteristics of the respondents
National Groups: (Natiaonlity=40)
44
respondents, where group of 20-29 years old takes up 77.5% of the total respondents.
Therefore, limitation of the findings should be aware of and the potential bias embodied
implies that the conclusion of the study can only be considered as suggestive.
3.2.2 Constructing questionnaire and the tailored design method
De Vaus (2002, p. 80) argued that it is crucial to anticipate the type of information needed
so that the questions can deliver relevant information. In order to do so, Dillman (1978, p.
80) claimed that it is helpful to command a strong grasp of four types of question content:
behavior, beliefs, attitudes and attributes. With regard to the purpose of the questionnaire,
beliefs and attitudes are the main contents that the questionnaire intends to focus on for this
study while certain questions focused on attribute to collect respondents’ demographical
information.
De Vaus (2002, p. 87) argued that it might be worth using a combination of open and
closed questions for the key variables. The questionnaire consists of 17 questions, 14 of
which are closed questions and 3 of which are open-ended questions. Among the 3 open-
ended questions, one was used to collect the respondents’ nationalities while the other two
were used to collect the information of the respondents’ car and collect thoughts on the
strategic improvements. All of the 14 closed questions used forced-choice responses format.
The major types of forced-choice questions are rating and matrix, which are often used to
collect opinion data (Saunders et al, 2009, p. 375). Response categories for these two types
of rating questions in this questionnaire were familiarity, likelihood, preference, importance
and agreement. Likert – style rating scale and numeric rating scale were employed to
represent respondents’ responses on five rating scales.
Although forced-choice questions are quick to answer and easier for researchers to code,
they can restrict answers and generate false opinions if responses cannot be easily
interpreted (Saunders et al, 2009, p. 375; De Vaus, 2002, p. 86; Nardi, 2006). De Vaus
45
(2002, p. 87) suggested to use pilot testing to develop the range of exhaustive alternative
responses in order to avoid potential biasing responses. However, in order to do so,
excessive time and resources are required, which cannot be possibly realized in this study
due to very limited time and scope of this research. Nonetheless, one strategy at this stage
was developed to tackle this problem. The questionnaire assessed consumers’ perspectives
on Chinese brands and automobile industry using questions and scales adopted from
Interbarnd (2005), which is one of the most famous and professional brand-consulting
companies in the current market. Using the same questions and alternatives as the ones that
authority employed in the survey ensured the reliability of the findings to a great extent and
make up the potential deficiency caused by the absence of pilot testing. This study is not
the first one who adopted questions for data collection purpose. Same approach was
exploited in Ambos et al. (2010)’s article on the consequences of initiative taking in
multinational subsidiaries, where the researchers adopted questions and scales to assess
subsidiary autonomy and influence. It is worth noting that the other non-adopted questions
were carefully developed, incorporating feedback from two academics, which identified
questions that were vague, ambiguous, or the source of possible bias.
The Tailored Designed method (Dillman, 2007) was used during the data collection process,
aimed at enhancing response rate. Based on the social exchange theory implied by the
method, questions were designed in a way that prolonged questionnaire can be avoided and
the language of the questions was easy to comprehend with no jargon involved. By doing
so, cost of responding can be effectively reduced (Dillman, 2007). Furthermore, incentive
was delivered by the promise of providing results to respondents
In order to serve international consumers, who are the targeted respondents to the
questionnaire, all the questions are designed in English. A group of volunteers completed
trials of the questionnaire to ensure all the questions are comprehensive and no obscure
words are involved. The questionnaire link was initially messaged to the primary
respondents through Facebook and was circulated by the primary respondent to the others.
46
3.3 Data analysis
This section is dedicated to describe the quantitative and qualitative data analysis utilized in
this study, each of which was undertaken by different approaches with different focus.
3.3.1 Questionnaire data analysis
The questionnaire conducted for obtaining international consumers’ perspectives on
Chinese brands was analyzed with the aid of SPSS, involving t-test, ANOVA, correlation
analysis and factor analysis. Since all data types should be recorded using numerical data
(Saunders et al, 2009, p. 422), a codebook was conducted for convenience of running a
computer analysis. The process of coding strictly followed the four steps indicated by both
Saunders et al (2009) and De Vaus (2002). Open questions were coded based on the
multiple response method presented by De Vaus (2002). The codebook is attached as an
appendix 2 at the end of this paper.
A variety way of presenting data was applied in this study. As Mahlhotra and Briks (2007,
p. 421) stated: “the care exercised in the data preparation phase has a direct influence on the
quality of statistical results”, data for individual variables in the questionnaire were
carefully examined, summarized and presented in the forms of table (frequency
distribution) and diagrams.
In order to understand the data, descriptive statistics were utilized to describe and compare
variables numerically based on two aspects, the central tendency and the dispersion
(Saunders et al, 2009, p. 444). To be more specific, means and medians were counted
whereas different approaches were dedicated for the dispersion. At the same time, means
are compared in the interest of understanding different demographical characteristics. For
that, Independent sample t-test and one way ANOVA are performed. Moreover,
47
correlations were calculated to test bivariate relationships between certain variables as De
Vaus (2002) and Malhotra & Birks (2007) argued that using correlation co-efficient
provides a concise and easy overview of the character of the association between two
metric variables”. Factor analysis is also utilized at some stage to detect principal
components for the comprehensiveness of the findings.
3.4 Trustworthiness of the study
This section is dedicated to discuss the trustworthiness of study by evaluating the research
method applied. Just as Gibbert and Ruigrok (2010) stated that the most widely used model
for this matter is named natural science model, which includes reliability and validity.
Reliability
A reliable measurement is thought to be the one where the identical result can be retained
on repeated occasions and this could be realized in terms of three aspects determined by De
Vaus (2002, p. 54), which are sources of unreliability, testing reliability and increasing
reliability.
First of all, in order to exclude the possible sources of unreliability, questions involved in
the survey are worded with care to ensure that respondents perfectly understand the
questions on different occasions. Before survey is officially circulated, all questions were
pre-tested by volunteers with different genders and different ethic background so that
interpretation of each question would not be misleading. Additionally, answers to each
question are well coded by the researcher to guarantee that same responses receive same
codes (see Appendix 2). Last but not least, questions of the survey are designed in a way
that takes into account of consumer knowledge on the subjects so respondents would have
sufficient information to answer the survey and no rough-and ready answers would appear.
48
Second of all, although there are lots of methods could be used for testing the reliability, De
Vaus (2002) suggested a test-retest method, which requires a same test on the same sample
twice. At this point, questions designed in the survey are tested and retested on the same
group of volunteers. Yet, there could be potential flaw caused by this method as volunteers’
memories could artificially keep the consistency of the tests and consequently inflate the
apparent reliability of the question.
Last but not least, in order to increase reliability, multiple – item indicators are suggested.
This means that using a number of questions as multiple – item indicators would minimize
the effect of one question that is badly worded. De Vaus (2002) stated that the best course
at this point is to use well-tested questions from reputable questionnaires. In this study,
there is a number of questions were directly adapted from prior published paper by
interbrand in year 2005 so that the reliability of the survey can be increased to certain
extent.
Validity
De Vaus (2002) suggested that a valid measure is one, which measures what it is intended
to measure. There are three ways suggested to evaluate validity, criterion validity, content
validity and construct validity, although none of them is entirely satisfactory according to
De Vaus. In this study, construct validity was chosen to measure the extent to which an
operationalization measures the concept, which it purports to measure (Ghauri et al, 1995, p.
48). In order to assess the construct validity of this study, face validity, convergent validity
and divergent validity are tested by different approaches.
De Vaus (2002, p. 48) stated a simple test for face validity is to ask for the opinion of
others acquainted with the actual topic. Here, this step is realized in two ways for this study.
The same group of volunteers for assessing the reliability of the research method was
invited to deliver thoughts about questions and measures given in the survey. Further, a
number of professionals from a Chinese automobile company were consulted at the same
49
time in order to guarantee the information that the questions are intended to gather will be
precise and valuable without causing invalid common sense.
Ghauri et al (1995, p. 48) defined convergent validity as the extent to which multiple
measures or multiple methods yield comparable results while divergent validity was
defined as the extent a construct is distinguishable from another construct. Yet, both
validities can be approached by multi-trait multi-method approach, which includes
correlational techniques and factor analysis. At this point, most questions designed for this
study are on five-point scale for the convenience of both analyses. Correlation coefficients
are placed to test customer perceptions on brands’ Chinese originality while factor analysis
will be placed to investigate the major dimensions of strategies that could be applied in
regard of countering the negative effects of the China label. Both analyses are well
presented in the empirical findings in the following chapter.
4 EMPIRICAL FINDINGS
This chapter presents the empirical findings gathered from quantitative study of this
research. As the first part, 204 valid responses from the questionnaire are illustrated in the
form of charts and tables so that international consumers’ perspective on Chinese brands,
car brands in particular, can be visually indicated. The objective of this study is to first
examine the existing customer – based brand equity of Chinese brands on the market by
observing consumers’ awareness and image of Chinese brands, as well as to determine the
impacts of “China”, as brands’ COO, on the Chinese automobile brands. Thoughts on the
potential strategies for Chinese automobile brands are collected, aiming at assisting
companies to comprehensively understand the market and, as a result, to manage their
brands with products that fit consumer needs. At this stage, findings gathered from the
questionnaire are described based on three aspects:
50
1. Existing customer-based brand equity of Chinese brands in the international market:
a. How are international consumers aware of Chinese brands?
b. What are the images of Chinese brands in the minds of International
consumers?
c. Does “China” label positively or negatively influence the Chinese brands in
the International market?
2. Country-Of-Origin effects on Chines car brands
a. How important is brands’ country-or-origin to car purchases?
b. How do international consumers think of Chinese car industry in general?
c. Prospects on Chinese cars’ international sales.
3. Improving customer-based brand equity for Chinese car brands
a. How do international consumers think of the acquisition between Geely and
Volvo?
b. What aspects should Chinese car brands improve the most in order to obtain
strong customer-based brand equity?
c. What communication channels are the most preferred by consumers for
success of branding effort?
4.1 Customer-based brand equity of Chinese brands in general
Dimensions of CBBE were assessed at first. Major Chinese brands, including car brands,
which operate internationally, were listed and respondents were required to assess each
brand, using likert scale 1-5 (1 as Not at all familiar, 5 as extremely familiar). Data
collected at this question indicates the general level, at which international consumers are
familiar with those “major international brands originated from China”. Impliedly, results
here also serve to indicate the level of brand recognition and brand recall, the major
dimensions of brand awareness, which are important determinants that affects consumers’
brand choice (Keller, 1993; Aaker, 1991, Percy & Rossiter, 1992). Brand image as the
other dimension of CBBE was assessed through brand stereotypes chosen by the
51
respondents. As stated before, this question along with the options were both adopted from
Interbrand’s white paper 2005 in consideration of enhancing reliability of the data. Here,
stereotypes listed represented the image associated with Chinese brands and indicate
consumers’ brand beliefs and attitudes as the overall evaluation of the brands.
4.1.1 Brand awareness
15 Chinese brands, including 8 Chinese car brands, were evaluated on a scale of 1-5 with 1
being not at all familiar and 5 being extremely familiar. All 204 respondents assessed the
brands based on their own knowledge. Result is showed as below:
Figure 8: The mean score of international consumers’ familiarity with Chinese major brands (Likert scale 1-5, as 1 being not at all familiar and 5 being extremely familiar) (N=204)
2.96
1.24 1.54 1.96
1.11 1.22
2.08 1.43 1.24 1.12 1.03 1.07 1.04 1.08 1.06
0.00
1.00
2.00
3.00
4.00
5.00
The mean of international consumers’ familiarity with Chinese Brands
52
Table 5: The standard deviation of international consumers’ familiarity with Chinese major brands
Given the results, only two brands scored above 2. Lenovo is the most internationally
known Chinese brand of all with a mean score of 2.96. Huawei, a Chinese multinational
networking and telecommunications equipment and services company, followed as the
second with a mean of 2.08. In the category of automobile industry, none of the Chinese
brands scored above 2, indicating weak brand awareness towards Chinese cars in the
market. Compared to the other brand in the same filed, Geely and Chery were the ones that
achieved the highest brand awareness.
If looking at these brands as a whole, no single Chinese brand listed achieved an average
score that is above 3 (3= moderately familiar). This coupled with a major proportion of less
than 1 standard deviation further signifies overall inadequate brand awareness towards
Chinese brands in the international market. Chinese automobile brands, in particular, suffer
from very little brand awareness. Some of the respondents’ comments below confirm the
status quo of Chinese car brands:
“I am not familiar of any Chinese car brands. Most big car brands use TV and
commercials to make their new features and cars knowledgeable to the public. I have never
Mean Standard Deviation
Lenovo 2.96 1.49
Geely 1.24 0.71
Haier 1.54 1.06
Tstingdao 1.96 1.43
BYD 1.11 0.51
TCL 1.22 0.57
Huawei 2.08 0.28
ZTE 1.43 0.96
Chery 1.24 0.73
Wahaha 1.12 0.55
DFAC 1.03 0.21
JAC 1.07 0.40
Changan 1.04 0.23
Hafei 1.08 0.35
Hongqi 1.06 0.32
FamiliarityChinese brands:
Familiarity of Chinese brands
53
seen a TV commercial of a Chinese car brand in Europe. With cars, Branding is extremely
important.” (Spanish, male, 20-29)”
“It is largely unknown outside of China. Even within china, I rarely notice nice Chinese
cars.” (American, male, 20-29)
In the interest of knowing which gender is more familiar with Chinese brands, the
responses were divided into male and female group and mean score of each was calculated
and illustrated as below:
Figure 9: The means of different gender on the awareness of Chinese brands. (N=204)
Shown as above, male respondents exhibit slightly more awareness of Chinese brands than
female respondents. Disparities are obvious on a few brands such as Lenovo, Tstingdao and
Huawei. This is probably caused by genders’ different preferences on products’ categories.
Yet, with regard to all the car brands listed in the questionnaire, no major difference
detected between the two genders. Despite little difference on the mean score of Geely and
Chery, all Chinese automobile brands have received extremely low scores from both
Consumers' Familarity with Chinese Brands Female! Consumers' Familarity with Chinese Brands Male!
54
4.1.2 Brand image and its country of origin
Brand image of Chinese brands were mainly assessed with two aspects. The first is to
examine whether consumers think “made in China” helps or hurts the brand and the second
is to ask the respondents to choose three words to describe the brand image. Both questions
and options were adopted from the questionnaire conducted by Interbrand’s white paper
(2005).
Likert scale 1- 5 is applied to clarify respondents’ statement of “made in China” effects on
the brands with 1 being it definitely hurts to 5 being it definitely helps. All of the 204
respondents answered this question. Result is showed in Figure 10 as below:
Figure 10: “Made in China” Effects on the Chinese brands (N =204, Mean =2.07, Std. Deviation = 0.79)
Shown in Figure 10, more than half of the respondents think that “made in China” slightly
hurts the brand and 23% of the respondents think that it definitely hurts the brand, which
makes it over 70% of the respondents perceive the “made in China” label as a minus or a
negativity of a Chinese brand. This argument is further strengthened by a strong
comparison of only 3% of the respondents, who think “made in China” helps or slightly
helps the brand. A significant disparity displayed here suggests a major concern for Chinese
brands.
23.00%
50.50%
23.50%
2.00% 1.00% 0.00%
20.00%
40.00%
60.00%
80.00%
100.00%
It definitely hurts
It slightly hurts Neutral It slighly helps It definitely helps
"Made in China" Effects on the brands
55
In the scale of 1-5, the mean score at this question is 2.07 with a standard deviation of 0.79.
In order to further test the difference between groups and examine if genders or the age
group of the respondents has any significant effect on the respondents’ statements, an
independent sample t-test and a one-way ANOVA are performed. At this point, t-test is
applied to distinguish the means of male and female respondents and ANOVA was used to
test the age groups. Both tests are realized and their results are analyzed by SPSS.
Table 6: T-test on difference of perceptions towards “made in China” effect between genders. (N=204)
Based on the result of the t test (t = 1.17, p = 0.25), the outcomes were similar in the male
group (M = 2.00, SD = 0.77) and in the female group (M = 2.13, SD = 0.81). In other words,
the t-test showed that there was not statistical difference on the perceptions of “Made in
China” effects between male and female respondents.
Table 7: ANOVA on difference of perceptions towards “made in China” effect among the age groups. (N=204)
Mean S.d Mean S.d t
"Made in China" hurts or helps the brand 2.13 0.81 2.00 0.77 1.17
F
p
0.03
0.25
Variables
Descriptive differences of perceptions on "Made in China" effect between male and female (T-test)
Female Male
Mean S.d
<20 3.00
20-29 2.06 0.82
30-39 2.11 0.66
40-49 2.25 0.96
50 2.00 0.82
F
P
0.43
0.79
Different age group and perceptions on "Made in China" effect: one-way ANOVA
PerceptionsAge Group
56
Further, the ANOVA test (F = 0.43, p = 0.79) also shows the insignificant p value (p > 0.05)
for the age groups, meaning that respondents’ perceptions on the “made in China” effects
are also not affected by the age difference.
Thus, it is clearly demonstrated that a label of “made in China” is thought to be negative by
both male and female respondents from different age groups. This implies a commonality
among the respondents, representing a common negative view on “Made in China” effects.
In the interest of knowing consumers’ impression of Chinese brands today, the respondents
were asked to provide three words that are representative of their thoughts. Results turned
up as uniform and the top five responses are presented below:
Table 8: Top five impression of Chinese brands today. (N = 204)
Here, the rank of the attributes gathered from the consumers indicates factors of quality,
reliability, largely unknown and overall value are critical missing associations. The
respondents acknowledged that Chinese brands lack reliability and credibility.
“Chinese brands suffer from a negative reputation as being cheap with poor quality. They
need to convince the consumers with brands that embody good quality and reliability”.
(Belgian, male, 20-29)
Ranking of
responseAttribute Frequency Percentage
1 Cheap 171 83.80
2 Poor value 119 58.33
3 Poor quality 82 40.20
4 Unreliable 66 32.35
5 Unsophisticated 46 22.55
57
“Many people sometimes don’t believe Chinese brands. Chinese companies have to
establish some brands that international consumers can trust, not brands that are
associated with fake and replica products”. (Korean, female, 30-39)
By comparing the results to the results (Table 9) obtained by Interbrand (2005, p. 3) from
the same question, it is both anticipated and surprising to find extensive similarity between
the two results as both listed cheap, poor value, poor quality and unreliable in the top 5
attribute of Chinese brands. Clearly, this affirms a reality that Chinese brands do not score
well on many of the dimensions most often associated with leading brands and it seems as a
universally acknowledged problem of most Chinese brands.
Table 9: Results obtained by Interbrand in 2005.
At this point, it can be stated that “made in China” effects and the top ranked attributes of
Chinese brand images are profoundly consistent, indicating the overall disapproval of
brands that are originated from China due to their lack of quality, reliability and credibility.
4.1.3 Chinese brands and China as a COO
After obtaining information of Chinese brands’ image and consumers’ perceptions towards
brands’ “made in China” identity, it is of interest to understand the relationship between
Chinese brands and China as a COO. The amount of respondents (in percentage) who
picked the top 5 words that represent the image of Chinese brands were paired with their
Ranking of
responseAttribute
1 Cheap
2 Poor value
3 Poor quality
4 Unreliable
5 Unsophisticated
58
attitudes towards brands’ Chinese identity in order to make a cross-reference and examine
to what extent do respondents’ image of Chinese brands influence their attitude towards
China as the COO. Result is illustrated as below:
Figure 11: To what extent does consumers’ image of Chinese brands influence their attitudes towards China as the COO.
Clearly, most respondents who choose the top 5 words, such as cheap, poor quality,
unreliable, largely unknown and poor value, also expressed negative attitudes of the
Chinese identity by stating “made in China” definitely hurts or slightly hurts Chinese
brands. Very few respondents who picked top 5 words consider the Chinese identity still
helps the Chinese brands.
Two aspects are considered to explain the result. First, consumers concluded those words to
represent their impression about Chinese brands through their previous product experience,
which in turn developed into a generalization stereotyping Chinese brands. This is to say,
the perception towards brands’ COO is associated with consumers’ impression about
brands of that country. Thus, consumers’ prior experiences with Chinese brands have a
direct impact on the emergence of consumers’ generalization towards China as brands’
COO.
0.00%!
10.00%!
20.00%!
30.00%!
40.00%!
50.00%!
60.00%!
1.It definitely hurts! 2. It slightly hurts! 3. Neutural! 4. It slightly helps! 5. It definitely helps!
Per
cen
tag
e o
f th
e re
spo
den
ts!
!
Influence of stereotype of Chinese brands on brands' COO
Cheap
Poor quality
Unreliable
Largely unknown
Poor value
59
On the other hand, the generalization of China as brands’ COO could be reflected on
consumers’ brand image of certain Chinese brands that they may not have or may have
very little experiences with. On the basis of little awareness of Chinese car brands
presented prior, Chinese automobile brands could be a good example to test the effects of
brands’ COO at this point and it will be further discussed in the next section.
4.1.4 Summary
Findings in this section illustrate a rather homogenous view on Chinese brands. Although
the responses were compared and analyzed according to respondents’ gender and age group,
no significant differences were detected in terms of the brand awareness and brand images.
The Chinese brand that the respondents are most familiar with is Lenovo (M=2.98), a
Chinese multinational computer company that acquired IBM’s personal computer business
in 2005. Huawei (M=2.08) came to the position as the second most familiar Chinese brand.
However, Chinese car brands as a whole failed the brand awareness test. All of the means
of Chinese car brands scored below 2, among which Geely and Chery possess relatively
higher brand awareness. Even so, no single Chinese brand scored above 3, indicating a
grim reality that 1) international consumers are not well aware of Chinese brands, and 2)
international consumers have nearly no brand awareness towards Chinese automobile
brands.
With regard to the brand image, the “made in China” label on Chinese brands was first
examined. Findings showed that the majority of the respondents think the “made in China”
label hurts the brand image to some extent. Similarly, no statistically difference based on
gender or age group was detected by using independent sample t-test and one-way ANOVA.
The subsequent discussion on the attributes of Chinese brands revealed the general
stereotypes of Chinese brands in the minds of the consumers. 88% of the respondents think
that Chinese brands represent cheapness and over half of the respondents think the brands
60
are associated with bad quality. Unreliable, largely unknown and poor values are the other
three top ranked attributes. These attributes represent that the overall Chinese brand image
is widely disapproved in the international market as well as partly explained the
disapproval of the “made in China” label discussed prior.
Therefore, it can be concluded that CBBE of Chinese brands in the international market is
not a satisfactory at the moment.
Aside from brand awareness and brand image, the extent to which the stereotypes of
Chinese brands influence China as brands’ COO was illustrated and analyzed. The
reciprocal relationship between consumers’ impression of Chinese brands and their
perception towards China as the brands’ COO was highlighted. The interrelationship was
essential to understand and anticipate the overall brand equity for Chinese automobile
brands amid global market.
In the next section, findings about the COO effects on Chinese automobile brands in
particular are presented. Simultaneously, opinions gathered on Chinese automobile brands
and its industry are discussed with details
4.2 COO effects on Chinese automobile brands
This section presents findings related to the second part of the research questions, which
was designed to explore the effects that COO places on Chinese automobile brands. After
obtaining the respondents’ attitudes about Chinese brands as a whole, it is necessary to
study their perceptions on Chinese automobile brands per se. First, perceptions on the
automobile branding are introduced, providing a general picture on how important people
think of branding is in the car business. Second, Chinese automobile industry in particular
will be assessed and the result will be compared to the results obtained by Interbrand in
2005 to test the consistency and result validity. Last but not least, the current market
61
demand on Chinese cars will be determined in order to anticipate the prospects of Chinese
car brands in the future.
4.2.1 Importance of brands’ country of origin in the car business
The importance of brands may differ in various industries. Considering the subject of this
study, it is vital to understand the role of brands in the car business by studying importance
it is in the minds of the international consumers. For this purpose, respondents were
required to rank the importance of branding amid car purchase with a likert scale from 1 as
being not at all important to 5 as being extremely important. Figure 12 below presents the
findings.
Figure 12: Importance of brands’ COO to car purchase (N = 204, M = 3.14, Std. Deviation = 1.05)
Given the Figure above, it is clear that half of the respondents think brand’s COO is very
important or extremely important to the purchase decision of car. Contrarily, 3.9% of the
respondents think brands’ COO do not matter at all and 16% of the respondents it is of
slight importance.
3.90% 16.20%
29.90% 35.30%
14.70%
0.00%
20.00%
40.00%
60.00%
80.00%
100.00%
Not all important
Slightly important
Moderately important
Very important
Extremely important
Brands'COO importance to car purchase
62
Figure 13: Importance of brands’ country of origin to car purchase in terms of different genders (N=204)
According to Figure 13, with regard to the different genders, no significant disparity was
detected except for the group who does not see brands’ COO as at all important. Among
those respondents who think brands’ COO are not at all important, there is 6.7% of the total
male respondents and only 1.7% of the total female respondents. Nevertheless, this implies
an existence of a certain customer group, the majority of which is male customers who do
not care about brands’ COO. Additionally, female consumers seem to make more account
of brands’ COO than male respondents.
From the statistical point of view, a chi-square test was performed on the differences
between male and female respondents for the importance of brands’ COO. The test showed
no statistical significance, meaning gender difference is not associated with the proportion
of individuals’ statements based on the 1-5 scales, χ² (4, N = 204) = 3.7, p > 0.05. An
independent-sample t-test (Table 10) followed to test if there is statistically significant
difference of perceptions on the importance of brands’ COO between male and female. The
large p-values suggest that group means of male (M = 3.37, SD = 1.12) and female (M =
1.70%
17.40%
30.40% 36.50%
13.90% 6.70% 14.60%
29.20% 33.70% 15.70%
0.00%
20.00%
40.00%
60.00%
80.00%
100.00%
Not all important Slightly important Moderately important
Very important Extremely important
Brands'COO importance to car purchase ( Gender of respondents Crosstabulation) Female
Brands'COO importance to car purchase ( Gender of respondents Crosstabulation) Male
63
3.43, SD = 0.99) are identical, meaning the extent of the importance of car brands’ COO in
the minds of male and female respondents does not vary.
Table 10: Independent-sample t-test on the importance of car brands’ COO between different genders.
With regards to the different age groups (N =204), respondents who are from the group of
20-29, group of 30-39 and the group of 40-49 seemed to pay more attention to the car
brands’ COO as depicted in Table 11. Yet, proportions of all the age groups dropped on the
statement of brands’ COO being “extremely important”. This is in line with the trend
shown in the Figure 13, where proportions of the different genders also dropped on the
same statement.
Table 11: Frequencies of different age groups on the importance of Car brands’ COO to car purchase. (N = 204)
Mean Std.Deviation Mean Std. Deviation t
Importance of car brands' COO 3.43 0.99 3.37 1.12 0.43
F
p
Female Male
Descriptive differences of the importance of car brands' Country of Origin (COO)
Variable
1.27
0.67
Age Groups of respondents
<20 20-29 30-39 40-49 >50 Total
Not all important Count 0 7 1 0 0 8
% within Age Groups of respondents 0.00% 4.40% 2.70% 0.00% 0.00% 3.90%
Slightly important Count 1 27 3 0 2 33
% within Age Groups of respondents 100.00% 17.10% 8.10% 0.00% 50.00% 16.20%
Moderately important Count 0 45 13 2 1 61
% within Age Groups of respondents 0.00% 28.50% 35.10% 50.00% 25.00% 29.90%
Very important Count 0 53 17 1 1 72
% within Age Groups of respondents 0.00% 33.50% 45.90% 25.00% 25.00% 35.30%
Extremely important Count 0 26 3 1 0 30
% within Age Groups of respondents 0.00% 16.50% 8.10% 25.00% 0.00% 14.70%
Total Count 1 158 37 4 4 204
% within Age Groups of respondents 100.00% 100.00% 100.00% 100.00% 100.00% 100.00%
Brands'COO importance to car purchase (Age Groups of respondents Crosstabulation)
64
Last but not least, one-way ANOVA (Table 12) was performed to test the differences in the
means across different age groups. The test (F = 1.003, p = 0.407) indicated the
insignificant p value (p > 0.05) for the age groups.
Table 12: ANOVA of the Brands’ COO importance to car purchase among different age groups.
Based upon all the figures presented, it is approved that most of the respondents think the
brands’ COO is important when it comes to car purchase, regardless of the gender and the
age. In addition, people, whose ages are between 20-49, tend to pay more emphasis on the
car brands’ COO than people from the other age groups. It is also worth noting the
existence of one customer segment, the majority of which is male consumers who do not
think brands’ COO as important at all. On the other hand, female respondents seem to be
slightly more attentive towards brands’ COO than male respondents are.
4.2.2 Consumers’ evaluation of Chinese car industry
In an interest of understanding consumers thoughts on Chinese automobile industry and
examining if the result is in line with the stereotypes and images of Chinese brands
discussed in the previous section, Chinese automobile industries are rated against a number
of criteria. The result is also compared to the result obtained by Interbrand in 2005 in order
to seek consistency or possible variation over the years. The respondents were required to
Brands'COO importance to car purchase (Age group) ANOVA
Mean Std. Deviation
<20 2.00 0.00
20-29 3.41 1.09
30-39 3.49 0.87
40-49 3.75 0.96
>50 2.75 0.96
F
P
Age Group
1.00
0.41
Perception
65
rank the Chinese car industry on a scale of 1-5 (1 as the lowest score, and 5 as the highest
score). The criteria include price, prestige, service, innovation, trust, safety, reliability and
overall value. The findings (Figure 14) are presented below:
Figure 14: Means of Chinese car industry on a scale of 1-5 against listed criteria (N=204, M = 2.37)
As is indicated by Figure 14, Chinese automobile industry is quite low rated against most of
the criteria. Besides price, the respondents rate the industry below 3 on all the other criteria,
indicating an overwhelming takeaway of Chinese automobile industry being below
acceptable standards. Among all, prestige receives the poorest score, followed by trust,
safety and reliability. On the other hand, the above 3 score on price implied a common
knowledge that price could always be a competitive advantage for Chinese brands in the
international market. However, having it as the only advantage is obviously far from
adequate to compete in the global market. What is even worse is that it could cause a
generalization for Chinese automobile brands just like for some other Chinese brands in
some cases that cheap prices equal to bad quality and a short product lifetime. If looking at
the result obtained by Interbrand in 2005, similarity can be detected. In 2005, while
international respondents were asked to score the Chinese car industry on the same criteria,
prestige also received the lowest rate, and service and reliability comes the second and the
3.21
1.89 2.34 2.50
2.12 2.18 2.26 2.47
0.00
1.00
2.00
3.00
4.00
5.00
Price Prestige Service Innovation Trust Safety Reliability Overal value
Chinese car industry on a scale of 1-5
66
third (Interbrand, 2005, p. 3). Here, it is concluded that Chinese car brands have remained
poor prestige and low reliability through years and the reality is now calling Chinese car
companies to quickly become more sophisticated in the practice of branding and quality
control.
With regards to the different gender groups (Figure 15), male respondents seem to be more
appreciative of the competitive price of Chinese automobile brands than female
respondents do. However, on all the other criteria, male respondents gave lower rates than
the female respondents.
Figure 15: Means of different genders on the rate of Chinese car industry against certain
criteria (N = 204)
Although no significant variance can be detected by solely looking at the means between
male and female respondents, an independent-sample t-test (Table 13) showed there are
statistically differences on three criteria.
3.11
1.94 2.46 2.67
2.22 2.31 2.32 2.51
3.34
1.81 2.17 2.26 1.98 1.99 2.13 2.43
0.00
1.00
2.00
3.00
4.00
5.00
Price Prestige Service Innovation Trust Safety Reliability Overall value
Female Male
67
Table 13: T-test on difference of the rate on Chinese car industry against certain criteria (Gender) (N = 204)
Given the results of t-test, there were three criteria, on which the means were statistically
different between male and female respondents. These criteria are service (M (f) = 2.46, SD
= 0.85, M (m) = 2.17, SD = 0.88, t = 2.395, p = 0.018), innovation (M (f) = 2.67, SD = 1.01,
M (m) = 2.26, SD = 1.06, t = 2.826, p = 0.005) and safety (M (f) = 2.31, SD = 0.84, M (m)
= 1.99, SD = 0.91, t = 2.633, p = 0.009). In other words, with respect to service, innovation
and safety, there were statistically significant differences between genders. At this point,
male consumers tend to possess lower opinion of Chinese car brands than female
consumers from the perspectives of service, innovation and safety.
Figure 16 depicts ratings among different age groups. Respondents above 50 years old
seemed to highly appreciate the price aspect of Chinese cars by giving an average score of
4.5 out of 5. Moreover, respondents that are under 20 years old seemed to have high
opinions of the service and innovation of Chinese car industry. Yet, the majority of the
respondents who are aged between 20-29 gave out averagely very low ratings. It is also
worth noting that 40-49 years old respondents rated the reliability with 3.5 and the
respondents above 50 years old rated overall value with the same score.
Mean Std. Deviation Mean Std. Deviation t
Price 3.11 1.29 3.34 1.31 -1.22
Prestige 1.94 0.92 1.81 0.82 1.05
Service 2.46 0.85 2.17 0.88 2.395*
Innovation 2.67 1.01 2.26 1.06 2.826*
Trust 2.22 0.86 1.98 0.87 1.98
Safety 2.31 0.84 1.99 0.91 2.633*
Reliability 2.32 0.85 2.13 0.91 1.51
Overal value 2.51 0.77 2.43 0.85 0.72
*p < 0.05
Female Male
Discriptive differnce of the rates on Chinese car indsutry against certain criteria (Gender)
Variables
68
Figure 16: Means of age groups on Chinese car industry against certain criteria (N = 204)
One-way ANOVA was performed to test if the means across the age groups are different.
The outcomes showed that there are statistically significant differences on the ratings of
reliability (F= 2,567, p = 0,039) and overall value (F = 3,125, p = 0,016) among the age
groups. This means that the age differences do have effect on the ratings of reliability and
overall value of the Chinese automobile industry. Table 14 below depicted the ANOVA
results
Table 14: Means differences on the ratings of Chinese automobile industry against certain criteria (age groups) (N = 204)
To summarize this section, it is clear stated that the international consumers rated the
Chinese car industry below acceptable standards (M < 3) against most of the listed criteria.
Prestige seems to be the most problematic dimension of all time, underlying unappealing
actualities of Chinese car brands in the global market and implying unsatisfying CBBE
caused by the unsophistication in the practice of branding. Moreover, quality remains the
biggest concern as all associated criteria such as trust, safety and reliability all received
very low score. Statistical analysis indicated that male consumers possess lower opinion of
3.00 3.00
4.00 4.00
2.00 2.00 2.00
3.00 3.22
1.88
2.34 2.53
2.13 2.16 2.25 2.46
2.97
1.84
2.16 2.22
1.92
2.19 2.05
2.32
3.75
2.25
2.75
2.25 2.50
2.75
3.50 3.25
4.50
1.75
2.75
3.25
2.75
2.00 2.25
3.50
0.00
1.00
2.00
3.00
4.00
5.00
Price Prestige Service Innovation Trust Safety Reliability Overall value
<20 20-29 30-39 40-49 >50
Mean Std. Deviation Mean Std. Deviation Mean Std. Deviation Mean Std. Deviation Mean Std. Deviation Mean Std.Deviation Mean Std. Deviation Mean Std. Deviation
Likelihood of buying a Chinese car in the future (ANOVA)
Likelihood (1-5)Age Group
73
Highlight of this section is the examination on the willingness of buying a Chinese car in
the future. Although more than half of the respondents expressed the possibilities of
purchasing a car in the future, indicating a promising market demand, the actual willingness
of buying a Chinese car is incredibly low. Nearly 68% of the respondents completely
eliminate the possibility of buying a Chinese car while 23% of the respondents somewhat
expressed the likelihood of buying the cars. In comparison to the market demand examined
prior, the future for Chinese car companies in the international market is indeed not
optimistic. The reality is that being associated with an unfavorably perceived COO along
with the unsophisticated practice of branding, Chinese brands, including car brands, are
under negative influences caused by stereotypes of Chinese brands in order to successfully
manage the brand equity of Chinese car brands in the market, understanding the influences
brought by brand’s COO is an essential first step to begin with.
4.2.4 Summary
This chapter is designed to explore the effects of brands’ COO on Chinese brands, car
brands in particular. It begins with a study regarding the importance of branding in the car
business. The underlying purpose of this study is to obtain knowledge on the extent, to
which customers value a brand, and thereby to understand the role of a brand’s COO amid
car purchases. As a result, over half of the respondents stated that brands’ COO is either
very important or extremely important to their purchase decision. Further, female
consumers seemed to value brands COO more than male consumers. However, no
statistically significant differences were detected between the genders. Consumers between
20-49 years old seem to think that car brands’ COO is of importance. Consumers that are
under 20 or above 50 years old seem to think that car brands’ COO is somewhat important.
No significant variance was detected as well across the age groups based on the ANOVA
analysis.
74
In order to obtain the evaluation of the Chinese car brands as a whole, the respondents were
required to assess the industry on a scale of 1-5 with 1 being the lowest score and 5 being
the highest score. Results showed that Chinese automobile industry received low grades on
most of the criteria with prestige individually scored the worst among the others. This result
reveals the reality that Chinese car companies’ lack of branding expertise and its
subsequent consequence of inadequate branding. Additionally, all the low ratings on
criteria such as trust, safety and reliability are reflections of consumers’ disbelief towards
the quality of Chinese car brands, which is profoundly in line with the brand images
discussed prior.
The sales prospect for Chinese is not positive. Approximately 68% of the respondents
expressed the absolute unlikelihood of purchasing a Chinese car in the future despite the
fact that more than half of the respondents expressed the willingness of purchasing a car
prior.
Based on the previous findings, it is clear that international consumers do not view Chinese
cars exclusively different from the other brands of different fields. To be more specific,
according to the results, Chinese car brands remain largely unknown and suffer from low
prestige associated with bad quality and unreliability just as the other Chinese brands of
different categories. The strong consistency observed implies a solid fact that the
generalizations of Chinese brands are also applicable to the Chinese car brands, especially
from the perspective of CBBE. More importantly, it underlies a reciprocal influence
between the brands’ CBBE, brand image in particular, and the brands’ COO effects.
Correlations among certain constructs were performed to statistically validate this
interrelationship. Table 16 reports the descriptive statistics and correlations.
Depicted by the correlation coefficient, strong correlations (p < 0.01) exist among the
influence of brands’ COO (measured by “made in China” effects in the study), the role of
brands’ COO amid car purchase (the importance of brands’ COO to car purchase) and the
75
likelihood of consumers buying Chinese cars in the future. In other words, these strong
correlations indicate significant interrelationships among the three constructs. Similarly, the
influence of brands’ country or origin and the image of Chinese cars (measured by the
evaluation of Chinese car industry) are proved to be correlated in terms of trust, safety,
reliability and overall value. The correlations are particularly strong with the latter three
quality related criteria (p < 0.01), underlying the substantial association between quality
assessment and consumers’ perceptions on the brands’ COO. It is worth noting that these
quality-related criteria are also in strong associations (p < 0.01) with consumers’ purchase
prospects on Chinese cars.
Thus, based upon the arguments above, findings can be stated from the following aspects:
1. Brand’s COO is perceived as important by the international consumers when it
comes to the car purchase.
2. Consumers’ perceptions on Chinese cars are quite negative. Just like other Chinese
brands from different categories, the Chinese car brands suffer from same low
prestige and are associated with bad quality and unreliability.
3. Statically proved, Chinese car brands are definitely under the generalization of
brands’ Chinese identity, which was considerably associated with consumers’
unpleasant experiences with other Chinese brands across different product
categories.
4. The sales prospect for Chinese cars in the international market is bleak. According
to the extent to which consumers value the car brands’ COO, lack of expertise on
branding causes Chinese car companies serious problems on top of the already low
customer based brand equity.
76
Co
nst
ruct
s (1
-5 s
cale
)M
ean
Std
. D
evia
tio
n
Mad
e in
Ch
ina
hu
rts
or
hel
ps
the
bra
nd
imag
e
Pri
ceP
rest
ige
Ser
vic
eIn
no
vat
ion
Tru
stS
afet
yR
elia
bil
ity
Ov
eral
l
Val
ue
Bra
nd
s'C
OO
imp
ort
ance
to c
ar p
urc
has
e
Lik
elih
oo
d
of
bu
yin
g
a C
hin
ese
car
Mad
e in
Ch
ina
hu
rts
or
hel
ps
the
bra
nd
im
age
2.0
7.7
91
.00
Pri
ce3
.21
1.3
0-0
.10
1.0
0
Pre
stig
e1
.88
.88
0.1
00
.07
1.0
0
Ser
vic
e2
.33
.88
0.1
4.1
89
**
.63
4*
*1
.00
Inn
ov
atio
n2
.49
1.0
50
.06
0.0
7.4
79
**
.51
4*
*1
.00
Tru
st2
.11
.87
.17
4*
0.0
8.6
25
**
.54
8*
*.5
41
**
1.0
0
Saf
ety
2.1
7.8
9.2
27
**
0.0
7.4
94
**
.44
8*
*.4
98
**
.68
8*
*1
.00
Rel
iab
ilit
y2
.24
.88
.25
0*
*0
.09
.52
0*
*.5
93
**
.44
9*
*.7
27
**
.70
6*
*1
.00
Ov
eral
l V
alu
e2
.47
.80
.24
2*
*.2
53
**
.54
0*
*.5
51
**
.61
4*
*.6
51
**
.59
9*
*.6
54
**
1.0
0
Bra
nd
s'C
OO
im
po
rtan
ce t
o c
ar p
urc
has
e3
.41
1.0
5-.
21
4*
*-0
.01
-0.1
2-0
.08
-.1
38
*-0
.13
-.1
92
**
-0.1
1-.
19
7*
*1
.00
Lik
elih
oo
d o
f b
uy
ing
a C
hin
ese
car
1.4
4.6
9.2
21
**
0.0
1.1
58
*.2
15
**
.20
1*
*.1
98
**
.26
5*
*.2
41
**
.29
7*
*-.
22
7*
*1
.00
!"#$#%#&"&'
!!(#%#&"&)
Co
rrel
atio
ns
Tabl
e 16
: Des
crip
tive
Stat
istic
s and
Cor
rela
tions
am
ong
Chi
na a
s a C
OO
, Chi
nese
aut
omob
ile in
dust
ry a
nd
th
e pr
ospe
ct o
f Chi
nese
car
bra
nds i
n th
e m
arke
t
77
4.3 Improving customer-based brand equity of Chinese car brands
The objective of this section is to present the findings in ways that could assist the Chinese
car brands in improving their CBBE based with respect to consumers perspectives.
Findings were mainly obtained through 1) the effectiveness of Merger and Acquisition on
the improvement of Chinese car brands image 2) consumers’ evaluations on the factors
crucial to support the Chinese car brands countering negative COO, and 3) the channels for
effective branding, which aim at enhancing the CBBE. All constructs were evaluated by
international consumers so that the marketing efforts on branding could be achieved to a
great extent.
4.3.1 M&A on improving the image of a Chinese car brand
In an effort to quickly build up brand equity as well as to dilute the negativity brought by
the Chinese origin in the international market, many Chinese companies chose to merge or
acquire foreign brands. Geely, as a representative Chinese automobile brand, acquired
Swedish luxury brand Volvo in 2010 for $ 1.8 billion. Yet, the concern lies in the question
of whether Chinese brands’ image has improved by this strategic move. For that, five-point,
likert-type scale was used to measure respondents’ thoughts on the M&A strategy. The
scale was anchored by 1 = “Strongly disagree” and 5 = “Strongly agree”.
Figure 21: Effect of merger and acquisition (M & A) of Volvo on the image improvement of Geely as a Chinese car brand. (N = 204, M = 3.6, Std. Deviation = 0.87)
Besides the quest of quality improvements and establishment of the right marketing
channels, there are a few other factors that are taken into account by the consumers on
improving the overall brand value.
Customer services seem to be extremely important in car business. A well-designed service
package may compensate some disadvantages carried by a brand’s product. For example, in
regard of the quality concern, Chinese car companies can promote a 7-year warranty just
like the one Hyundai promotes in its oversea market. In comparison with the common
period of warranty, which is 2-3 years, a prolonged warranty may help Chinese brands to
attract more working-class consumers together with its distinct advantage of price.
High innovativeness is another element that could totally reverse the image of Chinese car
brands. In order to achieve this, heavy investment on R&D and cooperation with foreign
expertise cannot be absent from company’s strategic portfolio. Certainly, competing with
108
other brands on core technologies is not yet a possibility for Chinese car brands.
Nevertheless, it is possible for Chinese companies to compete on some other elements and
focus on some other factors, such as exterior and interior design, safety issue, green
technology, etc. From being traditional OEMs of low end products to become high
innovative and international brands, it is an achievement that cannot be reached over a short
period of time. Adequate financial and human resources are must, in addition to extensive
research period.
5.2.2 External association
Other than brands’ product attributes, brands’ external tie is also an element as well as
another approach that could supplement the brands’ overall value.
In an attempt to dilute the negativity triggered by brands’ COO, Tse and Lee (1993) stated
the way of decomposing COO cues by co-operating with external expertise and relocating
manufacturing base. In other words, a Chinese car could be designed by German expertise
and manufactured in the US or Europe. In this way, a Chinese car brand could be labeled as
“Design by Germany” and “Manufactured in the US”.
Expanding to the international market by taking over existing car brands is another option
for Chinese brands. Geely’s acquisition of Volvo has been a pioneering case in the field.
Although future of the acquisition is still undecided, this strategic move has greatly earned
worldwide recognitions for Chinese cars.
5.2.3 Brand differentiation
As the third principal component that could help Chinese car brands counter negative
effects of COO, brand differentiation here entails two aspects, niche market that specialized
109
in green technologies and target market that has less competition and more acceptances of
products from emerging market.
5.2.3.1 Niche market – go green
Despite the fact that the majority of cars these days are still petrol vehicles, green cars that
produce much less CO2 emissions and consume less gasoline will be taking over the
international markets in the near future. To Chinese car companies, this is a terrific
opportunity to differentiate the brand from the others and to endow the Chinese car brand
with a brand new meaning.
With green technology gradually getting mature on daily bases, no specific car brand or
country has completely become significant yet in the field. This means that any brand of
any country origin could become a market leader. This niche market at the moment would
become the dominant market for the future car business. And to most Chinese car brands,
this is a field where they can start from scratch and build up its exclusive name. By building
up green cars as well as market the brand with low price accompanied by good service
package, Chinese car brands could profoundly strengthen their brand equities.
5.2.3.2 Targeting the developing markets
On top of the niche market, targeting less developed markets could be another approach for
Chinese car brands. For brands from emerging economy, especially brands that involve
high technology and requires advanced mechanical know – how, competing in major
markets does not bring many edges to the brands and instead might cause comparison and
rise attentions on brands’ disadvantages while other more prestigious brands are present.
Hence, for the status quo of Chinese car brands, focusing on emerging market or the third
world countries is a strategy that could be successful. Firstly, due to the relatively lower
110
income level, consumers in those countries would prioritize price of a car over some other
elements. The low price tag that is always accompanies Chinese brands could hence
become a competitive advantage that drives sales. Consumers in the emerging markets may
also demand less from what a car brand can offer on innovation and high technologies and
simply expect a car brand with good quality and basic configuration. Last but not least,
emerging markets are seen as good platforms for the brands to test products and gather
branding experiences in the preparation for entering more competitive markets with more
demanding customers in the future. With these being stated, several emerging markets,
such as Brazil, Mexico and India, could be considered. On top of those emerging markets,
countries in Arica could be another target market for Chinese car brands.
5.3 Limitations and further research
This study is contributed to explore consumers’ perceptions on Chinese brands with
respects to customer – based brand equity amid the phenomenon of Chinese cars going
global as well as to receive knowledge on countering negative effects of COO. Due to
resources and time constraints, limitations of this study exist. In this section, limitations are
stated in brief and future research is as well discussed.
First, this study and its research approach were realized on a basis that is very industry
related, meaning only analytical generalization can be applied in accordance with the result
of this study. In order to utilize the findings on a broader spectrum, framework and research
findings should be tested with care in industries of other kinds. As complicated as different
industries are, relationship among factors could vary and the results could consequently
differ.
Further, downside of the method cannot be neglected. The fact that the main empirical data
was collected in the form of consumer questionnaire could possibly generate bias, which
has to be taken into consideration. In this study, the major groups of respondents are from
111
developed markets, such as Europe and North America. Due to this, findings as
misrepresentations of the overall international market could be a possibility since
perceptions from European and American consumers may not represent the entire
international consumers. Similarly, the large portion of 20 – 29 year old respondents in this
study may as well cause a misleading result. Last but not least, as this study was
approached using snowball sampling, controlling over the sampling process is little.
Consequently, the representativeness of the sample cannot be guaranteed and the fact that
initial respondents tend to nominate people then know well will lead to sampling bias since
it is highly possible that the respondents nominated shared the same traits and
characteristics. Thus, it is possible that the sample obtained in this study is only a small
sub-group of the entire population.
Additionally, factor analysis applied in this study in an effort to examine the possible
strategies and marketing channels for Chinese brands may not be as comprehensive as
expected, constrained by form of the survey questions. Due to time and budget limit,
interviews with experts in the filed were not realized. Professional insights are, thus,
missing. As solutions provided in this study were solely based on consumers’ opinion
without taking into account of experts’ suggestions, strategies stated here could be rather
one-sided. Implications provided may not be suitable for all Chinese brands cross industries
of all kinds and resources needed to realize the strategies may vary among different
companies.
As much as this study is dedicated to study on “made in China” effects, it is of interest to
examine further, at the same time, on foreign brands that are also “made in China” and see
how China as a manufacturing origin and a brand origin entails different effects on the
brands’ CBBE and how those internationally prestigious brands that are “made in China”
overcome the negative influences caused by the bias existed in the international market.
Further, due to the strategic alliances or merger and acquisition are treated currently as the
most common approaches to help Chinese brands internationalize, it would be appropriate
112
to investigate the actual outcomes, what challenges could be possibly emerge and then to
look for strategies to assist Chinese companies with post-merger branding management.
5.4 Conclusions
This study is dedicated to explore the consumer perceptions towards brands originated from
China, Chinese car brands in particular, in order to assess the effects of brands’ COO on
CBBE and, accordingly, design the corresponding strategies that could assist the Chinese
car brands to better manage brand equities in the international market. The study was
approached by a quantitative consumer survey, consisting of three aspects that evaluate first
the status quo of Chinese brands in the international market, then the COO effects on
Chinese car brands in particular followed by suggestions and strategies as the last part of
the survey.
Results of this study indicate that COO did have negative effects on Chinese brands’ CBBE
with strong concern on Chinese brands’ image and quality. In addition, the relationship
between the COO effects and CBBE was revised to a two-direction relationship, meaning
CBBE is no longer simply affected by brands’ Country origin. Instead, the brand equity
embodied by brands of the same country identity is consistently influencing and modifying
the significance of COO associated with those brands. Thus, reciprocal effects are detected
between these two constructs. At the same time, in terms of the dimensions of CBBE,
relationship between brand image and brand quality was as well found to be different
compared to the theoretical framework. To Chinese brands in particular, brands’ quality is
seen as one of the most important elements that consist of the image and, at the same time,
affects the image to a great extent. This is to say, in the department of Chinese brands,
quality should not be assessed apart from the brand’s image as it constantly determines
Chinese brand image while itself is reversely affected by the brand image. Thus, in this
study, brand quality is evolved from a primary dimension of CBBE, which is of the same
level as brand image, to a significant component of the brand image, with which an
113
interrelation was observed through the research. Last but not least, it is anticipated but also
surprised to learn that consumer perceptions towards Chinese brands are universally similar
regardless brands’ product category. The generalization of Chinese brands in the global
market has a significant effect on the Chinese car brands according to the research in this
study and the same quality concern is no doubt becoming the major factor that hinders the
internalization process of Chinese car industry.
Therefore, implications accompanied by potential branding strategies are discussed with
determination of Chinese brands being categorized into double – negative in the global
market. Perspectives on product related attributes, including quality improvement and
effective marketing channels, external associations, such as strategic alliances, and brand
differentiations on targeting niche and emerging markets are presented in an attempt to
assist the Chinese brands to successfully tackle the problems that weaken their brand
equities and, at the same time, to speed up brands’ internationalization process by
strengthening the CBBE. By doing so, it is believed that Chinese brands, car brands in
particular, would be better off at understanding consumers’ perceptions and be well
prepared in the international market for the days to come.
i
REFERENCES
Aaker, D.A., 1991. Managing brand equity: Capitalizing on the value of a brand name,
Free Press. Available at: http://www.lavoisier.fr/notice/frNAOROROUO6Z3OO.html.
Aaker, D.A., 1992. Managing the most important assets: Brand equity. Strategy
Leadership, 20(5), p56-58.
Aaker, D.A., 1996. Measuring brand equity across products and markets. California Management Review, 38(3), p.102-120. Available at: http://www2.ifes.com.br/webifes/conhecimento/Files/ADMINISTRA??O.
Agrawal, J. & Kamakura, W.A., 1999. Country of origin: A competitive advantage?
International Journal of Research in Marketing, 16(4), p.255-267. Available at: