Page 1
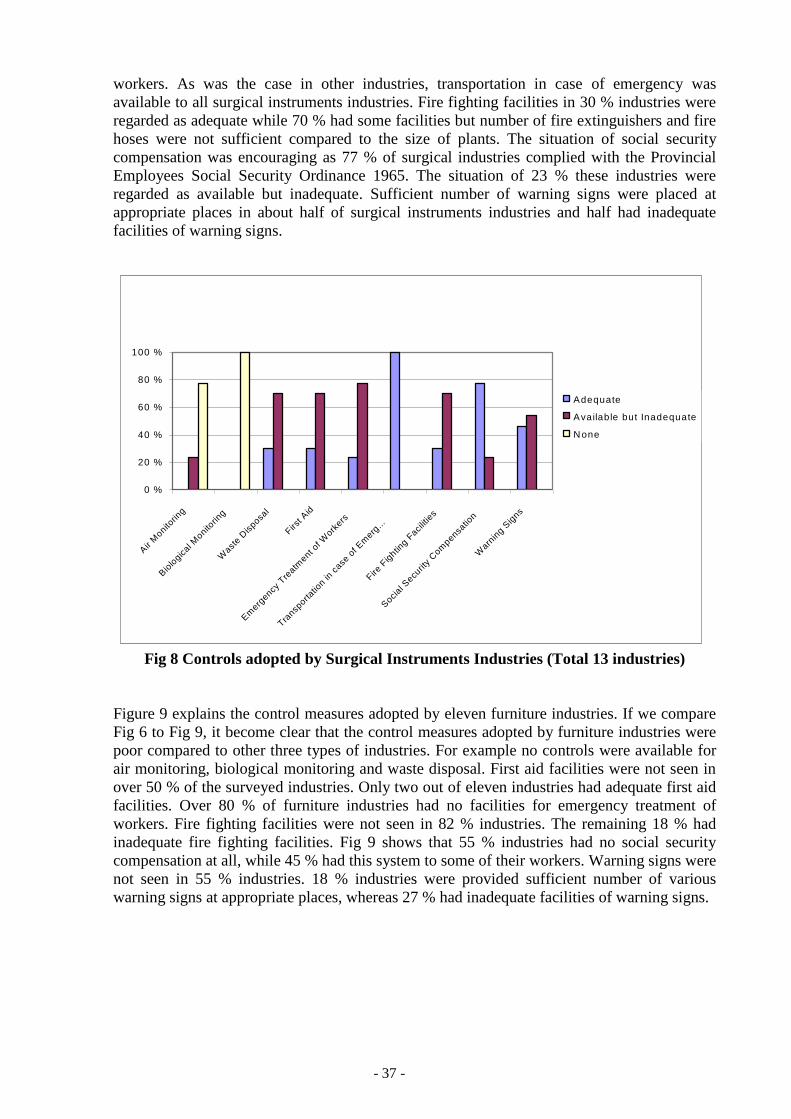
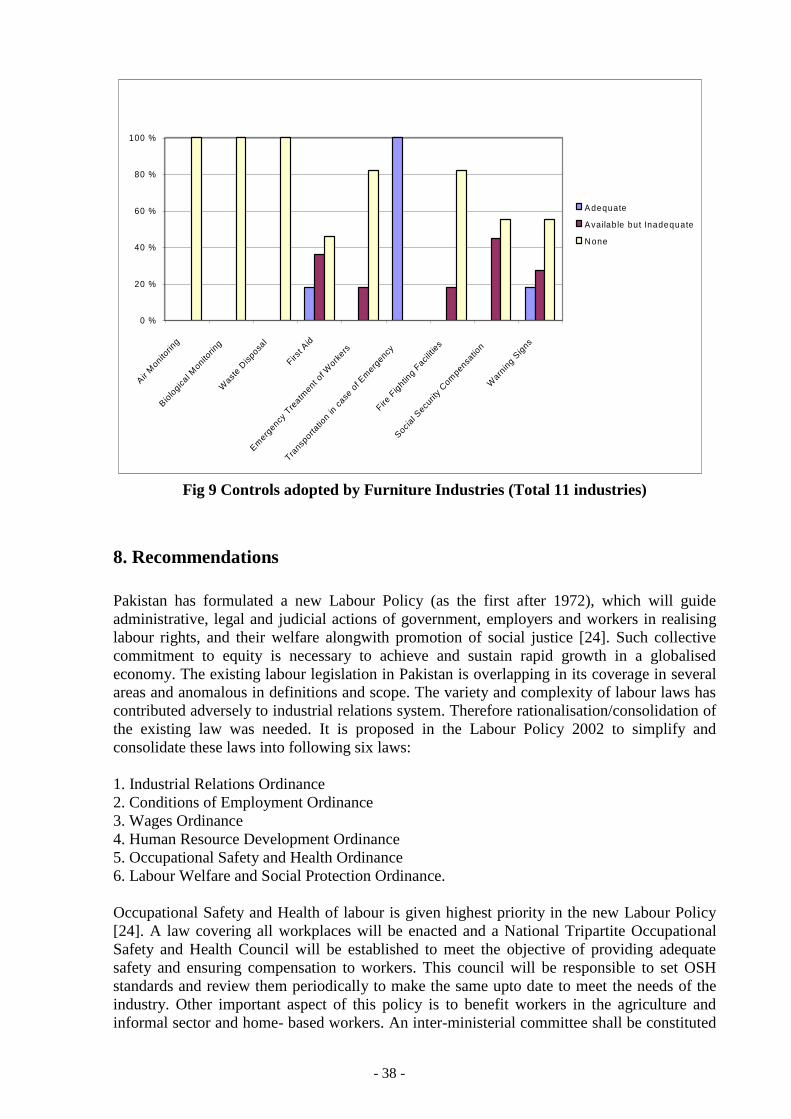
Country Profile on Occupational
Safety and Health in Pakistan
Tariq Sultan Pasha
Centre for the Improvement of Working Conditions and Environment Lahore Pakistan
Jyrki Liesivuori
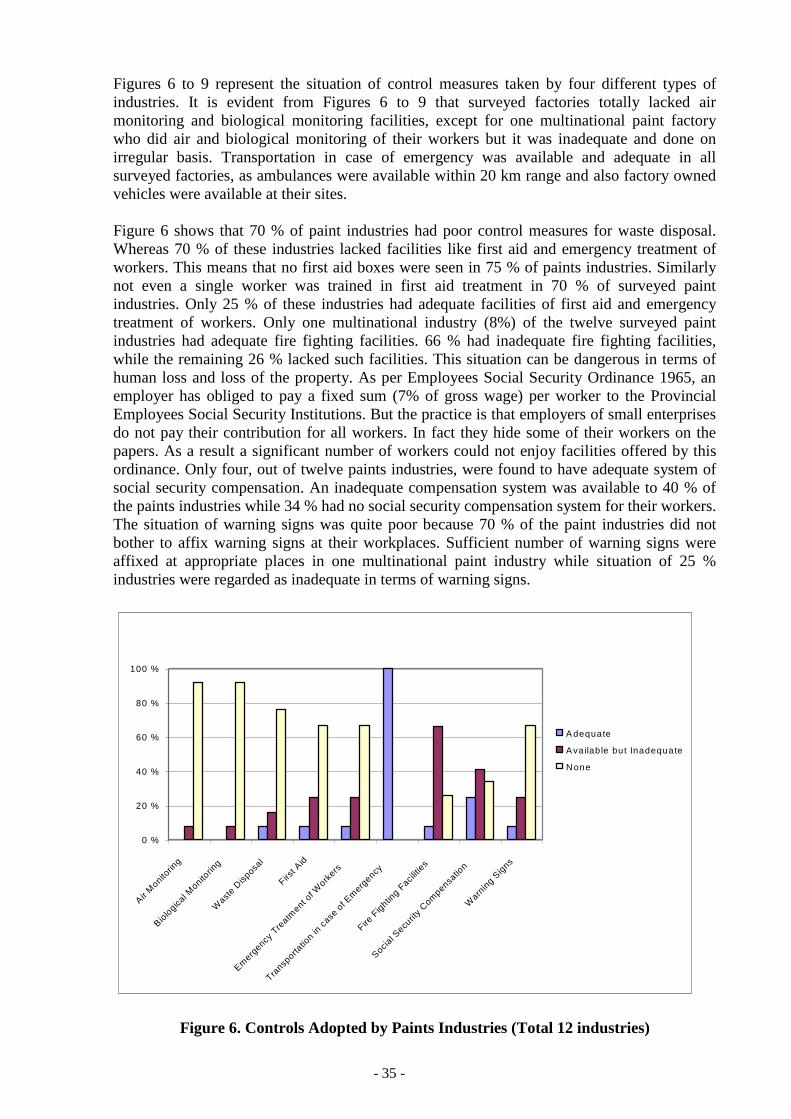
Finnish Institute of Occupational Health
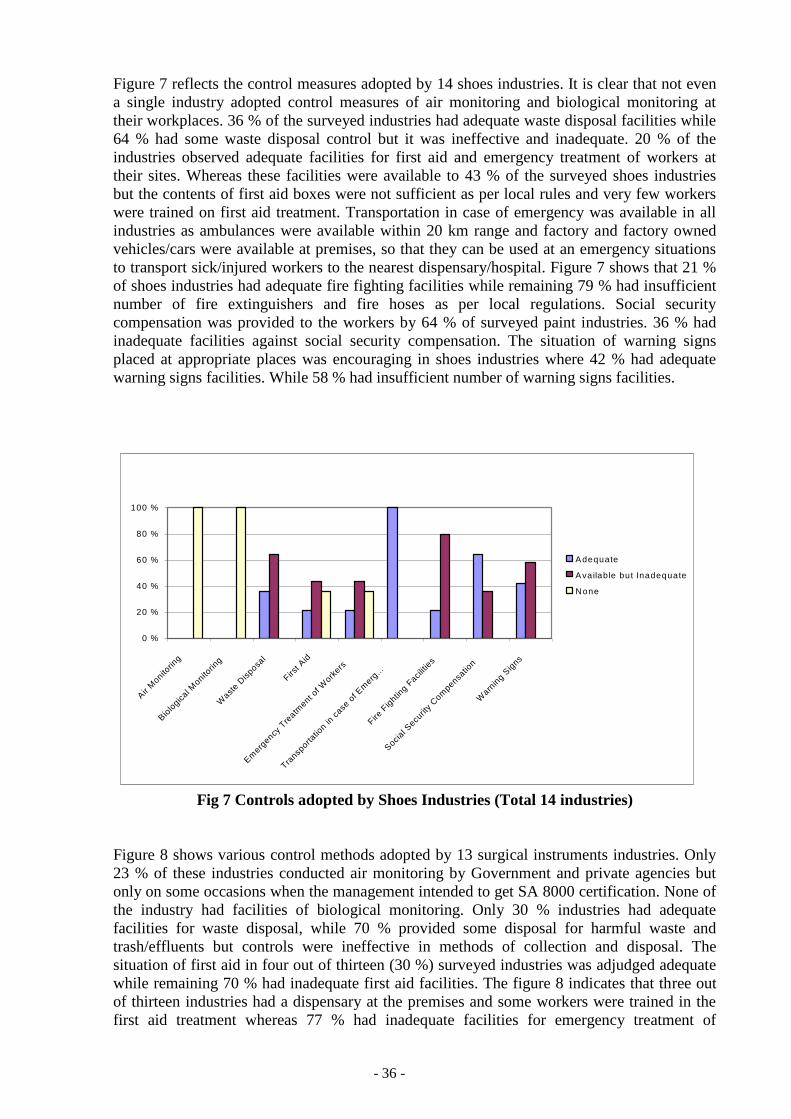
Kuopio Finland
2003
Page 2
Contents
Summary ..................................................................................................................................... 3
1. Introduction ............................................................................................................................ 4
2. Basic Information on Pakistan ................................................................................................ 5
2.1 Area and Population ____________________________________________________ 5
2.2 Economy _____________________________________________________________ 6
2.3 Labour Force and Employment ___________________________________________ 7
2.4 Labour Force Participation Rate ___________________________________________ 8
2.5 Employment Situation __________________________________________________ 8
2.6 Employed Labour Force by Sectors ________________________________________ 9
3. Health ............................................................................................................................ 10
3.1 Health Care System __________________________________________________ 10
3.2 Employees Social Security Institution ____________________________________ 12
3.3 World Health Report 2000-Health Systems: Improving Performance ____________ 13
3.4 Legislation and coverage of OH&S ______________________________________ 15
4. Human Resources in OH&S ................................................................................................. 18
5. Indicators of occupational safety and health outcomes ........................................................ 23
5.1 Accidents at work _____________________________________________________ 23
6. Use of Chemicals in Pakistan ............................................................................................... 24
7. Survey in Industries .............................................................................................................. 25
7.1 A Profile of Medium Sized Industries ____________________________________ 26
7.2 Chemical Hazards by Type of Industries ___________________________________ 28
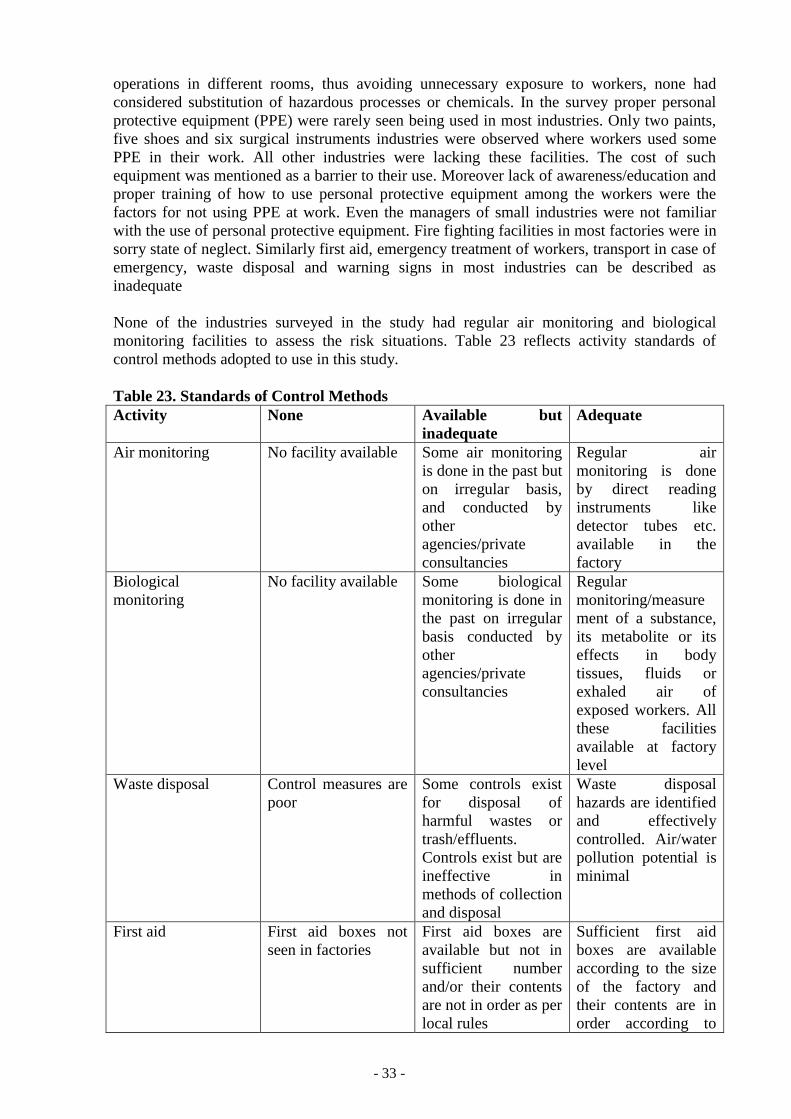
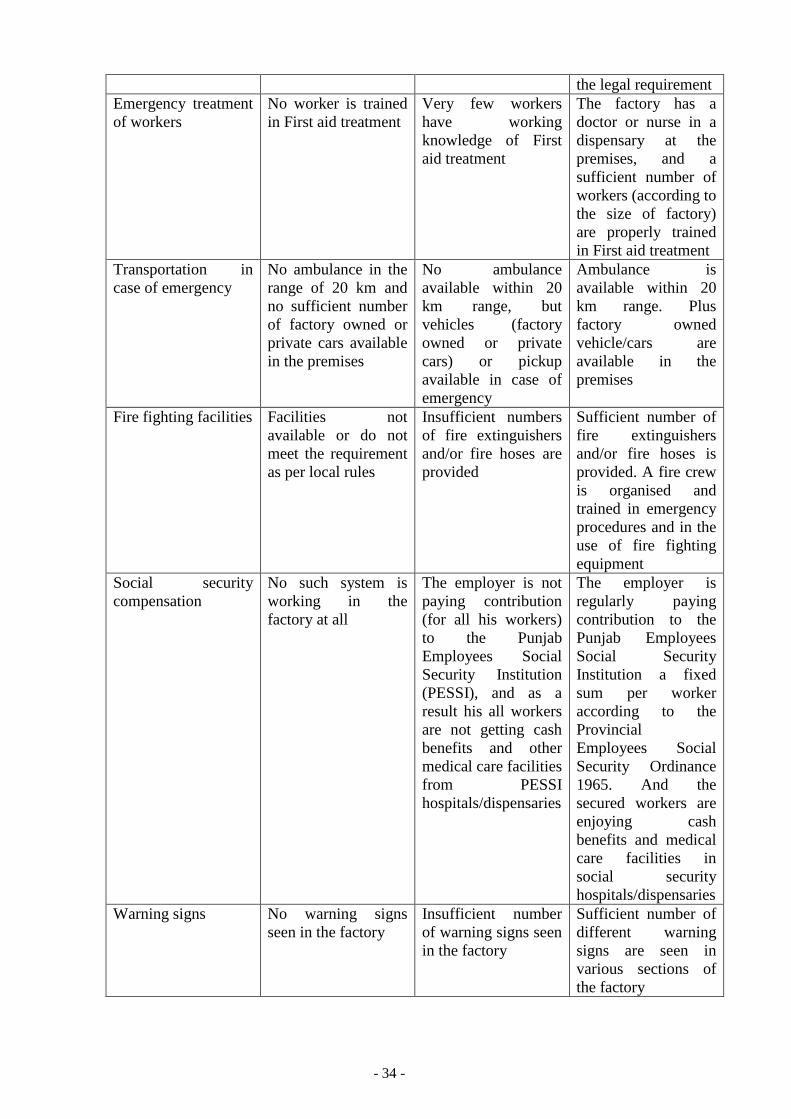
7.3 Safety and Health Hazards and Control Measures adopted by the Industries ______ 32
8. Recommendations ................................................................................................................ 38
References ................................................................................................................................ 43
Annex-1 .................................................................................................................................... 45
Page 3
- 3 -
Summary
This study was undertaken to produce a country profile on Occupational Safety and Health in
Pakistan. Various Government institutions were visited in Pakistan to collect the data and
concerned officials were interviewed. A survey of occupational safety and health to 50
industries was conducted in Punjab province, Pakistan to find out the existing status of OSH
in paints manufacturing, shoes manufacturing, surgical instruments manufacturing and
furniture industries.
While going through the legislation in Pakistan on OSH, it is found that it lacks in many
ways. For example Factories Act 1934 is not applicable to the enterprises employing less than
ten workers. It does not give coverage to the workers in the agriculture sector,
informal/house-based and seasonal workers. Whereas the role of inspecting staff of Labour
and Human Resource department should not be only prosecuting but to give an advisory
services to the management as well.
Majority of the workforce in Pakistan is illiterate and not trained in occupational safety and
health. Moreover OSH is not included in any curricula in Pakistan. The number of
occupational health physicians and nurses is far less compared to the total workforce in
Pakistan. This means that occupational health system is not established in the country.
Although OSH conditions in export oriented industries (sports goods, surgical instruments
manufacturing and textile industries) is encouraging but generally they are poorly organised
in most of the industries.
Survey in 50 industries revealed that working conditions and environment in small industries
are poor compared to medium sized industries. Moreover the industries studied have taken no
effective control measures.
With the arrival of new Labour Policy 2002 (first after 1972), it is hoped that Pakistan will
focus on dignity of labour, strengthening bilateralism, elimination of animosity and
antagonism by fostering a trust relationship between employer-employee and promoting
social dialogue. The change in existing labour legislation (as proposed in Labour Policy 2002)
will help to solve the long awaited questions such as coverage of workers in agriculture and
informal sector and home-based workers and establishment of National Tripartite
Occupational Safety and Health Council.
There is a great need for the industries to improve the status of Occupational Safety and
Health in Pakistan in order to meet the emerging challenges of globalisation and to compete in
the international market.
Page 4
- 4 -
1. Introduction
The diseases and accidents at work remain one of the most appalling tragedies of modern
industrial age and a shear form of economic waste. The incidence of occupational diseases
and injuries is still very high all around the world. According to the ILO estimates (1999),
over one million work-related deaths, about 250 million occupational accidents occur
annually and hundreds of millions of workers suffer from workplace accidents and
occupational exposure to hazardous substances worldwide. The situation in many developing
countries like Pakistan is even more grave due to a number of factors like illiteracy, lack of
education, inadequate medical facilities, lack of reliable information and data of fatal
accidents and injuries suffered by workers each year.
Healthy workers are productive workers with high morale and better productivity. The
introduction of modern and hazardous technologies in the industries has resulted in high rates
of accidents, occupational diseases and unhealthy working environment. As most of the
workforce in Pakistan is illiterate, most of them do not know the protective measures to be
adopted in their jobs. This results in mounting toll of work related accidents and diseases,
resulting in loss of valuable working hours in case of industry and livelihood in case of self-
employed workers. Pakistan lags in the enabling legislation in the field of occupational safety
and health, the infrastructure to promote and enforce occupational safety and health are
inadequate. A large proportion of workforce is employed in the informal and unregulated
sectors of economy such as agriculture, construction and small sized enterprises. Some
segments of the workforce especially the women and children are even more vulnerable as
they are largely employed in the informal sector and agriculture, with little or no access to
basic occupational heath services.
Pakistan like many developing countries, is undergoing a transitional phase in its economy.
Globalisation of world trade is bringing new challenges in the field of occupational safety and
health. The state owned enterprises and monopolies are being dis-invested and privatised.
Despite the slow growth in the formal industrial sector during the last few years, the informal
and service sectors are growing at a rapid pace. The mounting inflation, high rate of
population growth and unemployment are forcing the children and women into the job
market. Most of the workforce is not prepared to cope with the hazards posed by the modern
technologies and processes. The legislation concerning occupational safety and health needs
updating. The country lacks the basic infrastructure and qualified personnel for providing
occupational safety and health services to the workforce.
The basic idea of this report has been taken from People and Work, Research Reports 44,
Work and Health Country Profiles, Finnish Institute of Occupational Health, Helsinki,
Finland 2001 [1]. The second chapter gives basic information about Pakistan in terms of area,
economy and labour force etc. Health care systems and legislation and coverage of OH&S are
discussed in the next chapter. Chapter 4 deals with human resources in OH&S. Indicators of
occupational safety and health outcomes are discussed in chapter 5. Chapter 6 concerns about
the consumption of chemicals in Pakistan. A study regarding country profile on occupational
safety and health was undertaken in the province of Punjab, Pakistan in 2001. In this regard a
survey in 50 medium sized industries was carried out. Four different types of industries were
selected in the survey, namely:
1. Paint Manufacturing Industries.
2. Shoes Manufacturing Industries.
Page 5
- 5 -
3. Surgical Instruments Manufacturing Industries.
4. Furniture Industries.
Chapter 7 deals with this survey in 50 industries in the province of Punjab, Pakistan. In
chapter 8 some recommendations are suggested which if adopted may reduce the mounting
toll of accidents and occupational diseases in Pakistan.
Although this study was carried out in Punjab province, but a similar kind of industries/
processes and conditions prevail throughout Pakistan.
2 Basic Information on Pakistan
2.1 Area and Population
The Islamic Republic of Pakistan emerged as an independent state on 14 August 1947. It
comprises four provinces: Punjab, Sindh, Northwest Frontier and Baluchistan, besides the
Federally Administered Tribal Areas. Islamabad is the federal capital. Over 97 % of the
population are Muslims. Pakistan's current population is 140.5 millions (population density
164 per Km2), almost 2.3 % of the world's population, making it the 7th most populous
country in the world. [2] Each year, another 3.2 million people are added to this number. If
this rate continues, Pakistan's population would reach 222 million by the year 2020. Such a
high growth rate coupled with the country's weak socio-economic profile would render all
efforts towards development futile. It would also contribute significantly to raising the
proportion of the population below the poverty line. Although Family Planning Programmes
have been pursued in the country but frequent changes in strategies and inconsistent political
support have acted as a hindrance in their successful implementation. The urban/rural
population break-up reveals that one in three persons live in urban areas as the share of rural
population has declined by 4.2 %, from 71.7 percent in 1981 to 67.5 percent in 1998. The
share of the urban population has accordingly increased from 28.3 percent in 1981 to 32.5
percent in 1998. Urdu is the national language of Pakistan and official language is English.
Pakistan covers an area of 796,095 sq. km. lying between latitude 24 degree and 37 degree
North and longitude 62 degree and 75 degree East. The country borders Iran on the West,
while India in the East, Afghanistan in the North and Northwest and the Peoples Republic of
China in the Northwest to Northeast.
Table 1. Population statistics of Pakistan in 1998 [2,3,4]
Population (million) 130.57
Men (%) 51.9
Women (%) 48.1
Labour force (million) 38.63
Employed (million) 36.36
Men (%) NA
Women (%) NA
Unemployed (million) 2.28
Live births per 1000 population* 33.8
Deaths per 1000 population* 8.9
NA-Data not available
Page 6
- 6 -
2.2 Economy
The persistence of large fiscal and current account deficits and the associated build up of
public and external debit have been the major source of macroeconomic imbalances in
Pakistan during the 1990s. Failures in enhancing revenues consistent with growing
expenditure requirements on the one hand, and the stagnation in exports and decline in other
foreign exchange inflows, far short of foreign exchange payment requirements on the other,
have exacerbated macroeconomic imbalances over time. These imbalances vitiated a stable
macroeconomic environment. Growth was impeded and poverty increased in Pakistan in the
1990s. Such imbalances cannot be sustained indefinitely, and the longer they persist, the
greater the subsequent adjustment needed. Furthermore they usually manifest themselves in
high inflation and periodic balance of payments crises. The Government of Pakistan is of the
view that if these are left uncorrected, the worsening macroeconomic imbalances would lead
to higher accumulation of debt, a loss of national sovereignty, an uncertain environment for
investment and jeopardising the prospects for sustaining high growth [4]. The Government
believes that Pakistan's economic problems are structural in nature and the objectives of
sustaining high growth, low inflation, and external payments viability cannot be achieved
without removing structural bottlenecks. It is with this in view that a series of structural
reform measures were initiated during the current fiscal year such as tax reforms, trade and
tariff reforms, deregulation and privatisation, financial sector reforms, improving governance,
fiscal transparency and poverty alleviation programme. Like the stabilization effort, this has
been recognized as the appropriate policy to take Pakistan towards higher levels of sustainable
growth in medium term.
Table 2. Selected economic indicators of Pakistan [2]
Gross national product (GNP) per capita (in US $) $ 460
Gross domestic product (GDP) per capita
(purchasing power parity in US $) (2000 estimated)
$ 2000
GDP produced by agriculture, fishing, forestry,
livestock's (1999-2000) %
25.9 %
GDP produced by industry (1999-2000) % 25 %
GDP produced by services (1999-2000) % 49.1 %
The major export commodities of Pakistan are cotton, synthetic textiles, fish, leather, rice,
wool and carpets and sports goods. These categories of exports, on average, accounted for
around 88 % of the total exports in the decade of 1990's. Among these categories, cotton
group alone contributed on average 60.3 % to total exports in this period, followed by leather
(7.9 %), synthetic textiles (6.5 %) and rice (5.7 %). These four items together accounted for
80.4 % of total export earnings. Furthermore almost all the export earnings of cotton group
have originated from textile and clothing. Such a high degree of concentration of exports in
few items is a major source of instability in export earnings. A poor cotton crop can seriously
affect total export proceeds, as it has been observed several times during the decade.
In 1999-2000 Pakistan imported mainly machinery excluding transport equipment (13.9 %),
petroleum and products (27.2 %), chemicals excluding fertilisers (17.5 %), edible oils (4 %)
and transport equipment (5.5 %).
Page 7
- 7 -
0
5
10
15
20
25
30
35
40
45
1995 1996 1997 1998 1999 2000 2001
T otal E m p L .F R ural U rban
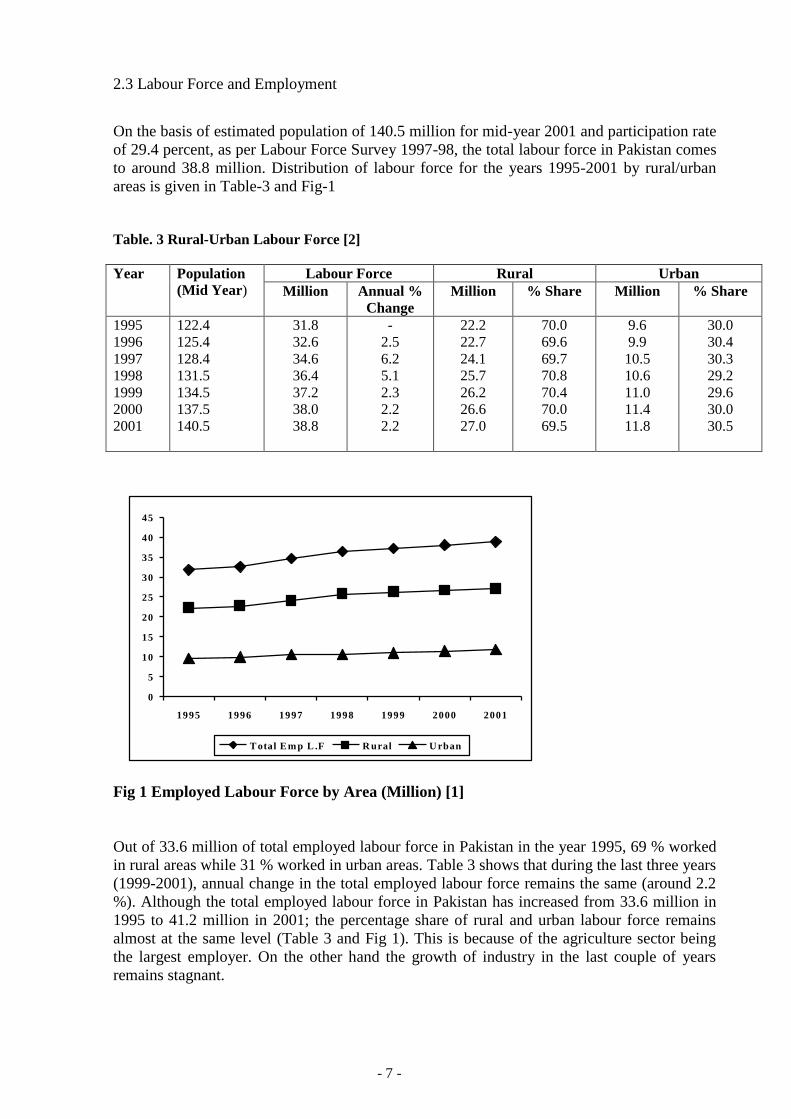
2.3 Labour Force and Employment
On the basis of estimated population of 140.5 million for mid-year 2001 and participation rate
of 29.4 percent, as per Labour Force Survey 1997-98, the total labour force in Pakistan comes
to around 38.8 million. Distribution of labour force for the years 1995-2001 by rural/urban
areas is given in Table-3 and Fig-1
Table. 3 Rural-Urban Labour Force [2]
Year Population
(Mid Year) Labour Force Rural Urban
Million Annual %
Change
Million % Share Million % Share
1995
1996
1997
1998
1999
2000
2001
122.4
125.4
128.4
131.5
134.5
137.5
140.5
31.8
32.6
34.6
36.4
37.2
38.0
38.8
-
2.5
6.2
5.1
2.3
2.2
2.2
22.2
22.7
24.1
25.7
26.2
26.6
27.0
70.0
69.6
69.7
70.8
70.4
70.0
69.5
9.6
9.9
10.5
10.6
11.0
11.4
11.8
30.0
30.4
30.3
29.2
29.6
30.0
30.5
Fig 1 Employed Labour Force by Area (Million) [1]
Out of 33.6 million of total employed labour force in Pakistan in the year 1995, 69 % worked
in rural areas while 31 % worked in urban areas. Table 3 shows that during the last three years
(1999-2001), annual change in the total employed labour force remains the same (around 2.2
%). Although the total employed labour force in Pakistan has increased from 33.6 million in
1995 to 41.2 million in 2001; the percentage share of rural and urban labour force remains
almost at the same level (Table 3 and Fig 1). This is because of the agriculture sector being
the largest employer. On the other hand the growth of industry in the last couple of years
remains stagnant.
Page 8
- 8 -
2.4 Labour Force Participation Rate
In Pakistan Labour force participation is estimated on the basis of Crude Activity Rate (CAR)
and Refined Activity Rate (RAR). The CAR is the percentage of labour force in total
population and the RAR is the percentage of labour force in population of persons 10 years of
age and above. According to the Labour Force Survey 1997-98, the overall labour force
participation rate (CAR) was 29.4 percent (30.6 percent in rural areas and 27.0 percent in
urban areas), while the CAR was 27.5 percent in 1994-95. It increased to 28.7 percent in
1996-97 and to 29.4 percent in 1997-98. Similarly RAR was 41.2 percent in 1994-94 but
increased to 43.0 percent in 1996-97, and to 43.3 percent in 1997-98.
Labour force participation rate differs between rural and urban areas. In rural areas, the
participation rate is higher as agriculture is more of a family occupation than mere work.
Women's participation rate is lower than men's due to cultural taboos and non-availability of
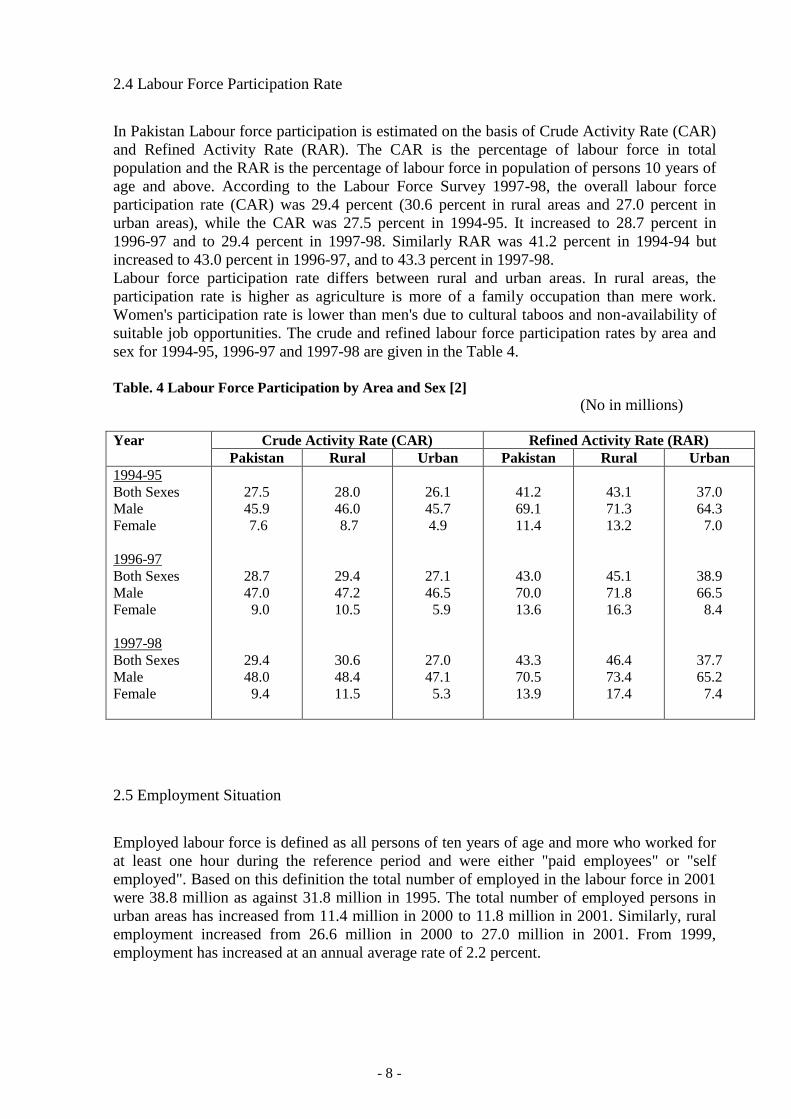
suitable job opportunities. The crude and refined labour force participation rates by area and
sex for 1994-95, 1996-97 and 1997-98 are given in the Table 4.
Table. 4 Labour Force Participation by Area and Sex [2]
(No in millions)
Year Crude Activity Rate (CAR) Refined Activity Rate (RAR)
Pakistan Rural Urban Pakistan Rural Urban
1994-95
Both Sexes
Male
Female
1996-97
Both Sexes
Male
Female
1997-98
Both Sexes
Male
Female
27.5
45.9
7.6
28.7
47.0
9.0
29.4
48.0
9.4
28.0
46.0
8.7
29.4
47.2
10.5
30.6
48.4
11.5
26.1
45.7
4.9
27.1
46.5
5.9
27.0
47.1
5.3
41.2
69.1
11.4
43.0
70.0
13.6
43.3
70.5
13.9
43.1
71.3
13.2
45.1
71.8
16.3
46.4
73.4
17.4
37.0
64.3
7.0
38.9
66.5
8.4
37.7
65.2
7.4
2.5 Employment Situation
Employed labour force is defined as all persons of ten years of age and more who worked for
at least one hour during the reference period and were either "paid employees" or "self
employed". Based on this definition the total number of employed in the labour force in 2001
were 38.8 million as against 31.8 million in 1995. The total number of employed persons in
urban areas has increased from 11.4 million in 2000 to 11.8 million in 2001. Similarly, rural
employment increased from 26.6 million in 2000 to 27.0 million in 2001. From 1999,
employment has increased at an annual average rate of 2.2 percent.
Page 9
- 9 -
The number of employed labour force is quite low due to the following reasons:
1. The number of workers indicates only that ratio wherein 10 or more workers are
employed in a factory registered under the Factories Act 1934.
2. This number does not include the number of workers employed in the industrial
concerns having less than 10 workers including petrol pumps, restaurants, small scale
workshops, auto workshops and informal sector.
3. Pakistan is an agro-based economy and a great number of agriculture workers are
related to this sector. For example over 47 % share of the workforce has been taken by
the agriculture sector, which is not in the purview of Labour and Human Resources
department (Table 5).
4. Self employed workers are not covered.
5. There is no proper reporting system in the country.
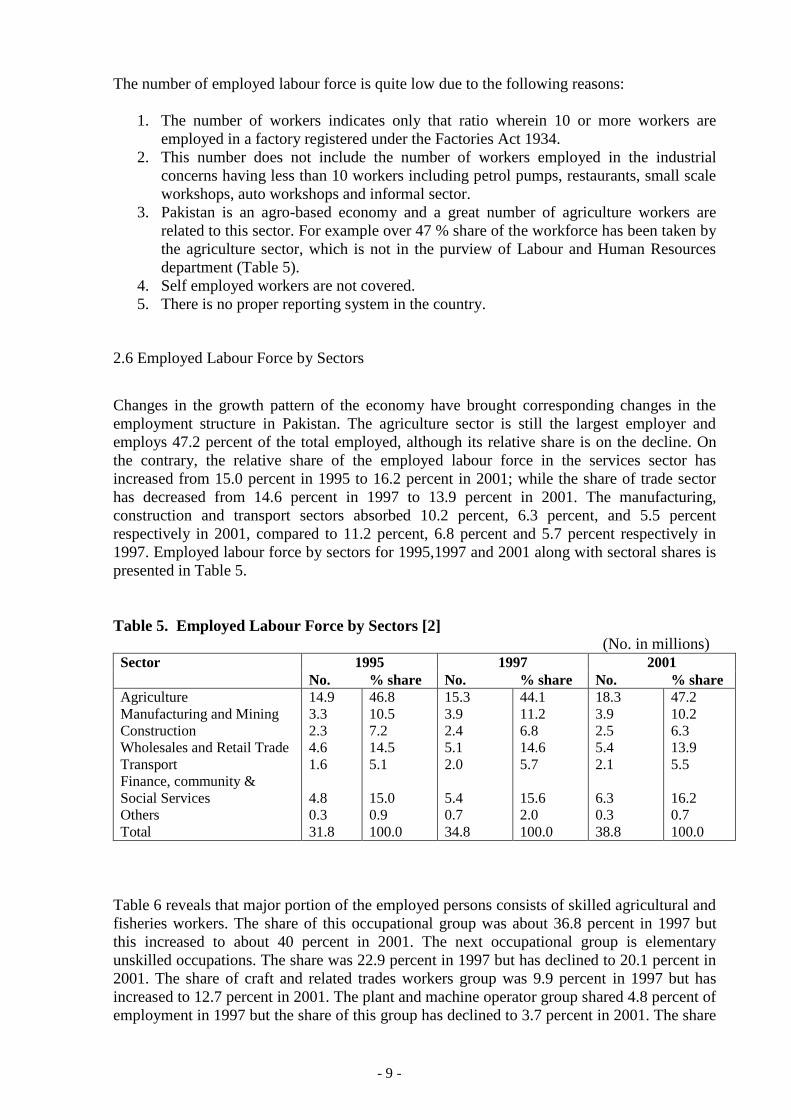
2.6 Employed Labour Force by Sectors
Changes in the growth pattern of the economy have brought corresponding changes in the
employment structure in Pakistan. The agriculture sector is still the largest employer and
employs 47.2 percent of the total employed, although its relative share is on the decline. On
the contrary, the relative share of the employed labour force in the services sector has
increased from 15.0 percent in 1995 to 16.2 percent in 2001; while the share of trade sector
has decreased from 14.6 percent in 1997 to 13.9 percent in 2001. The manufacturing,
construction and transport sectors absorbed 10.2 percent, 6.3 percent, and 5.5 percent
respectively in 2001, compared to 11.2 percent, 6.8 percent and 5.7 percent respectively in
1997. Employed labour force by sectors for 1995,1997 and 2001 along with sectoral shares is
presented in Table 5.
Table 5. Employed Labour Force by Sectors [2]
(No. in millions)
Sector 1995 1997 2001
No. % share No. % share No. % share
Agriculture
Manufacturing and Mining
Construction
Wholesales and Retail Trade
Transport
Finance, community &
Social Services
Others
Total
14.9
3.3
2.3
4.6
1.6
4.8
0.3
31.8
46.8
10.5
7.2
14.5
5.1
15.0
0.9
100.0
15.3
3.9
2.4
5.1
2.0
5.4
0.7
34.8
44.1
11.2
6.8
14.6
5.7
15.6
2.0
100.0
18.3
3.9
2.5
5.4
2.1
6.3
0.3
38.8
47.2
10.2
6.3
13.9
5.5
16.2
0.7
100.0
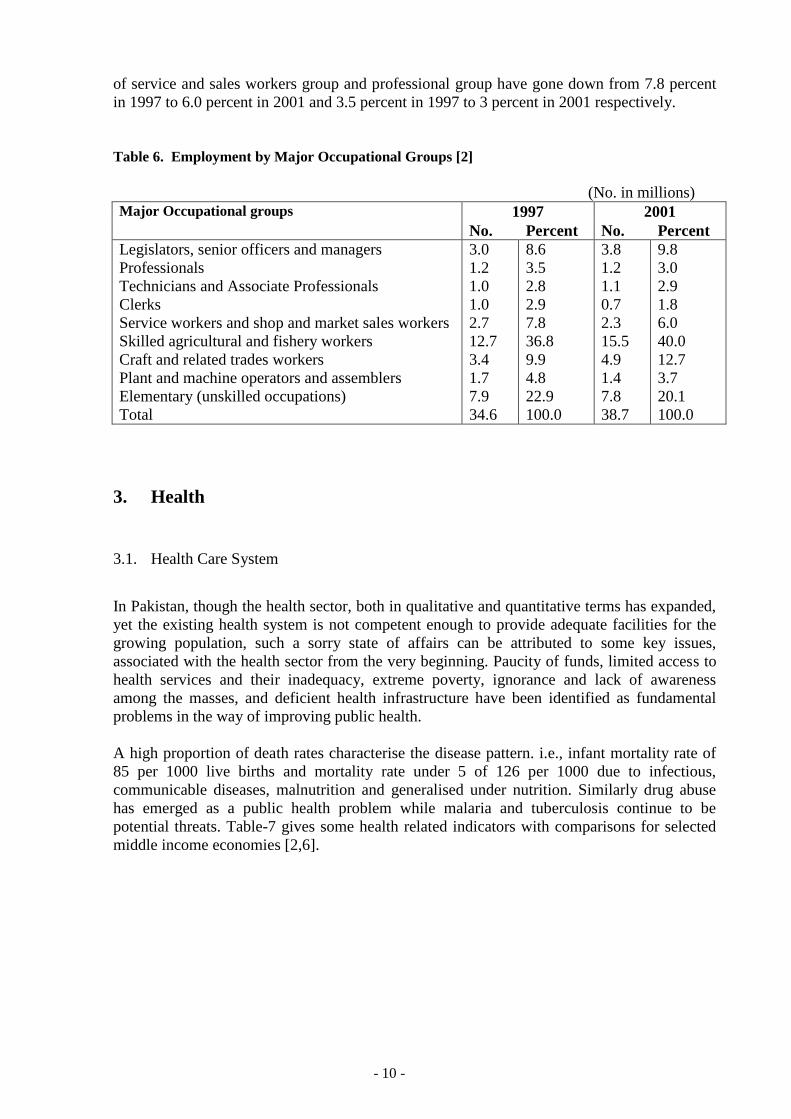
Table 6 reveals that major portion of the employed persons consists of skilled agricultural and
fisheries workers. The share of this occupational group was about 36.8 percent in 1997 but
this increased to about 40 percent in 2001. The next occupational group is elementary
unskilled occupations. The share was 22.9 percent in 1997 but has declined to 20.1 percent in
2001. The share of craft and related trades workers group was 9.9 percent in 1997 but has
increased to 12.7 percent in 2001. The plant and machine operator group shared 4.8 percent of
employment in 1997 but the share of this group has declined to 3.7 percent in 2001. The share
Page 10
- 10 -
of service and sales workers group and professional group have gone down from 7.8 percent
in 1997 to 6.0 percent in 2001 and 3.5 percent in 1997 to 3 percent in 2001 respectively.
Table 6. Employment by Major Occupational Groups [2]
(No. in millions)
Major Occupational groups 1997 2001
No. Percent No. Percent
Legislators, senior officers and managers
Professionals
Technicians and Associate Professionals
Clerks
Service workers and shop and market sales workers
Skilled agricultural and fishery workers
Craft and related trades workers
Plant and machine operators and assemblers
Elementary (unskilled occupations)
Total
3.0
1.2
1.0
1.0
2.7
12.7
3.4
1.7
7.9
34.6
8.6
3.5
2.8
2.9
7.8
36.8
9.9
4.8
22.9
100.0
3.8
1.2
1.1
0.7
2.3
15.5
4.9
1.4
7.8
38.7
9.8
3.0
2.9
1.8
6.0
40.0
12.7
3.7
20.1
100.0
3. Health
3.1. Health Care System
In Pakistan, though the health sector, both in qualitative and quantitative terms has expanded,
yet the existing health system is not competent enough to provide adequate facilities for the
growing population, such a sorry state of affairs can be attributed to some key issues,
associated with the health sector from the very beginning. Paucity of funds, limited access to
health services and their inadequacy, extreme poverty, ignorance and lack of awareness
among the masses, and deficient health infrastructure have been identified as fundamental
problems in the way of improving public health.
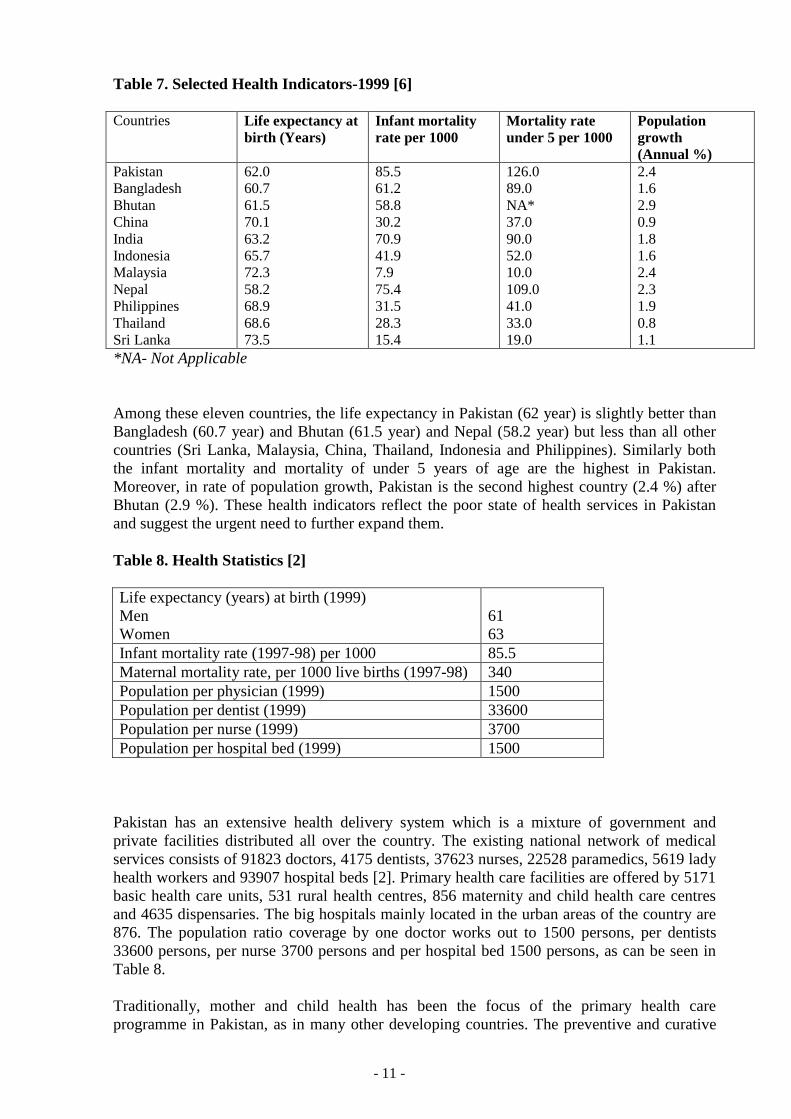
A high proportion of death rates characterise the disease pattern. i.e., infant mortality rate of
85 per 1000 live births and mortality rate under 5 of 126 per 1000 due to infectious,
communicable diseases, malnutrition and generalised under nutrition. Similarly drug abuse
has emerged as a public health problem while malaria and tuberculosis continue to be
potential threats. Table-7 gives some health related indicators with comparisons for selected
middle income economies [2,6].
Page 11
- 11 -
Table 7. Selected Health Indicators-1999 [6]
Countries Life expectancy at
birth (Years)
Infant mortality
rate per 1000
Mortality rate
under 5 per 1000
Population
growth
(Annual %)
Pakistan
Bangladesh
Bhutan
China
India
Indonesia
Malaysia
Nepal
Philippines
Thailand
Sri Lanka
62.0
60.7
61.5
70.1
63.2
65.7
72.3
58.2
68.9
68.6
73.5
85.5
61.2
58.8
30.2
70.9
41.9
7.9
75.4
31.5
28.3
15.4
126.0
89.0
NA*
37.0
90.0
52.0
10.0
109.0
41.0
33.0
19.0
2.4
1.6
2.9
0.9
1.8
1.6
2.4
2.3
1.9
0.8
1.1
*NA- Not Applicable
Among these eleven countries, the life expectancy in Pakistan (62 year) is slightly better than
Bangladesh (60.7 year) and Bhutan (61.5 year) and Nepal (58.2 year) but less than all other
countries (Sri Lanka, Malaysia, China, Thailand, Indonesia and Philippines). Similarly both
the infant mortality and mortality of under 5 years of age are the highest in Pakistan.
Moreover, in rate of population growth, Pakistan is the second highest country (2.4 %) after
Bhutan (2.9 %). These health indicators reflect the poor state of health services in Pakistan
and suggest the urgent need to further expand them.
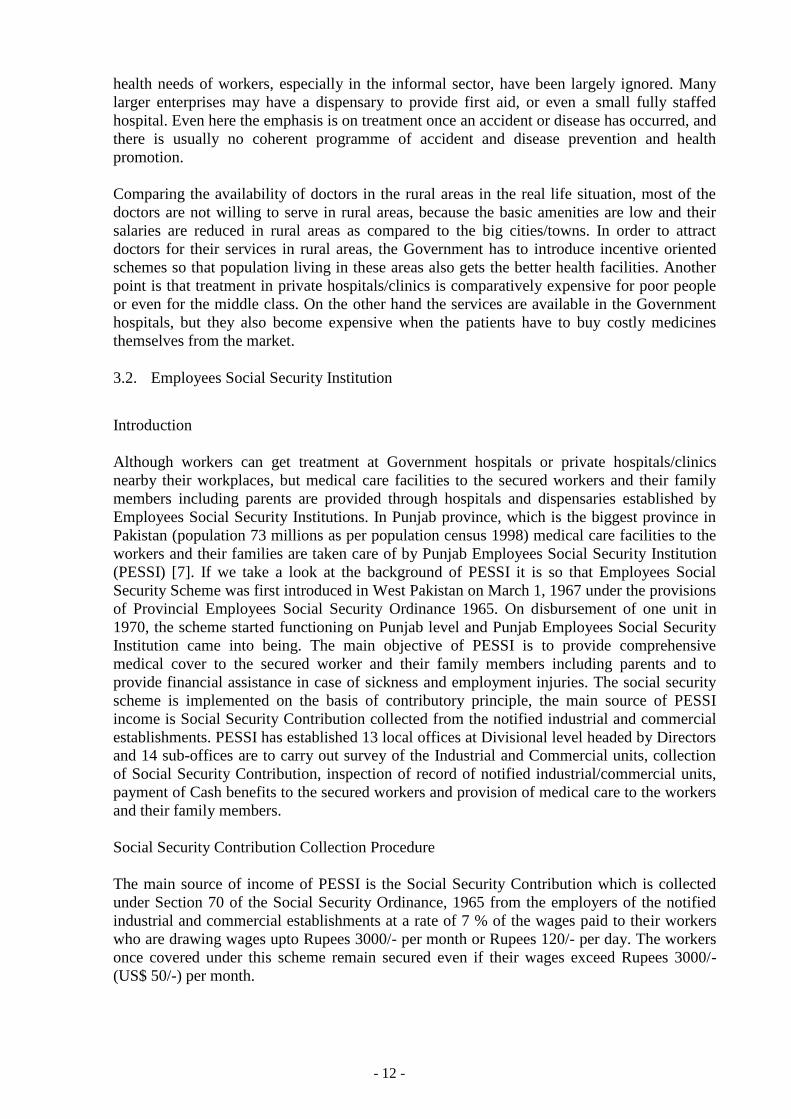
Table 8. Health Statistics [2]
Life expectancy (years) at birth (1999)
Men
Women
61
63
Infant mortality rate (1997-98) per 1000 85.5
Maternal mortality rate, per 1000 live births (1997-98) 340
Population per physician (1999) 1500
Population per dentist (1999) 33600
Population per nurse (1999) 3700
Population per hospital bed (1999) 1500
Pakistan has an extensive health delivery system which is a mixture of government and
private facilities distributed all over the country. The existing national network of medical
services consists of 91823 doctors, 4175 dentists, 37623 nurses, 22528 paramedics, 5619 lady
health workers and 93907 hospital beds [2]. Primary health care facilities are offered by 5171
basic health care units, 531 rural health centres, 856 maternity and child health care centres
and 4635 dispensaries. The big hospitals mainly located in the urban areas of the country are
876. The population ratio coverage by one doctor works out to 1500 persons, per dentists
33600 persons, per nurse 3700 persons and per hospital bed 1500 persons, as can be seen in
Table 8.
Traditionally, mother and child health has been the focus of the primary health care
programme in Pakistan, as in many other developing countries. The preventive and curative
Page 12
- 12 -
health needs of workers, especially in the informal sector, have been largely ignored. Many
larger enterprises may have a dispensary to provide first aid, or even a small fully staffed
hospital. Even here the emphasis is on treatment once an accident or disease has occurred, and
there is usually no coherent programme of accident and disease prevention and health
promotion.
Comparing the availability of doctors in the rural areas in the real life situation, most of the
doctors are not willing to serve in rural areas, because the basic amenities are low and their
salaries are reduced in rural areas as compared to the big cities/towns. In order to attract
doctors for their services in rural areas, the Government has to introduce incentive oriented
schemes so that population living in these areas also gets the better health facilities. Another
point is that treatment in private hospitals/clinics is comparatively expensive for poor people
or even for the middle class. On the other hand the services are available in the Government
hospitals, but they also become expensive when the patients have to buy costly medicines
themselves from the market.
3.2. Employees Social Security Institution
Introduction
Although workers can get treatment at Government hospitals or private hospitals/clinics
nearby their workplaces, but medical care facilities to the secured workers and their family
members including parents are provided through hospitals and dispensaries established by
Employees Social Security Institutions. In Punjab province, which is the biggest province in
Pakistan (population 73 millions as per population census 1998) medical care facilities to the
workers and their families are taken care of by Punjab Employees Social Security Institution
(PESSI) [7]. If we take a look at the background of PESSI it is so that Employees Social
Security Scheme was first introduced in West Pakistan on March 1, 1967 under the provisions
of Provincial Employees Social Security Ordinance 1965. On disbursement of one unit in
1970, the scheme started functioning on Punjab level and Punjab Employees Social Security
Institution came into being. The main objective of PESSI is to provide comprehensive
medical cover to the secured worker and their family members including parents and to
provide financial assistance in case of sickness and employment injuries. The social security
scheme is implemented on the basis of contributory principle, the main source of PESSI
income is Social Security Contribution collected from the notified industrial and commercial
establishments. PESSI has established 13 local offices at Divisional level headed by Directors
and 14 sub-offices are to carry out survey of the Industrial and Commercial units, collection
of Social Security Contribution, inspection of record of notified industrial/commercial units,
payment of Cash benefits to the secured workers and provision of medical care to the workers
and their family members.
Social Security Contribution Collection Procedure
The main source of income of PESSI is the Social Security Contribution which is collected
under Section 70 of the Social Security Ordinance, 1965 from the employers of the notified
industrial and commercial establishments at a rate of 7 % of the wages paid to their workers
who are drawing wages upto Rupees 3000/- per month or Rupees 120/- per day. The workers
once covered under this scheme remain secured even if their wages exceed Rupees 3000/-
(US$ 50/-) per month.
Page 13
- 13 -
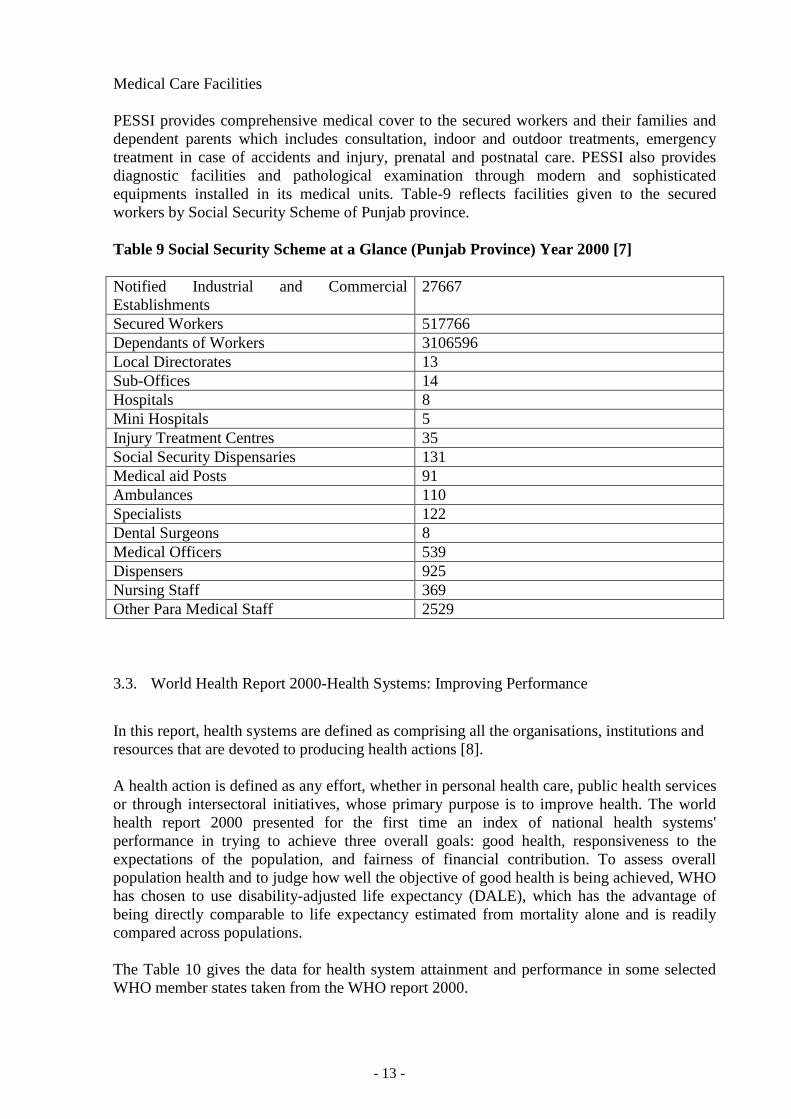
Medical Care Facilities
PESSI provides comprehensive medical cover to the secured workers and their families and
dependent parents which includes consultation, indoor and outdoor treatments, emergency
treatment in case of accidents and injury, prenatal and postnatal care. PESSI also provides
diagnostic facilities and pathological examination through modern and sophisticated
equipments installed in its medical units. Table-9 reflects facilities given to the secured
workers by Social Security Scheme of Punjab province.
Table 9 Social Security Scheme at a Glance (Punjab Province) Year 2000 [7]
Notified Industrial and Commercial
Establishments
27667
Secured Workers 517766
Dependants of Workers 3106596
Local Directorates 13
Sub-Offices 14
Hospitals 8
Mini Hospitals 5
Injury Treatment Centres 35
Social Security Dispensaries 131
Medical aid Posts 91
Ambulances 110
Specialists 122
Dental Surgeons 8
Medical Officers 539
Dispensers 925
Nursing Staff 369
Other Para Medical Staff 2529
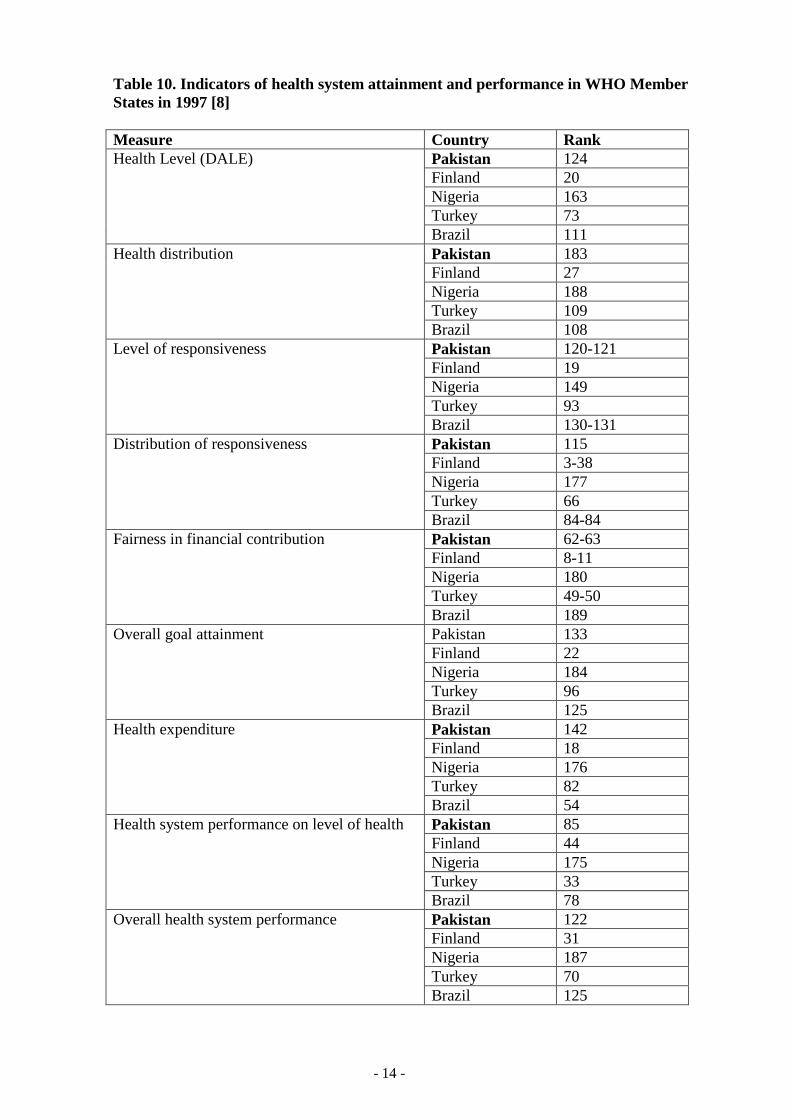
3.3. World Health Report 2000-Health Systems: Improving Performance
In this report, health systems are defined as comprising all the organisations, institutions and
resources that are devoted to producing health actions [8].
A health action is defined as any effort, whether in personal health care, public health services
or through intersectoral initiatives, whose primary purpose is to improve health. The world
health report 2000 presented for the first time an index of national health systems'
performance in trying to achieve three overall goals: good health, responsiveness to the
expectations of the population, and fairness of financial contribution. To assess overall
population health and to judge how well the objective of good health is being achieved, WHO
has chosen to use disability-adjusted life expectancy (DALE), which has the advantage of
being directly comparable to life expectancy estimated from mortality alone and is readily
compared across populations.
The Table 10 gives the data for health system attainment and performance in some selected
WHO member states taken from the WHO report 2000.
Page 14
- 14 -
Table 10. Indicators of health system attainment and performance in WHO Member
States in 1997 [8]
Measure Country Rank
Health Level (DALE)
Pakistan 124
Finland 20
Nigeria 163
Turkey 73
Brazil 111
Health distribution Pakistan 183
Finland 27
Nigeria 188
Turkey 109
Brazil 108
Level of responsiveness Pakistan 120-121
Finland 19
Nigeria 149
Turkey 93
Brazil 130-131
Distribution of responsiveness Pakistan 115
Finland 3-38
Nigeria 177
Turkey 66
Brazil 84-84
Fairness in financial contribution Pakistan 62-63
Finland 8-11
Nigeria 180
Turkey 49-50
Brazil 189
Overall goal attainment Pakistan 133
Finland 22
Nigeria 184
Turkey 96
Brazil 125
Health expenditure Pakistan 142
Finland 18
Nigeria 176
Turkey 82
Brazil 54
Health system performance on level of health Pakistan 85
Finland 44
Nigeria 175
Turkey 33
Brazil 78
Overall health system performance Pakistan 122
Finland 31
Nigeria 187
Turkey 70
Brazil 125
Page 15
- 15 -
3.4 Legislation and coverage of OH&S
In Pakistan, the occupational health and safety in different sectors is covered in various laws.
There is no single comprehensive law covering occupational health and safety. The following
pieces of legislation deal with different aspects of occupational safety and health in the whole
country[9,10].
Factories Act 1934
Punjab Factories Rules 1978
Sindh Factories Rules 1975
North-West Frontier Province Factories Rules 1975
West Pakistan Hazardous Occupations Rules 1963
Mines Act 1923
Provincial Employees Social Security (Occupational Diseases) Regulation 1967
Workmen Compensation Act 1923 and Rules 1961
Dock Labourers act 1934
Factories Act 1934:
This act consolidates and amends the laws relating to the regulation of labour in factories in
the country. It includes preliminary including definitions, role of labour inspection,
restrictions on the working hours, holidays with pay, special provisions for adolescents and
children, penalties and procedure. This act also contains a chapter (Chapter III) on health and
safety of workers and hygiene conditions at the workplaces. Chapter III of this act provide
factory inspections, hygienic conditions (ventilation and temperature, dust and fumes,
artificial humidification, lighting, overcrowding, drinking water, sanitary facilities),
precaution in case of fire, machine guarding, pressure vessels, precautions against dangerous
fumes, eye protection, safety of building, machinery and manufacturing process and so on
(10).
Provincial Factories Rules (Punjab Factories Rules 1978, Sindh Factories Rules 1975, North-
West Frontier Province Factories Rules 1975):
Three provinces of Pakistan Punjab, Sindh and North-West Frontier Province under the
authority of "The Factories Act 1934" of Pakistan made their rules and regulation to govern
labour legislation which are almost similar to each other. They provide detailed rules for
factory inspections, certifying surgeons, hygienic conditions (ventilation, temperature, dust
and fumes, artificial humidification, overcrowding, lighting, drinking water, sanitary
facilities), role of the welfare officer, precautions against fires, machine guarding, pressure
vessels, eye protection, dangerous fumes, working hours, notification and investigation of
Page 16
- 16 -
accidents, and pay holidays and so on. In the end samples of official forms, contents of first
aid boxes and report form for occupational diseases are attached as annexes).
West Pakistan Hazardous Occupations Rules 1963:
These rules issued under the authority of Factories Act 1934 prescribe medical certification
and examination by certifying surgeons, prevention activities (exhausts, washing facilities,
protective clothing), prohibition of employment (women, young persons) and the issuing of
certificates of fitness in the case of dangerous jobs involving exposure to certain substances
(lead, rubber, chromium, sodium, and potassium dichromate) and certain other dangerous
operations (manufacturing of aerated waters spraying of cellulose solutions, sand blasting,
generation of petroleum gas). One of the regulations the "West Pakistan Hazardous
Occupations (Miscellaneous) Rules 1963 specifies a large number of processes
(manufacturing, and/or utilisation of a large number of harmful or explosive substances) as
hazardous under the meaning of the rules. It permits the Chief Inspector of Factories to
declare other processes hazardous as well (12).
Mines Act 1923:
This act concerns the laws relating to the regulation and inspection of mines. Its contents
include role of the chief inspector of mines and of inspectors, operation and management of
mines, provision as to health and safety (powers of inspectors in the case of dangers arising to
mine workers, accident reports, notice of occupational accidents, accident investigation)
working hours, employment of women (prohibited in underground work) and children
(absolutely prohibited to work in mines) and so on.
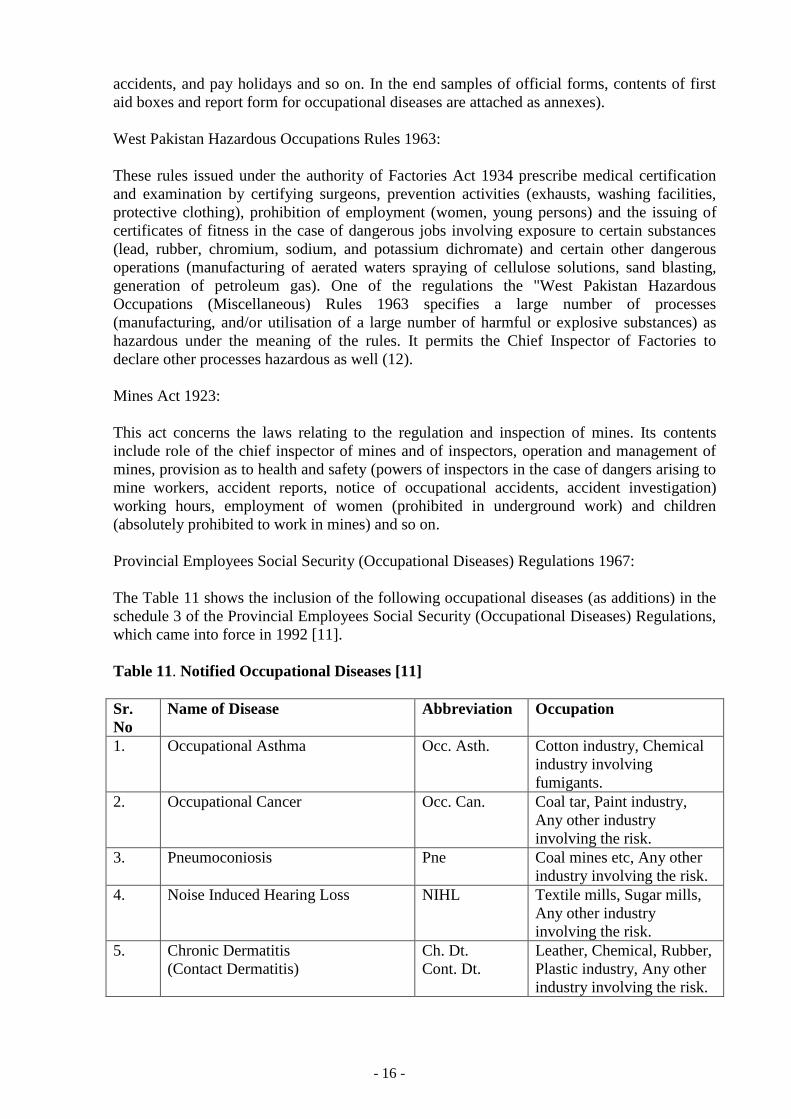
Provincial Employees Social Security (Occupational Diseases) Regulations 1967:
The Table 11 shows the inclusion of the following occupational diseases (as additions) in the
schedule 3 of the Provincial Employees Social Security (Occupational Diseases) Regulations,
which came into force in 1992 [11].
Table 11. Notified Occupational Diseases [11]
Sr.
No
Name of Disease Abbreviation Occupation
1. Occupational Asthma Occ. Asth. Cotton industry, Chemical
industry involving
fumigants.
2. Occupational Cancer Occ. Can. Coal tar, Paint industry,
Any other industry
involving the risk.
3. Pneumoconiosis Pne Coal mines etc, Any other
industry involving the risk.
4. Noise Induced Hearing Loss NIHL Textile mills, Sugar mills,
Any other industry
involving the risk.
5. Chronic Dermatitis
(Contact Dermatitis)
Ch. Dt.
Cont. Dt.
Leather, Chemical, Rubber,
Plastic industry, Any other
industry involving the risk.
Page 17
- 17 -
Dock Labourers act 1934:
The Directorate of Dock Workers Safety is responsible for ensuring the safety and health of
dock workers employed at Karachi, Gwadar and Pasni seaports, through the practical
enforcement of relevant provisions of the Dock Labourer's act.
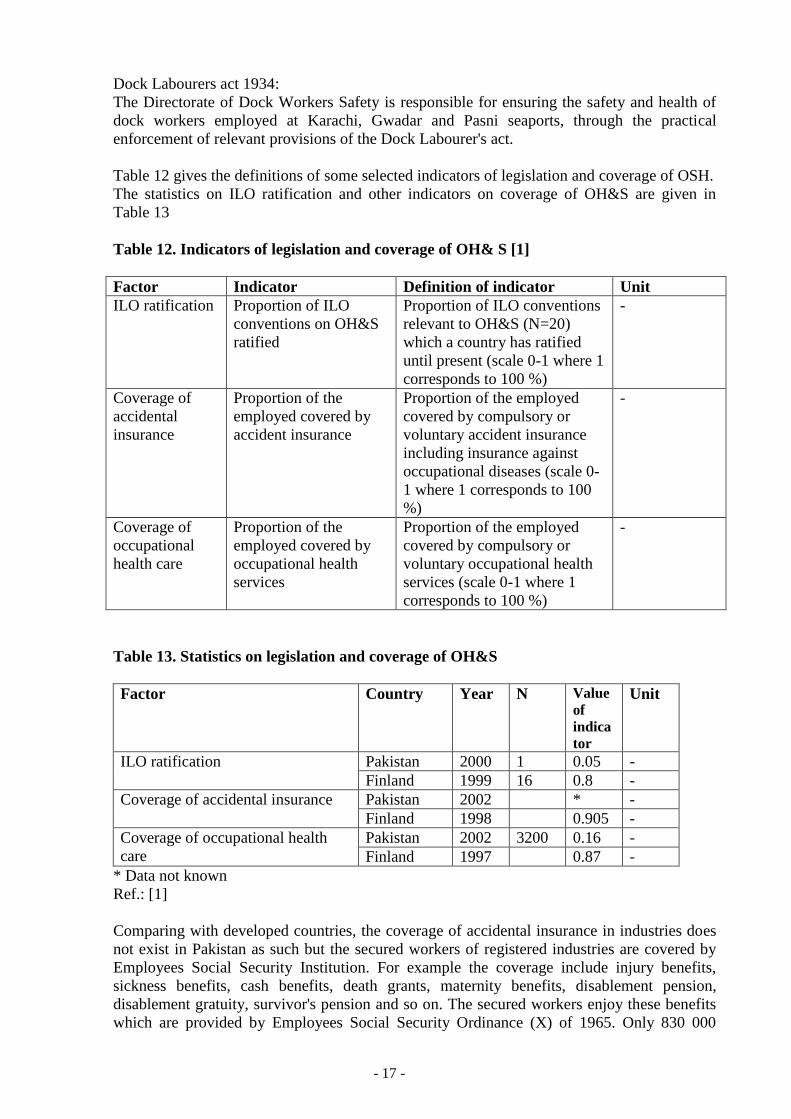
Table 12 gives the definitions of some selected indicators of legislation and coverage of OSH.
The statistics on ILO ratification and other indicators on coverage of OH&S are given in
Table 13
Table 12. Indicators of legislation and coverage of OH& S [1]
Factor Indicator Definition of indicator Unit
ILO ratification Proportion of ILO
conventions on OH&S
ratified
Proportion of ILO conventions
relevant to OH&S (N=20)
which a country has ratified
until present (scale 0-1 where 1
corresponds to 100 %)
-
Coverage of
accidental
insurance
Proportion of the
employed covered by
accident insurance
Proportion of the employed
covered by compulsory or
voluntary accident insurance
including insurance against
occupational diseases (scale 0-
1 where 1 corresponds to 100
%)
-
Coverage of
occupational
health care
Proportion of the
employed covered by
occupational health
services
Proportion of the employed
covered by compulsory or
voluntary occupational health
services (scale 0-1 where 1
corresponds to 100 %)
-
Table 13. Statistics on legislation and coverage of OH&S
Factor Country Year N Value
of
indica
tor
Unit
ILO ratification Pakistan 2000 1 0.05 -
Finland 1999 16 0.8 -
Coverage of accidental insurance Pakistan 2002 * -
Finland 1998 0.905 -
Coverage of occupational health
care
Pakistan 2002 3200 0.16 -
Finland 1997 0.87 -
* Data not known
Ref.: [1]
Comparing with developed countries, the coverage of accidental insurance in industries does
not exist in Pakistan as such but the secured workers of registered industries are covered by
Employees Social Security Institution. For example the coverage include injury benefits,
sickness benefits, cash benefits, death grants, maternity benefits, disablement pension,
disablement gratuity, survivor's pension and so on. The secured workers enjoy these benefits
which are provided by Employees Social Security Ordinance (X) of 1965. Only 830 000
Page 18
- 18 -
workers are secured in Pakistan under Social Security Institution Ordinance out of 20 million
employed labour force. Agriculture labour force (18.3 million) is excluded from this figure, as
agriculture sector is not in the purview of Labour and Human Resources department. Table 13
shows that occupational health care in Pakistan is quite poor as compared with Finland.
Similarly ratification figure of ILO conventions on 20 important conventions related to
OH&S is quite low as Pakistan has ratified only one convention in comparison to Finland's 16
out of 20.
4 Human Resources in OH&S
Ministry of Labour and Human Resources and Overseas Pakistanis, Government of Pakistan,
controls the occupational safety and health activities. In provinces, these activities are
controlled by provincial Labour and Human Resources departments. In Punjab province,
which is the largest province in the country in terms of population and workforce, Labour and
Human Resources department is essentially concerned with the promotion of healthy labour
management relations for greater socio-economic progress. With this objective, the
department not only protects the rights of workers but lays equal stress on their commitment
to work [12].
Considering the importance of workers health and welfare, the Punjab Employees Social
Security Institution (PESSI), established under the Labour and Human Resource Department,
provides medical aid and various cash and other benefits in case of sickness, injury, death etc.,
to secured workers. The major functions of PESSI have been explained in Chapter 2. In the
mining sector, the department is responsible for inspecting mines and ensuring scientific
development of mines and safety of workers. It also undertakes other welfare measures for the
miners and their families including housing, education and so on.
The department is also assigned the functions of establishing housing estates and development
of plots for industrial workers and undertaking other measures for their welfare. Besides this,
it also implements schemes for the education of workers' children. Other major functions of
the department include education of child labour, and ensuring the rights of workers in
accordance with national and international standards.
Page 19
- 19 -
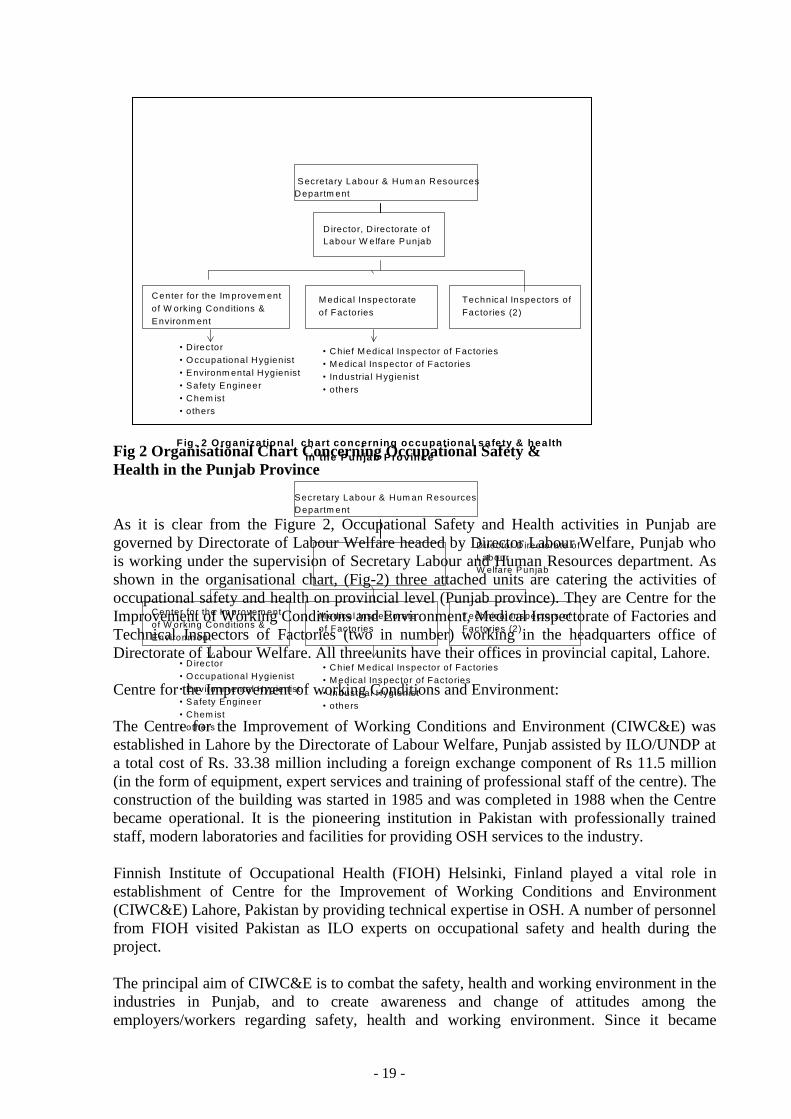
Fig 2 Organisational Chart Concerning Occupational Safety &
Health in the Punjab Province
As it is clear from the Figure 2, Occupational Safety and Health activities in Punjab are
governed by Directorate of Labour Welfare headed by Director Labour Welfare, Punjab who
is working under the supervision of Secretary Labour and Human Resources department. As
shown in the organisational chart, (Fig-2) three attached units are catering the activities of
occupational safety and health on provincial level (Punjab province). They are Centre for the
Improvement of Working Conditions and Environment, Medical Inspectorate of Factories and
Technical Inspectors of Factories (two in number) working in the headquarters office of
Directorate of Labour Welfare. All three units have their offices in provincial capital, Lahore.
Centre for the Improvement of working Conditions and Environment:
The Centre for the Improvement of Working Conditions and Environment (CIWC&E) was
established in Lahore by the Directorate of Labour Welfare, Punjab assisted by ILO/UNDP at
a total cost of Rs. 33.38 million including a foreign exchange component of Rs 11.5 million
(in the form of equipment, expert services and training of professional staff of the centre). The
construction of the building was started in 1985 and was completed in 1988 when the Centre
became operational. It is the pioneering institution in Pakistan with professionally trained
staff, modern laboratories and facilities for providing OSH services to the industry.
Finnish Institute of Occupational Health (FIOH) Helsinki, Finland played a vital role in
establishment of Centre for the Improvement of Working Conditions and Environment
(CIWC&E) Lahore, Pakistan by providing technical expertise in OSH. A number of personnel
from FIOH visited Pakistan as ILO experts on occupational safety and health during the
project.
The principal aim of CIWC&E is to combat the safety, health and working environment in the
industries in Punjab, and to create awareness and change of attitudes among the
employers/workers regarding safety, health and working environment. Since it became
Director, D irectorate of
Labour W elfare Punjab
Center for the Im provem ent
of W orking Conditions &
Environm ent
M edical Inspectorate
of Factories
Technical Inspectors of
Factories (2)
• D irector
• O ccupational Hygienist
• Environm ental Hygienist
• Safety Engineer
• Chem ist
• others
• Chief M edical Inspector of Factories
• M edical Inspector of Factories
• Industria l Hygienist
• others
Secretary Labour & Hum an Resources
Departm ent
Fig . 2 O rganizational chart concerning occupational safety & health
in the Punjab Province
Director D irectorate of
Labour
W elfare Punjab
Center for the Im provem ent
of W orking Conditions &
Environm ent
M edical Inspectorate
of Factories
Technical Inspectors of
Factories (2)
• D irector
• O ccupational Hygienist
• Environm ental Hygienist
• Safety Engineer
• Chem ist
• others
• Chief M edical Inspector of Factories
• M edical Inspector of Factories
• Industria l Hygienist
• others
Secretary Labour & Hum an Resources
Departm ent
Page 20
- 20 -
operational, the Centre for the Improvement of Working Conditions and Environment
organised 135 training courses where over 2600 participants were trained. Among them
include managers, Government agencies, OSH professionals, NGO's, trade unions and other
concerned. A mobile training unit consisting of a van equipped with audio-visuals and
training material was established in 1998. This unit travelled to the industrial units even the
far flung areas of the Punjab province and conducted 435 one day workshops and trained over
9000 workers, supervisors and managers. Risk assessment surveys in 155 industries were
conducted. Noise, dust and solvents exposure were studied in these surveys. Bimonthly
English/Urdu newsletter (Safety, Health and Environment News) is a continuous feature of
CIWC&E. A number of training and awareness materials were produced in the past five years
keeping in view the requirements of typical workers, supervisors and managers in Pakistani
industry. International chemical safety cards (ICSC's) in Urdu language were produced by the
centre. The ICSCs have been developed by International Programme on Chemical safety
(IPCS), a collaborative programme of WHO, ILO, ENEP and the European Union.
The information about the services and facilities offered by the CIWC&E are available on the
Internet. The web address of CIWC&E is www.ciwce.org.pk
Medical Inspectorate of Factories:
This inspectorate is responsible for the inspection of health and safety conditions in the
industries registered under Factories Act 1934. Chapter III of this act deals with occupational
safety and health.
Technical Inspectors of Factories:
Two engineers are working as Technical Inspectors of Factories. Their job description is to
inspect the registered factories under Chapter III of the Factories Act 1934 (some selected
Rules).
Indicators of occupational health and safety personnel are defined in the table 14.
Page 21
- 21 -
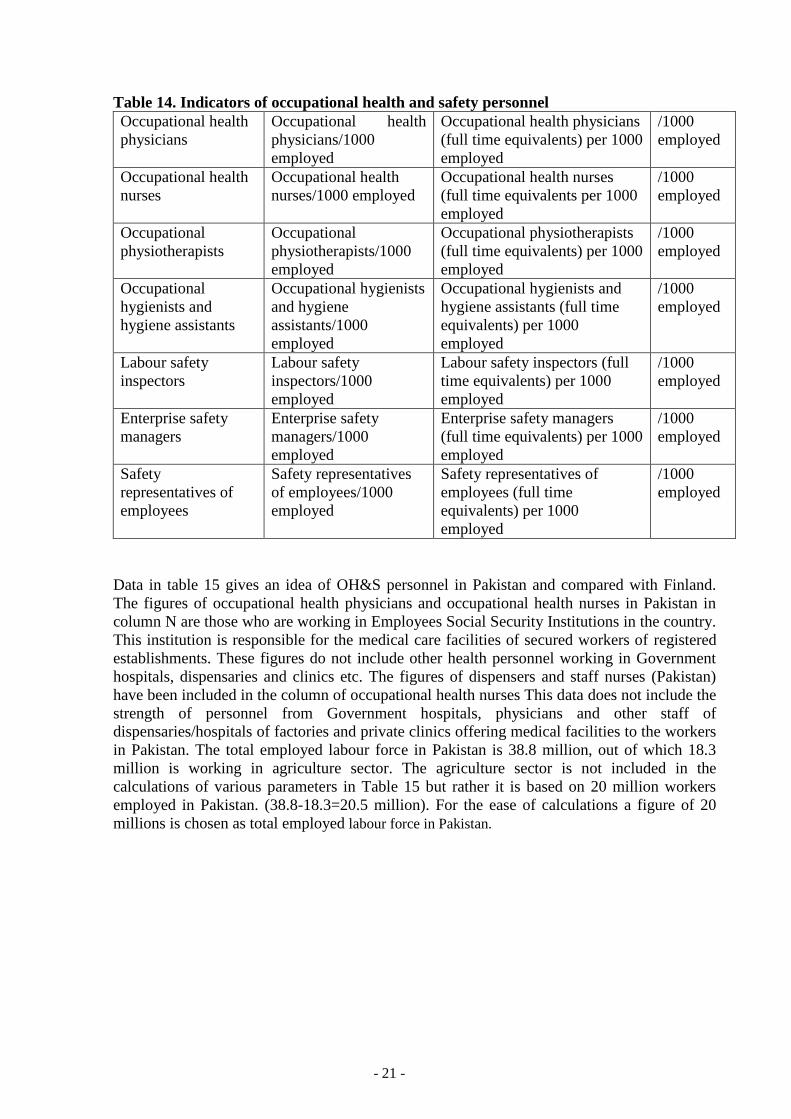
Table 14. Indicators of occupational health and safety personnel
Occupational health
physicians
Occupational health
physicians/1000
employed
Occupational health physicians
(full time equivalents) per 1000
employed
/1000
employed
Occupational health
nurses
Occupational health
nurses/1000 employed
Occupational health nurses
(full time equivalents per 1000
employed
/1000
employed
Occupational
physiotherapists
Occupational
physiotherapists/1000
employed
Occupational physiotherapists
(full time equivalents) per 1000
employed
/1000
employed
Occupational
hygienists and
hygiene assistants
Occupational hygienists
and hygiene
assistants/1000
employed
Occupational hygienists and
hygiene assistants (full time
equivalents) per 1000
employed
/1000
employed
Labour safety
inspectors
Labour safety
inspectors/1000
employed
Labour safety inspectors (full
time equivalents) per 1000
employed
/1000
employed
Enterprise safety
managers
Enterprise safety
managers/1000
employed
Enterprise safety managers
(full time equivalents) per 1000
employed
/1000
employed
Safety
representatives of
employees
Safety representatives
of employees/1000
employed
Safety representatives of
employees (full time
equivalents) per 1000
employed
/1000
employed
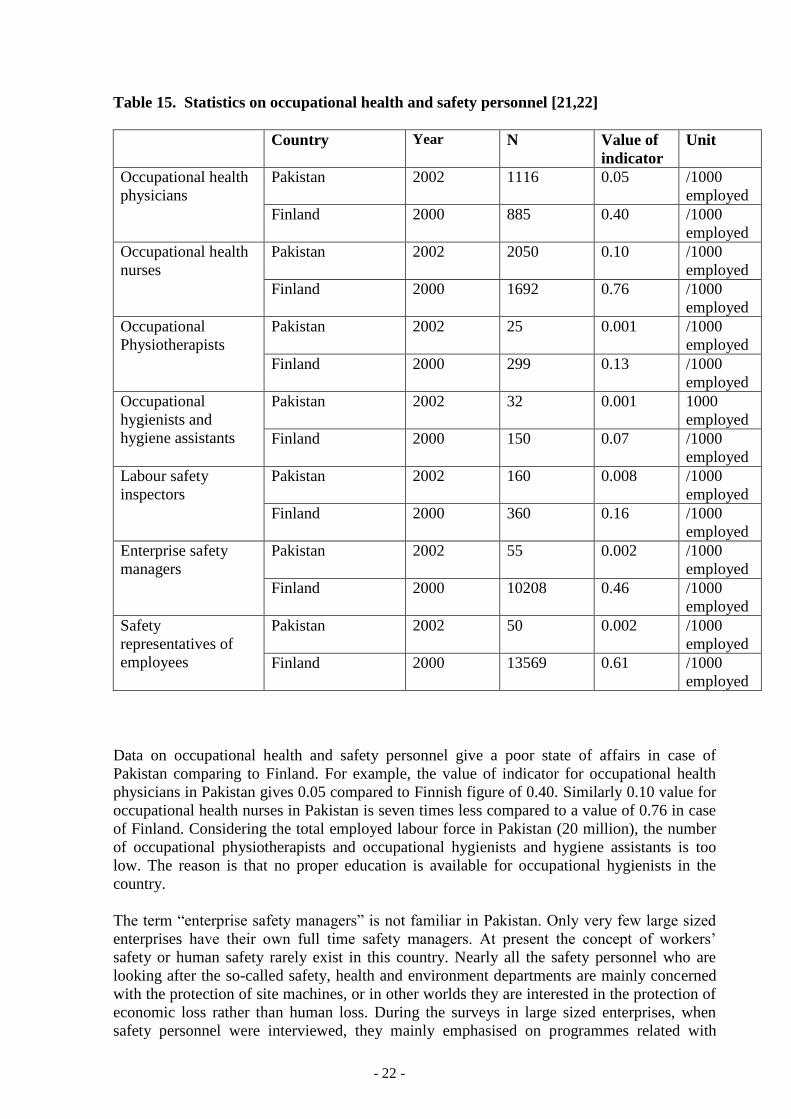
Data in table 15 gives an idea of OH&S personnel in Pakistan and compared with Finland.
The figures of occupational health physicians and occupational health nurses in Pakistan in
column N are those who are working in Employees Social Security Institutions in the country.
This institution is responsible for the medical care facilities of secured workers of registered
establishments. These figures do not include other health personnel working in Government
hospitals, dispensaries and clinics etc. The figures of dispensers and staff nurses (Pakistan)
have been included in the column of occupational health nurses This data does not include the
strength of personnel from Government hospitals, physicians and other staff of
dispensaries/hospitals of factories and private clinics offering medical facilities to the workers
in Pakistan. The total employed labour force in Pakistan is 38.8 million, out of which 18.3
million is working in agriculture sector. The agriculture sector is not included in the
calculations of various parameters in Table 15 but rather it is based on 20 million workers
employed in Pakistan. (38.8-18.3=20.5 million). For the ease of calculations a figure of 20
millions is chosen as total employed labour force in Pakistan.
Page 22
- 22 -
Table 15. Statistics on occupational health and safety personnel [21,22]
Country Year N Value of
indicator
Unit
Occupational health
physicians
Pakistan 2002 1116 0.05 /1000
employed
Finland 2000 885 0.40 /1000
employed
Occupational health
nurses
Pakistan 2002 2050 0.10 /1000
employed
Finland 2000 1692 0.76 /1000
employed
Occupational
Physiotherapists
Pakistan 2002 25 0.001 /1000
employed
Finland 2000 299 0.13 /1000
employed
Occupational
hygienists and
hygiene assistants
Pakistan 2002 32 0.001 1000
employed
Finland 2000 150 0.07 /1000
employed
Labour safety
inspectors
Pakistan 2002 160 0.008 /1000
employed
Finland 2000 360 0.16 /1000
employed
Enterprise safety
managers
Pakistan 2002 55 0.002 /1000
employed
Finland 2000 10208 0.46 /1000
employed
Safety
representatives of
employees
Pakistan 2002 50 0.002 /1000
employed
Finland 2000 13569 0.61 /1000
employed
Data on occupational health and safety personnel give a poor state of affairs in case of
Pakistan comparing to Finland. For example, the value of indicator for occupational health
physicians in Pakistan gives 0.05 compared to Finnish figure of 0.40. Similarly 0.10 value for
occupational health nurses in Pakistan is seven times less compared to a value of 0.76 in case
of Finland. Considering the total employed labour force in Pakistan (20 million), the number
of occupational physiotherapists and occupational hygienists and hygiene assistants is too
low. The reason is that no proper education is available for occupational hygienists in the
country.
The term “enterprise safety managers” is not familiar in Pakistan. Only very few large sized
enterprises have their own full time safety managers. At present the concept of workers’
safety or human safety rarely exist in this country. Nearly all the safety personnel who are
looking after the so-called safety, health and environment departments are mainly concerned
with the protection of site machines, or in other worlds they are interested in the protection of
economic loss rather than human loss. During the surveys in large sized enterprises, when
safety personnel were interviewed, they mainly emphasised on programmes related with
Page 23
- 23 -
safety of site machinery etc. and none of them explained or described site occupational safety
and health situations in the right manner. The reason being that not a single such professional
is specifically qualified in occupational safety and health. Majority of them are mechanical,
electrical, or chemical engineers having no or very little orientation in occupational safety and
health. They have attended short orientation courses on safety, health and environment
conducted by their concerns in Pakistan, mainly concerning to site safety. This situation exists
only due to the reason that there is no Health and Safety At Work Act in Pakistan, so no
qualified personnel are available and appointed for this purpose. Efforts are in process to
make such an act in the country.
Safety representative of employees are appointed by the president of the labour unions or by
the chief of CBA (Collective Bargaining Agency) of their factories. Most of them are illiterate
or appointed just for political or morale support of labour unions working in that area. They
do not have any concept of occupational safety and health and rarely been trained for the
same. As a result they are quite ineffective in the execution of occupational safety and health
programmes.
5. Indicators of occupational safety and health outcomes
5.1 Accidents at work
In Pakistan, under the rules (Factories Act 1934), there is a system according to which
registered industrial establishments has to report all industrial accidents in their units to the
Labour and Human Resources department on specified forms. However no seriousness has
been seen to observe this practice. A list of industrial fatal accidents as well as serious and
minor accidents can be seen in Table 16.
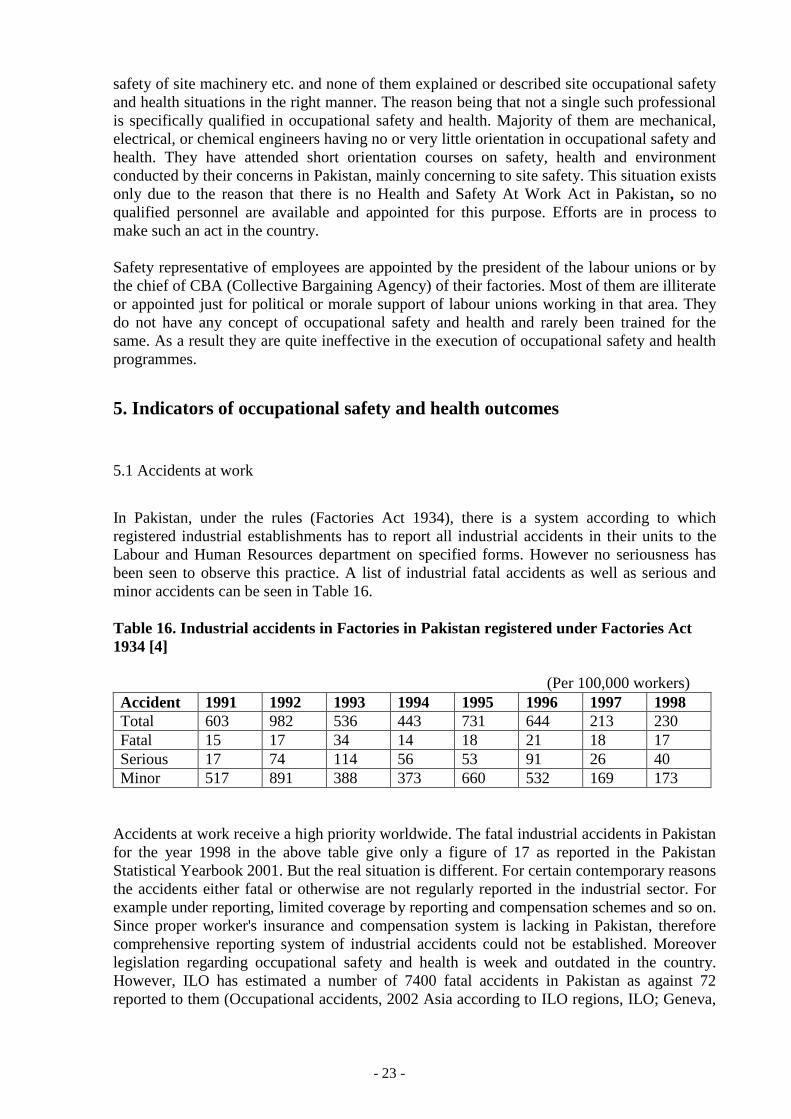
Table 16. Industrial accidents in Factories in Pakistan registered under Factories Act
1934 [4]
(Per 100,000 workers)
Accident 1991 1992 1993 1994 1995 1996 1997 1998
Total 603 982 536 443 731 644 213 230
Fatal 15 17 34 14 18 21 18 17
Serious 17 74 114 56 53 91 26 40
Minor 517 891 388 373 660 532 169 173
Accidents at work receive a high priority worldwide. The fatal industrial accidents in Pakistan
for the year 1998 in the above table give only a figure of 17 as reported in the Pakistan
Statistical Yearbook 2001. But the real situation is different. For certain contemporary reasons
the accidents either fatal or otherwise are not regularly reported in the industrial sector. For
example under reporting, limited coverage by reporting and compensation schemes and so on.
Since proper worker's insurance and compensation system is lacking in Pakistan, therefore
comprehensive reporting system of industrial accidents could not be established. Moreover
legislation regarding occupational safety and health is week and outdated in the country.
However, ILO has estimated a number of 7400 fatal accidents in Pakistan as against 72
reported to them (Occupational accidents, 2002 Asia according to ILO regions, ILO; Geneva,
Page 24
- 24 -
Switzerland). The reporting figure of Pakistan in this document is far less compared to the
estimation. Finland reported 65 fatalities to ILO and this figure is the same as ILO estimated.
6. Use of Chemicals in Pakistan
Of the total worldwide consumption of chemicals, about 80 % take place in the developed
world. The remaining 20 % are consumed by the developing countries. However, recently the
consumption in the developing countries has been on the increase and the trend is likely to
continue in coming years. In terms of risks posed to the safety and health of workers and
consumers and damage to the ecology, the developing countries are faced with more severe
and complex problems due to general lack of awareness about the potential hazards of
chemicals and lack of proper protective measures.
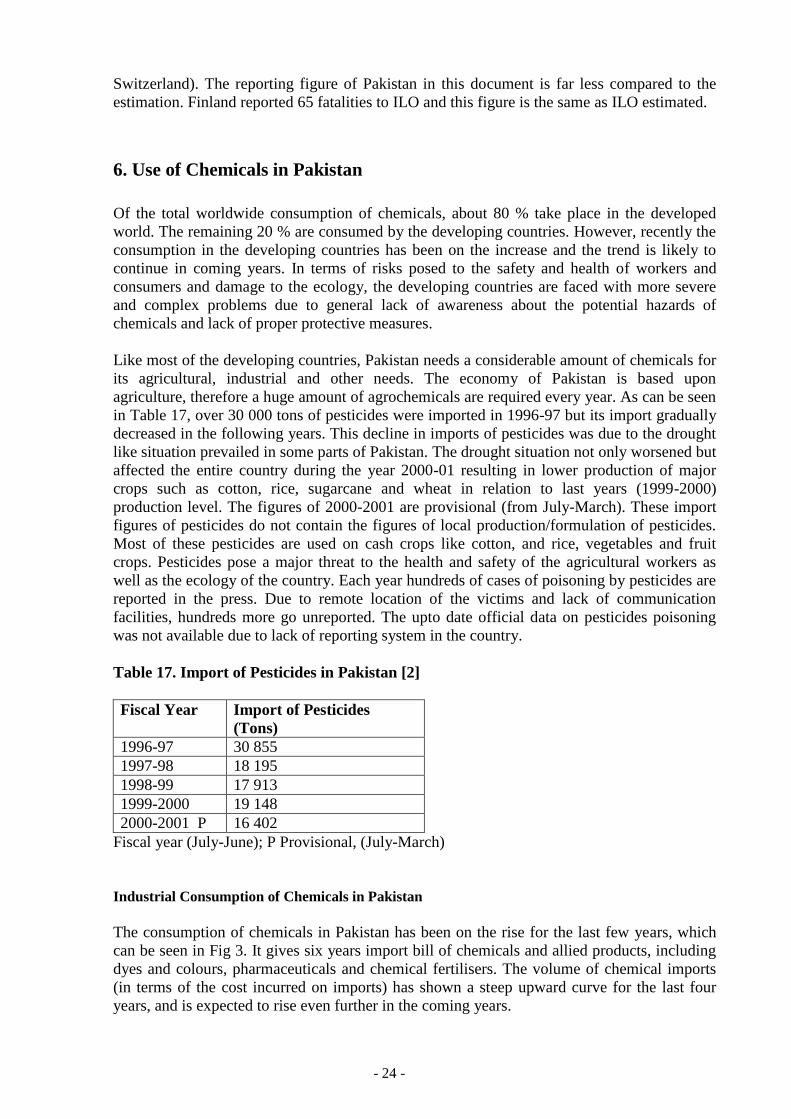
Like most of the developing countries, Pakistan needs a considerable amount of chemicals for
its agricultural, industrial and other needs. The economy of Pakistan is based upon
agriculture, therefore a huge amount of agrochemicals are required every year. As can be seen
in Table 17, over 30 000 tons of pesticides were imported in 1996-97 but its import gradually
decreased in the following years. This decline in imports of pesticides was due to the drought
like situation prevailed in some parts of Pakistan. The drought situation not only worsened but
affected the entire country during the year 2000-01 resulting in lower production of major
crops such as cotton, rice, sugarcane and wheat in relation to last years (1999-2000)
production level. The figures of 2000-2001 are provisional (from July-March). These import
figures of pesticides do not contain the figures of local production/formulation of pesticides.
Most of these pesticides are used on cash crops like cotton, and rice, vegetables and fruit
crops. Pesticides pose a major threat to the health and safety of the agricultural workers as
well as the ecology of the country. Each year hundreds of cases of poisoning by pesticides are
reported in the press. Due to remote location of the victims and lack of communication
facilities, hundreds more go unreported. The upto date official data on pesticides poisoning
was not available due to lack of reporting system in the country.
Table 17. Import of Pesticides in Pakistan [2]
Fiscal Year Import of Pesticides
(Tons)
1996-97 30 855
1997-98 18 195
1998-99 17 913
1999-2000 19 148
2000-2001 P 16 402
Fiscal year (July-June); P Provisional, (July-March)
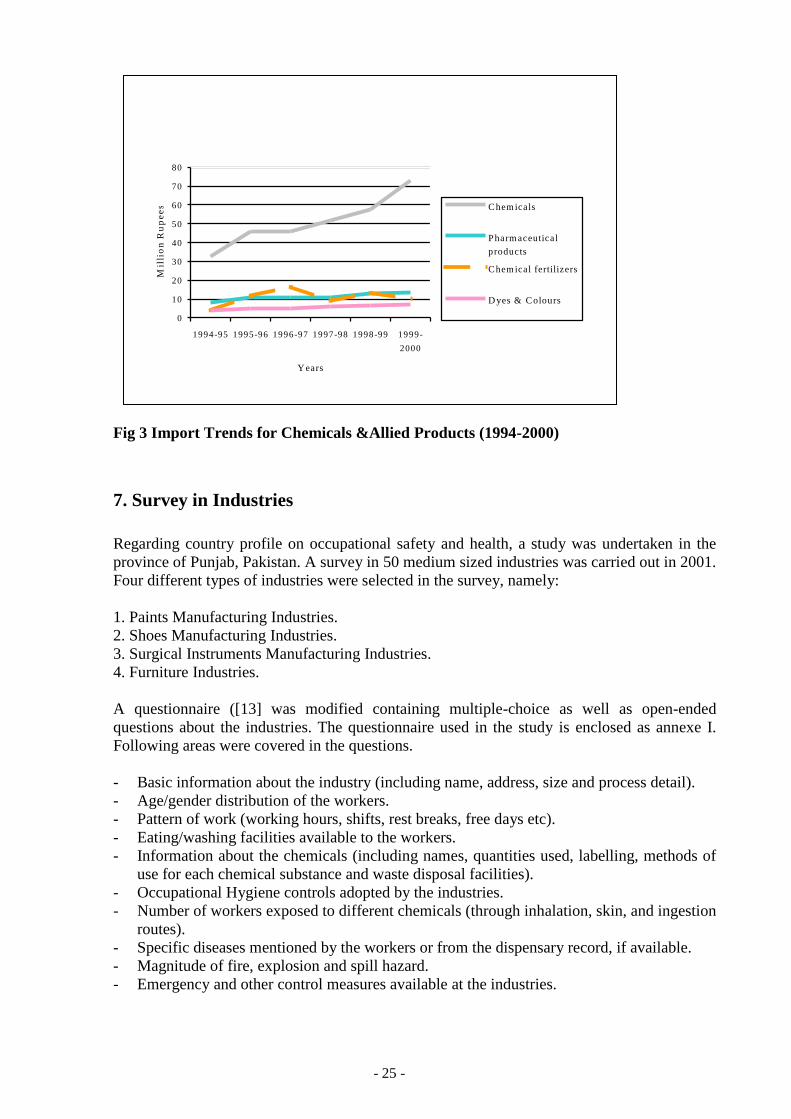
Industrial Consumption of Chemicals in Pakistan
The consumption of chemicals in Pakistan has been on the rise for the last few years, which
can be seen in Fig 3. It gives six years import bill of chemicals and allied products, including
dyes and colours, pharmaceuticals and chemical fertilisers. The volume of chemical imports
(in terms of the cost incurred on imports) has shown a steep upward curve for the last four
years, and is expected to rise even further in the coming years.
Page 25
- 25 -
0
10
20
30
40
50
60
70
80
1994-95 1995-96 1996-97 1997-98 1998-99 1999-
2000
Y ears
Mil
lio
n R
up
ee
s Chem icals
Pharm aceutical
products
Chem ical fertilizers
D yes & Colours
Fig 3 Import Trends for Chemicals &Allied Products (1994-2000)
7. Survey in Industries
Regarding country profile on occupational safety and health, a study was undertaken in the
province of Punjab, Pakistan. A survey in 50 medium sized industries was carried out in 2001.
Four different types of industries were selected in the survey, namely:
1. Paints Manufacturing Industries.
2. Shoes Manufacturing Industries.
3. Surgical Instruments Manufacturing Industries.
4. Furniture Industries.
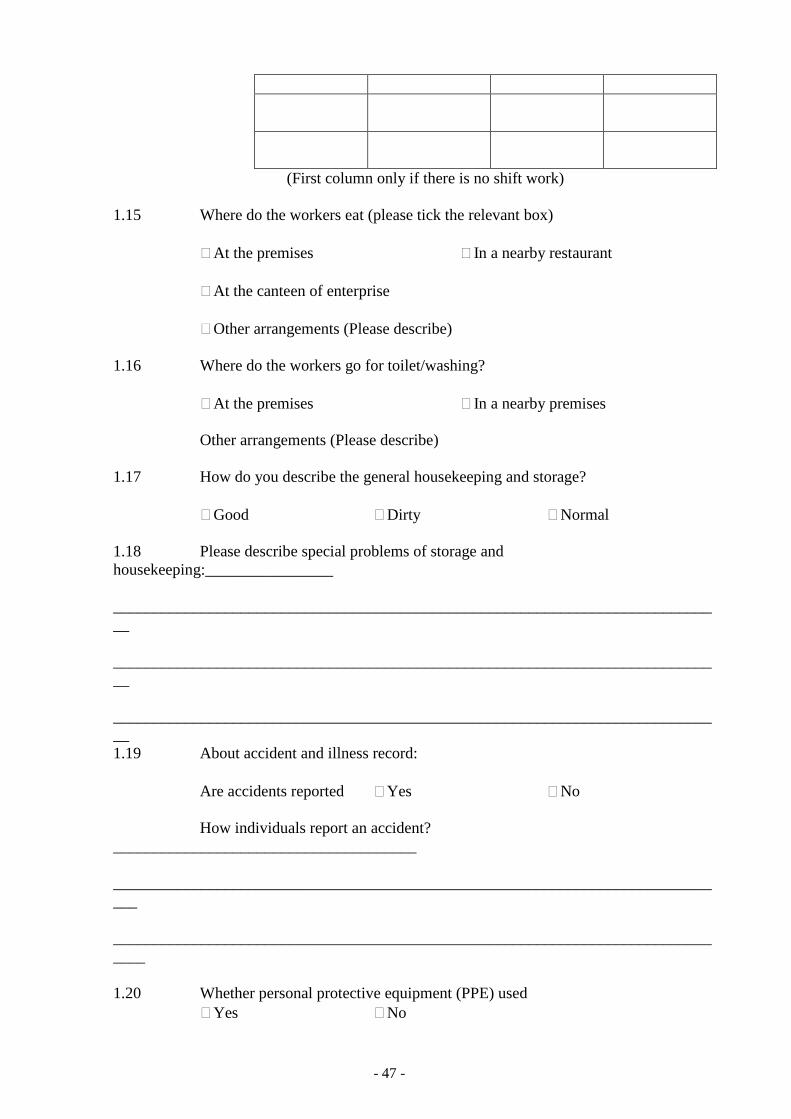
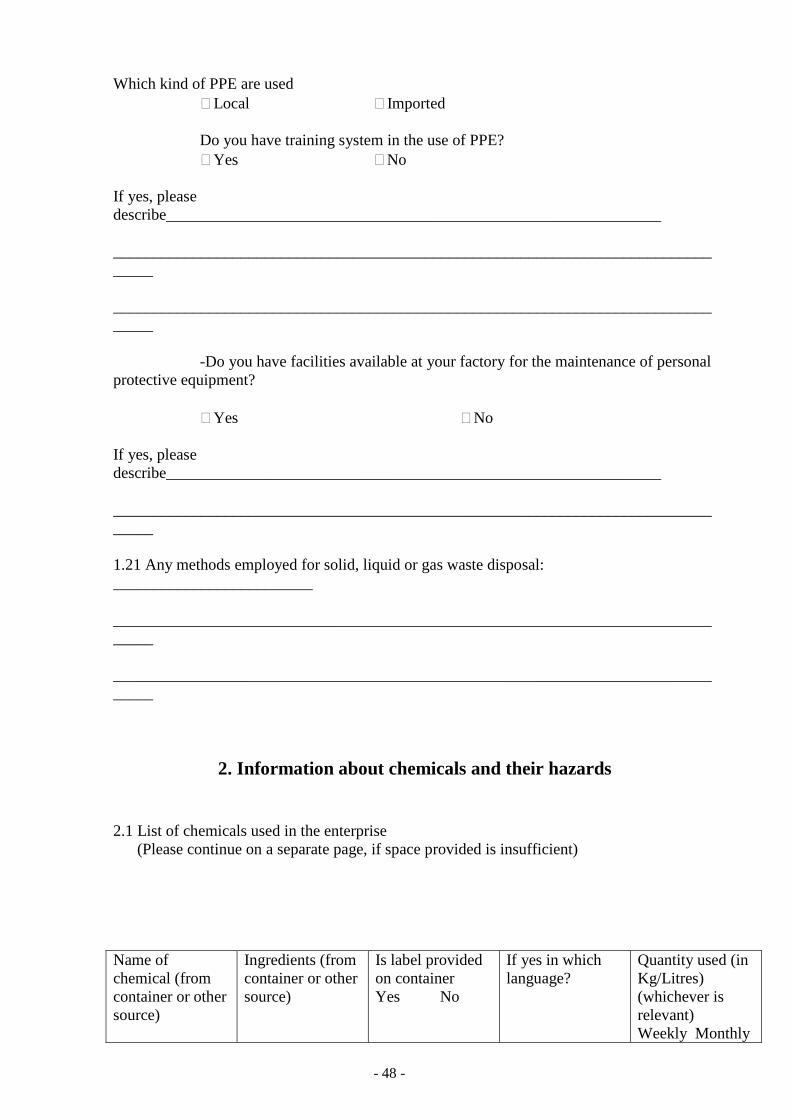
A questionnaire ([13] was modified containing multiple-choice as well as open-ended
questions about the industries. The questionnaire used in the study is enclosed as annexe I.
Following areas were covered in the questions.
- Basic information about the industry (including name, address, size and process detail).
- Age/gender distribution of the workers.
- Pattern of work (working hours, shifts, rest breaks, free days etc).
- Eating/washing facilities available to the workers.
- Information about the chemicals (including names, quantities used, labelling, methods of
use for each chemical substance and waste disposal facilities).
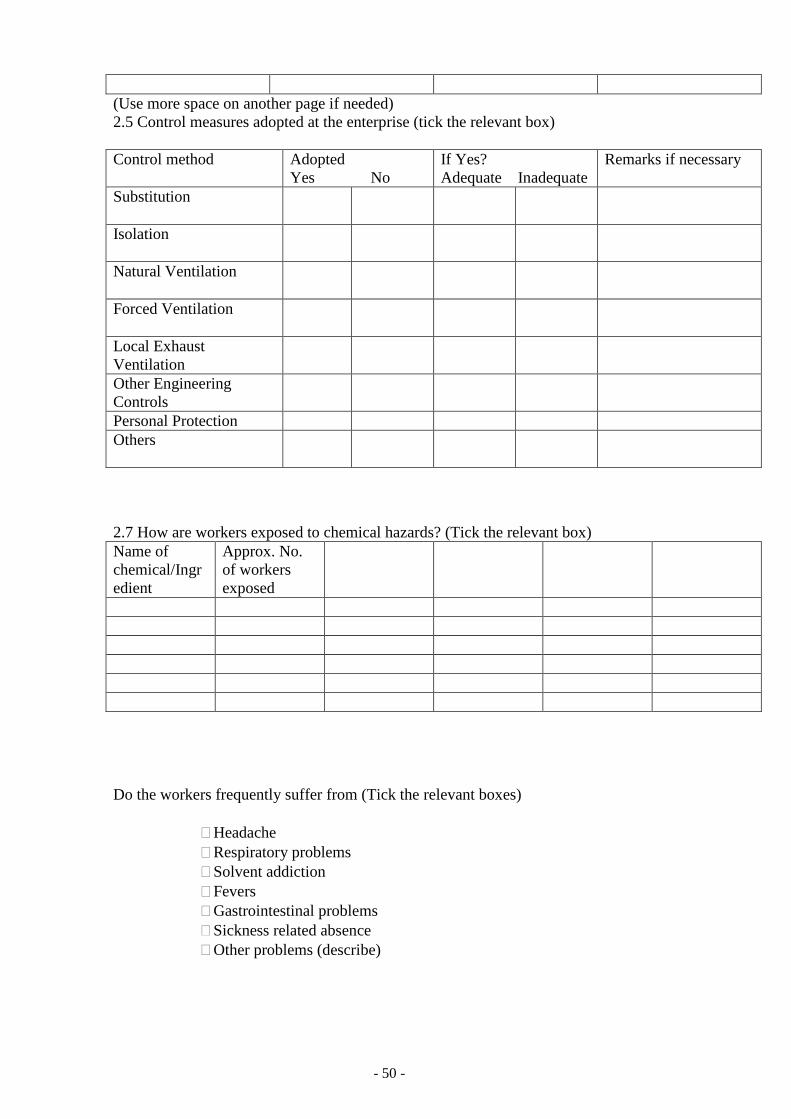
- Occupational Hygiene controls adopted by the industries.
- Number of workers exposed to different chemicals (through inhalation, skin, and ingestion
routes).
- Specific diseases mentioned by the workers or from the dispensary record, if available.
- Magnitude of fire, explosion and spill hazard.
- Emergency and other control measures available at the industries.
Page 26
- 26 -
The classification of medium sized industries was done by the definition of factory provided
under the Factories Act, 1934. This act, which regulates the work in the industrial enterprises
including health and safety, working hours, child labour etc., defines a factory as “ any
premises, including precincts thereof, where on ten or more workers are working, or were
working on any day of the preceding twelve months, and in any part of which a
manufacturing process is being carried on or is ordinarily carried on with or without the aid
of power.
Those industries having a workforce 10-300 were included in the medium sized category. The
cut-off number of 300 was fixed arbitrarily, as most of the industries listed in the directories
in all four provinces of the country fell in this category. However six shoes industries were
also selected having workers over 300. Only workers related to production/manufacturing
were included for determining the size of the industry.
A walk through survey of each industry was carried out during which the hazards and their
magnitude were assessed. The workers and supervisors were also approached for information
about any specific problems, hazards, occupational accidents or diseases, which might have
happened in the industry. The chemical handling, storage and disposal practices were
observed.
7.1. A Profile of Medium Sized Industries
A total of 12 paints manufacturing, 14 shoes manufacturing, 13 surgical instruments
manufacturing and 11 furniture industries were visited.
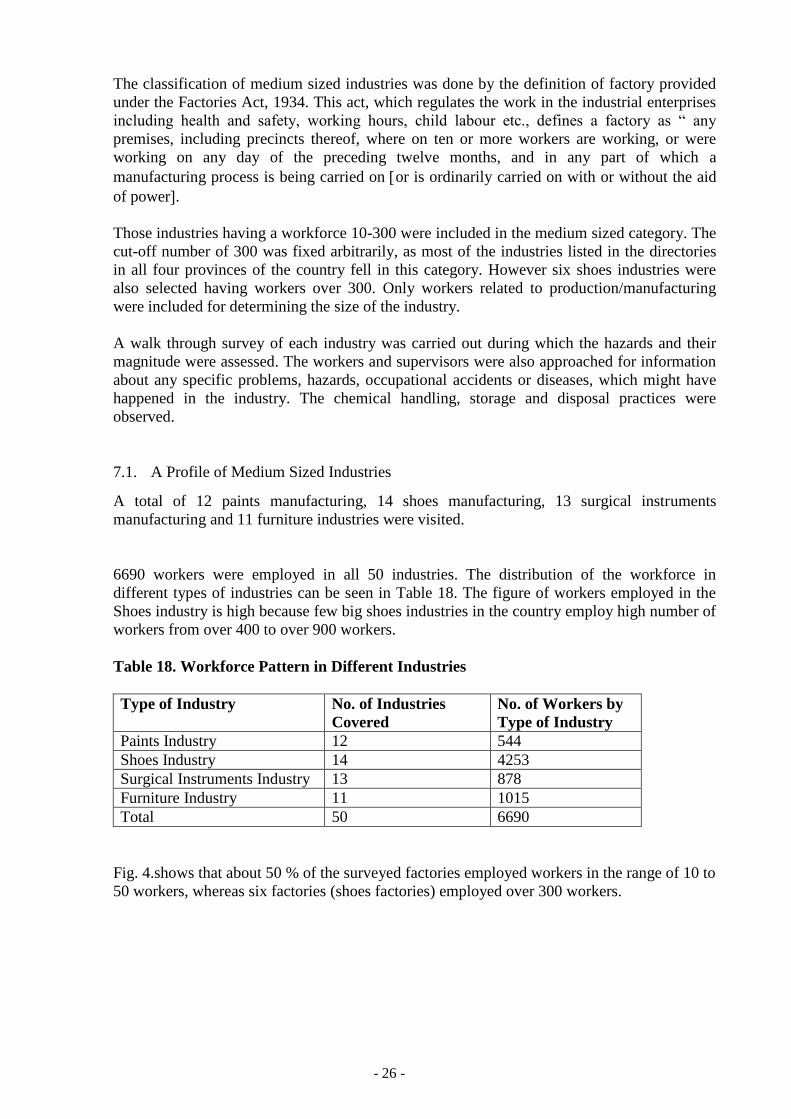
6690 workers were employed in all 50 industries. The distribution of the workforce in
different types of industries can be seen in Table 18. The figure of workers employed in the
Shoes industry is high because few big shoes industries in the country employ high number of
workers from over 400 to over 900 workers.
Table 18. Workforce Pattern in Different Industries
Type of Industry No. of Industries
Covered
No. of Workers by
Type of Industry
Paints Industry 12 544
Shoes Industry 14 4253
Surgical Instruments Industry 13 878
Furniture Industry 11 1015
Total 50 6690
Fig. 4.shows that about 50 % of the surveyed factories employed workers in the range of 10 to
50 workers, whereas six factories (shoes factories) employed over 300 workers.
Page 27
- 27 -
Fig 4 Distribution of Enterprises by Number of Workers
Apart from the packaging section of few surgical, paints and shoes manufacturing industries,
women were not found to be working in the surveyed industries. It does not mean that women
do not have participation in the labour force of the country. They constitute a considerable
portion of workforce in certain sectors of economy, especially in agriculture and household
based enterprises, particularly in carpet weaving, stitching and handicrafts manufacturing and
so on.
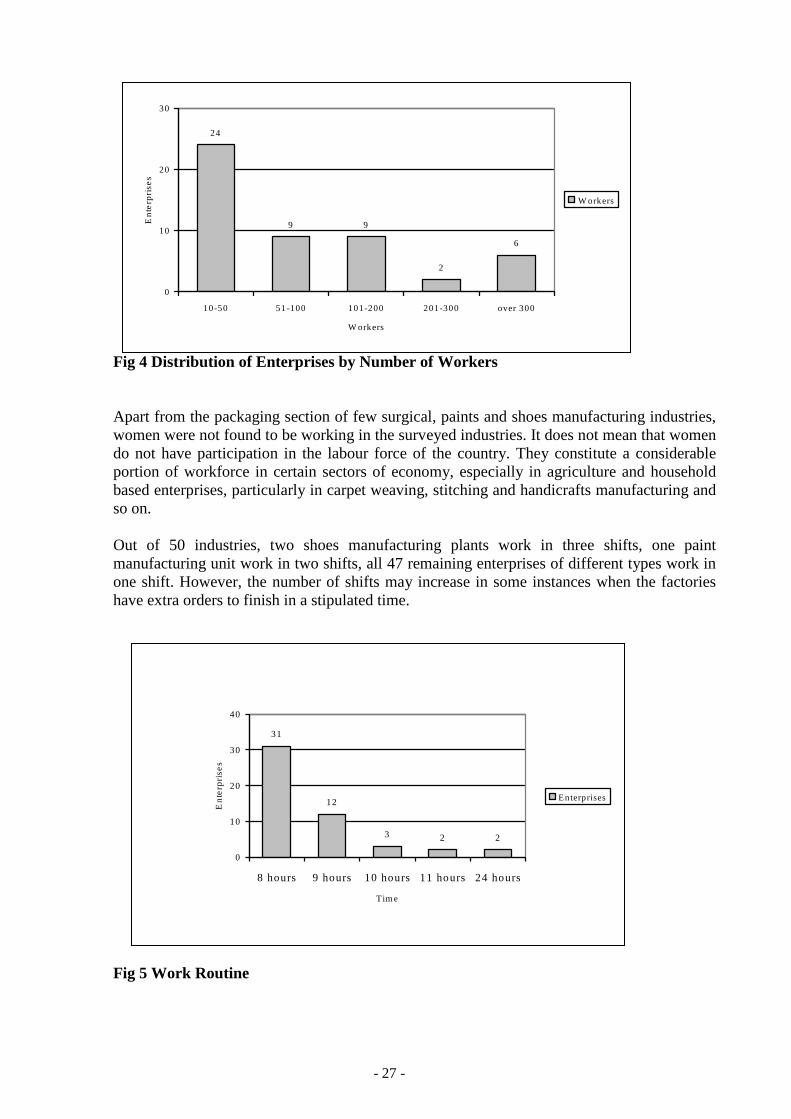
Out of 50 industries, two shoes manufacturing plants work in three shifts, one paint
manufacturing unit work in two shifts, all 47 remaining enterprises of different types work in
one shift. However, the number of shifts may increase in some instances when the factories
have extra orders to finish in a stipulated time.
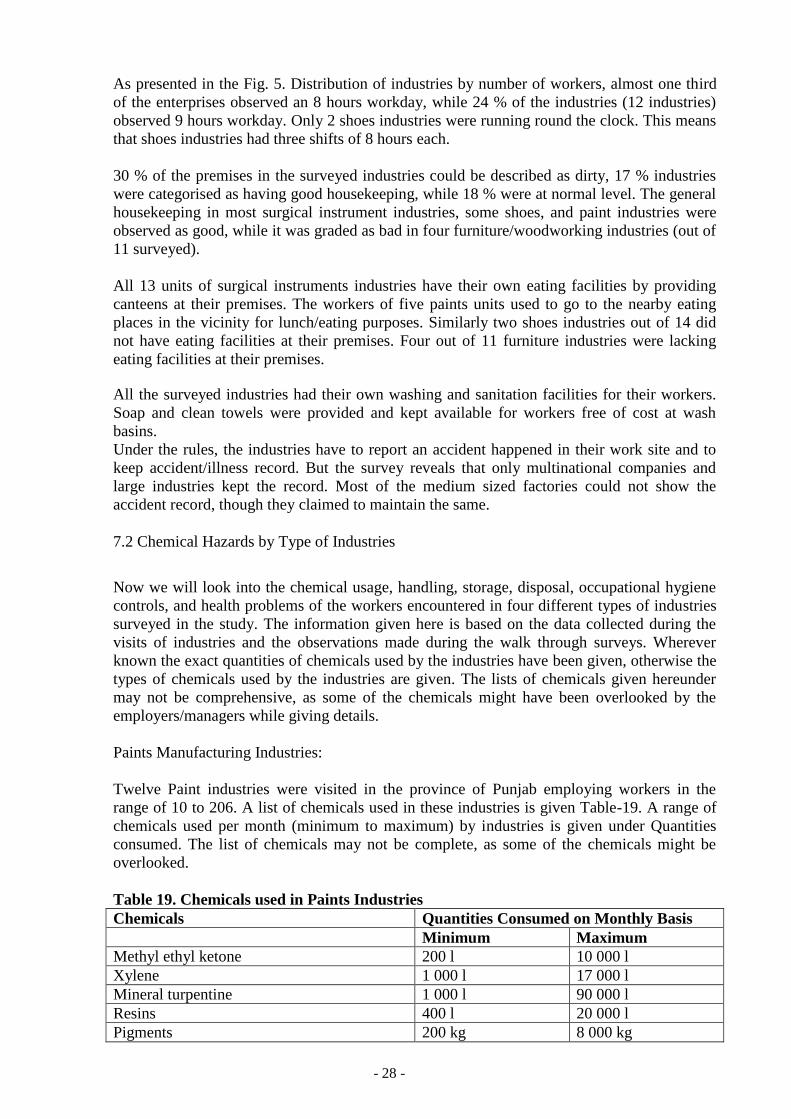
Fig 5 Work Routine
31
12
3 2 2
0
10
20
30
40
8 hours 9 hours 10 hours 11 hours 24 hours
Tim e
En
terp
rise
s
E n terprises
24
9 9
2
6
0
10
20
30
10-50 51-100 101-200 201-300 over 300
W orkers
En
terp
rise
s
W orkers
Page 28
- 28 -
As presented in the Fig. 5. Distribution of industries by number of workers, almost one third
of the enterprises observed an 8 hours workday, while 24 % of the industries (12 industries)
observed 9 hours workday. Only 2 shoes industries were running round the clock. This means
that shoes industries had three shifts of 8 hours each.
30 % of the premises in the surveyed industries could be described as dirty, 17 % industries
were categorised as having good housekeeping, while 18 % were at normal level. The general
housekeeping in most surgical instrument industries, some shoes, and paint industries were
observed as good, while it was graded as bad in four furniture/woodworking industries (out of
11 surveyed).
All 13 units of surgical instruments industries have their own eating facilities by providing
canteens at their premises. The workers of five paints units used to go to the nearby eating
places in the vicinity for lunch/eating purposes. Similarly two shoes industries out of 14 did
not have eating facilities at their premises. Four out of 11 furniture industries were lacking
eating facilities at their premises.
All the surveyed industries had their own washing and sanitation facilities for their workers.
Soap and clean towels were provided and kept available for workers free of cost at wash
basins.
Under the rules, the industries have to report an accident happened in their work site and to
keep accident/illness record. But the survey reveals that only multinational companies and
large industries kept the record. Most of the medium sized factories could not show the
accident record, though they claimed to maintain the same.
7.2 Chemical Hazards by Type of Industries
Now we will look into the chemical usage, handling, storage, disposal, occupational hygiene
controls, and health problems of the workers encountered in four different types of industries
surveyed in the study. The information given here is based on the data collected during the
visits of industries and the observations made during the walk through surveys. Wherever
known the exact quantities of chemicals used by the industries have been given, otherwise the
types of chemicals used by the industries are given. The lists of chemicals given hereunder
may not be comprehensive, as some of the chemicals might have been overlooked by the
employers/managers while giving details.
Paints Manufacturing Industries:
Twelve Paint industries were visited in the province of Punjab employing workers in the
range of 10 to 206. A list of chemicals used in these industries is given Table-19. A range of
chemicals used per month (minimum to maximum) by industries is given under Quantities
consumed. The list of chemicals may not be complete, as some of the chemicals might be
overlooked.
Table 19. Chemicals used in Paints Industries
Chemicals Quantities Consumed on Monthly Basis
Minimum Maximum
Methyl ethyl ketone 200 l 10 000 l
Xylene 1 000 l 17 000 l
Mineral turpentine 1 000 l 90 000 l
Resins 400 l 20 000 l
Pigments 200 kg 8 000 kg
Page 29
- 29 -
The maximum figures of quantities consumed as shown in the Table 21 are from a
multinational company functioning in Pakistan. The other figures are from medium sized
factories functioning in the province of Punjab. Out of 12 Paints industries surveyed, five
industries produced decorative paints while others produced varieties of decorative,
automotive, industrial and refinish paint products. The processes in small industries
(employing workers 10 to 18) were mixture of manual work and mechanical and automated as
well. On the other hand, medium sized factories were mostly mechanical and equipped with
automated plants.
In general, the major hazards associated with the paint manufacture involve materials
handling, toxic, flammable or explosive substances, and physical agents such as electric
shock, noise and heat. Chemical hazards include exposure to toxic dusts such as lead
chromate pigment, which can occur during weighing, filling of mixer and mill hoppers,
operations of unenclosed equipment, filling of powdered paint containers, cleaning of
equipment and from spills of containers. A variety of volatile solvents are used in paint and
coating manufacture, including aliphatic and aromatic hydrocarbons, alcohols, ketones and so
forth. Precautions include enclosure of process equipment, local exhaust ventilation for
thinning and can filling operations and respiratory protection and confined-space procedures
for cleaning vessels. Flammable solvents, combustible powders (especially nitrocellulose used
in lacquer production) and oils are all fire or explosion risks if ignited by a spark or high
temperatures. Sources of ignition can include faulty electric equipment, smoking, friction,
open flames, static electricity and so on. Oil soaked rags can be a source of spontaneous
combustion. Precautions include bonding and grounding containers while transferring
flammable liquids, grounding of equipment such as ball mills containing combustible dusts,
ventilation to keep vapour concentrations below the lower explosive limits, covering
containers when not in use, removal of sources of ignition and good housekeeping practices
[23].
Shoes Manufacturing Industries:
Shoes industry is widely spread in the country for the need of local population, but especially
in cities like Lahore, Multan, Sialkot (in Punjab province) and Karachi (in Sindh province) the
industries are dealing in export of shoes as well. A total of 14 shoes industries were visited in
the province of Punjab, employing workers from 42 to 945.
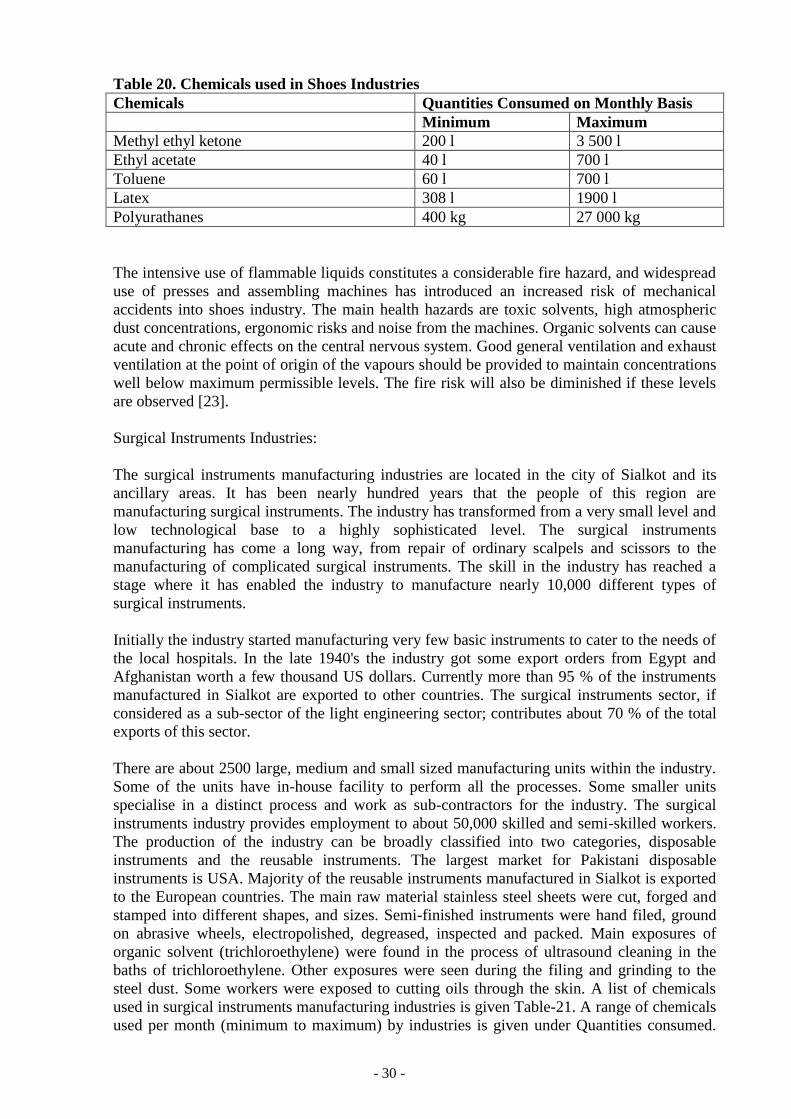
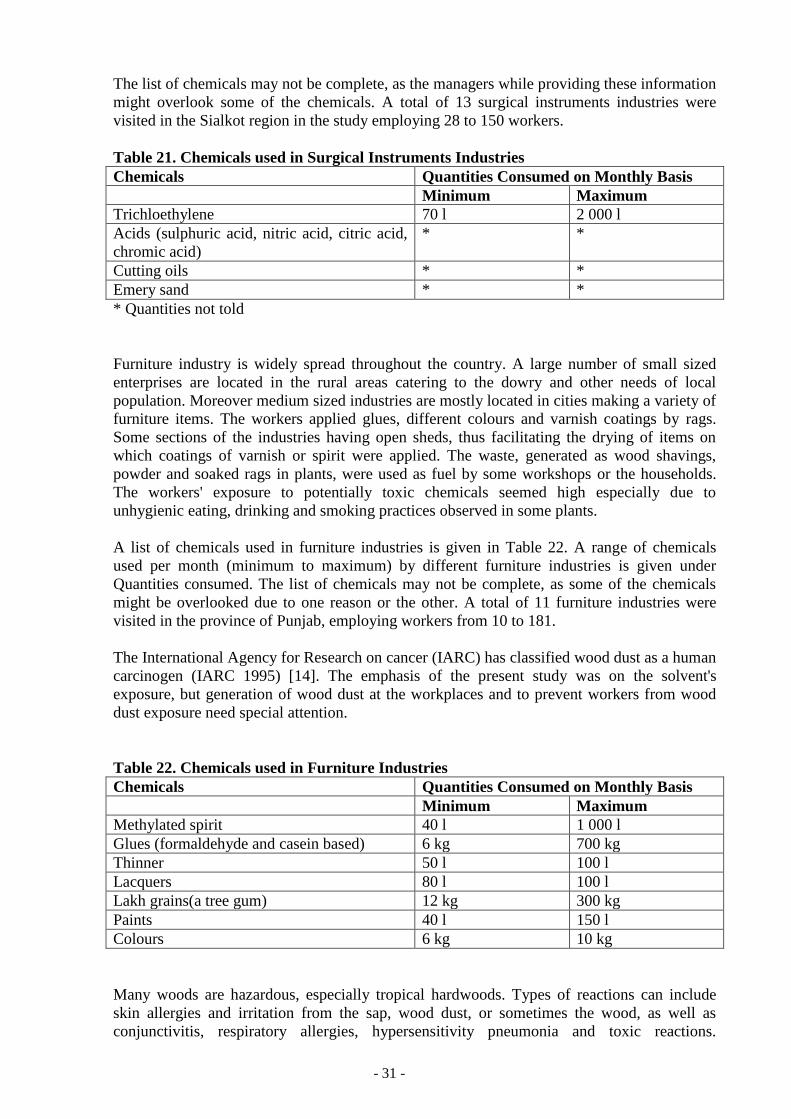
A list of chemicals used in shoes industries is given in Table 20. A range of chemicals used
per month (minimum to maximum) by different industries is given under Quantities
consumed. The list of chemicals may not be complete, as some of the chemicals might be
overlooked due to one reason or the other. The usage of various chemicals differs in industries
depending on the types of shoes manufactured.
Page 30
- 30 -
Table 20. Chemicals used in Shoes Industries
Chemicals Quantities Consumed on Monthly Basis
Minimum Maximum
Methyl ethyl ketone 200 l 3 500 l
Ethyl acetate 40 l 700 l
Toluene 60 l 700 l
Latex 308 l 1900 l
Polyurathanes 400 kg 27 000 kg
The intensive use of flammable liquids constitutes a considerable fire hazard, and widespread
use of presses and assembling machines has introduced an increased risk of mechanical
accidents into shoes industry. The main health hazards are toxic solvents, high atmospheric
dust concentrations, ergonomic risks and noise from the machines. Organic solvents can cause
acute and chronic effects on the central nervous system. Good general ventilation and exhaust
ventilation at the point of origin of the vapours should be provided to maintain concentrations
well below maximum permissible levels. The fire risk will also be diminished if these levels
are observed [23].
Surgical Instruments Industries:
The surgical instruments manufacturing industries are located in the city of Sialkot and its
ancillary areas. It has been nearly hundred years that the people of this region are
manufacturing surgical instruments. The industry has transformed from a very small level and
low technological base to a highly sophisticated level. The surgical instruments
manufacturing has come a long way, from repair of ordinary scalpels and scissors to the
manufacturing of complicated surgical instruments. The skill in the industry has reached a
stage where it has enabled the industry to manufacture nearly 10,000 different types of
surgical instruments.
Initially the industry started manufacturing very few basic instruments to cater to the needs of
the local hospitals. In the late 1940's the industry got some export orders from Egypt and
Afghanistan worth a few thousand US dollars. Currently more than 95 % of the instruments
manufactured in Sialkot are exported to other countries. The surgical instruments sector, if
considered as a sub-sector of the light engineering sector; contributes about 70 % of the total
exports of this sector.
There are about 2500 large, medium and small sized manufacturing units within the industry.
Some of the units have in-house facility to perform all the processes. Some smaller units
specialise in a distinct process and work as sub-contractors for the industry. The surgical
instruments industry provides employment to about 50,000 skilled and semi-skilled workers.
The production of the industry can be broadly classified into two categories, disposable
instruments and the reusable instruments. The largest market for Pakistani disposable
instruments is USA. Majority of the reusable instruments manufactured in Sialkot is exported
to the European countries. The main raw material stainless steel sheets were cut, forged and
stamped into different shapes, and sizes. Semi-finished instruments were hand filed, ground
on abrasive wheels, electropolished, degreased, inspected and packed. Main exposures of
organic solvent (trichloroethylene) were found in the process of ultrasound cleaning in the
baths of trichloroethylene. Other exposures were seen during the filing and grinding to the
steel dust. Some workers were exposed to cutting oils through the skin. A list of chemicals
used in surgical instruments manufacturing industries is given Table-21. A range of chemicals
used per month (minimum to maximum) by industries is given under Quantities consumed.
Page 31
- 31 -
The list of chemicals may not be complete, as the managers while providing these information
might overlook some of the chemicals. A total of 13 surgical instruments industries were
visited in the Sialkot region in the study employing 28 to 150 workers.
Table 21. Chemicals used in Surgical Instruments Industries
Chemicals Quantities Consumed on Monthly Basis
Minimum Maximum
Trichloethylene 70 l 2 000 l
Acids (sulphuric acid, nitric acid, citric acid,
chromic acid)
* *
Cutting oils * *
Emery sand * *
* Quantities not told
Furniture industry is widely spread throughout the country. A large number of small sized
enterprises are located in the rural areas catering to the dowry and other needs of local
population. Moreover medium sized industries are mostly located in cities making a variety of
furniture items. The workers applied glues, different colours and varnish coatings by rags.
Some sections of the industries having open sheds, thus facilitating the drying of items on
which coatings of varnish or spirit were applied. The waste, generated as wood shavings,
powder and soaked rags in plants, were used as fuel by some workshops or the households.
The workers' exposure to potentially toxic chemicals seemed high especially due to
unhygienic eating, drinking and smoking practices observed in some plants.
A list of chemicals used in furniture industries is given in Table 22. A range of chemicals
used per month (minimum to maximum) by different furniture industries is given under
Quantities consumed. The list of chemicals may not be complete, as some of the chemicals
might be overlooked due to one reason or the other. A total of 11 furniture industries were
visited in the province of Punjab, employing workers from 10 to 181.
The International Agency for Research on cancer (IARC) has classified wood dust as a human
carcinogen (IARC 1995) [14]. The emphasis of the present study was on the solvent's
exposure, but generation of wood dust at the workplaces and to prevent workers from wood
dust exposure need special attention.
Table 22. Chemicals used in Furniture Industries
Chemicals Quantities Consumed on Monthly Basis
Minimum Maximum
Methylated spirit 40 l 1 000 l
Glues (formaldehyde and casein based) 6 kg 700 kg
Thinner 50 l 100 l
Lacquers 80 l 100 l
Lakh grains(a tree gum) 12 kg 300 kg
Paints 40 l 150 l
Colours 6 kg 10 kg
Many woods are hazardous, especially tropical hardwoods. Types of reactions can include
skin allergies and irritation from the sap, wood dust, or sometimes the wood, as well as
conjunctivitis, respiratory allergies, hypersensitivity pneumonia and toxic reactions.
Page 32
- 32 -
Inhalation of hardwood dust is associated with a particular type of nasal and nasal sinus
cancer (adenocarcinoma). Precautions include avoiding use of sensitising woods for people
who have a history of allergies, or for objects where people would be in frequent contact with
the wood, and controlling dust levels by using local exhaust ventilation or wearing a toxic-
dust respirator [23].
7.3 Safety and Health Hazards and Control Measures adopted by the Industries
The focus of this study was to explore the risks posed by the usage of chemicals to the health
and safety of the workers, ecological problems created by these industries and the measures
already adopted by them to combat these problems. General observations on chemical safety
problems and control measures are explained hereunder:
Labelling of Chemicals
While legislation exists for adequate labelling of pesticides and drugs sold in the country, no
provisions have been made for the labelling of industrial chemicals. As a result the containers
of the chemicals rarely, if ever, bear the labels in Urdu language. In the survey, it was noted
that Shoes and Surgical instruments manufacturing industries were using chemical containers
bearing labelling of chemicals and some indication of the contents inside. Whereas it was
observed that four paints and five furniture industries were using containers without proper
labelling. Even where a label was provided on the containers, in most cases it was in a foreign
language most often in English and sometimes in German, Chinese, UK or French. It was
observed in two paints and six shoes industries that were using some containers of chemicals
bearing labels in national language (Urdu) as well. This state of affairs does not bode well in a
country where literacy rate is very low and most workers and common citizens cannot read
even the national language, what to speak of foreign languages. It is strange that even
chemicals made in Pakistan rarely bear markings in Urdu. The lack of proper labelling can
results in some mishaps but the issue has not been given due attention. In many cases
containers meant for one chemical are used again for other chemicals exacerbating the risks to
the safety and health of users, who sometimes get inadvertently exposed. It was also observed
in some cases that the labels, even if present on the containers, did not have any information
about the ingredients of the product, the basic safety and health precautions and emergency
procedures to be adopted. In some cases the labels were simply the commercial names of the
products stencilled on the containers.
Storage and Handling of Chemicals
In most of the factories visited in the survey, only enough chemicals were stored at the
premises. Only large industries stored large quantities of chemicals and other raw materials
(in hundreds or thousands of tonnes). Some large industries used pumping and other
mechanical means to transfer the chemicals within the industries. In some cases containers of
chemicals were lifted on shoulders and poured in the mixing tanks. Two paints and five shoes
industries were having large stores for the storage of raw materials in big quantities.
Occupational Hygiene Controls
As shown in the Fig 4 almost 50 % of the surveyed factories employed workers in the range
of 10 to 50 workers. Such industries adopted very few engineering and other occupational
hygiene controls. Most factories did not have adequate local exhaust, forced or natural
ventilation. While many industries had adopted isolation by keeping different types of
Page 33
- 33 -
operations in different rooms, thus avoiding unnecessary exposure to workers, none had
considered substitution of hazardous processes or chemicals. In the survey proper personal
protective equipment (PPE) were rarely seen being used in most industries. Only two paints,
five shoes and six surgical instruments industries were observed where workers used some
PPE in their work. All other industries were lacking these facilities. The cost of such
equipment was mentioned as a barrier to their use. Moreover lack of awareness/education and
proper training of how to use personal protective equipment among the workers were the
factors for not using PPE at work. Even the managers of small industries were not familiar
with the use of personal protective equipment. Fire fighting facilities in most factories were in
sorry state of neglect. Similarly first aid, emergency treatment of workers, transport in case of
emergency, waste disposal and warning signs in most industries can be described as
inadequate
None of the industries surveyed in the study had regular air monitoring and biological
monitoring facilities to assess the risk situations. Table 23 reflects activity standards of
control methods adopted to use in this study.
Table 23. Standards of Control Methods
Activity None Available but
inadequate
Adequate
Air monitoring No facility available Some air monitoring
is done in the past but
on irregular basis,
and conducted by
other
agencies/private
consultancies
Regular air
monitoring is done
by direct reading
instruments like
detector tubes etc.
available in the
factory
Biological
monitoring
No facility available Some biological
monitoring is done in
the past on irregular
basis conducted by
other
agencies/private
consultancies
Regular
monitoring/measure
ment of a substance,
its metabolite or its
effects in body
tissues, fluids or
exhaled air of
exposed workers. All
these facilities
available at factory
level
Waste disposal Control measures are
poor
Some controls exist
for disposal of
harmful wastes or
trash/effluents.
Controls exist but are
ineffective in
methods of collection
and disposal
Waste disposal
hazards are identified
and effectively
controlled. Air/water
pollution potential is
minimal
First aid First aid boxes not
seen in factories
First aid boxes are
available but not in
sufficient number
and/or their contents
are not in order as per
local rules
Sufficient first aid
boxes are available
according to the size
of the factory and
their contents are in
order according to
Page 34
- 34 -
the legal requirement
Emergency treatment
of workers
No worker is trained
in First aid treatment
Very few workers
have working
knowledge of First
aid treatment
The factory has a
doctor or nurse in a
dispensary at the
premises, and a
sufficient number of
workers (according to
the size of factory)
are properly trained
in First aid treatment
Transportation in
case of emergency
No ambulance in the
range of 20 km and
no sufficient number
of factory owned or
private cars available
in the premises
No ambulance
available within 20
km range, but
vehicles (factory
owned or private
cars) or pickup
available in case of
emergency
Ambulance is
available within 20
km range. Plus
factory owned
vehicle/cars are
available in the
premises
Fire fighting facilities Facilities not
available or do not
meet the requirement
as per local rules
Insufficient numbers
of fire extinguishers
and/or fire hoses are
provided
Sufficient number of
fire extinguishers
and/or fire hoses is
provided. A fire crew
is organised and
trained in emergency
procedures and in the
use of fire fighting
equipment
Social security
compensation
No such system is
working in the
factory at all
The employer is not
paying contribution
(for all his workers)
to the Punjab
Employees Social
Security Institution
(PESSI), and as a
result his all workers
are not getting cash
benefits and other
medical care facilities
from PESSI
hospitals/dispensaries
The employer is
regularly paying
contribution to the
Punjab Employees
Social Security
Institution a fixed
sum per worker
according to the
Provincial
Employees Social
Security Ordinance
1965. And the
secured workers are
enjoying cash
benefits and medical
care facilities in
social security
hospitals/dispensaries
Warning signs No warning signs
seen in the factory
Insufficient number
of warning signs seen
in the factory
Sufficient number of
different warning
signs are seen in
various sections of
the factory
Page 35
- 35 -
Figures 6 to 9 represent the situation of control measures taken by four different types of
industries. It is evident from Figures 6 to 9 that surveyed factories totally lacked air
monitoring and biological monitoring facilities, except for one multinational paint factory
who did air and biological monitoring of their workers but it was inadequate and done on
irregular basis. Transportation in case of emergency was available and adequate in all
surveyed factories, as ambulances were available within 20 km range and also factory owned
vehicles were available at their sites.
Figure 6 shows that 70 % of paint industries had poor control measures for waste disposal.
Whereas 70 % of these industries lacked facilities like first aid and emergency treatment of
workers. This means that no first aid boxes were seen in 75 % of paints industries. Similarly
not even a single worker was trained in first aid treatment in 70 % of surveyed paint
industries. Only 25 % of these industries had adequate facilities of first aid and emergency
treatment of workers. Only one multinational industry (8%) of the twelve surveyed paint
industries had adequate fire fighting facilities. 66 % had inadequate fire fighting facilities,
while the remaining 26 % lacked such facilities. This situation can be dangerous in terms of
human loss and loss of the property. As per Employees Social Security Ordinance 1965, an
employer has obliged to pay a fixed sum (7% of gross wage) per worker to the Provincial
Employees Social Security Institutions. But the practice is that employers of small enterprises
do not pay their contribution for all workers. In fact they hide some of their workers on the
papers. As a result a significant number of workers could not enjoy facilities offered by this
ordinance. Only four, out of twelve paints industries, were found to have adequate system of
social security compensation. An inadequate compensation system was available to 40 % of
the paints industries while 34 % had no social security compensation system for their workers.
The situation of warning signs was quite poor because 70 % of the paint industries did not
bother to affix warning signs at their workplaces. Sufficient number of warning signs were
affixed at appropriate places in one multinational paint industry while situation of 25 %
industries were regarded as inadequate in terms of warning signs.
Figure 6. Controls Adopted by Paints Industries (Total 12 industries)
0 %
20 %
40 %
60 %
80 %
100 %
Air
Monito
ring
Bio
logic
al Monito
ring
Wast
e Dis
posal
Firs
t Aid
Em
ergency
Tre
atment o
f Work
ers
Tra
nsport
ation in
case
of E
merg
ency
Fire
Fig
hting F
acilitie
s
Soci
al Secu
rity
Com
pensatio
n
Warn
ing S
igns
Adequate
Available but Inadequate
None
Page 36
- 36 -
Figure 7 reflects the control measures adopted by 14 shoes industries. It is clear that not even
a single industry adopted control measures of air monitoring and biological monitoring at
their workplaces. 36 % of the surveyed industries had adequate waste disposal facilities while
64 % had some waste disposal control but it was ineffective and inadequate. 20 % of the
industries observed adequate facilities for first aid and emergency treatment of workers at
their sites. Whereas these facilities were available to 43 % of the surveyed shoes industries
but the contents of first aid boxes were not sufficient as per local rules and very few workers
were trained on first aid treatment. Transportation in case of emergency was available in all
industries as ambulances were available within 20 km range and factory and factory owned
vehicles/cars were available at premises, so that they can be used at an emergency situations
to transport sick/injured workers to the nearest dispensary/hospital. Figure 7 shows that 21 %
of shoes industries had adequate fire fighting facilities while remaining 79 % had insufficient
number of fire extinguishers and fire hoses as per local regulations. Social security
compensation was provided to the workers by 64 % of surveyed paint industries. 36 % had
inadequate facilities against social security compensation. The situation of warning signs
placed at appropriate places was encouraging in shoes industries where 42 % had adequate
warning signs facilities. While 58 % had insufficient number of warning signs facilities.
Fig 7 Controls adopted by Shoes Industries (Total 14 industries)
Figure 8 shows various control methods adopted by 13 surgical instruments industries. Only
23 % of these industries conducted air monitoring by Government and private agencies but
only on some occasions when the management intended to get SA 8000 certification. None of
the industry had facilities of biological monitoring. Only 30 % industries had adequate
facilities for waste disposal, while 70 % provided some disposal for harmful waste and
trash/effluents but controls were ineffective in methods of collection and disposal. The
situation of first aid in four out of thirteen (30 %) surveyed industries was adjudged adequate
while remaining 70 % had inadequate first aid facilities. The figure 8 indicates that three out
of thirteen industries had a dispensary at the premises and some workers were trained in the
first aid treatment whereas 77 % had inadequate facilities for emergency treatment of
0 %
20 %
40 %
60 %
80 %
100 %
Air
Monito
ring
Bio
logic
al Monito
ring
Wast
e Dis
posal
Firs
t Aid
Em
ergency
Tre
atment o
f Work
ers
Tra
nsport
ation in
case
of E
merg
...
Fire
Fig
hting F
acilit
ies
Soci
al Secu
rity
Com
pensatio
n
Warn
ing S
igns
Adequate
Available but Inadequate
None
Page 37
- 37 -
workers. As was the case in other industries, transportation in case of emergency was
available to all surgical instruments industries. Fire fighting facilities in 30 % industries were
regarded as adequate while 70 % had some facilities but number of fire extinguishers and fire
hoses were not sufficient compared to the size of plants. The situation of social security
compensation was encouraging as 77 % of surgical industries complied with the Provincial
Employees Social Security Ordinance 1965. The situation of 23 % these industries were
regarded as available but inadequate. Sufficient number of warning signs were placed at
appropriate places in about half of surgical instruments industries and half had inadequate
facilities of warning signs.
Fig 8 Controls adopted by Surgical Instruments Industries (Total 13 industries)
Figure 9 explains the control measures adopted by eleven furniture industries. If we compare
Fig 6 to Fig 9, it become clear that the control measures adopted by furniture industries were
poor compared to other three types of industries. For example no controls were available for
air monitoring, biological monitoring and waste disposal. First aid facilities were not seen in
over 50 % of the surveyed industries. Only two out of eleven industries had adequate first aid
facilities. Over 80 % of furniture industries had no facilities for emergency treatment of
workers. Fire fighting facilities were not seen in 82 % industries. The remaining 18 % had
inadequate fire fighting facilities. Fig 9 shows that 55 % industries had no social security
compensation at all, while 45 % had this system to some of their workers. Warning signs were
not seen in 55 % industries. 18 % industries were provided sufficient number of various
warning signs at appropriate places, whereas 27 % had inadequate facilities of warning signs.
0 %
20 %
40 %
60 %
80 %
100 %
Air
Monito
ring
Bio
logic
al Monito
ring
Wast
e Dis
posal
Firs
t Aid
Em
ergency
Tre
atment o
f Work
ers
Tra
nsport
ation in
case
of E
merg
...
Fire
Fig
hting F
acilit
ies
Soci
al Secu
rity
Com
pensatio
n
Warn
ing S
igns
Adequate
Available but Inadequate
N one
Page 38
- 38 -
Fig 9 Controls adopted by Furniture Industries (Total 11 industries)
8. Recommendations
Pakistan has formulated a new Labour Policy (as the first after 1972), which will guide
administrative, legal and judicial actions of government, employers and workers in realising
labour rights, and their welfare alongwith promotion of social justice [24]. Such collective
commitment to equity is necessary to achieve and sustain rapid growth in a globalised
economy. The existing labour legislation in Pakistan is overlapping in its coverage in several
areas and anomalous in definitions and scope. The variety and complexity of labour laws has
contributed adversely to industrial relations system. Therefore rationalisation/consolidation of
the existing law was needed. It is proposed in the Labour Policy 2002 to simplify and
consolidate these laws into following six laws:
1. Industrial Relations Ordinance
2. Conditions of Employment Ordinance
3. Wages Ordinance
4. Human Resource Development Ordinance
5. Occupational Safety and Health Ordinance
6. Labour Welfare and Social Protection Ordinance.
Occupational Safety and Health of labour is given highest priority in the new Labour Policy
[24]. A law covering all workplaces will be enacted and a National Tripartite Occupational
Safety and Health Council will be established to meet the objective of providing adequate
safety and ensuring compensation to workers. This council will be responsible to set OSH
standards and review them periodically to make the same upto date to meet the needs of the
industry. Other important aspect of this policy is to benefit workers in the agriculture and
informal sector and home- based workers. An inter-ministerial committee shall be constituted
0 %
20 %
40 %
60 %
80 %
100 %
Air
Mon
itorin
g
Bio
logi
cal M
onito
ring
Was
te D
ispo
sal
Firs
t Aid
Em
erge
ncy T
reatm
ent o
f Wor
kers
Tra
nspo
rtat
ion in
case
of E
mer
genc
y
Fire
Fig
htin
g Fac
ilitie
s
Soc
ial S
ecur
ity C
ompe
nsat
ion
War
ning
Sig
ns
Adequate
Available but Inadequate
None
Page 39
- 39 -
to formulate a package of labour welfare measures for the employees in the agriculture sector.
Currently the labour in the informal and home-based sector is not covered by any labour
legislation in Pakistan. The present labour policy aims at gradual extension of coverage of
labour welfare laws to the workers of the informal/home-based sector. Similarly seasonal
workers, which are generally not benefitted from labour welfare laws, will also be provided
the coverage of relevant laws.
From the findings of the study it is evident that grave chemical problems are encountered in
the surveyed industries. The problems seem more acute in smaller industries. A practical and
multi pronged approach is being suggested, which if adopted may reduce the mounting toll of
accidents. These recommendations are given below:
The Legislative Action
The legislation does exist in Pakistan in the form of Factories act 1934. However this
document has undergone only minor revisions since then. It also has the usual lacunae, such
as not being applicable to establishments employing less than ten workers. Chapter III of the
Factories act 1934 relates to the health and safety. The present legislation related to the
control of chemical hazards at the workplaces and OSH in general need thorough revision.
This legislation cannot cope with the problems presented by the modern day processes. Most
of the occupations declared "Hazardous" under the Factories Rules are no more relevant these
days. Much more hazardous processes can be found in the industry. While the use of
pesticides is regulated by legislation, the use of toxic and sometimes carcinogenic chemicals
goes on in the industry freely. A full chapter in the Factories Act needs to be adopted dealing
with the chemical hazards. A mechanism for the adoption of occupational exposure limits for
certain hazardous chemicals should be prescribed. Small sized enterprises using chemicals
should also be brought in the ambit of legislation.
Any legislation, until is backed up by professional and technical implementing agencies, will
remain ineffectual. The present institutional framework in all the provinces needs
strengthening by inducting professionally competent manpower and by bringing in necessary
equipment. Strong interaction between the personnel in such institutions and the field
inspecting staff of the labour department is essential for meaningful implementation of the
chemical safety related legislation and occupational safety and health in the country.
Training and Education
There is a shortage of qualified manpower in the field of occupational safety and health in the
country. This gap can be filled in by introducing the component of occupational safety and
health, especially chemical safety in the syllabi of the technical and professional courses
related to the engineering and medical subjects. Also the students at the school level need to
be told of basic principles of chemical safety, so they may avoid unnecessary hazards during
day to day life and a safety culture can be promoted in the country. Besides the technical
manpower, the non-technical target groups including workers, supervisors, managers, factory
inspectors and decision-makers from the public and private sectors need basic training in the
occupational safety and health.
OSH Training to the Medical Doctors
This aspect of training is very important because the doctors in Pakistan do not have enough
education/training facilities on occupational health and safety. Information on occupational
Page 40
- 40 -
diseases is also lacking in the country. The development of a mechanism to identify prevailing
occupational diseases is crucially important in promoting preventive measures. The training
of medical doctors who would be involved in the diagnosis of occupational diseases (for
example doctors employed by Employees Social Security Institutions in the whole country)
has to be widely organised. There has been continuing efforts for the training and education of
occupational physicians in the European Union countries [19]. Similar efforts can be started
in Pakistan keeping in view of local situations.
Workers' Right to Know
There are certain areas in which Government of Pakistan can move fairly rapidly. Following
the lead of the pharmaceutical industries and pesticides business, which provides
comprehensive information in the local language to the consumers of their products, suppliers
of chemicals, both national and international, must clearly label all their products, and submit
a material safety data sheets (MSDS) in the local language. In case of multinationals, the
original MSDS can also be submitted along with the translation. This is feasible because,
while the end users of many hazardous chemicals like benzene may be scattered and even
poorly documented, the manufacturers and suppliers are generally limited, and can be held
responsible for providing complete information to their customers. This would thus be a
logical and enforceable first step in disseminating information about chemical hazards to the
workplaces. The larger the plant and the more highly educated the workforce, the earlier
chemical hazards will be identified by management, safety and health professional, and the
workers themselves. This knowledge would then be expected to diffuse down at least to some
extent to other workers in the same occupation who work in smaller plants. MSDS would also
be a reference source to primary health care providers looking after workers and their families
who are often otherwise unable to access information regarding the health hazards of
chemicals their patients are exposed to.
Occupational Hygiene Programmes
At present there is no feasible system of exposure monitoring in most of the industries in
Pakistan. There is a need to frame legislation so that a periodic monitoring of work
environment in industries could be introduced. This will help in recognizing and evaluating
various hazards present at the workplaces, and to recommend the appropriate control methods
to the industrial establishments. In the absence of a strong legislative framework, other
incentives will have to be given. For many export oriented manufacturers, such as carpets and
surgical instrument industries, these are already in place in terms of orders received only if
industries comply with certain minimum standards like minimum age of employee, minimum
wage, conditions and environment of work, and so on [15]. This interest and activism on the
part of consumers can and must be encouraged, not just at the international level, but also at
the national, regional, and local level.
Concerning to the substitution of hazardous chemicals at the workplaces, the management of
the factories should try to substitute hazardous chemicals to less hazardous chemicals [18].
The management of factories should start to conduct risk assessment surveys in order to find
out different safety, health and environmental problems faced by their industries. As a result
their working conditions and environment will be improved [20]. Recently a similar approach
has been used in some surgical instrument industries in Sialkot, Pakistan, but the reason was
to get their plants SA 8000 certified. This was done because of the requirements of their
foreign buyer's. The thinking of the local businessmen has to change if they want to provide
safe working conditions and environment to the workers.
Page 41
- 41 -
Role of Employers' and Workers' Organisations
Employers' and workers' organisations can play an important role to improve the safety,
health and working conditions and environment. For example, the Malaysian Employers'
Federation (MEF) in 1996 has recruited a specialist in occupational safety and health in order
to reinforce its functions to assist its members. In 1997, The Employers' Confederation of
Thailand (ECOT) established a new committee on OSH and environment and recruited a staff
member responsible for the activities under the committee. The Mongolian Employers
Federation (MONEF) launched OSH training programme based on the ILO WISE approach
in 1998. Workers organisations in China and Vietnam have extensive training programmes
[16]). Moreover the workers unions should include safety as a bargaining issue in the charter
of demands. They should not demand compensation for dust, fumes or heat, but they should
demand to remove or reduce the physical and chemical hazards through risk assessment.
Safety should be given importance over wages, daily allowances or bonuses. The workers
organisations should establish safety structure within unions, educate themselves and their
members, and find active members who can visit the workplaces, and talk to workers about
health and safety problems and hazards [17].
Improvement in Compilation of Statistics and Analysis
Statistics on occupational accidents and diseases are the basis for priority setting for
preventive actions as well as for concrete programmes for identified sectors. It should be done
in close linkage among workmen compensation and social security schemes and other related
institutions. The concerned authorities should do proper entries of occupational accidents and
diseases in the labour force surveys.
Export of Hazards
There has been a growing trend for transfer of hazardous technologies or processes to the
developing countries. The processes no more feasible in the developed countries, due to high
cost of environmental and safety and health measures, are shifted to the developing countries.
Similarly some chemical substances banned in the developed world are exported to the
developing countries. The solution of such problems need a concerted effort at the
international level making it impossible to transfer hazards from one country to the other.
Setting up of National OSH Training Mechanisms
Training of managers, supervisors, workers and inspectors of factory inspectorates is the most
important aspect in the promotion of occupational safety and health. Such training should be
available throughout the country. This is possible only when there is enough legislation to
support the activities. For example in Thailand, the safety officer training has been organised
as a key legal obligation of employers with 100 or more workers. Though Centre for the
Improvement of Working Conditions and Environment (CIWC&E) in Lahore played an
important role in promoting OSH training in the country, it cannot organise all the necessary
training in Pakistan. To do so CIWC&E should be strengthened to recruit more qualified
personnel, construction of auditorium and hostel facilities at their site and more technical
equipment to support the activities. Other possibility is that private sector could be
considered. For example the setting up of a semi-Governmental body, such as Korea
Occupational Safety and Health Agency (KOSHA), National Institute for Occupational Safety
and Health (NIOSH) in Malaysia, and Japan Industrial safety and Health Association (JISHA)
Page 42
- 42 -
could provide a strong basis for the establishment of a training institutions' network [16]. In
Pakistan chamber of commerce and industry can play an important role in this regard.
Page 43
- 43 -
References
1. People and Work, Research Reports 44 Work and Health Country Profiles, Country
Profiles and National Surveillance Indicators in Occupational Safety and Health, Jorma
Rantanen, Timo Kauppinen, Jouni Toikkanen, Kari Kurppa, Suvi Lehtinen, Timo Leino,
Finnish Institute of Occupational Health, Helsinki Finland 2001.
2. Economic Survey 2000-2001, Government of Pakistan, Economic Advisor's Wing, Finance
Division, Islamabad, Pakistan, June 2001
3. http://www.pak.gov.pk/public/gov/basic_facts_2html
4. Pakistan Statistical Yearbook 2001, Federal Bureau of Statistics, Statistics Division,
Government of Pakistan, Islamabad, April 2001
5. Labour Force Survey 1999-2000, Federal Bureau of Statistics, Statistics Division,
Government of Pakistan, Islamabad, July 2001
6. Selected world development indicators, World Bank, 1818 H, Street NW, Washington, DC,
20433 USA.
7. Facilities for secured workers under social security scheme, a leaflet compiled by Sh.
Mehmood-ul-Hassan Tahir, Zia-ud-Din Ahmad Siddiqui, Punjab Employees Social Security,
Lahore, Pakistan.
8. www.who.int/whr/2000/en/report/htm (World Health Report 2000)
9. M. Shafi, P. Shafi, Law of factories (Factories Act 1934), Bureau of Labour Publications, 8
Business centre, Mumtaz Hasan Road, P.O Box No.5833, Karachi-74000, Pakistan, 9th ed.,
1997. 72p.
10. International Labour Organisation, Geneva, Switzerland.
11. The Punjab weekly gazette April 13, 1994, Government of the Punjab, Labour and
Manpower department, Lahore, Pakistan.
12. www.punjab.gov.pk/directorate_of_labour_welfare.htm
13. Saarinen L & Monyo R. Industrial hygiene problems in Tanzania. In: Proceedings of the
first ILO-Finnish-Tanzanian symposium on occupational health, Ed. by Tuppurainen M and
Kurppa K. International Labour Organisation (Geneva), Ministry of Labour and Manpower
Development, Factories Inspectorate (Dar-es-Salam), Institute of Occupational Health
(Helsinki), Helsinki. Finland, 1985, pp. 110-31
14. Schlunssen V, Vinzents PS, Mikkelsen, AB, Schaumburg I. Wood dust exposure in the
Dannish furniture industry using conventional and passive monitors. Annals of Occupational
Hygiene 2001;45:157-164.
15. Nicholas, M: Third World families at work: Child labour or child care? Harvard Business
Review. January-February: 12-23 (1993).
16. Occupational Safety and Health (OSH) in Asia and the Pacific-Recent challenges for the
new millennium by Seiji Machida, and Pia Markkanen. Asian Pacific Newsletter in
Occupational Safety and Health, Vol. 7, No 1, March 2000, Finnish Institute of Occupational
Safety and Health, Helsinki, Finland
17. Occupational Safety and Health in India: an attempt to estimate the real number of work
related deaths, Stirling Smith, Consultant in workers education, Labour and Society
International, Projects office, Commerce House, Bridgeman Place, Bolton BL2 1DW, UK
1999.
18. Mirza T. Gerin M, Begin D, Drolet D. A study on the substitution of trichloroethylene as a
spot remover in the textile industry: AIHAJ 61:431-438 (2000).
Page 44
- 44 -
19. Franco G. Occupational physicians' education and training across European Union
countries. International Archives of Occupational and Environmental Health 1999; 72: 338-
342.
20. Beth-Hubner M. International trends and concerns related to chemical safety. International
Archives of Occupational and Environmental Health 1999; 72 (Suppl 3): M75-M80.
21. Occupational Health Services in Finland in 2000-a survey of the structure, input and
output, Ministry of Social Affairs and Health and Finnish Institute of Occupational Health,
Helsinki, Finland.
22. Employees Social Security Institutions of Pakistan, Islamabad, Pakistan.
23. Encyclopaedia of Occupational Health and Safety. 4th ed. International Labour Office,
Geneva, Switzerland, 1998. 4 V.
24. Labour Policy 2002, Ministry of Labour, Human Resources and Overseas Pakistanis,
Government of Pakistan, Islamabad, Pakistan.
Page 45
- 45 -
Annex-1
Questionnaire
RISK ASSESSMENT OF CHEMICALS
1. General Information
1.1 Name of factory:
___________________________________________________________________________
___
___________________________________________________________________________
___
1.2
Address:_________________________________________________________
___
___________________________________________________________________________
___
___________________________________________________________________________
___
1.3 Telephone number and
fax:_____________________________________________
___________________________________________________________________________
___
1.4 Contact
Person:_______________________________________________________
1.5 Date of
visit:_________________________________________________________
1.6 Year of
operation:_____________________________________________________
1.7 Types of
operation:____________________________________________________
___________________________________________________________________________
____
Page 46
- 46 -
1.8 Raw
materials:________________________________________________________
___________________________________________________________________________
____
___________________________________________________________________________
____
1.9 Processing aids
(intermediates):___________________________________________
___________________________________________________________________________
_____
1.10
Products:_________________________________________________________
____
___________________________________________________________________________
_____
1.11 Bye
products:__________________________________________________________
___________________________________________________________________________
_____
1.12 Please describe the process in few lines:
____________________________________
___________________________________________________________________________
_____
___________________________________________________________________________
_____
___________________________________________________________________________
_____
1,13 Number of workers: Male Female Total
_____ _____ _____
1.14 Working hours:
Start Time Finnish Time Break if any No. of free
days per week
Page 47
- 47 -
(First column only if there is no shift work)
1.15 Where do the workers eat (please tick the relevant box)
At the premises In a nearby restaurant
At the canteen of enterprise
Other arrangements (Please describe)
1.16 Where do the workers go for toilet/washing?
At the premises In a nearby premises
Other arrangements (Please describe)
1.17 How do you describe the general housekeeping and storage?
Good Dirty Normal
1.18 Please describe special problems of storage and
housekeeping:________________
___________________________________________________________________________
__
___________________________________________________________________________
__
___________________________________________________________________________
__
1.19 About accident and illness record:
Are accidents reported Yes No
How individuals report an accident?
______________________________________
___________________________________________________________________________
___
___________________________________________________________________________
____
1.20 Whether personal protective equipment (PPE) used
Yes No
Page 48
- 48 -
Which kind of PPE are used
Local Imported
Do you have training system in the use of PPE?
Yes No
If yes, please
describe______________________________________________________________
___________________________________________________________________________
_____
___________________________________________________________________________
_____
-Do you have facilities available at your factory for the maintenance of personal
protective equipment?
Yes No
If yes, please
describe______________________________________________________________
___________________________________________________________________________
_____
1.21 Any methods employed for solid, liquid or gas waste disposal:
_________________________
___________________________________________________________________________
_____
___________________________________________________________________________
_____
2. Information about chemicals and their hazards
2.1 List of chemicals used in the enterprise
(Please continue on a separate page, if space provided is insufficient)
Name of
chemical (from
container or other
source)
Ingredients (from
container or other
source)
Is label provided
on container
Yes No
If yes in which
language?
Quantity used (in
Kg/Litres)
(whichever is
relevant)
Weekly Monthly
Page 49
- 49 -
2.2 Quantity of each chemical stored on the
premises:_____________________________________
___________________________________________________________________________
_____
___________________________________________________________________________
_____
2.3 Describe how are chemicals transported or transferred within the enterprise? -
_______________
___________________________________________________________________________
_____
___________________________________________________________________________
_____
___________________________________________________________________________
_____
How are chemicals used?
Name of chemical How it is used How often daily Exposure level (if
monitored)
Page 50
- 50 -
(Use more space on another page if needed)
2.5 Control measures adopted at the enterprise (tick the relevant box)
Control method Adopted
Yes No
If Yes?
Adequate Inadequate
Remarks if necessary
Substitution
Isolation
Natural Ventilation
Forced Ventilation
Local Exhaust
Ventilation
Other Engineering
Controls
Personal Protection
Others
2.7 How are workers exposed to chemical hazards? (Tick the relevant box)
Name of
chemical/Ingr
edient
Approx. No.
of workers
exposed
Do the workers frequently suffer from (Tick the relevant boxes)
Headache
Respiratory problems
Solvent addiction
Fevers
Gastrointestinal problems
Sickness related absence
Other problems (describe)
Page 51
- 51 -
3. Fire, Explosion, and Spillage hazards (Tick the relevant boxes)
3.1
Fire Hazard
Low Medium High None
Explosion Hazard
Low Medium High None
Spillage Hazard
Low Medium High None
3.2 Did a fire/explosion take place recently. Yes
No
If yes, describe when, how and consequences
___________________________________________
___________________________________________________________________________
_____
___________________________________________________________________________
_____
3.3 Other problems created by the enterprise
_______________________________________________
___________________________________________________________________________
_____
3.4 To the surrounding communities/localities (describe)
__________________________________
___________________________________________________________________________
_____
4. Control Measures/Facilities available at the enterprise (Tick the relevant boxes)
Control
method/facility
Adequate Inadequate None Not needed
Air monitoring
Biological
monitoring/health
surveillance
Waste disposal
First aid
Emergency
treatment of
workers
Transportation in
case of
emergency
Fire fighting
Page 52
- 52 -
facilities
Social security
/compensation
Warning signs
Others