34
September 2017 Country Risk Report A Quarterly Guide to Country Risks

September 2017
Country Risk Report A Quarterly Guide to Country Risks

Country Risk Report September 2017
Summary: Financial markets’ risk-on mood tightens sovereign
spreads beyond fundamentals
• Greece was upgraded by Moody’s and Fitch. Chile was downgraded by S&P and Fitch. Qatar
was downgraded by the three agencies. South Africa was downgraded by Moody’s
• Overall, the net aggregate of vulnerabilities seem to be improving in most EMs (less external
vulnerabilities) and seems stable in the Periphery of EU, lower private leverage, while old
problems persist (high unemployment, high public and external debt, etc.)
• Leverage growth continues to moderate in China, although housing price growth is still high. Its
accumulated excess leverage still prompts a significant warning
• However, we observe signs of fast growth in private leveraging and in housing prices in
some Advanced Economies such as Canada, Australia, Norway and some North-European
countries (Belgium, Finland). More recently, some warning signals are also showing up in USA
related to faster increase of credit.
• Global risk aversion has been steadily decreasing since Feb-2016, strongly tightening
sovereign spreads. The bulk of sovereign CDS are at, or close to, their minimum historical
levels, which should warn us that there is no much room for further decreases
• The continued decrease in sovereign spreads has caused that we continue to see more
countries with upgrade rather than downgrade pressure
• The reduction in downgrade pressure was most noticeable in LatAm, whereas upgrade
pressure increased specially in EM Europe and Asia
Ratings agencies
BBVA Research
Financial Markets
Country Risk

Country Risk Report September 2017
Click here to modify the style of the master title Index
01
02
03
Sovereign Markets and Ratings Update Evolution of sovereign ratings
Evolution of sovereign CDS by country
Market downgrade/upgrade pressure
Financial Tensions and Global Risk Aversion Global Risk Aversion Evolution According to Different Measures
Financial Tensions
Macroeconomic Vulnerability and In-house
Regional Country Risk Assessment Equilibrium CDS by regions
BBVA-Research sovereign ratings by regions
Vulnerability Radars by regions
Public and Private debt levels
04
•
Assessment of Financial and External Disequilibria
Private Credit Growth by Country
Housing Prices Growth by Country
Early Warning System of Banking Crises by regions
Early Warning System of Currency Crises by regions
Vulnerability Indicators Table by Country
Methodological Appendix • 3
Country Risk Report September 2017
01 Sovereign Markets and Ratings
Update
Evolution of sovereign CDS by country
Evolution of sovereign ratings
Market downgrade/upgrade pressure
4

Country Risk Report September 2017
Source: BBVA Research by using S&P, Moody’s and Fitch data
Sovereign Rating Index: An index that translates the three important rating agencies ratings letters codes (Moody’s, Standard & Poors and Fitch) to numerical positions from 20 (AAA) to
default (0). The index shows the average of the three rescaled numerical ratings.
• No major changes in the average rating
of the main economic areas
• Greece was upgraded by Moody’s and
Fitch. Slovenia and Iceland were
upgraded by S&P and Fitch respectively
• Chile was downgraded by S&P and
Fitch. Qatar was downgraded by the
three agencies. South Africa
downgraded by Moody’s and Venezuela
by S&P
AAA
AA+
AA
AA -
A+
A
A -
BBB+
BBB
BBB -
BB+
BB
BB -
B+
B
B -
CCC+
CCC
CCC -
CC
D
Core
Periphera
l
Em
Euro
pe
Lat
am
Em
Asi
a
USA
Core Peripheral
EM
Europe
LatAm EM Asia USA
Sovereign markets and rating agencies update
Sovereign Rating Index 2011-17
INDEXSUMMARY
5

Country Risk Report September 2017
Sovereign markets and rating agencies update
Sovereign Rating Index 2011-17: Developed Markets
INDEX
Core
Peri
phera
l
Em
Euro
pe
Lata
m
Em
Asi
a
USA
Ita
ly
Sp
ain
Be
lgiu
m
Gre
ece
Po
rtu
ga
l
Irela
nd
AAA
AA+
AA
AA-
A+
A
A-
BBB+
BBB
BBB-
BB+
BB
BB-
B+
B
B-
CCC+
CCC
CCC-
CC
D
M,F
No
rw
ay
Sw
ede
n
Au
str
ia
Ge
rm
an
y
Fra
nc
e
Ne
the
rla
nd
s
UK
No
rway
Sw
ed
en
Au
str
ia
Germ
an
y
Fra
nc
e
Net
her
lands
UK
.
Italy
Sp
ain
Belg
ium
Gre
ece
Po
rtu
ga
l
Irela
nd
US
A
Core Peripheral USA
Source: BBVA Research
Upgrade Downgrade SP: Standard & Poor’s F: Fitch M: Moody’s

Country Risk Report September 2017
SP: Standard & Poor’s M: Moody’s F: Fitch Rebaja Aumento
Source: BBVA Research 7
Sovereign markets and rating agencies update
Sovereign Rating Index 2011-17: Emerging Markets
SP, F
AAA
AA+
AA
AA-
A+
A
A-
BBB+
BBB
BBB-
BB+
BB
BB-
B+
B
B-
CCC+
CCC
CCC-
CC
D
Turk
ey
Russia
Pola
nd
Czech
Rep
Hungary
Bulg
aria
Rom
ania
Cro
atia
Chin
a
Kore
a
Th
aila
nd
Indon
esi
a
Mala
ysia
Ph
ilip
pin
es
India
Me
xic
o
Bra
zil
Ch
ile
Co
lom
bia
Peru
Arg
entina
Uru
gua
y
Tu
rkey
Ru
ssia
Po
lan
d
Czech
Rep
Hu
ng
ary
Bu
lga
ria
Ro
man
ia
Cro
ati
a
Mexic
o
Bra
zil
Ch
ile
Co
lom
bia
Peru
Arg
en
tin
a
Uru
gu
ay
Ch
ina
Ko
rea
Th
ail
an
d
Ind
on
esia
Mala
ysia
Phili
ppin
es
Ind
ia
EM Europe LatAm EM Asia
Upgrade Downgrade SP: Standard & Poor’s F: Fitch M: Moody’s
INDEX

Country Risk Report September 2017
8
A continuation in calmed CDS sovereign markets was observed. Most countries are at, or close to, their minimum historical levels, which should warn us that there is not much
room for further decreases
Sovereign Markets and Rating Agency Update
Sovereign CDS Spreads (August 30th)
Changes (last six months
MoM)
USA
UK
Norway
Sweden
Austria
Germany
France
Netherlands
Italy
Spain
Belgium
Greece
Portugal
Ireland
Turkey
Russia
Poland
Czech Republic
Hungary
Bulgaria
Romania
Croatia
Mexico
Brazil
Chile
Colombia
Peru
Argentina
China
Korea
Thailand
Indonesia
Malaysia
Philippines
India
Asia
2014 2015 2016 2017
Develo
ped
Mark
ets
EM
Eu
rop
eLA
TA
M
2011 2012 2013 M A M J J A# # # # # #
# # # # # #
# # # # # #
# # # # # #
# # # # # #
# # # # # #
# # # # # #
# # # # # #
# # # # # #
# # # # # #
# # # # # #
# # # # # #
# # # # # #
# # # # # #
# # # # # #
# # # # # #
# # # # # #
# # # # # #
# # # # # #
# # # # # #
# # # # # #
# # # # # #
# # # # # #
# # # # # #
# # # # # #
# # # # # #
# # # # # #
# # # # # #
# # # # # #
# # # # # #
# # # # # #
# # # # # #
# # # # # #
# # # # # #
# # # # # #
0-5050-
100
100-
200
200-
300
300-
400
400-
500
500-
600>600
20.0 70.0 ### ### ### ### ### ###
<
(-100)
(-100)-
(-50)
(-50) -
(-25)
(-25) -
(-5)
(-5) -
55-25 25-50
50-
100>100
### ### ### ### 0.0 ### 20.0 35.0 ##
Greek CDS continues to
experience a significant decrease
in spread levels.
EM Europe CDS saw a reduction or
remain fairly stable.
LatAm CDS have seen relative
stability (except for slight volatility in
Argentina) with slight decreases in
Brazil, Peru and Colombia.
EM Asia experienced stability as well,
except for some volatility in South
Korea.
Continued stability in advanced
economies. France continues to see
a slight lowering in spread levels.
INDEXSUMMARY
Source: Datastream & BBVA Research

Country Risk Report September 2017
The reduction in downgrade pressure continued across the board in line with the decrease in CDS spreads, whereas upgrade pressure increased especially in EM Europe
and Asia
Source: BBVA Research
Agencies’ rating downgrade pressure gap (August 30th 2017) (difference between CDS-implied rating and actual sovereign rating, in notches)
Sovereign markets and agency ratings update
-6
-5
-4
-3
-2
-1
0
1
2
3
4
5
6
US
A
UK
Norw
ay
Sw
ede
n
Austr
ia
Ge
rma
ny
Fra
nce
Neth
erlan
ds
Ita
ly
Spa
in
Belg
ium
Gre
ece
Port
uga
l
Ire
land
Tu
rkey
Russia
Pola
nd
Cze
ch
Re
p
Hung
ary
Bulg
aria
Rom
ania
Cro
atia
Me
xic
o
Bra
zil
Chile
Colo
mbia
Peru
Arg
en
tin
a
Chin
a
Kore
a
Th
ailan
d
Ind
one
sia
Ma
laysia
Philip
pin
es
Ind
ia
This Quarter 1 Quarter ago 1 Year ago
Core Peripheral EM Europe LatAm Asia
Upgrade pressure
across EM Europe
saw an increase,
except for Czech
Republic Pressure decline
experienced
across LatAm
-6.0
-5.0
-4.0
-3.0
-2.0
-1.0
0.0
1.0
2.0
3.0
4.0
5.0
6.0
Strong
downgrade
pressure
Strong
upgrade
pressure
Downgrade
pressure
Neutral
Upgrade
pressure
Downgrade
pressure for
Russia and
Turkey
diminished
Belgium, Spain,
U.K. and Ireland
saw upgrade
pressure increases
Slight downgrade
pressure for Italy
INDEXSUMMARY
9
Country Risk Report September 2017
02 Financial Tensions and Global
Risk Aversion
Financial Tensions
Global Risk Aversion Evolution according to Different Measures
10
Country Risk Report September 2017
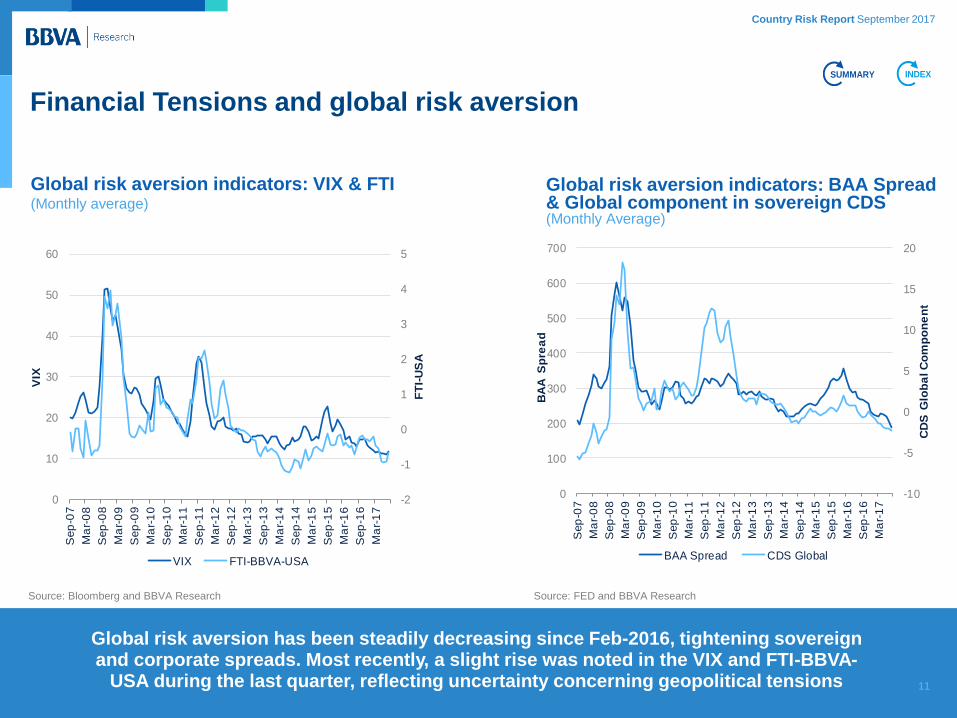
Global risk aversion indicators: BAA Spread & Global component in sovereign CDS (Monthly Average)
Global risk aversion has been steadily decreasing since Feb-2016, tightening sovereign and corporate spreads. Most recently, a slight rise was noted in the VIX and FTI-BBVA-
USA during the last quarter, reflecting uncertainty concerning geopolitical tensions
Source: Bloomberg and BBVA Research
Global risk aversion indicators: VIX & FTI (Monthly average)
Financial Tensions and global risk aversion
-2
-1
0
1
2
3
4
5
0
10
20
30
40
50
60
Sep
-07
Ma
r-0
8
Sep
-08
Ma
r-0
9
Sep
-09
Ma
r-1
0
Sep
-10
Ma
r-1
1
Sep
-11
Ma
r-1
2
Sep
-12
Ma
r-1
3
Sep
-13
Ma
r-1
4
Sep
-14
Ma
r-1
5
Sep
-15
Ma
r-1
6
Sep
-16
Ma
r-1
7
FT
I-U
SA
VIX
VIX FTI-BBVA-USA
-10
-5
0
5
10
15
20
0
100
200
300
400
500
600
700
Sep
-07
Ma
r-0
8
Sep
-08
Ma
r-0
9
Sep
-09
Ma
r-1
0
Sep
-10
Ma
r-1
1
Sep
-11
Ma
r-1
2
Sep
-12
Ma
r-1
3
Sep
-13
Ma
r-1
4
Sep
-14
Ma
r-1
5
Sep
-15
Ma
r-1
6
Sep
-16
Ma
r-1
7
CD
S G
lob
al C
om
po
ne
nt
BA
A S
pre
ad
BAA Spread CDS Global
INDEX
11
Source: FED and BBVA Research
SUMMARY

Country Risk Report September 2017
12
Financial tensions (FT) are currently at remarkable low levels and declining, with the exception of the U.S. in August. The last quarter saw a further lowering and overall stability
across the board
Source: BBVA Research
BBVA Research Financial Stress Map
Financial tensions and global risk aversion
Changes (last six months MoM)
CDS Sovereign
Equity (volatility)
CDS Banks
Credit (corporates)
Interest Rates
Exchange Rates
Ted Spread
Financial Tension Index
CDS Sovereign
Equity (volatility)
CDS Banks
Credit (corporates
Interest Rates
Exchange Rates
Ted Spread
Financial Tension Index
USA FTI
Europe FTI
EM Europe FTI
Czech Rep
Poland
Hungary
Russia
Turkey
EM Latam FTI
Mexico
Brazil
Chile
Colombia
Perú
EM Asia FTI
China
India
Indonesia
Malaysia
Philippines
La
tam
EM
As
ia
2013
G2
EM
Eu
rop
e
2013
US
AE
uro
pe
2011 2012 20162015 2017
20172011
2014
2012 201620152014
MA MJ J A
# # # # # #
# # # # #
# # # # # #
# # # # # #
# # # # # #
# # # #
# # # # #
# # # #
# # # # # #
# # # # #
# # # # #
# # # # # #
# # # # # #
# # # #
# # # # #
# # # # #
MA MJ J A
# # # #
# # # # #
# # # # # #
# # # # # #
# # # # # #
# # # # # #
# # # # # #
# # #
# # # # #
# # # # # #
# # # # # #
# # # # #
# # # # # #
# # # # # #
# # # # #
# # # #
# # # # #
# # # # # #
# # # #
# # # # # #
Color scale for Index in levels Color scale for monthly changes
The U.S. experienced relative stability
until August, where a slight increase in
tensions was observed. Europe was
relatively more stable. Both saw slight
tensions in relation to exchange rates
EM Europe continues to display
remarkable stability in FT
EM Asia continues experiencing mild to
decreasing FT across the board
FT in LatAm, like other regions, displays
stability and gradual lowering. Brazil seems
to experience some volatility due to
political tensions
INDEX
No Data
Very Low Tension (<1 sd)
Low Tension (-1.0 to -0.5 sd)
Neutral Tension (-0.5 to 0.5)
High Tension (0.5 to 1 sd)
Very High Tension (>1 sd)
#
#
#
#
#
< -1.0
(-1)-(-0.75)
(-0.75) - (-
0.25)
(-0.1) - 0.1
(-0.25) - (-0.1)
#
#
#
#
0.1 - 0.25
0.25 -
0.750.75 - 1
>1

Country Risk Report September 2017
03 Macroeconomic vulnerability and in-house
Regional country risk assessment
BBVA-Research sovereign ratings by regions
Equilibrium CDS by regions
Vulnerability Radars by regions
Public and private debt levels
13
Country Risk Report September 2017
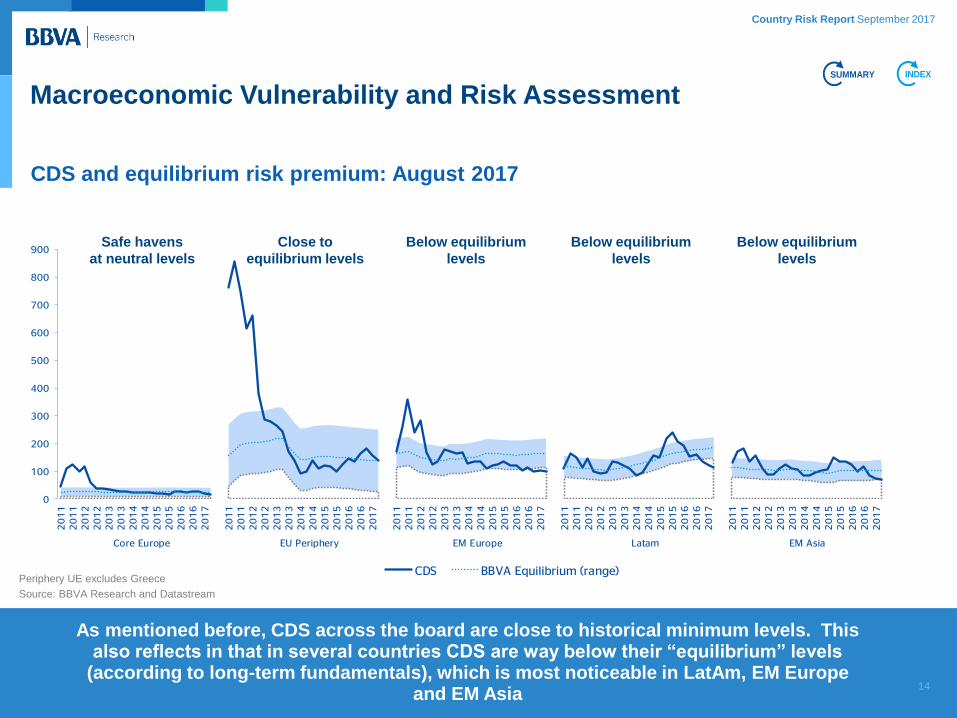
CDS and equilibrium risk premium: August 2017
Macroeconomic Vulnerability and Risk Assessment
As mentioned before, CDS across the board are close to historical minimum levels. This also reflects in that in several countries CDS are way below their “equilibrium” levels
(according to long-term fundamentals), which is most noticeable in LatAm, EM Europe and EM Asia
0
100
200
300
400
500
600
700
800
900
20
11
20
11
20
12
20
12
20
13
20
13
20
14
20
14
20
15
20
15
20
16
20
16
20
17
20
11
20
11
20
12
20
12
20
13
20
13
20
14
20
14
20
15
20
15
20
16
20
16
20
17
20
11
20
11
20
12
20
12
20
13
20
13
20
14
20
14
20
15
20
15
20
16
20
16
20
17
20
11
20
11
20
12
20
12
20
13
20
13
20
14
20
14
20
15
20
15
20
16
20
16
20
17
20
11
20
11
20
12
20
12
20
13
20
13
20
14
20
14
20
15
20
15
20
16
20
16
20
17
Core Europe EU Periphery EM Europe Latam EM Asia
CDS BBVA Equilibrium (range)
Safe havens
at neutral levels
Close to
equilibrium levels
Below equilibrium
levels
Below equilibrium
levels
Below equilibrium
levels
INDEX
14
Periphery UE excludes Greece
Source: BBVA Research and Datastream
SUMMARY
Country Risk Report September 2017
010203040506070809101112131415161718192021
20
12
20
13
20
14
20
15
20
16
20
17
20
12
20
13
20
14
20
15
20
16
20
17
20
12
20
13
20
14
20
15
20
16
20
17
20
12
20
13
20
14
20
15
20
16
20
17
20
12
20
13
20
14
20
15
20
16
20
17
20
12
20
13
20
14
20
15
20
16
20
17
G7 Core Europe EU Periphery EM Europe Latam EM Asia
Rating Agencies BBVA-Research
AAAAA+AAAA-A+AA-BBB+BBBBBB-BB+BBBB-B+BB-CCC+CCCCCC-CC
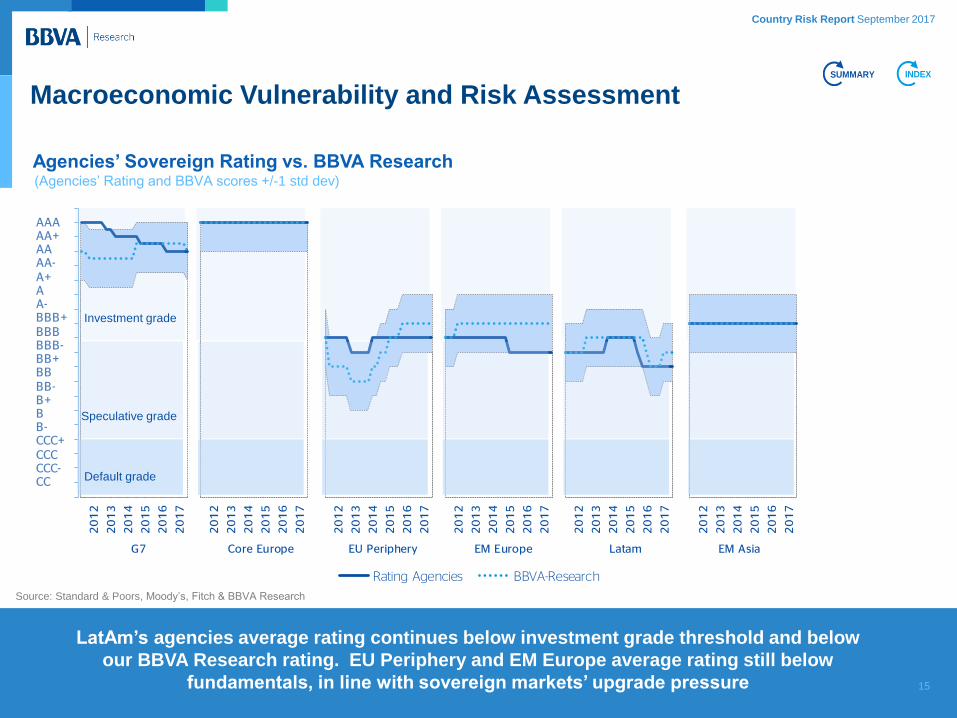
Agencies’ Sovereign Rating vs. BBVA Research
Source: Standard & Poors, Moody’s, Fitch & BBVA Research
LatAm’s agencies average rating continues below investment grade threshold and below
our BBVA Research rating. EU Periphery and EM Europe average rating still below
fundamentals, in line with sovereign markets’ upgrade pressure
(Agencies’ Rating and BBVA scores +/-1 std dev)
Macroeconomic Vulnerability and Risk Assessment INDEXSUMMARY
15
Investment grade
Speculative grade
Default grade

Country Risk Report September 2017
Macroeconomic Vulnerability and Risk Assessment
(Relative position for the developed countries. Max risk=1, Min risk=0. Previous year data is shown as a dotted line)
Public and external debt levels have kept worsening in several developed economies. Equity valuation risks and
political instability are at elevated levels of vulnerability
G7: Public, external debt and equity levels remain high. Unemployment and corporate leverage decreasing
Core Europe: Corporate leverage slightly declining while political instability is rising. Equity vulnerability increases and external debt remains high.
Periphery EU: Public, external debt and
unemployment levels remain elevated, while
equity and political stability are also estimated as
high risk.
Developed markets: vulnerability radar 2017
High risk Moderate Risk Safe
0.0
0.1
0.2
0.3
0.4
0.5
0.6
0.7
0.8
0.9
1.0
12
3
4
5
6
7
8
9
10
1112
13
14
15
16
17
18
19
20
21
0.0
0.1
0.2
0.3
0.4
0.5
0.6
0.7
0.8
0.9
1.0
12
3
4
5
6
7
8
9
10
1112
13
14
15
16
17
18
19
20
21
0.0
0.1
0.2
0.3
0.4
0.5
0.6
0.7
0.8
0.9
1.0
12
3
4
5
6
7
8
9
10
1112
13
14
15
16
17
18
19
20
21
INDEXSUMMARY
Macro: (1) GDP (% YoY) (2) Prices (% YoY) (3) Unemployment (% LF)
Fiscal: (4) Structural balance (%) (5) Interest rate – GDP %YoY (6) Public debt (% GDP)
Liquidity: (7) Debt by non-residents (%total) (8) Financial needs (%GDP) (9) Financial pressure (% GDP)
External: (10) External debt (%GDP) (11) RER appreciation (%YoY) (12) CAC balance (%GDP)
Credit: (13) Household (%GDP) (14) Corporate (%GDP) (15) Credit-to-deposit (%)
Assets: (16) Private credit to GDP (%YoY) (17) Housing Prices (%YoY)
(18) Equity (%)
Institutional: (19) Political stability (20) Corruption (21) Rule of law 16
Country Risk Report September 2017
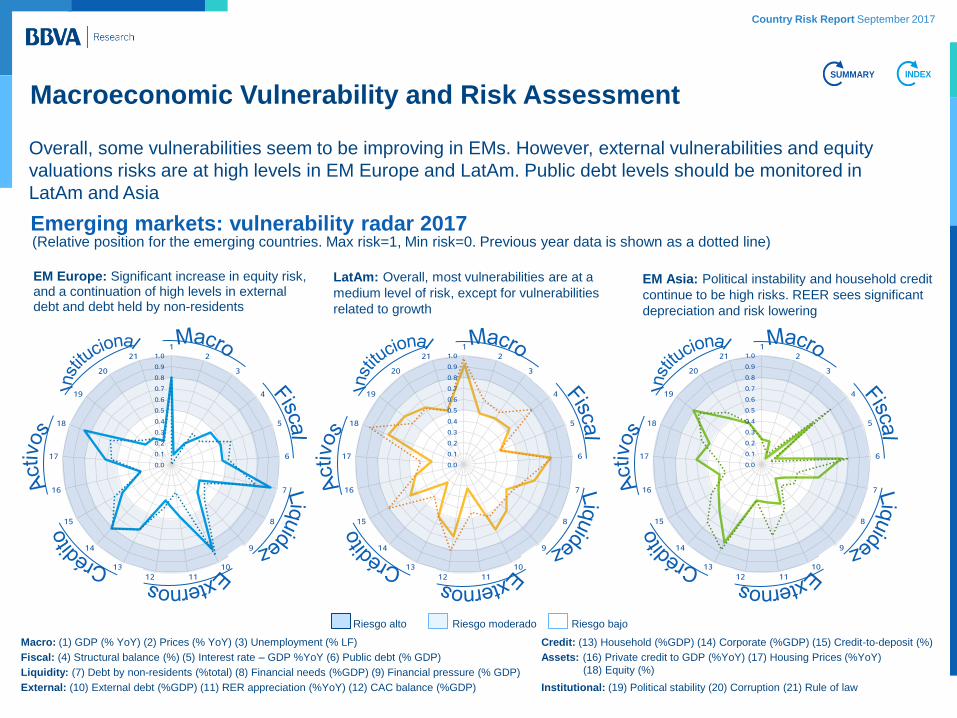
(Relative position for the emerging countries. Max risk=1, Min risk=0. Previous year data is shown as a dotted line) Emerging markets: vulnerability radar 2017
Overall, some vulnerabilities seem to be improving in EMs. However, external vulnerabilities and equity
valuations risks are at high levels in EM Europe and LatAm. Public debt levels should be monitored in
LatAm and Asia
EM Europe: Significant increase in equity risk, and a continuation of high levels in external debt and debt held by non-residents
LatAm: Overall, most vulnerabilities are at a
medium level of risk, except for vulnerabilities
related to growth
EM Asia: Political instability and household credit
continue to be high risks. REER sees significant
depreciation and risk lowering
0.0
0.1
0.2
0.3
0.4
0.5
0.6
0.7
0.8
0.9
1.0
12
3
4
5
6
7
8
9
10
1112
13
14
15
16
17
18
19
20
21
0.0
0.1
0.2
0.3
0.4
0.5
0.6
0.7
0.8
0.9
1.0
12
3
4
5
6
7
8
9
10
1112
13
14
15
16
17
18
19
20
21
0.0
0.1
0.2
0.3
0.4
0.5
0.6
0.7
0.8
0.9
1.0
12
3
4
5
6
7
8
9
10
1112
13
14
15
16
17
18
19
20
21
Riesgo alto Riesgo moderado Riesgo bajo
Macroeconomic Vulnerability and Risk Assessment INDEXSUMMARY
Macro: (1) GDP (% YoY) (2) Prices (% YoY) (3) Unemployment (% LF)
Fiscal: (4) Structural balance (%) (5) Interest rate – GDP %YoY (6) Public debt (% GDP)
Liquidity: (7) Debt by non-residents (%total) (8) Financial needs (%GDP) (9) Financial pressure (% GDP)
External: (10) External debt (%GDP) (11) RER appreciation (%YoY) (12) CAC balance (%GDP)
Credit: (13) Household (%GDP) (14) Corporate (%GDP) (15) Credit-to-deposit (%)
Assets: (16) Private credit to GDP (%YoY) (17) Housing Prices (%YoY)
(18) Equity (%)
Institutional: (19) Political stability (20) Corruption (21) Rule of law
Country Risk Report September 2017
0
20
40
60
80
100
120
140
Un
ited
Sta
tes
Can
ada
Japan
Aust
ralia
Ko
rea
No
rway
Sw
ed
en
Denm
ark
Fin
lan
dU
KA
ust
ria
Fra
nce
Germ
an
yN
eth
erl
an
ds
Belg
ium
Italy
Sp
ain
Irela
nd
Port
ug
al
Gre
ece
Czech
Rep
Bulg
ari
aC
roatia
Hu
ng
ary
Pola
nd
Ro
man
iaR
uss
iaT
urk
ey
Arg
en
tin
aB
razi
lC
hile
Co
lom
bia
Mexic
oP
eru
Ch
ina
Ind
iaIn
don
esi
aM
ala
ysi
aP
hilip
pin
es
Thaila
nd
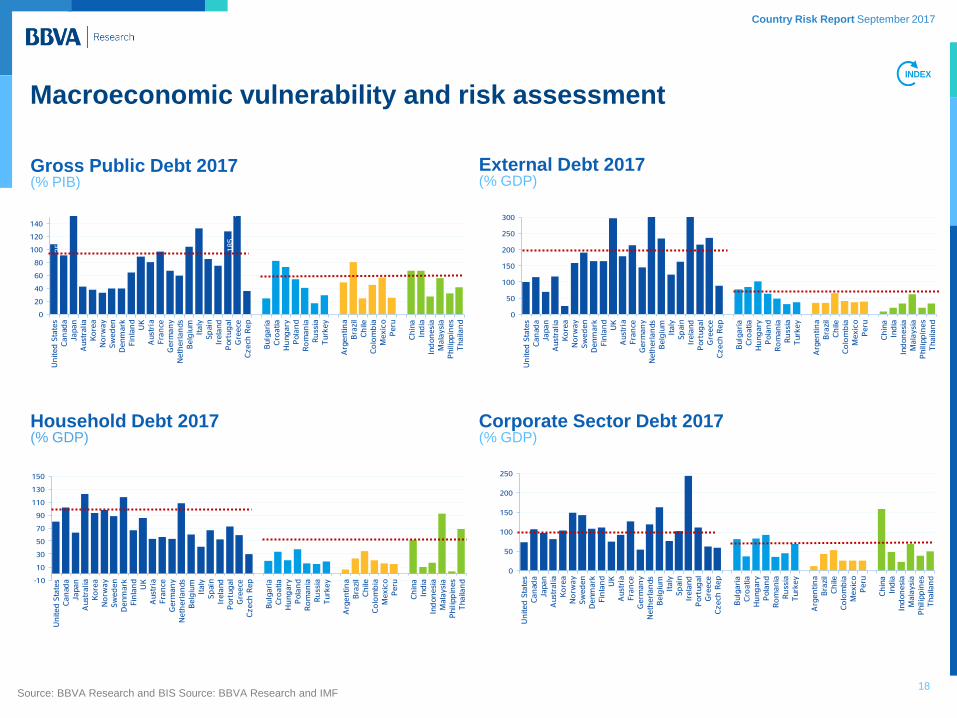
Gross Public Debt 2017(% GDP)Source: BBVA Research and IMF
0
50
100
150
200
250
Un
ited
Sta
tes
Can
ada
Japan
Aust
ralia
Ko
rea
No
rway
Sw
ed
en
Denm
ark
Fin
lan
dU
KA
ust
ria
Fra
nce
Germ
an
yN
eth
erl
an
ds
Belg
ium
Italy
Sp
ain
Irela
nd
Port
ug
al
Gre
ece
Czech
Rep
Bulg
ari
aC
roatia
Hu
ng
ary
Pola
nd
Ro
man
iaR
uss
iaT
urk
ey
Arg
en
tin
aB
razi
lC
hile
Co
lom
bia
Mexic
oP
eru
Ch
ina
Ind
iaIn
don
esi
aM
ala
ysi
aP
hilip
pin
es
Thaila
nd
Corporate Sector Debt 2017(% GDP, excluding bond issuances)Source: BBVA Research and BIS
-10
10
30
50
70
90
110
130
150
Un
ited
Sta
tes
Can
ada
Japan
Aust
ralia
Ko
rea
No
rway
Sw
ed
en
Denm
ark
Fin
lan
dU
KA
ust
ria
Fra
nce
Germ
an
yN
eth
erl
an
ds
Belg
ium
Italy
Sp
ain
Irela
nd
Port
ug
al
Gre
ece
Czech
Rep
Bulg
ari
aC
roatia
Hu
ng
ary
Pola
nd
Ro
man
iaR
uss
iaT
urk
ey
Arg
en
tin
aB
razi
lC
hile
Co
lom
bia
Mexic
oP
eru
Ch
ina
Ind
iaIn
don
esi
aM
ala
ysi
aP
hilip
pin
es
Thaila
nd
Household Debt 2017(% GDP)Source: BBVA Research and BIS
18
25
3
18
5
Household Debt 2017 (% GDP)
Corporate Sector Debt 2017 (% GDP)
25
3
18
5
54
4
78
0
Source: BBVA Research and BIS Source: BBVA Research and IMF
Macroeconomic vulnerability and risk assessment
Risk thresholds
0
50
100
150
200
250
300
Un
ited
Sta
tes
Can
ada
Japan
Aust
ralia
Ko
rea
No
rway
Sw
ed
en
Denm
ark
Fin
lan
dU
KA
ust
ria
Fra
nce
Germ
an
yN
eth
erl
an
ds
Belg
ium
Italy
Sp
ain
Irela
nd
Port
ug
al
Gre
ece
Czech
Rep
Bulg
ari
aC
roatia
Hu
ng
ary
Pola
nd
Ro
man
iaR
uss
iaT
urk
ey
Arg
en
tin
aB
razi
lC
hile
Co
lom
bia
Mexic
oP
eru
Ch
ina
Ind
iaIn
don
esi
aM
ala
ysi
aP
hilip
pin
es
Thaila
nd
External Debt 2017(% GDP)Source: BBVA Research and IMF
Gross Public Debt 2017 (% PIB)
External Debt 2017 (% GDP)
INDEX
Country Risk Report September 2017
04 Assessment of financial and
external disequilibria
Private credit growth by country
Housing prices growth by country
Early warning system of banking crises by regions
Early warning system of currency crises by regions
Country Risk Report September 2017
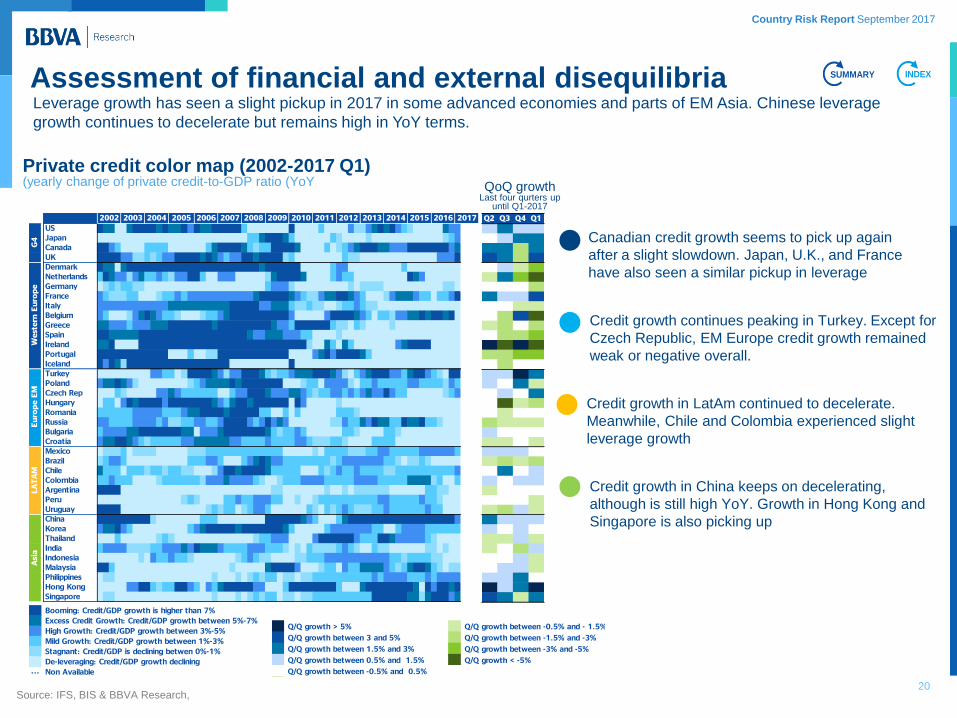
Private credit color map (2002-2017 Q1) (yearly change of private credit-to-GDP ratio (YoY
20
Leverage growth has seen a slight pickup in 2017 in some advanced economies and parts of EM Asia. Chinese leverage
growth continues to decelerate but remains high in YoY terms.
Canadian credit growth seems to pick up again
after a slight slowdown. Japan, U.K., and France
have also seen a similar pickup in leverage
Credit growth continues peaking in Turkey. Except for
Czech Republic, EM Europe credit growth remained
weak or negative overall.
Credit growth in LatAm continued to decelerate.
Meanwhile, Chile and Colombia experienced slight
leverage growth
Credit growth in China keeps on decelerating,
although is still high YoY. Growth in Hong Kong and
Singapore is also picking up
Source: IFS, BIS & BBVA Research,
Assessment of financial and external disequilibria INDEX
QoQ growth Last four qurters up
until Q1-2017
US # # # # # # # # # # # # # # # # # # # # # # # # # # # # # # # # # # # # # # # # # # # # # # # # # # # # # # # # # # # # #
Japan # # # # # # # # # # # # # # # # # # # # # # # # # # # # # # # # # # # # # # # # # # # # # # # # # # # # # # # # # # # # #
Canada # # # # # # # # # # # # # # # # # # # # # # # # # # # # # # # # # # # # # # # # # # # # # # # # # # # # # # # # # # # # #
UK # # # # # # # # # # # # # # # # # # # # # # # # # # # # # # # # # # # # # # # # # # # # # # # # # # # # # # # # # # # # #
Denmark # # # # # # # # # # # # # # # # # # # # # # # # # # # # # # # # # # # # # # # # # # # # # # # # # # # # # # # # # # # # #
Netherlands # # # # # # # # # # # # # # # # # # # # # # # # # # # # # # # # # # # # # # # # # # # # # # # # # # # # # # # # # # # # #
Germany # # # # # # # # # # # # # # # # # # # # # # # # # # # # # # # # # # # # # # # # # # # # # # # # # # # # # # # # # # # # #
France # # # # # # # # # # # # # # # # # # # # # # # # # # # # # # # # # # # # # # # # # # # # # # # # # # # # # # # # # # # # #
Italy # # # # # # # # # # # # # # # # # # # # # # # # # # # # # # # # # # # # # # # # # # # # # # # # # # # # # # # # # # # # #
Belgium # # # # # # # # # # # # # # # # # # # # # # # # # # # # # # # # # # # # # # # # # # # # # # # # # # # # # # # # # # # # #
Greece # # # # # # # # # # # # # # # # # # # # # # # # # # # # # # # # # # # # # # # # # # # # # # # # # # # # # # # # # # # # #
Spain # # # # # # # # # # # # # # # # # # # # # # # # # # # # # # # # # # # # # # # # # # # # # # # # # # # # # # # # # # # # #
Ireland # # # # # # # # # # # # # # # # # # # # # # # # # # # # # # # # # # # # # # # # # # # # # # # # # # # # # # # # # # # # #
Portugal # # # # # # # # # # # # # # # # # # # # # # # # # # # # # # # # # # # # # # # # # # # # # # # # # # # # # # # # # # # # #
Iceland # # # # # # # # # # # # # # # # # # # # # # # # # # # # # # # # # # # # # # # # # # # # # # # # # # # # # # # # # # # # #
Turkey # # # # # # # # # # # # # # # # # # # # # # # # # # # # # # # # # # # # # # # # # # # # # # # # # # # # # # # # # # # # #
Poland # # # # # # # # # # # # # # # # # # # # # # # # # # # # # # # # # # # # # # # # # # # # # # # # # # # # # # # # # # # # #
Czech Rep # # # # # # # # # # # # # # # # # # # # # # # # # # # # # # # # # # # # # # # # # # # # # # # # # # # # # # # # # # # # #
Hungary # # # # # # # # # # # # # # # # # # # # # # # # # # # # # # # # # # # # # # # # # # # # # # # # # # # # # # # # # # # # #
Romania # # # # # # # # # # # # # # # # # # # # # # # # # # # # # # # # # # # # # # # # # # # # # # # # # # # # # # # # # # # # #
Russia # # # # # # # # # # # # # # # # # # # # # # # # # # # # # # # # # # # # # # # # # # # # # # # # # # # # # # # # # # # # #
Bulgaria # # # # # # # # # # # # # # # # # # # # # # # # # # # # # # # # # # # # # # # # # # # # # # # # # # # # # # # # # # # # #
Croatia # # # # # # # # # # # # # # # # # # # # # # # # # # # # # # # # # # # # # # # # # # # # # # # # # # # # # # # # # # # # #
Mexico # # # # # # # # # # # # # # # # # # # # # # # # # # # # # # # # # # # # # # # # # # # # # # # # # # # # # # # # # # # # #
Brazil # # # # # # # # # # # # # # # # # # # # # # # # # # # # # # # # # # # # # # # # # # # # # # # # # # # # # # # # # # # # #
Chile # # # # # # # # # # # # # # # # # # # # # # # # # # # # # # # # # # # # # # # # # # # # # # # # # # # # # # # # # # # # #
Colombia # # # # # # # # # # # # # # # # # # # # # # # # # # # # # # # # # # # # # # # # # # # # # # # # # # # # # # # # # # # # #
Argentina # # # # # # # # # # # # # # # # # # # # # # # # # # # # # # # # # # # # # # # # # # # # # # # # # # # # # # # # # # # # #
Peru # # # # # # # # # # # # # # # # # # # # # # # # # # # # # # # # # # # # # # # # # # # # # # # # # # # # # # # # # # # # #
Uruguay # # # # # # # # # # # # # # # # # # # # # # # # # # # # # # # # # # # # # # # # # # # # # # # # # # # # # # # # # # # # #
China # # # # # # # # # # # # # # # # # # # # # # # # # # # # # # # # # # # # # # # # # # # # # # # # # # # # # # # # # # # # #
Korea # # # # # # # # # # # # # # # # # # # # # # # # # # # # # # # # # # # # # # # # # # # # # # # # # # # # # # # # # # # # #
Thailand # # # # # # # # # # # # # # # # # # # # # # # # # # # # # # # # # # # # # # # # # # # # # # # # # # # # # # # # # # # # #
India # # # # # # # # # # # # # # # # # # # # # # # # # # # # # # # # # # # # # # # # # # # # # # # # # # # # # # # # # # # # #
Indonesia # # # # # # # # # # # # # # # # # # # # # # # # # # # # # # # # # # # # # # # # # # # # # # # # # # # # # # # # # # # # #
Malaysia # # # # # # # # # # # # # # # # # # # # # # # # # # # # # # # # # # # # # # # # # # # # # # # # # # # # # # # # # # # # #
Philippines # # # # # # # # # # # # # # # # # # # # # # # # # # # # # # # # # # # # # # # # # # # # # # # # # # # # # # # # # # # # #
Hong Kong # # # # # # # # # # # # # # # # # # # # # # # # # # # # # # # # # # # # # # # # # # # # # # # # # # # # # # # # # # # # #
Singapore # # # # # # # # # # # # # # # # # # # # # # # # # # # # # # # # # # # # # # # # # # # # # # # # # # # # # # # # # # # # #
###
###
###
###
###
###
…
High Growth: Credit/GDP growth between 3%-5%
Mild Growth: Credit/GDP growth between 1%-3%
Stagnant: Credit/GDP is declining betwen 0%-1%
De-leveraging: Credit/GDP growth declining
Non Available
West
ern
Euro
pe
Euro
pe E
MLA
TA
MA
sia
Booming: Credit/GDP growth is higher than 7%
Excess Credit Growth: Credit/GDP growth between 5%-7%
2013 2014 2015 2016 20172011 2012
G4
2007 2008 2009 20102002 2003 2004 2005 2006
6.0 Q/Q growth > 5%
4.5 Q/Q growth between 3 and 5%
2.5 Q/Q growth between 1.5% and 3%
1.0 Q/Q growth between 0.5% and 1.5%
0.2 Q/Q growth between -0.5% and 0.5%
Q2 Q3 Q4 Q1
1.4 1.9 0.5 0.7
-0.4 1.2 1.5 1.5
2.9 2.8 -1.5 2.7
3.2 2.2 -1.9 4.7
-0.4 1.5 -0.5 -4.4
-0.6 1.7 -3.3 -15.4
-0.1 0.4 -0.5 -2.0
1.6 0.5 1.5 3.6
0.4 -0.2 -1.0 -1.4
0.3 -2.9 4.0 -5.3
-0.8 -1.8 -0.2 -1.8
-0.4 -2.4 -2.8 -3.6
6.0 -30.0 7.6 -18.9
-2.3 -1.9 -3.9 -3.1
-0.3 -2.8 -0.5 -0.3
1.0 1.5 5.5 2.0
1.0 -0.4 2.1 -0.6
0.5 1.1 0.2 1.8
0.0 -5.7 -1.3 -1.8
-0.5 -0.7 -0.3 -0.1
-2.7 -0.6 -0.9 -0.9
0.6 -0.3 -0.3 -0.1
-0.8 -0.8 -0.4 -0.8
1.2 0.9 0.5 0.0
-1.1 -1.8 -0.5 -1.7
0.2 1.6 0.4 1.0
0.9 -0.1 0.5 0.5
-0.6 0.1 0.2 -0.2
-0.2 0.1 -0.5 -0.8
-1.0 -2.5 0.9 -1.1
2.3 1.0 0.7 0.7
0.7 0.2 0.6 -0.5
-0.5 -0.8 0.9 -0.8
-1.4 0.3 -2.7 0.6
0.3 -0.3 0.6 -0.9
-0.4 0.6 1.5 -1.1
1.2 0.7 2.7 -0.4
5.1 0.9 2.3 25.9
3.1 2.1 -0.7 1.6
-1.0 Q/Q growth between -0.5% and - 1.5%
## Q/Q growth between -1.5% and -3%
## Q/Q growth between -3% and -5%
-6.0 Q/Q growth < -5%
SUMMARY

Country Risk Report September 2017
Assessment of financial and external disequilibria
Price growth was high in Canada,
Iceland, U.K., Netherlands and
Germany. Price fluctuations are
observed in Italy
Mixed quarterly data from EM Europe.
Romania and Poland experience
significant price growth. Meanwhile
stability or slight lowering can be seen
elsewhere
Mexican growth continued to decelerate.
Chile saw a QoQ increase while other
countries saw relative price stability
China show mild signs of a slowing,
although prices are still growing. Mild
growth or deceleration was seen in other
countries except for Philippines and HK
Real housing prices color map (2002-2017 Q1) (yearly change of real housing prices YoY)
Source: BBVA Research, BIS, Haver and Oxford Economics.
Strong housing price growth was also seen in several DMs. Deceleration in housing price growth or relative stability was seen
across the board in EM countries, although price growth in China still strong
INDEX
US #Japan #Canada #UK #Denmark #Netherlands #Germany #France #Italy #Belgium #Greece #Spain #Ireland #Portugal #Iceland #Turkey #Poland #Czech Rep #Hungary #Romania #Russia #Bulgaria #Croatia #Mexico .. .. .. .. .. .. .. .. .. .. .. .. .. .. .. ..Brazil #Chile #Colombia #Argentina #Peru #Uruguay #China #Korea #Thailand #India .. .. .. .. .. .. .. .. .. .. .. .. .. .. .. .. .. .. .. .. .. .. .. ..Indonesia #Malaysia .. .. .. .. .. .. .. .. .. .. .. .. .. .. .. ..Philippines #Hong Kong #Singapore #
9
7
4
3
0.5
-2 De-Leveraging: House prices are declining Non Available Data
Booming: Real House prices growth higher than 8% Excess Growth: Real House Prices Growth between 5% and 8%High Growth: Real House Prices growth between 3%-5%Mild Growth: Real House prices growth between 1%-3%Stagnant: Real House Prices growth between 0% and 1%
2014 2015 2016 20172004 2005
Euro
pa O
ccid
enta
lEuro
pa E
merg
ente
LA
TA
MA
sia
20132006
G4
2007 2008 2009 2010 2011 20122002 2003
6.0 Q/Q growth > 3.5%
4.5 Q/Q growth between 2% and 3.5%
2.5 Q/Q growth between 1% and 2%
1.0 Q/Q growth between 0.5% and 1%
0.2 Q/Q growth between -0.5% and 0.5%
-1.0 Q/Q growth between -0.5% and - 1%
-2.5 Q/Q growth between -1% and -2%
-4.5 Q/Q growth between -2% and -3.5%
-6.0 Q/Q growth < -3.5%
Q2 Q3 Q4 Q1
0.1 1.0 1.5 0.5
-0.3 3.3 3.1 -7.5
5.3 3.5 1.5 4.0
1.3 0.4 0.3 1.3
-0.4 1.5 1.0 -0.5
0.1 2.2 1.1 1.7
1.9 2.6 0.9 0.4
-1.9 1.0 0.9 1.7
-0.6 -0.8 -0.2 -0.8
0.2 0.4 2.3 -2.4
-2.1 -0.4 -0.3 -0.5
-1.1 0.3 -1.2 1.5
0.7 5.2 1.8 1.2
1.2 1.3 1.4 2.1
0.9 5.6 3.7 4.8
2.4 2.0 -0.3 -1.2
-2.8 -2.1 -0.1 9.3
3.1 1.6 2.1 0.3
-4.5 2.5 3.8 0.6
3.2 -1.1 1.8 4.0
-2.3 -2.0 -1.4 -1.4
2.1 -0.2 1.6 -0.5
-0.7 1.0 -1.1 -1.1
2.8 1.0 -1.8 -2.1
-2.3 -2.7 -0.6 -0.3
-1.7 0.5 -3.7 4.7
0.6 0.8 0.8 0.5
-19.7 -6.1 -4.7 -0.2
-6.0 5.0 -0.6 -0.7
-0.1 0.6 0.7 0.3
2.8 2.8 2.5 1.2
-0.2 0.8 -0.6 -1.1
2.8 -1.8 -2.3 -0.5
3.9 1.3 1.7 -3.2
0.5 -0.8 -0.2 -0.5
1.9 2.1 -1.5 -1.5
1.9 1.7 1.4 2.3
0.8 4.4 5.5 2.7
-0.5 -1.8 -0.9 -0.4
QoQ growth Last four quarters up
until Q1-2017
21
Country Risk Report September 2017
22
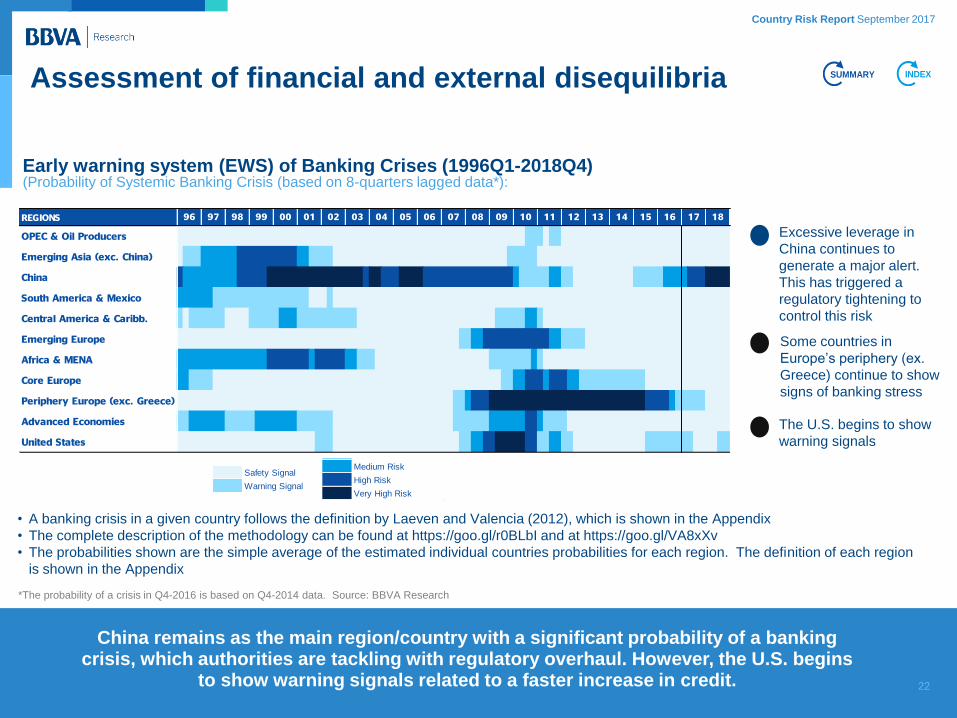
*The probability of a crisis in Q4-2016 is based on Q4-2014 data. Source: BBVA Research
• A banking crisis in a given country follows the definition by Laeven and Valencia (2012), which is shown in the Appendix
• The complete description of the methodology can be found at https://goo.gl/r0BLbI and at https://goo.gl/VA8xXv
• The probabilities shown are the simple average of the estimated individual countries probabilities for each region. The definition of each region
is shown in the Appendix
Excessive leverage in
China continues to
generate a major alert.
This has triggered a
regulatory tightening to
control this risk
The U.S. begins to show
warning signals
China remains as the main region/country with a significant probability of a banking crisis, which authorities are tackling with regulatory overhaul. However, the U.S. begins
to show warning signals related to a faster increase in credit.
Some countries in
Europe’s periphery (ex.
Greece) continue to show
signs of banking stress
Assessment of financial and external disequilibria
Early warning system (EWS) of Banking Crises (1996Q1-2018Q4) (Probability of Systemic Banking Crisis (based on 8-quarters lagged data*):
0.02 Safety Signal
0.15 Warning Signal
0.28 Medium Risk
0.35 High Risk
0.6 Very High Risk
0.02 Safety Signal
0.15 Warning Signal
0.28 Medium Risk
0.35 High Risk
0.6 Very High Risk
REGIONS
OPEC & Oil Producers
Emerging Asia (exc. China)
China
South America & Mexico
Central America & Caribb.
Emerging Europe
Africa & MENA
Core Europe
Periphery Europe (exc. Greece)
Advanced Economies
United States
17 1811 12 13 14 15 161099 00 01 02 03 04 05 06 07 08 099896 97
INDEXSUMMARY
Country Risk Report September 2017
23
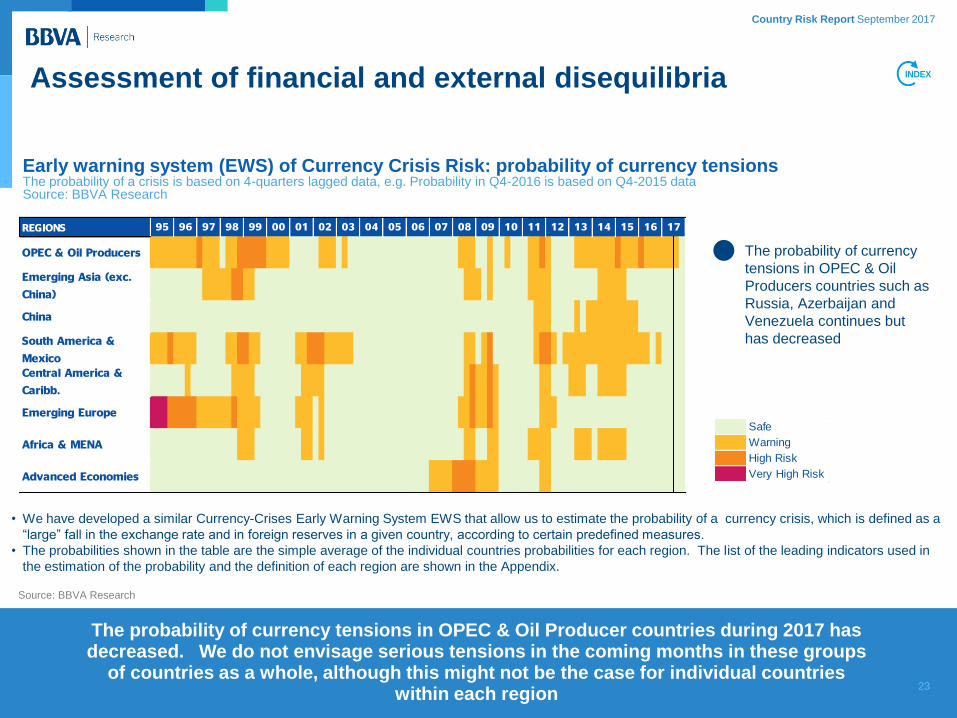
The probability of currency
tensions in OPEC & Oil
Producers countries such as
Russia, Azerbaijan and
Venezuela continues but
has decreased
• We have developed a similar Currency-Crises Early Warning System EWS that allow us to estimate the probability of a currency crisis, which is defined as a
“large” fall in the exchange rate and in foreign reserves in a given country, according to certain predefined measures.
• The probabilities shown in the table are the simple average of the individual countries probabilities for each region. The list of the leading indicators used in
the estimation of the probability and the definition of each region are shown in the Appendix.
The probability of currency tensions in OPEC & Oil Producer countries during 2017 has decreased. We do not envisage serious tensions in the coming months in these groups
of countries as a whole, although this might not be the case for individual countries within each region
Assessment of financial and external disequilibria
Source: BBVA Research
Early warning system (EWS) of Currency Crisis Risk: probability of currency tensions The probability of a crisis is based on 4-quarters lagged data, e.g. Probability in Q4-2016 is based on Q4-2015 data Source: BBVA Research
INDEX
REGIONS
OPEC & Oil Producers
Emerging Asia (exc.
China)
China
South America &
Mexico
Central America &
Caribb.
Emerging Europe
Africa & MENA
Advanced Economies
14 15 160195 1708 09 10 11 12 1302 03 04 05 06 0796 97 98 99 00
0 Safe
0.05 Warning
0.15 High Risk
0.8 Very High Risk

Country Risk Report September 2017
Vulnerability Indicators table by country
24

Country Risk Report September 2017
Source: BBVA Research, Haver, BIS, IMF and World Bank
*Vulnerability indicators: (1) % GDP (2) Deviation from four-year average (3) % of total debt (4) % year on year (5) % of
Total labour force (6) Financial system credit to deposit (7) Index by World Bank governance indicators
Vulnerability indicators* 2017: developed markets
Vulnerability Indicators Table
Fiscal sustainability External sustainability Liquidity management Macroeconomic
performance Credit and housing Private debt Institutional
Structural
primary
balance (1)
Interest rate
GDP growth
differential
2016-21
Gross
public
debt
(1)
Current
account
balance
(1)
External
debt
(1)
RER
appreciatio
n
(2)
Gross
financial
needs
(1)
Short-term
public debt
(3)
Debt held
by non-
residents
(3)
GDP
growth
(4)
Consumer
prices
(4)
Unemployme
nt rate
(5)
Private
credit to
GDP
growth
(4)
Real
housing
prices
growth
(4)
Equity
markets
growth
(4)
Househol
d debt
(1)
NF
corporate
debt
(1)
Financial
liquidity
(6)
WB
political
stability
(7)
WB control
corruption
(7)
WB rule
of law
(7)
United
States -1.9 -1.0 108 -2.4 100 4.5 19 14 32 2.3 2.6 4.5 4.5 3.2 19.1 80 74 64 -0.7 -1.4 -1.6
Canada -1.5 -0.4 91 -2.9 114 -7.1 11 9 24 1.9 2.1 6.9 6.9 -1.8 7.9 102 107 131 -1.2 -1.9 -1.8
Japan -3.7 -1.1 239 4.2 69 1.0 41 15 10 1.2 0.8 3.1 4.0 15.2 28.6 63 97 48 -1.0 -1.6 -1.5
Australia -0.7 -1.3 43 -2.8 116 -1.8 3 2 42 3.1 2.0 5.2 -4.4 9.2 8.5 122 81 131 -0.9 -1.9 -1.8
Korea 0.4 -1.3 39 6.2 26 0.1 2 6 12 2.7 2.2 3.8 1.0 -1.1 21.4 93 103 98 -0.1 -0.5 -1.0
Norway -10.8 -1.5 33 5.7 158 -3.9 -9 8 55 1.2 2.6 4.5 2.1 7.1 15.6 98 148 134 -1.1 -2.3 -2.0
Sweden -1.1 -2.1 40 4.6 189 -5.4 5 10 42 2.7 1.5 6.7 17.0 6.6 21.1 89 144 196 -1.0 -2.2 -2.0
Denmark -0.7 -1.0 40 7.5 164 -0.7 5 9 38 1.5 0.7 5.8 -3.8 1.6 3.2 118 108 306 -0.9 -2.2 -2.0
Finland -0.8 -1.6 64 -1.3 164 -1.5 8 9 81 1.3 1.5 8.5 -45.2 -1.8 21.1 67 111 102 -1.0 -2.3 -2.1
UK -1.0 -0.8 89 -3.2 297 -9.8 9 7 34 1.7 2.6 4.9 8.3 3.4 12.4 86 75 56 -0.6 -1.9 -1.8
Austria 0.6 -0.9 81 2.4 179 0.2 5 5 85 1.4 1.7 5.9 -1.6 0.2 48.2 54 92 98 -1.2 -1.5 -1.9
France -0.8 -1.2 98 -1.3 213 -1.5 13 10 65 1.4 1.5 9.6 7.3 1.7 20.8 57 127 105 -0.3 -1.3 -1.4
Germany 1.2 -1.4 68 7.6 145 -1.3 3 5 63 1.7 2.0 4.2 -2.1 6.1 27.3 53 54 84 -0.7 -1.8 -1.8
Netherland
s 1.0 -1.2 60 9.2 516 -1.0 6 5 55 2.1 1.2 5.4 -17.6 5.3 16.4 108 118 89 -0.9 -1.9 -1.9
Belgium 0.1 -0.9 104 0.9 234 0.5 18 15 67 1.6 1.4 7.8 -3.9 0.5 6.2 60 163 51 -0.6 -1.6 -1.4
Italy 1.9 0.8 133 2.5 122 -1.8 17 11 39 1.0 1.6 11.4 -2.2 -2.4 27.1 41 76 101 -0.3 0.0 -0.3
Spain -0.1 -2.2 85 1.8 162 -0.4 18 15 51 3.0 2.1 17.3 -9.2 -0.5 27.9 67 102 101 -0.3 -0.5 -0.9
Ireland 1.4 -1.6 75 4.7 746 -1.6 6 7 69 3.5 1.4 6.5 -35.4 9.1 21.0 53 244 47 -0.9 -1.6 -1.8
Portugal 2.7 0.7 129 -0.3 216 -0.6 12 8 64 1.7 2.6 10.6 -11.1 6.3 19.3 73 112 120 -0.9 -0.9 -1.1
Greece 3.3 -1.8 181 -0.3 236 -1.8 15 6 82 2.2 1.3 21.9 -4.6 -3.4 51.9 60 63 146 0.2 0.1 -0.2
INDEXSUMMARY
25
Country Risk Report September 2017
Vulnerability Indicators Table
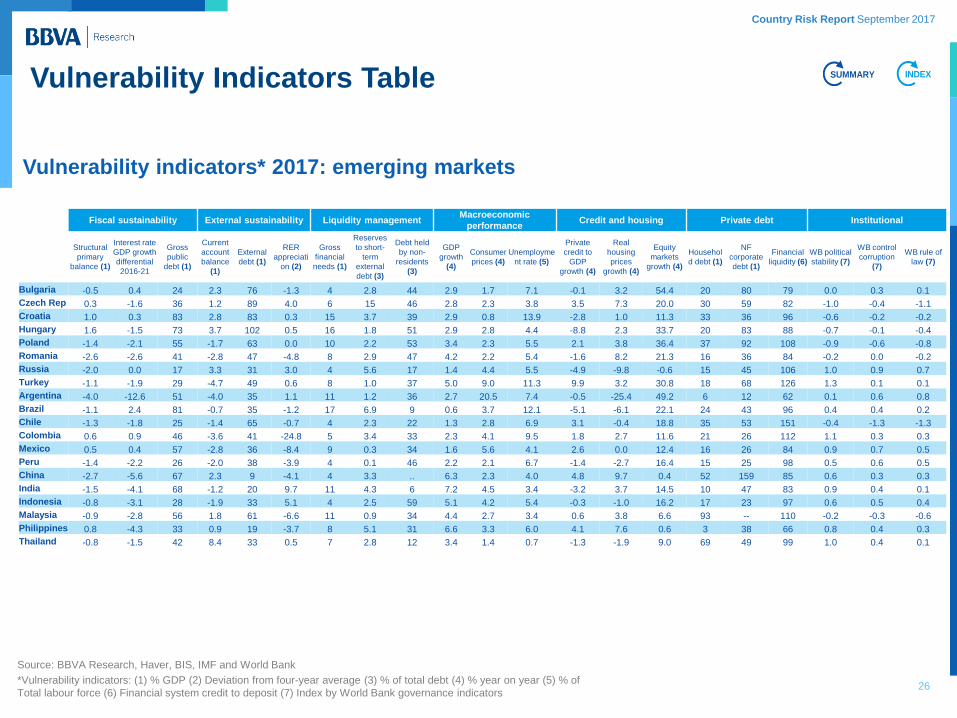
Vulnerability indicators* 2017: emerging markets
INDEXSUMMARY
Fiscal sustainability External sustainability Liquidity management Macroeconomic
performance Credit and housing Private debt Institutional
Structural
primary
balance (1)
Interest rate
GDP growth
differential
2016-21
Gross
public
debt (1)
Current
account
balance
(1)
External
debt (1)
RER
appreciati
on (2)
Gross
financial
needs (1)
Reserves
to short-
term
external
debt (3)
Debt held
by non-
residents
(3)
GDP
growth
(4)
Consumer
prices (4)
Unemployme
nt rate (5)
Private
credit to
GDP
growth (4)
Real
housing
prices
growth (4)
Equity
markets
growth (4)
Househol
d debt (1)
NF
corporate
debt (1)
Financial
liquidity (6)
WB political
stability (7)
WB control
corruption
(7)
WB rule of
law (7)
Bulgaria -0.5 0.4 24 2.3 76 -1.3 4 2.8 44 2.9 1.7 7.1 -0.1 3.2 54.4 20 80 79 0.0 0.3 0.1
Czech Rep 0.3 -1.6 36 1.2 89 4.0 6 15 46 2.8 2.3 3.8 3.5 7.3 20.0 30 59 82 -1.0 -0.4 -1.1
Croatia 1.0 0.3 83 2.8 83 0.3 15 3.7 39 2.9 0.8 13.9 -2.8 1.0 11.3 33 36 96 -0.6 -0.2 -0.2
Hungary 1.6 -1.5 73 3.7 102 0.5 16 1.8 51 2.9 2.8 4.4 -8.8 2.3 33.7 20 83 88 -0.7 -0.1 -0.4
Poland -1.4 -2.1 55 -1.7 63 0.0 10 2.2 53 3.4 2.3 5.5 2.1 3.8 36.4 37 92 108 -0.9 -0.6 -0.8
Romania -2.6 -2.6 41 -2.8 47 -4.8 8 2.9 47 4.2 2.2 5.4 -1.6 8.2 21.3 16 36 84 -0.2 0.0 -0.2
Russia -2.0 0.0 17 3.3 31 3.0 4 5.6 17 1.4 4.4 5.5 -4.9 -9.8 -0.6 15 45 106 1.0 0.9 0.7
Turkey -1.1 -1.9 29 -4.7 49 0.6 8 1.0 37 5.0 9.0 11.3 9.9 3.2 30.8 18 68 126 1.3 0.1 0.1
Argentina -4.0 -12.6 51 -4.0 35 1.1 11 1.2 36 2.7 20.5 7.4 -0.5 -25.4 49.2 6 12 62 0.1 0.6 0.8
Brazil -1.1 2.4 81 -0.7 35 -1.2 17 6.9 9 0.6 3.7 12.1 -5.1 -6.1 22.1 24 43 96 0.4 0.4 0.2
Chile -1.3 -1.8 25 -1.4 65 -0.7 4 2.3 22 1.3 2.8 6.9 3.1 -0.4 18.8 35 53 151 -0.4 -1.3 -1.3
Colombia 0.6 0.9 46 -3.6 41 -24.8 5 3.4 33 2.3 4.1 9.5 1.8 2.7 11.6 21 26 112 1.1 0.3 0.3
Mexico 0.5 0.4 57 -2.8 36 -8.4 9 0.3 34 1.6 5.6 4.1 2.6 0.0 12.4 16 26 84 0.9 0.7 0.5
Peru -1.4 -2.2 26 -2.0 38 -3.9 4 0.1 46 2.2 2.1 6.7 -1.4 -2.7 16.4 15 25 98 0.5 0.6 0.5
China -2.7 -5.6 67 2.3 9 -4.1 4 3.3 .. 6.3 2.3 4.0 4.8 9.7 0.4 52 159 85 0.6 0.3 0.3
India -1.5 -4.1 68 -1.2 20 9.7 11 4.3 6 7.2 4.5 3.4 -3.2 3.7 14.5 10 47 83 0.9 0.4 0.1
Indonesia -0.8 -3.1 28 -1.9 33 5.1 4 2.5 59 5.1 4.2 5.4 -0.3 -1.0 16.2 17 23 97 0.6 0.5 0.4
Malaysia -0.9 -2.8 56 1.8 61 -6.6 11 0.9 34 4.4 2.7 3.4 0.6 3.8 6.6 93 -- 110 -0.2 -0.3 -0.6
Philippines 0.8 -4.3 33 0.9 19 -3.7 8 5.1 31 6.6 3.3 6.0 4.1 7.6 0.6 3 38 66 0.8 0.4 0.3
Thailand -0.8 -1.5 42 8.4 33 0.5 7 2.8 12 3.4 1.4 0.7 -1.3 -1.9 9.0 69 49 99 1.0 0.4 0.1
Source: BBVA Research, Haver, BIS, IMF and World Bank
*Vulnerability indicators: (1) % GDP (2) Deviation from four-year average (3) % of total debt (4) % year on year (5) % of
Total labour force (6) Financial system credit to deposit (7) Index by World Bank governance indicators 26
Country Risk Report September 2017
Methodological Appendix
27
Country Risk Report September 2017
Appendix
28
Methodology: indicators and maps • Financial Stress Map: It stresses levels of stress according to the normalised time series movements. Higher positive standard units (1.5
or higher) stand for high levels of stress (dark blue) and lower standard deviations (-1.5 or below) stand for lower level of market stress
(lighter colours)
• Sovereign Rating Index: An index that translates the letter codes of the three important rating agencies’ rating (Moody’s, Standard & Poors
and Fitch) to numerical positions from 20 (AAA) to default (0). The index shows the average of the three rescaled numerical ratings
• Sovereign CD Swaps Maps: It shows a colour map with six different ranges of CD Swaps quotes (darker >500, 300 to 500, 200 to 300,
100 to 200, 50 to 100 and the lighter below 50 bp)
• Downgrade Pressure Gap: The gap shows the difference between the implicit ratings according to the Credit Default Swaps and the
current ratings index (numerically scaled from default (0) to AAA (20)). We calculate implicit probabilities of default (PD) from the observed
CDS and the estimated equilibrium spread. For the computation of these PDs we follow a standard methodology as described in Chan-
Lau (2006), and we assume a constant Loss Given Default of 0.6 (Recovery Rate equal to 0.4) for all the countries in the sample. We use
the resulting PDs in a cluster analysis to classify each country at every point in time in one of 20 different categories (ratings) to emulate
the same 20 categories used by the rating agencies. The graph plots the difference between CDS-implied sovereign rating and the actual
sovereign rating index, in notches. Higher positive differences account for potential Upgrade pressures and negative differences account
for Downgrade potential. We consider the +/- 2 notches area as being Neutral
• Vulnerability Radars: A Vulnerability Radar shows a static and comparative vulnerability for different countries. For this we assigned
several dimensions of vulnerabilities, each of them represented by three vulnerability indicators. The dimensions included are:
Macroeconomics, Fiscal, Liquidity, External, Excess Credit and Assets, Private Balance Sheets and Institutional. Once the indicators are
compiled, we reorder the countries in percentiles from 0 (lower ratio among the countries) to 1 (maximum vulnerabilities) relative to their
group (Developed Economies or Emerging Markets). Furthermore, Inner positions (near 0) in the radar shows lower vulnerability, while
outer positions (near 1) stand for higher vulnerability. Furthermore, we normalize each value with respect to given risk thresholds, whose
values have been computed according to our own analysis or empirical literature. If the value of a variable is equal to the threshold, it
would take a value of 0.8 in the radar
Country Risk Report September 2017
Appendix
29
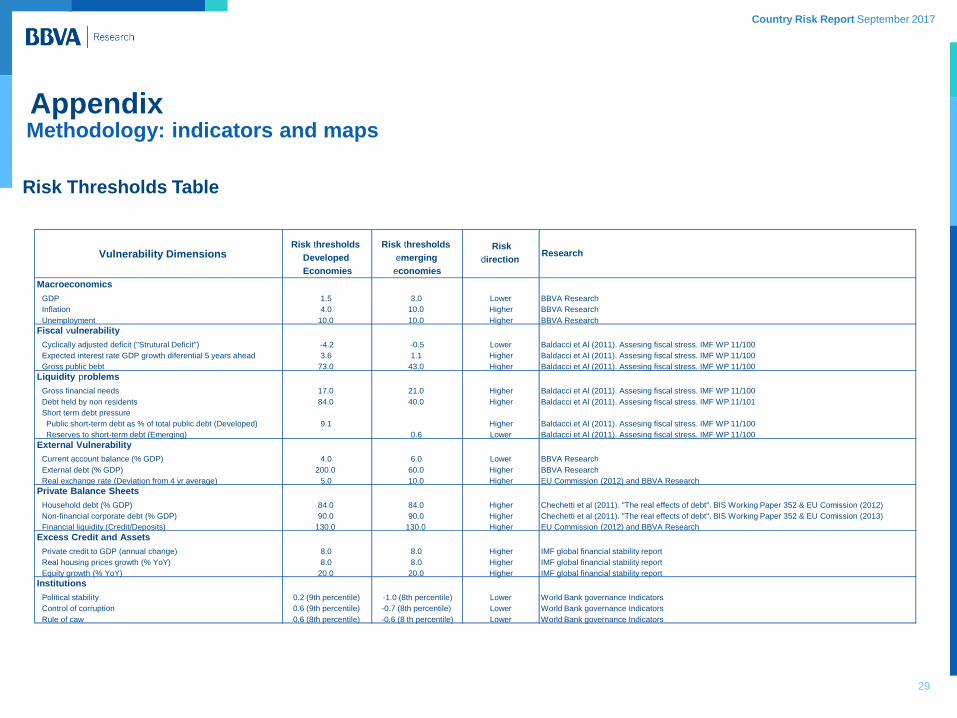
Risk Thresholds Table
Methodology: indicators and maps
Macroeconomics
GDP 1.5 3.0 Lower BBVA Research
Inflation 4.0 10.0 Higher BBVA Research
Unemployment 10.0 10.0 Higher BBVA Research
Fiscal vulnerability
Cyclically adjusted deficit ("Strutural Deficit") -4.2 -0.5 Lower Baldacci et Al (2011). Assesing fiscal stress. IMF WP 11/100
Expected interest rate GDP growth diferential 5 years ahead 3.6 1.1 Higher Baldacci et Al (2011). Assesing fiscal stress. IMF WP 11/100
Gross public bebt 73.0 43.0 Higher Baldacci et Al (2011). Assesing fiscal stress. IMF WP 11/100
Liquidity problems
Gross financial needs 17.0 21.0 Higher Baldacci et Al (2011). Assesing fiscal stress. IMF WP 11/100
Debt held by non residents 84.0 40.0 Higher Baldacci et Al (2011). Assesing fiscal stress. IMF WP 11/101
Short term debt pressure
Public short-term debt as % of total public debt (Developed) 9.1 Higher Baldacci et Al (2011). Assesing fiscal stress. IMF WP 11/100
Reserves to short-term debt (Emerging) 0.6 Lower Baldacci et Al (2011). Assesing fiscal stress. IMF WP 11/100
External Vulnerability
Current account balance (% GDP) 4.0 6.0 Lower BBVA Research
External debt (% GDP) 200.0 60.0 Higher BBVA Research
Real exchange rate (Deviation from 4 yr average) 5.0 10.0 Higher EU Commission (2012) and BBVA Research
Private Balance Sheets
Household debt (% GDP) 84.0 84.0 Higher Chechetti et al (2011). "The real effects of debt". BIS Working Paper 352 & EU Comission (2012)
Non-financial corporate debt (% GDP) 90.0 90.0 Higher Chechetti et al (2011). "The real effects of debt". BIS Working Paper 352 & EU Comission (2013)
Financial liquidity (Credit/Deposits) 130.0 130.0 Higher EU Commission (2012) and BBVA Research
Excess Credit and Assets
Private credit to GDP (annual change) 8.0 8.0 Higher IMF global financial stability report
Real housing prices growth (% YoY) 8.0 8.0 Higher IMF global financial stability report
Equity growth (% YoY) 20.0 20.0 Higher IMF global financial stability report
Institutions
Political stability 0.2 (9th percentile) -1.0 (8th percentile) Lower World Bank governance Indicators
Control of corruption 0.6 (9th percentile) -0.7 (8th percentile) Lower World Bank governance Indicators
Rule of caw 0.6 (8th percentile) -0.6 (8 th percentile) Lower World Bank governance Indicators
Vulnerability Dimensions Risk thresholds
Developed
Economies
Risk thresholds
emerging
economies
Risk
direction Research
Country Risk Report September 2017
30
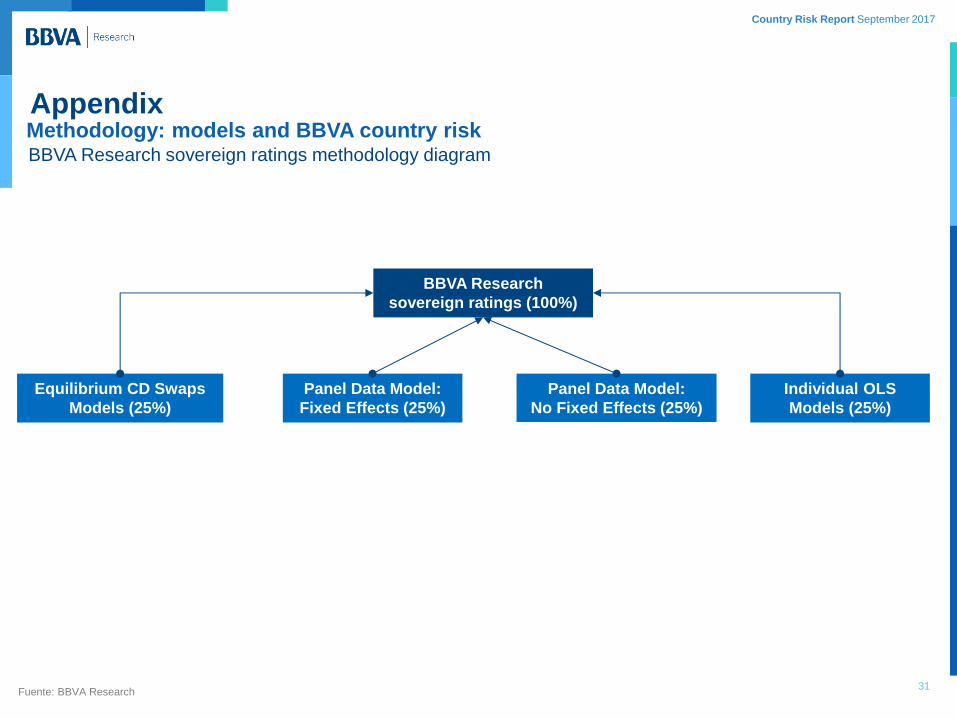
Appendix Methodology: models and BBVA country risk • BBVA Research sovereign ratings methodology: We compute our sovereign ratings by averaging four alternative sovereign rating models
developed at BBVA Research:
• Credit Default Swaps Equilibrium Panel Data Models: This model estimates actual and forecast equilibrium levels of CDS for 48
developed and emerging countries and 10 macroeconomic explanatory variables. The CDS equilibrium is calculated using the centered 5-
year moving average of the explanatory variables weighted according to their estimated sensitivities. For estimating the equilibrium level,
the BAA spread is left unchanged at its long-term median level (2003-2016). The values of these equilibrium CDS are finally converted to
a 20 scale sovereign rating scale.
• Sovereign Rating Panel Data Ordered Probit with Fixed Effects Model: The model estimates a sovereign rating index (a 20 numerical
scale index of the three sovereign rating agencies) through ordered probit panel data techniques. This model takes into account
idiosyncratic fundamental stock and flows sustainability ratios allowing for fixed effects , thus including idiosyncratic country-specific
effects
• Sovereign Rating Panel Data Ordered Probit without Fixed Effects Model: We used the estimates of the previous model but retaining only
the contribution of the macroeconomic and institutional variables, without adding the country “fixed-effect” contribution. In this way we are
able to account more clearly for the effect of only those macroeconomic variables that we can identify.
• Sovereign Rating Individual OLS Models: These models estimate the sovereign rating index (a 20 numerical scale index of the three
sovereign rating agencies) individually. Furthermore, parameters for the different vulnerability indicators are estimated taken into account
the history of the country, independent of others. The estimation comes from Oxford Economics Forecasting (OEF) for the majority of
countries. For those countries that are not analysed by OEF, we estimate a similar OLS individual model.
Country Risk Report September 2017
31
Appendix Methodology: models and BBVA country risk BBVA Research sovereign ratings methodology diagram
Fuente: BBVA Research
BBVA Research
sovereign ratings (100%)
Equilibrium CD Swaps
Models (25%)
Panel Data Model:
Fixed Effects (25%)
Panel Data Model:
No Fixed Effects (25%)
Individual OLS
Models (25%)

Country Risk Report September 2017
Appendix
32
Methodology: Early Warning Systems
EWS Banking Crises:
The complete description of the methodology can be found at https://goo.gl/r0BLbI and at https://goo.gl/VA8xXv. A banking crisis is defined as
systemic if two conditions are met: 1) Significant signs of financial distress in the banking system (as indicated by significant bank runs, losses
in the banking system, and/or bank liquidations), 2) Significant banking policy intervention measures in response to significant losses in the
banking system. The probability of a crisis is estimated using a panel-logit model with annual data from 68 countries and from 1990 to 2012.
The estimated model is then applied to quarterly data. The probability of a crisis is estimated as a function of the following leading indicators
(with a 2-years lag):
• Credit-to-GDP Gap (Deviation from an estimated long-term level)
• Current account balance to GDP
• Short-term interest rate (deviation against US interest rate)
• Libor interest rate
• Credit-to-Deposits
• Regulatory Capital to Risk Weighted Assets ratio..
EWS Currency Crises:
We estimate the probability of a currency crisis (a large fall in exchange rate and foreign reserves event) is estimated using a panel-logit model
with 78 countries from 1980Q1 to 2015Q4, as a function of the following variables (with an 4-quarters lag):
• Credit-to-GDP ratio Gap (based on HP filter)
• Inflation
• BAA Spread
• Cyclical Current Account (based on HP filter)
• Short-term interest rate (deviation against US interest rate)
• Libor interest rate (different lags)
• Real effective exchange rate
• Investment to GDP
• GDP real growth rate (HP-trend and cyclical deviation from trend)
• Total trade to GDP

Country Risk Report September 2017
Appendix
33
Methodology: Early Warning Systems EWS Banking Crises Definition of Regions:
• OPEC and Other Oil Exporters: Algeria, Angola, Azerbaijan, Bahrain, Canada, Ecuador, Nigeria, Norway, Qatar, Russia and Venezuela
• Emerging Asia: Bangladesh, China, India, Indonesia, Malaysia, Pakistan, Philippines, Thailand and Vietnam.
• South America & Mexico: Argentina, Brazil, Chile, Colombia, Mexico, Paraguay, Peru and Uruguay
• Other LatAm & Caribbean: Bolivia, Costa Rica, Dominican Rep., El Salvador, Guatemala, Honduras, Nicaragua and Panama
• Africa & MENA: Botswana, Egypt, Israel, Morocco, Namibia and South Africa.
• Emerging Europe: Armenia, Belarus, Bosnia and Herzegovina, Bulgaria, Croatia, Cyprus, Czech Republic, Estonia, Hungary, Latvia,
Lithuania, Poland, Romania, Slovak Rep, Slovenia, Turkey, Ukraine
• Core Europe: Austria, Belgium, Denmark, Finland, France, Germany, Netherlands, Sweden and United Kingdom.
• Periphery Europe: Greece, Ireland, Italy, Portugal and Spain
• Advanced Economies: Australia, Japan, Korea, Singapore, Iceland, New Zealand and Switzerland.
EWS Currency Crises Definition of Regions:
• OPEC and Other Oil Exporters: Algeria, Angola, Azerbaijan, Bahrain, Nigeria, Norway, Oman, Qatar, Russia, Trinidad and Tobago,
United Arab Emirates and Venezuela
• Emerging Asia: Bangladesh, China, Hong Kong, India, Indonesia, Malaysia, Pakistan, Philippines, Thailand and Vietnam.
• South America & Mexico: Argentina, Brazil, Chile, Colombia, Mexico, Paraguay, Peru and Uruguay
• Other LatAm & Caribbean: Bolivia, Costa Rica, Dominican Rep., El Salvador, Guatemala, Honduras, Jamaica and Nicaragua
• Emerging Europe: Armenia, Belarus, Bosnia and Herzegovina, Bulgaria, Croatia, Cyprus, Czech Republic, Estonia, Hungary, Latvia,
Lithuania, Poland, Romania, Slovak Rep, Slovenia, Turkey, Ukraine
• Africa & MENA: Botswana, Egypt, Israel, Morocco, Namibia, South Africa and Tunisia
• Advanced Economies: Australia, Japan, Korea, Singapore, Canada, Iceland, New Zealand and Switzerland.

Country Risk Report September 2017
This report has been prepared by the unit of Global Modelling & Long Term Analysis
Lead Economist. Global Modelling and Long Term Analysis J. Julián Cubero Calvo
+34 91 374 49 98
BBVA-Research Jorge Sicilia Serrano
Análisis Macroeconómico
Rafael Doménech
Escenarios Económicos Globales
Miguel Jiménez
Mercados Financieros Globales
Sonsoles Castillo
Modelización y Análisis de Largo
Plazo Global
Julián Cubero
Innovación y Procesos
Oscar de las Peñas
Sistemas Financieros y Regulación
Santiago Fernández de Lis
Coordinación entre Países
Olga Cerqueira
Regulación Digital
Álvaro Martín
Regulación
María Abascal
Sistemas Financieros
Ana Rubio
Inclusión Financiera
David Tuesta
España y Portugal
Miguel Cardoso
Estados Unidos
Nathaniel Karp
México
Carlos Serrano
Oriente Medio, Asia y
Geopolítica
Álvaro Ortiz
Turquía
Álvaro Ortiz
Asia
Le Xia
América del Sur
Juan Manuel Ruiz
Argentina
Gloria Sorensen
Chile
Jorge Selaive
Colombia
Juana Téllez
Perú
Hugo Perea
Venezuela
Julio Pineda
Alejandro Neut
Rodolfo Méndez-Marcano
Jorge Redondo
Alfonso Ugarte Ruiz
Akshaya Sharma


