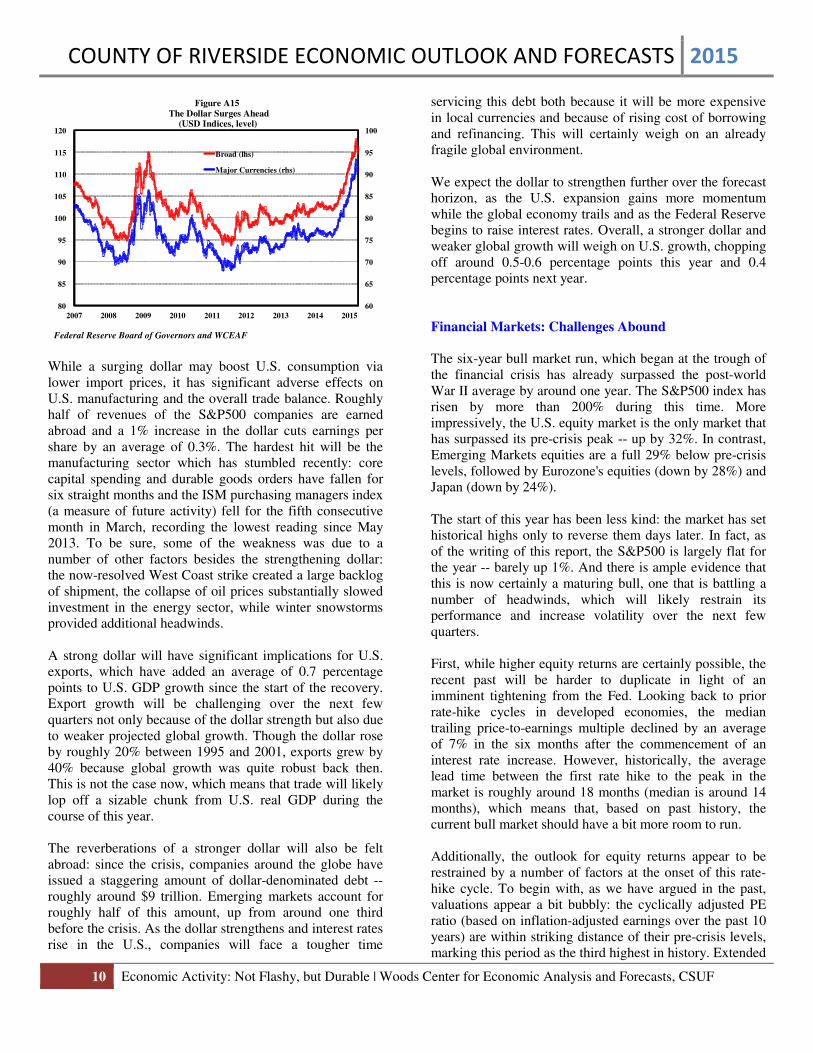
COUNTY OF RIVERSIDE ECONOMIC OUTLOOK AND FORECASTS 2015 10 Economic Activity: Not Flashy, but Durable | Woods Center for Economic Analysis and Forecasts, CSUF While a surging dollar may boost U.S. consumption via lower import prices, it has significant adverse effects on U.S. manufacturing and the overall trade balance. Roughly half of revenues of the S&P500 companies are earned abroad and a 1% increase in the dollar cuts earnings per share by an average of 0.3%. The hardest hit will be the manufacturing sector which has stumbled recently: core capital spending and durable goods orders have fallen for six straight months and the ISM purchasing managers index (a measure of future activity) fell for the fifth consecutive month in March, recording the lowest reading since May 2013. To be sure, some of the weakness was due to a number of other factors besides the strengthening dollar: the now-resolved West Coast strike created a large backlog of shipment, the collapse of oil prices substantially slowed investment in the energy sector, while winter snowstorms provided additional headwinds. A strong dollar will have significant implications for U.S. exports, which have added an average of 0.7 percentage points to U.S. GDP growth since the start of the recovery. Export growth will be challenging over the next few quarters not only because of the dollar strength but also due to weaker projected global growth. Though the dollar rose by roughly 20% between 1995 and 2001, exports grew by 40% because global growth was quite robust back then. This is not the case now, which means that trade will likely lop off a sizable chunk from U.S. real GDP during the course of this year. The reverberations of a stronger dollar will also be felt abroad: since the crisis, companies around the globe have issued a staggering amount of dollar-denominated debt -- roughly around $9 trillion. Emerging markets account for roughly half of this amount, up from around one third before the crisis. As the dollar strengthens and interest rates rise in the U.S., companies will face a tougher time servicing this debt both because it will be more expensive in local currencies and because of rising cost of borrowing and refinancing. This will certainly weigh on an already fragile global environment. We expect the dollar to strengthen further over the forecast horizon, as the U.S. expansion gains more momentum while the global economy trails and as the Federal Reserve begins to raise interest rates. Overall, a stronger dollar and weaker global growth will weigh on U.S. growth, chopping off around 0.5-0.6 percentage points this year and 0.4 percentage points next year. Financial Markets: Challenges Abound The six-year bull market run, which began at the trough of the financial crisis has already surpassed the post-world War II average by around one year. The S&P500 index has risen by more than 200% during this time. More impressively, the U.S. equity market is the only market that has surpassed its pre-crisis peak -- up by 32%. In contrast, Emerging Markets equities are a full 29% below pre-crisis levels, followed by Eurozone's equities (down by 28%) and Japan (down by 24%). The start of this year has been less kind: the market has set historical highs only to reverse them days later. In fact, as of the writing of this report, the S&P500 is largely flat for the year -- barely up 1%. And there is ample evidence that this is now certainly a maturing bull, one that is battling a number of headwinds, which will likely restrain its performance and increase volatility over the next few quarters. First, while higher equity returns are certainly possible, the recent past will be harder to duplicate in light of an imminent tightening from the Fed. Looking back to prior rate-hike cycles in developed economies, the median trailing price-to-earnings multiple declined by an average of 7% in the six months after the commencement of an interest rate increase. However, historically, the average lead time between the first rate hike to the peak in the market is roughly around 18 months (median is around 14 months), which means that, based on past history, the current bull market should have a bit more room to run. Additionally, the outlook for equity returns appear to be restrained by a number of factors at the onset of this rate- hike cycle. To begin with, as we have argued in the past, valuations appear a bit bubbly: the cyclically adjusted PE ratio (based on inflation-adjusted earnings over the past 10 years) are within striking distance of their pre-crisis levels, marking this period as the third highest in history. Extended 60 65 70 75 80 85 90 95 100 80 85 90 95 100 105 110 115 120 2007 2008 2009 2010 2011 2012 2013 2014 2015 Figure A15 The Dollar Surges Ahead (USD Indices, level) Broad (lhs) Major Currencies (rhs) Federal Reserve Board of Governors and WCEAF
Transcript
COUNTY OF RIVERSIDE ECONOMIC OUTLOOK AND FORECASTS 2015
10 Economic Activity: Not Flashy, but Durable | Woods Center for Economic Analysis and Forecasts, CSUF
While a surging dollar may boost U.S. consumption via lower import prices, it has significant adverse effects on U.S. manufacturing and the overall trade balance. Roughly half of revenues of the S&P500 companies are earned abroad and a 1% increase in the dollar cuts earnings per share by an average of 0.3%. The hardest hit will be the manufacturing sector which has stumbled recently: core capital spending and durable goods orders have fallen for six straight months and the ISM purchasing managers index (a measure of future activity) fell for the fifth consecutive month in March, recording the lowest reading since May 2013. To be sure, some of the weakness was due to a number of other factors besides the strengthening dollar: the now-resolved West Coast strike created a large backlog of shipment, the collapse of oil prices substantially slowed investment in the energy sector, while winter snowstorms provided additional headwinds. A strong dollar will have significant implications for U.S. exports, which have added an average of 0.7 percentage points to U.S. GDP growth since the start of the recovery. Export growth will be challenging over the next few quarters not only because of the dollar strength but also due to weaker projected global growth. Though the dollar rose by roughly 20% between 1995 and 2001, exports grew by 40% because global growth was quite robust back then. This is not the case now, which means that trade will likely lop off a sizable chunk from U.S. real GDP during the course of this year. The reverberations of a stronger dollar will also be felt abroad: since the crisis, companies around the globe have issued a staggering amount of dollar-denominated debt -- roughly around $9 trillion. Emerging markets account for roughly half of this amount, up from around one third before the crisis. As the dollar strengthens and interest rates rise in the U.S., companies will face a tougher time
servicing this debt both because it will be more expensive in local currencies and because of rising cost of borrowing and refinancing. This will certainly weigh on an already fragile global environment. We expect the dollar to strengthen further over the forecast horizon, as the U.S. expansion gains more momentum while the global economy trails and as the Federal Reserve begins to raise interest rates. Overall, a stronger dollar and weaker global growth will weigh on U.S. growth, chopping off around 0.5-0.6 percentage points this year and 0.4 percentage points next year. Financial Markets: Challenges Abound The six-year bull market run, which began at the trough of the financial crisis has already surpassed the post-world War II average by around one year. The S&P500 index has risen by more than 200% during this time. More impressively, the U.S. equity market is the only market that has surpassed its pre-crisis peak -- up by 32%. In contrast, Emerging Markets equities are a full 29% below pre-crisis levels, followed by Eurozone's equities (down by 28%) and Japan (down by 24%). The start of this year has been less kind: the market has set historical highs only to reverse them days later. In fact, as of the writing of this report, the S&P500 is largely flat for the year -- barely up 1%. And there is ample evidence that this is now certainly a maturing bull, one that is battling a number of headwinds, which will likely restrain its performance and increase volatility over the next few quarters. First, while higher equity returns are certainly possible, the recent past will be harder to duplicate in light of an imminent tightening from the Fed. Looking back to prior rate-hike cycles in developed economies, the median trailing price-to-earnings multiple declined by an average of 7% in the six months after the commencement of an interest rate increase. However, historically, the average lead time between the first rate hike to the peak in the market is roughly around 18 months (median is around 14 months), which means that, based on past history, the current bull market should have a bit more room to run. Additionally, the outlook for equity returns appear to be restrained by a number of factors at the onset of this rate-hike cycle. To begin with, as we have argued in the past, valuations appear a bit bubbly: the cyclically adjusted PE ratio (based on inflation-adjusted earnings over the past 10 years) are within striking distance of their pre-crisis levels, marking this period as the third highest in history. Extended
60
65
70
75
80
85
90
95
100
80
85
90
95
100
105
110
115
120
2007 2008 2009 2010 2011 2012 2013 2014 2015
Figure A15The Dollar Surges Ahead
(USD Indices, level)
Broad (lhs)
Major Currencies (rhs)
Federal Reserve Board of Governors and WCEAF
COUNTY OF RIVERSIDE ECONOMIC OUTLOOK AND FORECASTS 2015
11 Economic Activity: Not Flashy, but Durable | Woods Center for Economic Analysis and Forecasts, CSUF
valuations seem to be borne partly by ultra low interest rates which have spurred a frenzy in share buy-backs: corporations have spent nearly $2 trillion dollars in buybacks since 2009 and the trend does not appear to be ebbing. In 2014, nearly 95% of firms' profits was spent in share buy-backs and dividends. This is not all that surprising: sales outlook during the recovery (especially early on) was quite uncertain and rock-bottom interest rates made it possible for firms to borrow cheaply and reinvest in their own shares. But this has led to a persistent under-investment in the capital stock: the ratio of business investments to corporate profits is currently half of its historical value. The buyback binge has increased earnings per share by 74% compared to pre-crisis levels, while sales per share have only risen by an uninspiring 10% over this period (Figure A16).
The outlook for profits also seems challenging: corporate profits ended 2014 on a soft note -- down $17.1 compared to a year earlier which marks the first decline since 2008. The current quarter is not shaping up to be much better: the market has been bracing for earnings to decline by 2.8% from a year ago, on softer global outlook, a below-expectation US performance, and a strong dollar. Besides, profit margins are currently near all-time highs and it will be challenging for them to move higher particularly as wages, which make up the bulk of firm's costs, edge higher and productivity remains in the doldrums. The outlook for sales is similarly challenged since nearly 40% of S&P500 profits derived from international markets is exposed to sluggish global growth and a strengthening dollar -- two factors that have historically weighted on sales.
The Long Wait: Housing Turnaround The long awaited housing rebound was supposed to continue apace last year, further gaining breadth and momentum. Alas, 2014, proved to be quite a disappointment: sales slumped, construction sputtered and home prices took a step back from the double-digit appreciation of the previous year. The much anticipated "hand-off" from investors to traditional home-buyers failed to materialize in a meaningful way as borrowing standards remained tight, income growth remained tepid and record numbers of credit-worthy homeowners chose to stay put in their homes and refinance at the lowest rates in a generation. Home building also appears to have stumbled. Total housing starts averaged an annual pace of 1 million in 2014. Most of that came from multifamily homes, which are currently running at the same pace as in the housing boom of the past decade (Figure A17). Single family starts have also risen from the abyss of the recession, but at a 646,000 annual pace they are roughly half the levels that prevailed from 1995-2003 (pre-boom). Some of this is due to weak demand: household formation has been slow: millennials are carrying historic high student debts, trade-up buyers are scarce due to low homeowner equity, and demographics have not been helpful as the population of 35-44 year-olds (the prime first-time buyer demographic) declined by more than 5 million since reaching an all-time high in 2000. But supply constraints have also weighted heavily: the for-sale inventory of homes in attractive urban areas is constrained, development land is scarce and homebuilder costs have risen appreciably.
0
100
200
300
400
500
600
0
200
400
600
800
1,000
1,200
1,400
1,600
1,800
2,000
2000 2002 2004 2006 2008 2010 2012 2014
Figure A17Housing Starts: Buoyed by Multifamilies
(thousands of units, 3-month MA, annualized)
Single Family (lhs)
Multifamily (rhs)
US Census Bureau and WCEAF
-200
-150
-100
-50
0
50
100
150
200
Mar-08 Dec -08 Sep-09 Jun-10 Mar-11 Dec -11 Sep-12 Jun-13 Mar -14
Figure A16Divergent: Earnings per Share have Outpaced Sales per Share
(Index, March 2008=100)
Earnings per Share
Sales Per Share
S&P500 and WCEAF
COUNTY OF RIVERSIDE ECONOMIC OUTLOOK AND FORECASTS 2015
12 Economic Activity: Not Flashy, but Durable | Woods Center for Economic Analysis and Forecasts, CSUF
Despite these concerns, our outlook for housing is upbeat chiefly because the main factors that have restrained a meaningful comeback of the housing market during the recovery are now receding. First, job and income growth should boost demand over the next two years supporting higher household formation rates and providing first-time homebuyers with a much needed dose of confidence. Household formation collapsed during the crisis years and though improved, the pace of growth has still been below trend. In fact, if the number of adults per household is kept equal to its historical rate, we find that there are now roughly two million households missing in the economy. Second, over the next five years, millennials will edge closer to the age of life-milestone events: getting married, purchasing a home. Though much is made out of millennials' desire to live and work in urban areas, our view is that this is overdone and when the dust settles it will likely be the case that attitudes towards homeownership have not altered all that much. Besides, even allowing for potential behavioral preferences towards renting, the sheer size of this age cohort (92 million) will suffice to push housing construction higher in the next few years. Things are also looking up on the credit side: the FHA lowered mortgage insurance premiums by half a percentage point late last year and FHFA decided to allow Fannie Mae and Freddie Mac to purchase certain mortgage loans with only 3% down payment. These loans should help lower income borrowers -- the segment of population that has struggled the most with tighter borrowing standards. Moreover, the FHFA has taken important steps towards clarifying the GSE's representation and warranty process for loans originated by lenders and guaranteed by the GSEs. The guidelines were fuzzy at best prior to the housing crisis as they fail to clearly delineate the time when risk for a loan origination was transferred from the lender to the GSEs. Under the new guidelines these uncertainties are removed; this should lessen concerns on the part of the lender and encourage an easing of underwriting standards, and ultimately more lending. Patient No More: The Fed and Interest Rates Rarely has a central bank been at the receiving end of such attention and interest as the Fed over the past few months. The stakes are indeed high: by its own admission (and broadly accepted consensus) the Fed is perched to begin its first interest rate hike sometime this year. The first sign of an imminent tightening came in March, when in a widely expected move, the Fed dropped its "patient" guidance indicating that interest rate increases could be a couple of meetings away. The beginning of the last tightening cycle was over a decade ago (July 2004) and interest rates have been near-
zero since December 2008. After being in an ultra-low interest rate environment for the better part of the last decade, it is only natural to worry about a potential disorderly start to the process of rate normalization and its impact on both the domestic and global economy. It doesn't help that historically most tightening cycles (eight out of fourteen) have generally followed a familiar pattern: a peak in the stock market followed by a recession. Of the tightening cycles that preceded a recession, the average lead time between the onset of the hiking cycle and the stock market peak was 18 months with another intervening 10 months before the start of the recession. This is not to say that every tightening cycle precedes a recession (six did not), but there is enough upside risk associated with the "normalization" process to warrant concerns about potential disruption to the economy and dislocation in financial markets. The case for raising rates is not as obvious in this cycle as in the past. The recovery has been quite sluggish and there appears to be ample slack sloshing around in the system particularly in the labor market. Inflation is uncomfortably low and headed in the wrong direction thanks to the plunge in oil prices and imported deflationary pressures from abroad. More importantly, the recent surge in the dollar has the same effects as a potential rate hike: it lowers inflation and cools off economic growth via slower exports. Our view is that the Fed has stayed excessively accommodative for far too long and it is now time to slowly but steadily apply the brakes. As we have argued for a while, much progress has been made: labor markets and overall economic activity are now in the strongest footing since the end of the recession. Moreover, economic slack is smaller than what the current level of interest rates imply. This means that the economy is closer to capacity constraints and inflation may tick-up sooner than anticipated. But the biggest worry about prolonged low interest rates has to do with excessive risk-taking and asset price misalignments: there are already signs that the stock market may be overvalued, M&A activity funded through riskier high-yield debt has reached new peaks, the amount of student loans has sky-rocketed and auto loans have waddled well into the subprime segment of the market. We have maintained for a while that the first Fed hike will happen later than what the market consensus anticipate: in the fourth quarter of 2015. The path of normalization will be persistent but gradual. We also see interest rates topping-off at around 3%-3.25% range -- consistent with a downshift in potential growth -- below the 4% rate that Fed officials and the consensus see as consistent with long-term growth.
COUNTY OF RIVERSIDE ECONOMIC OUTLOOK AND FORECASTS 2015
13 Economic Activity: Not Flashy, but Durable | Woods Center for Economic Analysis and Forecasts, CSUF
A2. Projections of Key National Economic Variables
Table A1 National Economy: Macroeconomic Variables
(percent)
Year RGDP Consumption Non-Residential
Investment Residential
Construction Unemployment
Payroll Employment
Headline Inflation
PCE Inflation
Historical
2012 2.3 1.8 7.2 13.5 8.1 1.7 2.5 1.8
2013 2.2 2.4 3.0 11.9 7.4 1.7 1.5 1.2
2014 2.4 2.5 6.3 1.6 6.2 1.9 1.6 1.3
Forecast
2015 2.5 2.9 5.5 5.2 5.4 1.9 0.4 0.6
2016 2.8 2.8 5.9 9.3 5.0 2.0 1.4 2.0
2017 3.0 2.9 5.3 8.4 4.8 1.9 1.9 2.1
2018 2.7 2.6 5.2 6.7 5.2 1.8 2.0 2.1
2019 2.3 2.5 5.1 6.5 5.2 1.7 2.1 2.0
Table A2 Financial Variables
(percent)
Year Federal Funds
Rate 3-month
Tbill Rate 10-year Yield
30-year Mortgage Rate
US Dollar Index (percent change)
Historical
2012 0.14 0.09 1.80 3.66 3.7
2013 0.11 0.06 2.35 3.98 3.3
2014 0.09 0.03 2.54 4.17 3.3
Forecast
2015 0.25 0.18 2.25 4.15 18.2
2016 1.50 0.87 2.88 4.87 5.8
2017 3.00 1.82 4.12 5.15 1.2
2018 3.25 2.90 4.45 5.20 -2.1
2019 3.25 3.11 4.25 5.25 -2.3
COUNTY OF RIVERSIDE ECONOMIC OUTLOOK AND FORECASTS 2015
14 B. RIVERSIDE COUNTY | Woods Center for Economic Analysis and Forecasts, CSUF
B. RIVERSIDE COUNTY ECONOMY
B1. Overview The outlook for Riverside County is the brightest it has been in more than seven years, since the recession and housing market collapse plunged the county in the deepest and longest crisis in decades. The ensuing recovery was feeble at first and the county languished in an early recovery phase that resembled more closely to a shallow recession rather than to a genuine recovery. All that has changed over the past two years. While the crisis years and the sluggish recovery have certainly left imprints in the county, the memories of tough times are fading fast and the county is growing more robustly. Improvements are everywhere: the labor market has outperformed the neighboring counties and the state of California, the housing market has rebounded strongly and the industrial sector continues to lead the recovery. Though the slowdown and backlog resulting from the Ports' labor disputes will likely weigh in the region's economic activity during the first half of this year, we expect its impact to be temporary and for activity to resume in earnest now that negotiations are over. Developments in the labor market are perhaps the brightest spot over the past year. The unemployment rate has continued to decline at a rapid clip, new jobs are being formed and the labor force continues to expand. Compared to neighboring counties, the unemployment rate is higher than in San Bernardino and Orange County (which is in line with historical patterns) but lower than the unemployment rate of the Los Angeles county. Compared to counties across the nation, the unemployment rate in Riverside County remains in the top third because -- despite sizable gains in the past two years -- the county has had quite a lot of ground to make up since the collapse of the housing market. The county has added jobs at a fast clip in all of its main sectors: Trade, Transportation & Utilities; Health & Social Assistance; and Leisure & Hospitality sectors. However, these sectors tend to also be low-paying which restrains the purchasing power of the county's residents. Thus, it is important that new jobs are also added in the higher-paying sectors: Professional & Business Services, Financial Activities, and Information sectors. Job growth has picked up robustly over the past year in the Professional & Business Service sector, which bodes well for the county going forward. In addition, Construction and Manufacturing sectors have added jobs over the past two
years, though the pace of job formation in these two sectors has ebbed a bit in the past few months. The structure of the Riverside County labor market has changed since the end of the recession with some sectors growing more than others. Health Care & Social Assistance, Leisure & Hospitality and Transportation, Warehousing & Utilities account for a larger share of total employment in the county than prior to the recession. The three sectors now combine for roughly one-third of total payroll employment in the county compared to just one quarter back in 2007. In contrast, despite recent gains, Construction and Manufacturing employment has shrunk dramatically compared to pre-recession levels, combining for roughly 13% of the total jobs in the county, down from 17% in 2007. As we cautioned in our last year's report, home prices have risen again over the year, though at a much more moderate pace compared to late 2012 and in 2013. This was expected: the early pick-up in home prices was spurred by a dramatic increase in investor demand. As home prices surged and investor demand waned, home price acceleration cooled off. However, we expect traditional buyers to step in over the next few years, hesitantly at first and more confidently after, which means that the housing recovery will be supported by more organic growth going forward. Some signs of increased homeowner demand was already evident in 2014. Though the rapid appreciation in home values that occurred during the past two years has decreased housing affordability, the county is still significantly more affordable relative to the surrounding counties. The good news for the county is that the continued improvement in home valuations and a robust pace of hiring has put the county on a much stronger footing even compared to last year. With higher property values, the County Assessor’s Office will continue to reverse the Proposition 8 reduction in assessment of residential and commercial property which will lead to notable improvements in assessment rolls and property tax revenues. The longer-term challenges and growth opportunities for the county are similar to what we have highlighted in our previous reports. While the county has begun to generate jobs in better-paying sectors, the lion's share of newly minted jobs continue to remain in the low paying sectors. There appears to be a continued lack of investment in education and human development necessary to fulfill the skill-set required for a more broad-based growth. Poverty remains a major concern across the county especially with
COUNTY OF RIVERSIDE ECONOMIC OUTLOOK AND FORECASTS 2015
15 The economy of Riverside County is heavily dependent on the broader Southern California region which includes | Woods Center for Economic Analysis and Forecasts, CSUF
the slow recovery in the construction and manufacturing sectors which often provide high paying jobs for low-education and low-skilled workers who were the hardest hit during the recession and the slow recovery. The long term prospects for the county remain promising. The County’s central location, proximity to the ports of Long Beach and Los Angeles, and relatively affordable land and large storage facilities, mean that the county will remain an ideal region for transportation and distribution of goods. A growing population will meet the future demand for labor. As the economic recovery continues to drive up the value of real estate in the coastal areas, residents in southern California will turn their attention to the relatively affordable housing available in the county. Southern California Leading Indicator The economy of Riverside County is heavily dependent on the broader Southern California region which includes Los Angeles County, Orange County, Riverside County, San Bernardino County, Ventura County, and Imperial County. The region is home to over 18 million people and represents a sizable economic geographic region. It generates a significant amount of goods and services and serves as an important hub for product transportation across the country and internationally. Economic development in the broader region tends to filter through to individual counties due to the deep economic integration within the region. A large number of residents live in one county (Riverside County, for example) but work in another county (OC or LA). Although the coastal areas led in the early part of the recovery while the inland regions have lagged, developments tend to be cross-shared over time given the degree of integration within the region. In fact, growth over the past two years has picked up more robustly in the inland regions (Riverside and San Bernardino) which have outperformed the coastal areas. To measure the short-term economic outlook for the Southern California region, CSUF has developed the Southern California Leading Economic Indicator (S.C. Leading Indicator). The S.C. Leading Indicator uses a combination of national and regional data to project economic activity in the broader region. At the national level, macroeconomic indicators used in the index include the interest rate spread, Standard & Poor’s S&P500 stock index and money supply adjusted for inflation. Regional variables include nonfarm employment, the unemployment rate, building permits and the Pacific Region consumer confidence index. An increase (decrease) in the S.C. Leading Indicator implies an increase (decrease) in economic activity in the Southern California region in the
next 3 to 6 months. The indicator has been found to accurately predict turning points in economic activity for Southern California (Figure B1).
The Southern California leading indicator increased by 0.97% in the fourth quarter of 2014 compared to the third quarter. This increase suggests a continued positive outlook for economic activity in the Southern California region over the next 3 to 6 months. The good news is that the indicator has now increased for over four years since the last decrease in the first quarter of 2009 at the height of the crisis. There has been an improvement in economic activity in the Southern California region and this expansion is expected to continue for the first half of 2015.
B2. Labor Market Outlook Payroll Employment: A Detailed Analysis The labor market continues to be a bright spot for Riverside County. Total nonfarm payrolls have increased at a much improved clip over the past three years, rising by a total of roughly 21,000 in 2012, 27,000 in 2013 and 26,000 in 2014 (Figure B2). The pace is slightly below the 2003-2006 period, when county payroll employment grew by an average annual pace of 32,000 jobs. Nonetheless, the growth during that period should be taken with much caution given the outsized excesses that led to the boom and eventual bust of the housing market. The pace we have witnessed more recently is devoid of those excesses and reflects a genuine improvement that bodes well for the county's economy. Just as important, the pace of job formation in the county has outpaced the state's and Southern California's for the third year in a row, a much welcome news given the devastating impact of the recession in the county's payroll jobs.
COUNTY OF RIVERSIDE ECONOMIC OUTLOOK AND FORECASTS 2015
16 B2. Labor Market Outlook | Woods Center for Economic Analysis and Forecasts, CSUF
These developments are even more impressive when compared to the losses inflicted by the recession because they underscore the sizable and much needed turnaround in the labor market that has occurred during the past three years. The county lost a staggering 102,400 jobs during the recession. Job growth commenced in November 2010 and has continued ever since with the county's payroll employment finally clawing back all the jobs lost during the recession in November 2014. Since the trough of the recession (November 2010), the county has regained a total of 102,700 jobs. To analyze the trend in payroll since the start of the recession on a year-over-year basis (which takes away the seasonal variation in the data) we index December 2007 nonfarm payroll to equal 100 (Figure B3). As seen, the county's payroll jobs have trended upward since November 2010 for 52 consecutive months. Job growth has continued in earnest early this year and we estimate that the county added roughly 25,000 jobs over the March 2014-March 2015 period.
Improvements in the labor market have led to a rapidly declining unemployment rate: the rate of unemployment in the County has fallen from a historic high of 14.5% in summer 2009 down to a current 6.6%. The county's unemployment rate averaged 6% over the decade preceding the crisis (1997-2007), which means that at the current level, the unemployment rate is just slightly above its long-term average (Figure B4). Another positive development for the county is that its labor force has grown during this period. This means that improvement in the unemployment rate may be stunted as discouraged workers and the marginally attached rejoin the labor force as employment and earning prospects brighten. Though this may mean that the unemployment rate may not decline as fast, it is certainly a positive development as the strength of the labor market also depend on the growth of the labor force. Comparing the unemployment rate across the neighboring counties of the broader Southern California region, it appears that historical trends are being re-asserted. The unemployment rate for Riverside County is higher than that of Orange County and slightly higher than the San Bernardino rate (Figure B5). This is in line with the historical pattern. What is a bit surprising is the fact that the unemployment rate for Riverside County is notably below that of Los Angeles: 6.6% in RV compared to 7.2% for LA County. Looking back historically, the two counties have had roughly similar unemployment rates. This is largely due to the fact that over the past two years, job growth in Riverside County (and San Bernardino) has outpaced that of Los Angeles. In addition, the lower unemployment rate recorded in Orange County is partly due to the fact that its labor force has shrunk by roughly 2% since 2007, a worrying development for OC as a smaller labor force (or one that is not growing rapidly) ultimately lowers the potential for growth in the region.
Figure B2Riverside County Change in Payroll Employment
(Y-on-Y changes)
Employment Development Department and WCEAF
COUNTY OF RIVERSIDE ECONOMIC OUTLOOK AND FORECASTS 2015
17 B2. Labor Market Outlook | Woods Center for Economic Analysis and Forecasts, CSUF
Despite these notable improvements, the unemployment rate for the two county Inland Empire region (RV-SB Metropolitan Statistical Area (MSA)) still ranks among the highest in the nation among the largest MSAs (those with population greater than 1 million). The two county region's unemployment rate is the 6th highest out of the fifty largest MSAs, an improvement over last year's ranking (4th worst), but high nonetheless. The Los Angeles - Long Beach - Anaheim MSA has now slipped in the 4th spot in terms of high unemployment, from the 10th spot recorded last year. Job Growth by Sector: Where are the bright spots? To better understand the outlook for the labor market in Riverside County, it is instructive to take a close look at job growth composition by sector. This is important because sectoral job growth provides a more complete view of the strength of the labor market recovery as it can spotlight more clearly the types of jobs that are being created in the county: whereas they are low-paying or high-paying or whether they require a high or low level of skill. The main issue with this analysis is that the Employment Development Department (EDD) provides data for the Riverside County by sector only up to December 2013. For more recent trends, we are compelled to use the sectoral employment data for the broader two-county region (which includes both Riverside County and San Bernardino). In our discussion below, we first take a look at the Riverside-specific data which cover the early part of the recovery (up to the end of 2013) and then we analyze the broader MSA which provides a more complete picture on the most recent trends (latest data is March 2015).
Looking at the early stage of the recovery, from summer 2010 (when the labor market recovery began) up until December 2013 there appears to be a familiar pattern on the type of jobs created: most jobs were in relatively low-paying sectors: Health Care & Social Assistance, Leisure & Hospitality, and Retail Trade. Health Care added 15,500 jobs during this period -- the strongest performing sector-- followed by Leisure & Hospitality (14,500 jobs) and Retail Trade (10,800 jobs). Employment also increased in the middle-income sector as the government sector added 9,200 jobs during this period and jobs in Educational Services increased by 2,800. More encouragingly, employment in higher-paying sectors also grew: Professional & Business Services added 9,200 jobs during this period. An even better news was the improvement in the Construction sector, where employment grew by 8,200 jobs -- certainly not enough to make up for the losses wreaked by the recession, but an improvement nonetheless (Figure B6).
Not surprisingly, the Riverside County labor market that emerged after the recession differed quite a bit from the pre-recession make-up in terms of sectoral composition and growth. The Construction and Manufacturing sectors have shrunk considerably compared to their pre-crisis levels: as of December 2013, Construction made up 7.3% of total employment rolls -- down from 11.5% in 2007. Though hiring in the Construction sector has picked up, the sector's employment remains dramatically below the pre-recession levels. Manufacturing has fared even worse with employment in this sector accounting only for 6.5% of total jobs nonfarm jobs down from 9% in 2007. As expected, the sectors that have expanded their labor market shares are those that have added jobs at a fast clip during the recovery: Health Care, Leisure & Hospitality
-4,100
900
1,000
2,800
3,500
6,000
8,200
9,200
9,200
10,800
14,500
15,500
Information
Financial Activities
Manufacturing
Educational Services
Wholesale Trade
Transportation, Warehousing & Utilities
Construction
Professional & Business Services
Government
Retail Trade
Leisure & Hospitality
Health Care & Social Assistance
Figure B6Employment Comparisons: 2010-2013: Riverside County
Employment Development Department and WCEAF
6.6%
5.8%
6.4%
5.5%
7.2%
5.8%
4.4%4.1%
0%
1%
2%
3%
4%
5%
6%
7%
8%
9%
Now 2000-2007
Figure B5Unemployment Rates: RV County vs other SoCal Counties
(percent)
RV SB LA OC
Employment Development Department and WCEAF
COUNTY OF RIVERSIDE ECONOMIC OUTLOOK AND FORECASTS 2015
18 B2. Labor Market Outlook | Woods Center for Economic Analysis and Forecasts, CSUF
and Transportation, Utilities & Warehousing. The Health Care sector accounted for 12.9% of all nonfarm payrolls jobs in the county as of December 2013, significantly higher than the 9.6% share it commanded in 2007. The share of employment in Leisure & Hospitality also grew from 12% in 2007 to 13.3% in 2013 as did Government employment which accounted for 18.5% of total jobs in December 2013 up from a 17.6% recorded in 2007 (Figure B7). Notably, the share of employment in the logistic sector (Transportation, Warehousing & Utilities) also expanded from 3.4% in 2007 to 4.2% in 2013.
To gain insight into more recent trends we now turn our attention to the broader Riverside-San Bernardino MSA which includes both the Riverside County and San Bernardino County. The Inland Empire region displays a labor market profile that tends to closely match the county's labor force characteristics and demographics. As such, the MSA labor outlook should serve as a good indicator for future employment trends and sectoral growth in Riverside County. The broader Riverside-San Bernardino MSA posted strong job gains over the past two years, adding a total of 46,500 jobs in 2012, 58,800 in 2013 and an additional 49,600 in 2014 (measured as December-to-December changes) (Figure B8). Job growth for the past two and a half years has averaged above 4% (on a year-over-year basis) the best clip since mid-2000 when economic growth was supported by the boom in the housing sector. More importantly, the strongest employment gains in 2014 were in Professional & Business Services which added 10,900 jobs from December 2013-December 2014. This matters because a large portion of the jobs in this sector are relatively well paid which means that the outlook for income growth for the two-county region is much improved over the forecast horizon. The logistic sector expanded by another 10,200 jobs and would have likely registered an
even higher clip had it not been for the Port disruptions and slowdown which began in the fourth quarter of 2014 and lasted well until February of this year. Leisure & Hospitality added an additional 8,200 jobs while the Health Care sector continued to expand growing by 5,300 jobs.
Long suffering sectors such as Construction and Manufacturing also expanded in 2014. Employment in Construction grew by 2,300 from December 2013-December 2014, whereas Manufacturing added an additional 2,500 jobs during that period. Construction jobs in particular are very important for the region not in the least because the sector suffered devastating losses during the recession with employment levels falling from over 130,000 to a low of 57,000 in 2010. Since then, the Inland Empire region has added a total of 18,300 construction jobs, certainly an improvement but a far cry from the pace necessary to regain pre-recession levels. In fact, we have argued for a while that while we expect employment in Construction to grow rapidly over the forecast horizon, it is unlikely that the sector will account for the same share of employment as it did during the housing boom. The region's employment make up has shifted quite a bit with Health Care, Leisure & Hospitality and the logistic sector accounting for a larger share of employment growth. A more complete picture on labor market trends emerges when we compare the current industry-specific employment levels to their pre-recession peaks. This analysis easily highlights the sectors that have grown more confidently and those that are still languishing. Figure B9 shows the difference between current employment levels (March 2015) relative to December 2007 for all major sectors.
Sector 2013 2007
Government 18.5% 17.6%
Retail Trade 14.7% 14.0%
Leisure & Hospitality 13.3% 12.0%
Health Care & Social Assistance 12.9% 9.6%
Professional & Business Services 9.9% 10.3%
Construction 7.3% 11.5%
Manufacturing 6.5% 9.0%
Transportation, Warehousing & Utilities 4.2% 3.4%
Wholesale Trade 3.8% 3.4%
Financial Activities 3.3% 3.7%
Educational Services 1.2% 1.0%
Information 1.0% 1.2%
Figure B7
Share of Employment, RV County
US Bureau of Labor Statistics and WCEAF
-100,000
-80,000
-60,000
-40,000
-20,000
0
20,000
40,000
60,000
80,000
2007 2008 2009 2010 2011 2012 2013 2014
Figure B8Change in Payroll Employment RV-SB MSA
(Year-over - Year change )
Employment Development Department and WCEAF
COUNTY OF RIVERSIDE ECONOMIC OUTLOOK AND FORECASTS 2015
19 B2. Labor Market Outlook | Woods Center for Economic Analysis and Forecasts, CSUF
The outlook is rather mixed: some sectors have fully recovered and expanded confidently during this period, while others have yet to make up the losses incurred during the recession. Not surprisingly, the largest employment gains during this 8-year period are in Health Care which has added an impressive nearly 45,000 jobs. The logistic sector (Transportation, Warehousing & Utilities) has also grown by 19,400 jobs compared to its pre-recession levels, followed by Leisure and Hospitality with a total of 18,300 jobs. Employment is still below pre-crisis levels for a handful of sectors: Retails Trade continues to languish with 19,400 fewer jobs now compared to December 2007, while Manufacturing and Construction have shrunk by 23,200 and 24,500, respectively, during this period.
The outlook for Riverside County's labor market is for continued improvement over the forecast horizon with job gains occurring broadly across all sectors. We expect employment in Construction to expand as the housing market continues to improve and housing construction ramps up. Professional & Business Services, Health Care, and Leisure & Hospitality should continue to lead the way. We also anticipate a pick-up in State and Local Government employment as the budget outlook has improved dramatically compared to just a few years ago. The logistic sector should also continue to expand confidently, though the first half of the year will likely be a bit challenging for this sector given the disruptions and associated slowdown in the two Ports. However, we do expect this sector to add jobs over the forecast horizon given the increased importance of international trade in the region's economy. The County's unemployment rate is expected to reach 6.3% by end-2015 and 6.0% by end-2016.
B3. Real Estate Market Housing Market: Turning the Corner Arguably the most welcome news for Riverside County is that single-family median home prices have increased by over 10% for three consecutive years. According to data provided by California Association of Realtors (CAR), median home prices of existing single-family homes rose by 10.8% in 2012, by 27.6% in 2013 and an additional 11.9% in 2014. Starting in March 2012, single-family median home prices have risen over an impressive 35 out of 36 months (on a year-over-year basis) (Figure B10). As of February 2015, the single-family median home price reached $323,220 which is slightly higher than the $320,159 value in January 2008. However, the current single-family median home price still remain -25.1% below the peak value of $431,713 recorded in June 2006.
However, following the regional and national trends, the rate of home price appreciation in the county edged down considerably since mid-2014. Beginning in June 2014, home prices in the County have risen by an average of 6.2% (year-over-year), a sizable downshift from the 20+ percent growth recorded in the previous two years. This moderation was expected, as we cautioned in our last year's report. The initial surge in home prices was due to an outsized investor demand in the early stages of the housing recovery and a limited inventory of homes for sale. Investor demand in the county was unprecedented from mid-2012 until early 2014 as equity firms and real estate investment trusts (such as Colony Capital and Blackstone) aggressively invested in real estate, scooping up large swathes of housing development at rock bottom prices. In addition, tight home inventory placed additional upward pressure on home prices: the unsold inventory of existing homes in Riverside County was only 4.7 months in December 2014, while the figure for San Bernardino was 4.4 months. Both readings are below their long-run levels.
COUNTY OF RIVERSIDE ECONOMIC OUTLOOK AND FORECASTS 2015
20 B2. Labor Market Outlook | Woods Center for Economic Analysis and Forecasts, CSUF
As prices surged and inventories tightened, there were fewer bargain deals, which meant that investor demand eventually waned. Traditional homebuyers have replaced some of the vacuum created by investors, but the hand-off from investors to households has been weak and hesitant. A number of reasons explains the reluctance of households to embark on large-scale purchases (such as homes) including, low wage growth, tight underwriting standards, and declining affordability in the region. This explains the more tepid growth in home prices in the second half of 2014 and in early 2015. The market for new single family homes has also seen large increases in prices but to a lesser extent than prices for existing homes. New home prices rose by 0.4% from December 2011-December 2012, by a staggering 21.9% from December 2012-December 2013, and by a more subdued 3.6% from December 2013 - November 2014 (latest available data). As of November 2014, prices of new single family homes reached $376,000 and are now in line with prices in December 2007. One of the most noteworthy positive development is the sharp decrease in foreclosure activity. Foreclosure activity in Riverside County (mortgage default notices, auction sale notices and bank repossessions) declined by 16.3% in in 2014. Foreclosures peaked at 11,523 in 2008Q3 and had fallen to just 822 by 2014Q2 (Figure B11). In fact, Riverside County has dropped from the top spot in foreclosure activity in the state to a current 6th spot, a notable improvement. Just as encouraging, the number of properties in Riverside County with negative equity in is much improved dropping from above 50% at the height of the crisis to 17% in Q4 2014. This is above the national average of mortgages underwater (currently at 11%) but an impressive turnaround compared to the crisis.
As expected, the sharp home price appreciation has chipped away at the housing affordability in the county, one of the negative side-effects of the housing rebound over the last three years. The housing affordability index for the county remained constant around 41 throughout 2014 which means that 41% of residents were able to afford the median priced home. The best time in recent years to purchase a home was in 2012 where the housing affordability index was near record levels at 62% (Figure B12). With mortgage interest rates expected to rise sometime in 2015 and continued appreciation in home values in the region, housing affordability is likely to continue to decline.
The slow entrance of traditional buyers is even more evident when looking at home sales. Existing detached home sales have declined during 30 out of the last 31 months (on a year-over-year basis). In 2014, sales declined by -5.6% or 21,636 compared to the previous year. This comes on the heels of another sizable -11.4% decline in 2013. This negative trend has continued into 2015 with sales down -10.9% in January and an additional -7.7% in February compared to year-ago levels (Figure B13). On the plus side, new home sales in Riverside County continue to increase with 1,368 sales recorded as of Q4 2014, up 9.3% compared to a year ago. Another positive development is that the share of distressed sales in Riverside County has declined to 13% in February 2015 compared to 18% a year ago. The surge in home prices has boosted household net worth in the county, improved consumer confidence and will likely further stimulate consumption spending. The County's Assessor's Office has already begun to reverse the temporary Proposition 8 property tax reduction and will continue to do so over the next few years, which should lead to additional increases in the value of secured assessment rolls.
0
2,000
4,000
6,000
8,000
10,000
12,000
14,000
Q1/05 Q3/06 Q1/08 Q3/09 Q1/11 Q3/12 Q1/14
Figure B11Foreclosures
CoreLogic and WCEAF
COUNTY OF RIVERSIDE ECONOMIC OUTLOOK AND FORECASTS 2015
21 B2. Labor Market Outlook | Woods Center for Economic Analysis and Forecasts, CSUF
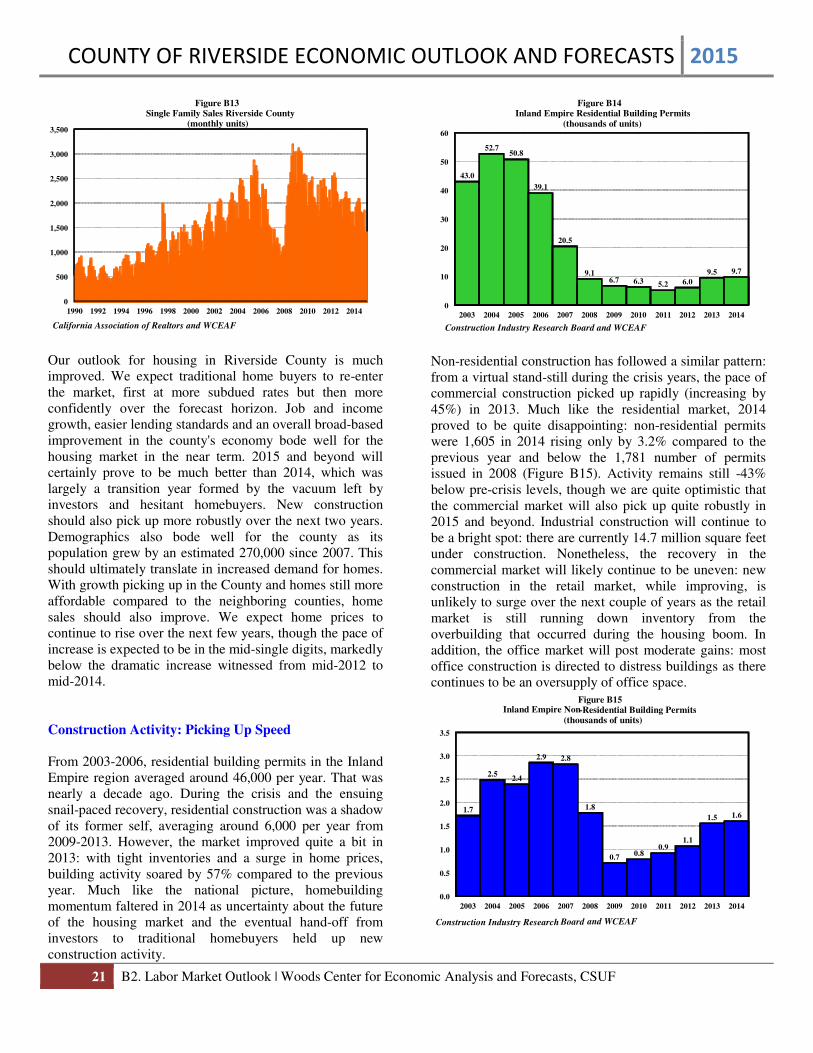
Our outlook for housing in Riverside County is much improved. We expect traditional home buyers to re-enter the market, first at more subdued rates but then more confidently over the forecast horizon. Job and income growth, easier lending standards and an overall broad-based improvement in the county's economy bode well for the housing market in the near term. 2015 and beyond will certainly prove to be much better than 2014, which was largely a transition year formed by the vacuum left by investors and hesitant homebuyers. New construction should also pick up more robustly over the next two years. Demographics also bode well for the county as its population grew by an estimated 270,000 since 2007. This should ultimately translate in increased demand for homes. With growth picking up in the County and homes still more affordable compared to the neighboring counties, home sales should also improve. We expect home prices to continue to rise over the next few years, though the pace of increase is expected to be in the mid-single digits, markedly below the dramatic increase witnessed from mid-2012 to mid-2014. Construction Activity: Picking Up Speed From 2003-2006, residential building permits in the Inland Empire region averaged around 46,000 per year. That was nearly a decade ago. During the crisis and the ensuing snail-paced recovery, residential construction was a shadow of its former self, averaging around 6,000 per year from 2009-2013. However, the market improved quite a bit in 2013: with tight inventories and a surge in home prices, building activity soared by 57% compared to the previous year. Much like the national picture, homebuilding momentum faltered in 2014 as uncertainty about the future of the housing market and the eventual hand-off from investors to traditional homebuyers held up new construction activity.
Non-residential construction has followed a similar pattern: from a virtual stand-still during the crisis years, the pace of commercial construction picked up rapidly (increasing by 45%) in 2013. Much like the residential market, 2014 proved to be quite disappointing: non-residential permits were 1,605 in 2014 rising only by 3.2% compared to the previous year and below the 1,781 number of permits issued in 2008 (Figure B15). Activity remains still -43% below pre-crisis levels, though we are quite optimistic that the commercial market will also pick up quite robustly in 2015 and beyond. Industrial construction will continue to be a bright spot: there are currently 14.7 million square feet under construction. Nonetheless, the recovery in the commercial market will likely continue to be uneven: new construction in the retail market, while improving, is unlikely to surge over the next couple of years as the retail market is still running down inventory from the overbuilding that occurred during the housing boom. In addition, the office market will post moderate gains: most office construction is directed to distress buildings as there continues to be an oversupply of office space.
COUNTY OF RIVERSIDE ECONOMIC OUTLOOK AND FORECASTS 2015
22 B2. Labor Market Outlook | Woods Center for Economic Analysis and Forecasts, CSUF
We expect construction activity to pick up speed in 2015 and beyond and shake off the poor performance in 2014. Much like the national picture, and perhaps even more so, the housing market is likely undersupplied due in large part to years of underinvestment following the devastating impact of the housing crisis. Demand is certainly firming up as the population of the county continues to grow and household finances appear to be on firmer ground. The county’s housing market, despite recent price gains, is still very attractively priced compared to the neighboring coastal counties. In addition, we expect lending standards to become more favorable over the forecast horizon with new policies put in place by FHA and FHFA recently. In particular, the decision to allow Fannie Mae and Freddie Mac to purchase certain mortgage loans with only 3% down payment should be beneficial to the county as it is likely to help lower income borrowers. Another positive is that first-time home buyer affordability remains relatively high at around 64 so that 64% of first-time home-buyers can afford the median home price in the county. Consequently we expect housing construction to pick up steam over the next few years. We also expect a pickup in activity in non-residential construction particularly in industrial and retail sectors.
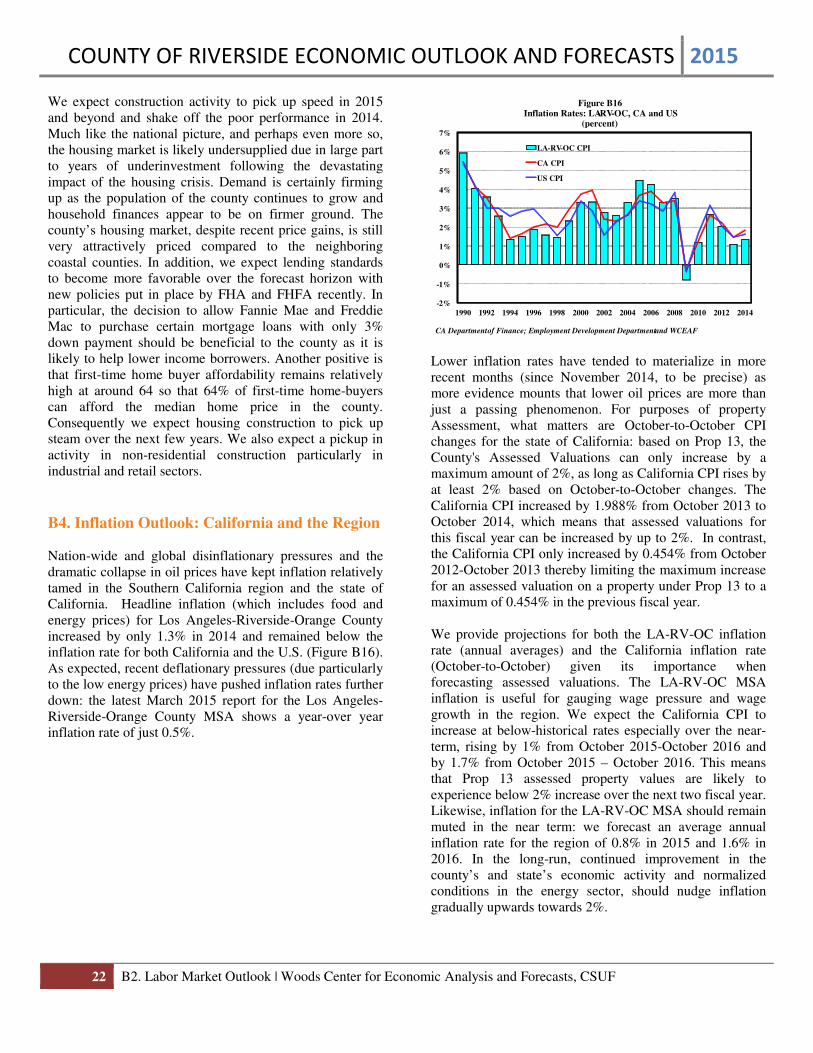
B4. Inflation Outlook: California and the Region Nation-wide and global disinflationary pressures and the dramatic collapse in oil prices have kept inflation relatively tamed in the Southern California region and the state of California. Headline inflation (which includes food and energy prices) for Los Angeles-Riverside-Orange County increased by only 1.3% in 2014 and remained below the inflation rate for both California and the U.S. (Figure B16). As expected, recent deflationary pressures (due particularly to the low energy prices) have pushed inflation rates further down: the latest March 2015 report for the Los Angeles-Riverside-Orange County MSA shows a year-over year inflation rate of just 0.5%.
Lower inflation rates have tended to materialize in more recent months (since November 2014, to be precise) as more evidence mounts that lower oil prices are more than just a passing phenomenon. For purposes of property Assessment, what matters are October-to-October CPI changes for the state of California: based on Prop 13, the County's Assessed Valuations can only increase by a maximum amount of 2%, as long as California CPI rises by at least 2% based on October-to-October changes. The California CPI increased by 1.988% from October 2013 to October 2014, which means that assessed valuations for this fiscal year can be increased by up to 2%. In contrast, the California CPI only increased by 0.454% from October 2012-October 2013 thereby limiting the maximum increase for an assessed valuation on a property under Prop 13 to a maximum of 0.454% in the previous fiscal year. We provide projections for both the LA-RV-OC inflation rate (annual averages) and the California inflation rate (October-to-October) given its importance when forecasting assessed valuations. The LA-RV-OC MSA inflation is useful for gauging wage pressure and wage growth in the region. We expect the California CPI to increase at below-historical rates especially over the near-term, rising by 1% from October 2015-October 2016 and by 1.7% from October 2015 – October 2016. This means that Prop 13 assessed property values are likely to experience below 2% increase over the next two fiscal year. Likewise, inflation for the LA-RV-OC MSA should remain muted in the near term: we forecast an average annual inflation rate for the region of 0.8% in 2015 and 1.6% in 2016. In the long-run, continued improvement in the county’s and state’s economic activity and normalized conditions in the energy sector, should nudge inflation gradually upwards towards 2%.
CA Department of Finance; Employment Development Department and WCEAF
COUNTY OF RIVERSIDE ECONOMIC OUTLOOK AND FORECASTS 2015
23 B2. Labor Market Outlook | Woods Center for Economic Analysis and Forecasts, CSUF
B5. Projections of Riverside County Main Economic Variables
Table B1 Riverside County Macroeconomic Forecasts
Year Payroll Employment
(y-o-y percent change) Unemployment
(percent)
Single Family Median House Prices
(level)
Historical
2012 2.3 12.1 $222,400
2013 4.6 10.3 $283,630
2014 3.6 8.2 $317,420
Forecast
2015 3.5 6.4 $342,179
2016 3.8 6.2 $366,816
2017 3.5 6.0 $391,759
2018 2.8 5.9 $417,223
2019 2.7 6.0 $444,343
Table B2 Riverside County Macroeconomic Forecasts
Year California CPI
(October-to-October) LA-RV-OC CPI
(y-o-y percent change)
Residential Building Permits RV-SB
(thousands of units)
Historical
2012 3.1 2.0 6.0
2013 0.5 1.1 9.5
2014 2.0 1.3 9.7
Forecast
2015 1.0 0.8 12.4
2016 1.7 1.6 15.6
2017 2.3 2.0 17.2
2018 2.5 2.1 16.5
2019 2.3 2.2 15.8
COUNTY OF RIVERSIDE ECONOMIC OUTLOOK AND FORECASTS 2015
24 C. RIVERSIDE COUNTY | Woods Center for Economic Analysis and Forecasts, CSUF
C. RIVERSIDE COUNTY BUDGETARY VARIABLES
C1. Overview of Assessed Property Values The County’s Assessment roll rose for the second year in a row in FY 2014-2015, by an impressive 7.74%. This follows the 3.95% increase for FY 2013-2014. The figures for secured rolls are even more encouraging with secured valuations rising by 8% in FY 2014-2015 and 4% in 2013-2014. At slightly above $229 billion in FY 2014-2015, the County’s Assessment roll stands only 6% below the all-time high of $243 billion recorded in 2007. Since hitting a bottom of $204 billion in FY 2011-2012, assessed valuations have risen by a total of 12% -- not enough to fully offset the drastic fall during the crisis, but quite an improvement nonetheless. A number of reasons accounted for the strong growth in assessment values over the past fiscal year: strong home price appreciations due to investor demand, the reversal of many temporary Prop 8 reductions, the full 2% applied to Prop 13 real estate and impressive growth in the industrial and apartment sectors. As expected, continued improvement in home valuations have led to a marked reduction in the number of properties in the County receiving a Prop 8 reduction. During FY 2014-2015, only 275,569 properties were under Prop 8, with the average reduction around $93,203. This is a substantial improvement compared to FY 2013-2014 when 395,217 properties received Prop 8 reduction with the average reduction coming at around $98,608. It is important to note that while the County’s assessment rolls will likely reach pre-recession levels in the next fiscal year (FY 2015-2016), the crisis has certainly left its imprint, changing the growth trajectory of growth to a lower gear. The county's assessment roll has undergone a semi-structural shift since the crisis as increases in foreclosures and distressed sales have prompted the reevaluation of over 200,000 of the county's properties (23% of total) to a lower base. Continued growth over the forecast horizon will reverse some of the havoc wreaked by the housing collapse as new construction ramps up to keep up with a growing population. But some damage will be lasting and the assessment roll will settle in a lower trajectory compared to the “no crisis” scenario. A simple calculation highlights this point: note that had the assessment roll increased by 2% per year since 2008-2009, the current 2014-2015 roll would be roughly around 20% higher than its current level.
C2. Secured Assessed Valuation and Projections The Woods Center for Economic Analysis and Forecasting (WCEAF) at California State University Fullerton, analyzed secured property tax data provided by the County of Riverside on 905,812 property parcels for FY 2014-2015. This excludes a number of items such as tax exemptions, fixtures, trees & vines, unsecured property, personal property as well as other data which are subject to time-recording and other accounting issues and differ to some extent from the data used by the Riverside County Assessor's office. The parcel data used by CSUF, nonetheless, provides a good representation of the overall assessment roll for the county. For FY 2014-2015 the data accounted for 94.3% ($216,363,683,251/$229,460,826,365 = 94.3%) of the total assessed roll. This means that our projections provide a close representation of the entire assessed roll (secured plus unsecured). The Woods Center at CSUF has developed, maintains and updates econometric models that integrate a number of variables at the national and regional level to project secured assessed valuations. The national model is used to project national variables (such as real Consumption Spending, real Business Fixed Investments (residential and non-residential), real Government Spending (federal, state and local), and real Net Exports) that capture economic activity at the national level. Financial variable forecasts, particularly interest rates (mortgage rates) are also produced given their close relationship to the real estate market. The national projections are then filtered through to our regional model which is used to forecast trends at the county level for a large number of key metrics: employment, unemployment, foreclosures, housing prices, construction activity, building permits, and earnings. These forecasts are then used in our econometric model augmented with parcel data which provides a very detailed picture of the property market in the county for all parcel types. The information processed includes micro-level data on assessed valuation and property tax delinquencies. More importantly, our database has grown during the years that we have collaborated with the county on this project, so now we are able to incorporate a time-series dimension to our analysis which further enhances the accuracy of the forecasts. Our model also incorporates policy aspects related to assessed valuations such as: Proposition 13, Proposition 8, and changes in monetary and fiscal policy with direct effects to the real estate market (interest rates or changes in tax laws, for example).
COUNTY OF RIVERSIDE ECONOMIC OUTLOOK AND FORECASTS 2015
25 BUDGETARY VARIABLES | Woods Center for Economic Analysis and Forecasts, CSUF
Given the significantly improved economic conditions and real estate market, we forecast an overall increase in the County’s secured valuations of 8.2% in FY 2015-2016. This is largely due to a continued improvement in the residential market as demand firms up and prices continue to increase, albeit at a slower rate than the one recorded in 2013 and early 2014. Increases in property values will induce continued and sizable reversals of the temporary Proposition 8 reductions on both commercial and residential properties. We expect the reversal of Proposition 8 temporary reductions to continue over the next two fiscal years with the vast majority of reversals completing in FY 2015-2016. Properties that fall under Proposition 13 (generally those with base-year pre-2005) will receive up to the maximum 2% increase in assessed valuation as mandated by the law. This is because the California CPI inflation rate rose by 1.998% from October 2013-October 2014. Secured assessed valuations are projected to increase by a further 7.2% in FY 2015-2016 and an additional 6.8% in FY 2016-2017. The (slightly) lower projected growth in 2015-2016 is not a reflection of the strength of the housing market (which should continue to pick up) but rather a by-product of lower forecasted inflation for the state of California which means that a lower increase will be applied to Prop 13 properties than the allowable maximum
of 2%. This should slightly restrain the growth in property rolls for the county. For the remainder of the forecast horizon, property values are expected to continue to increase as the economy strengthens and demand for housing increases (Table C1 and Figure C1).
COUNTY OF RIVERSIDE ECONOMIC OUTLOOK AND FORECASTS 2015
26 BUDGETARY VARIABLES | Woods Center for Economic Analysis and Forecasts, CSUF
C3. Detailed Analysis on Parcel Data and Property Tax Delinquencies The County provided The Woods Center at CSUF with 905,812 parcels that amounted to a total secured assessed valuation of $216,363,683,251 in FY 2014-2015. This is lower than the complete assessed value reported by the Assessor's Office ($229,460,826,365) which includes unsecured property and is also below the secured county tax roll of $221,741,016,977. The reason for some of the differences between the micro-level parcel data and secured rolls reported by the Assessor's Office has to do with timing discrepancies between recording and reporting of the data. Also, there is a time-lag between the date of this report and the cut-off date of parcel data provided by the county. The data provides a snapshot of assessed valuations around October/November 2014, roughly around 6 months prior to this report. The reporting lag is related to property tax delinquencies: to evaluate tax delinquencies, assessed values from the Assessor's Office are merged with the property tax payment data from the Treasurer's Office with a cut-off date around October/November 2014. Despite these timing issues, our data is fairly comprehensive: the majority of the total secured assessed property valuation for the county comes from secured property (land and structures). To increase the precision of the forecasts, our econometric models use the micro-level parcel data from six months ago and the most recent trends in macro-level assessed rolls provided by the Assessor's Office on a weekly basis. The projections are based on the combined micro and macro-level data with the latest update of the macro-level AV roll as of 4/20/2015. The parcels were classified into the following seven categories: Residential, Time Shares, Manufactured Homes, Vacant, Commercial, Agricultural and Unassigned Code. Secured assessed property values for FY 2014-2015 from residential parcels (single and multifamily including condominiums but excluding apartments) totaled $152,302,919,915, which accounts for 70.4% of all assessed valuation. Commercial parcels accounted for the second largest share (over 23%) totaling $50,877,517,043. The remaining categories totaled $13,880,015,410 or 6.4% of assessed valuations in Riverside County. To gain a broader perspective on the strength of the real estate market and the health of the overall economy for the County, we also analyze property tax delinquencies based on the parcel data provided by the county. There were 47,345 (5.23% of total) property owners delinquent on paying their property taxes (at least one installment) in FY
2013-2014 (the most recent data available). The number of property owners delinquent on both installments was 37,868 (4.18%). As expected, these numbers have improved materially over the past two years: the total number of delinquent properties in FY 2012-2013 was 49,333 (5.46%) and 55,561 (6.15%) in FY 2011-2012. Though these comparisons are somewhat complicated by the fact that the number of parcels provided by the County does change from year to year, there is an unmistaken trend over the past few years towards fewer property tax delinquencies which reflects improvements in the broader economy and real estate market. Property tax delinquencies are used in our model as a warning signal for the overall health of the local economy and potential strains in the local residents. A broadly improving labor market, continued gains in home valuations and nascent signs of income growth, have combined for a much more robust household sector than just a few short years ago. With stronger projected growth over the next few years, property tax delinquencies are expected to continue to decline over the forecast horizon. Riverside County Non-Commercial Properties Non-commercial properties account for the lion's share of the County's property parcels: 862,766 out of 905,812 total parcels. The value of residential properties rose for a second year in the row. Despite the surge in property values over the last couple of years, 272,186 of non-commercial parcels still received a temporary Proposition 8 reduction in assessed valuation during FY 2014-2015. However, this is quite a remarkable improvement over the 391,442 non-commercial properties under Prop 8 in the previous year. Prop 8 reductions for non-commercial properties lowered the County's secured assessment rolls by $22.6 billion in FY 2014-2015, which is less than the $35.4 billion decline recorded the previous year. Not surprisingly, residential properties account for the largest share of Prop 8 reductions: 126,441 residential properties continued to be under Prop 8 in FY 2014-2015, accounting for 46.5% of all non-commercial properties with such a reduction. This translated to a total assessed value reduction of $15.6 billion, with an average reduction of $123,701. The average reduction is slightly higher than the previous year (FY 2013-2014) when 217,859 residential parcels received an average $120,406 reduction. This should not come as surprise: as the housing market heals and valuations improve, only the hardest hit properties (those bought at the height of the housing boom) will continue to receive a Prop 8 reduction, which means that
COUNTY OF RIVERSIDE ECONOMIC OUTLOOK AND FORECASTS 2015
27 BUDGETARY VARIABLES | Woods Center for Economic Analysis and Forecasts, CSUF
the average reduction may continue to remain high even as the overall number of parcels receiving it shrinks. There were 83,667 time shares (accounting for 30.7% of non-commercial properties) under Prop 8 in FY 2014-2015 with an average reduction of $7,879. This is just under 10,000 fewer time share properties compared to the previous fiscal year when 93,585 timeshares received an average reduction of $7,759. The number of apartments under Prop 8 remains low at 629 in FY 2013-2014 but the average amount is relatively high at $634,868. InFY 2013-2014, there were 700 apartments receiving an average $857,076 reduction. Prop 8 reductions were also applied to condominiums ($3.1 billion), vacant land ($2.0 billion) and other property ($1.7 billion). A positive impact on the regional economy is that property tax delinquencies for non-commercial property continued to decline. Owners of residential parcels account for the largest amount of delinquencies: single-family and multi-family delinquencies amounted to $28,784,948 (or 66.1% of total delinquent non-commercial property taxes). Delinquencies for vacant land (residential, mountain, desert) and manufactured homes was $9,079,011 (16.4% of total delinquencies). Delinquencies for agricultural property were $4,850,185 (8.8% of the total), those for apartments were $875,553 (1.6% of the total) and delinquencies for Condominiums or Planned Unit Developments were $571,556 (1.3% of the total). Riverside County Commercial Properties The County provided parcel data for 43,046 commercial parcels for FY 2014-2015. These consist of commercial building on leased land, vacant commercial, special use, and other types. There has been a marked improvement in the commercial real estate market in the County over the past couple of years and that trend has continued into the current year. As expected, the recovery has been uneven with the industrial and apartment sectors surging ahead followed by retail and office markets. The good news is that retail and office markets have also turned a corner and are showing signs of growth, albeit at a slower rate. The industrial market has been the brightest spot during this recovery. Vacancy rates have now declined to 5.11% in 2015Q1 from the already low levels of 5.15% in 2014Q4. The vacancy rate is particularly low for industrial property of below 100 square foot -- at 3.08% in 2015Q1. Average lease rates dropped to $0.41 from $0.43 in 2014Q4 because of a strong increase in construction. Construction activity has picked up with 18.6 million square feet under construction. The industrial segment is expected to continued to grow with a relatively large number of planned development projects. Given that the
county is heavily involved in logistics, the demand for industrial property should continue to increase particularly for mega-warehouses. Asking rents for Class A&B Apartments continued their upward march posting an additional 5.4% increase in Q4 2014 to $1,204. As home buying has been quite challenging over the past few years due to stringent lending, weak household balance sheets, and slow job growth, many families have opted to rent and the increased demand has put an upward pressure on rental rates. Asking rents for Class A&B Apartments are now 3.3% higher than the peak value of $1,165 recorded in Q1 2008. Rents have risen over all quarters of 2014 (on a year-over-year basis) causing the Inland Empire to rank seventh out of the top metro areas where renters spent a significant amount of their income on rent -- roughly 37%. The retail market has begun to recover but still lags behind the pace of the industrial market. Vacancy rates are declining and in Q1 2015 stood at 7.6%, lower than 8.0% rate recorded a year ago. Average asking lease rates have remained relatively flat at $1.36. There was 244,777 square feet of retail space under construction in the Inland Empire at the end of Q1 2015, most of which has come from new developments in shopping centers particularly in the eastern part of the region. The outlook for the retail market is much improved over the forecast horizon as demand for retail space firms up and the underinvestment over the past few years is expected to lead to a pick-up in construction activity. While there have been some gains in the office market, this sector is still the laggard amongst the commercial real estate sectors. Office vacancy rates have improved but still remain elevated at over 12.5%. Average leasing rates have stayed flat at $1.75 in 2015Q1. The annual net absorption rates remains below 500,000 square feet which is considerably less than the over 1,500,000 which occurred in 2005 and 2006. However, this sector is also improving and is expected to perform much better over the forecast horizon: decreases in vacant and available space will ultimately lead to an uptick in construction. In addition, demand should firm up in response to continued increases in office rents in Orange County and other neighboring regions. Focusing on assessed valuations, there were a total of 3,383 commercial properties that received Prop 8 reductions in FY 2014-2015 totaling $3,098,374,867 with the average reduction of $915,866. This represents a reduction of nearly 20% in the number of properties under Prop 8 compared to the previous fiscal year, when 3,775 properties received an average reduction of $953,788, totaling $3,600,548,582.
COUNTY OF RIVERSIDE ECONOMIC OUTLOOK AND FORECASTS 2015
28 BUDGETARY VARIABLES | Woods Center for Economic Analysis and Forecasts, CSUF
The process of evaluation of Prop 8 reductions is significantly more complex for commercial than residential properties as it requires a thorough study of the fundamentals of each commercial property. In contrast, there are typically numerous similar properties in a residential neighborhood that can be used to determine valuations for the residential market. Reassessment appeals for commercial properties will continue over next fiscal year, but much like the residential market, appeals appear to be flattening out. The number of commercial property owners that defaulted on property tax payments in FY 2013-2014, declined compared to the previous fiscal year. Property tax delinquencies on commercial properties amounted to $9,399,044 (17.0% of total of delinquencies). As the region continues to recover, delinquencies on commercial properties are expected to decrease over the next few years. After a couple of lackluster years of growth, commercial properties are projected to add more robustly to the county's assessment rolls over the forecast horizon. Nonetheless, the growth will likely trail that of the non-commercial sector, particularly in the near term. Having said that, we forecast that commercial property values will increase at a more robust rate over the next few years compared to the recent past (Figure C2). All sub-segments of the market should help with the industrial sector continuing to lead followed by retail and office markets.
C4. Motor Vehicle Licensing Fee (in Lieu) Motor Vehicle Licensing Fee (MVLF) revenue is based on assessed property values. In FY 2005-06, the state converted MVLF revenue into property taxes in lieu of MVLF. This source of revenue is linked to assessed valuation. Nonetheless, there are significant deviations from the assessed valuation trend on a historical basis. For example, during FY 2005-06, there was an underestimate of MVLF for Riverside County. To correct for the underpayment, an additional payment was made in FY 2006-07, causing the MVLF revenue in FY 2006-07 to be higher than what the actual payment should have been. Thus while this source of revenue tends to grow and fall at a similar rate to assessed property taxes, the state adjustments for underpayments or overpayments frequently distorts the underlying trend for MVLF revenue, sometimes by a large margin (Figure C3).
The major driving variables used to project MVLF revenue in our econometric models are assessed valuations, regional macroeconomic variables as well as the underlying trend for MVLF. In addition, factors that affect the County's real estate market and assessed valuation (such as changing property values, property tax delinquencies, foreclosures, nonfarm payroll and earnings) and the broader health of the local economy are also part of our forecasting model in projecting MVLF. We also use the underlying historical trend in MVLF revenue in order to adjust for state underpayments or overpayments which tends to change core projections for MVLF revenue. Thus, the underlying trend in MVLF (past historical lags) which include the adjustments by the state do play a role in our projected values (shown in table C2). Having said that, assessed valuations are the main driving force behind the MVLF revenue projections with past state adjustments having a smaller impact over the forecast horizon.
194207
218 232
248 266
284
-17.9%
3.6%
4.3%
5.2%
6.3%
6.9%
7.2% 7.0%
-30%
-20%
-10%
0%
10%
20%
30%
40%
50%
0
50
100
150
200
250
300
Figure C3 Motor Vehicle License Fee: Historical and Forecasts
(level, millions of dollars and y-o -y percent change)
MVLF Revenue (level, $ millions, lhs)
y -o -y percent change (rhs)
Riverside County Executive Office and WCEAF 8.8
7.46.9
6.5
5.85.76.1
6.4
5.8
5.2
0.0
1.0
2.0
3.0
4.0
5.0
6.0
7.0
8.0
9.0
10.0
15-16 16 -17 17 -18 18 -19 19-20
Figure C2Forecasted Growth: Commercial and Non - Commercial Property
(percent)
Non-Commercial Commercial
Riverside County Assessor's Office and WCEAF
COUNTY OF RIVERSIDE ECONOMIC OUTLOOK AND FORECASTS 2015
29 BUDGETARY VARIABLES | Woods Center for Economic Analysis and Forecasts, CSUF
There has been little growth in MVLF revenue over the last few years: this source of revenue increased by a meager 3.8% in FY 2013-2014 following a -2.1% decrease in FY 2012-2013. MVLF revenue is projected to increase by 6.6% (to $207,267,421) in FY 2014-2015, by 5.2% (to $218,045,327) in FY 2015-2016 and by 6.3% (to $231,782,183) in FY 2016-2017. MVLF revenue is forecasted to expand more robustly in the long term as the real estate market recovers and assessed valuations continue to grow.
Table C2 Motor Vehicle Licensing Fees Dollars
Fiscal Year Dollars Growth
Historical
11-12 191,348,791 1.1%
12-13 187,265,007 -2.1%
13-14 194,434,729 3.8%
Forecast
14-15 207,267,421 6.6%
15-16 218,045,327 5.2%
16-17 231,782,183 6.3%
17-18 247,775,153 6.9%
18-19 265,614,964 7.2%
19-20 284,208,012 7.0%
C5. Documentary Transfer Tax Documentary transfer tax is a source of revenue for the county typically resulting from a transfer of ownership of real property. Historical and projected values for this source of revenue for the county are provided in Table C3. The tax rate for the City of Riverside is $1.10 for every $500 of net consideration or value conveyed; the tax rate for all other cities and the unincorporated areas of the County of Riverside is $.55 for every $500 of net consideration or value conveyed. The amount of documentary transfer tax per year depends on home sales, building permits, refinancing, changes in property values, payroll employment growth, foreclosure rates, and other factors that cause a change in ownership or a change in the structure of the property. Strong investor-driven activity helped boost documentary transfer taxes in FY 2012-2013 by 18.8% and by an additional 10.5% in FY 2013-2014. While documentary transfer taxes have
increased for the last two fiscal years, this source of revenue is still below the $13,477,571 level that was recorded in FY 2007-2008. Home sales have been rather soft over the past year in part because traditional homebuyers have not quite filled in the vacuum left by investors in the residential market. This has somewhat dampened growth in documentary transfer tax. However, this is more than offset by improved real estate valuations and by the recent rise in construction activity throughout the county. Documentary transfer tax revenue is projected to increase by 6.3% (to $13,061,917) in FY 2014-2015 and by an additional 15.3% (to $15,060,390) in FY 2015-2016. In the long term, documentary transfer tax revenue is expected to continue to grow as the recovery in the real estate market continues to expand.