COUNTY PROFILE: Zapata County, Texas http://www.healthdata.org Zapata County, Texas | page 1 US COUNTY PERFORMANCE The Institute for Health Metrics and Evaluation (IHME) at the University of Washington analyzed the performance of all 3,142 US counties or county-equivalents in terms of life expectancy at birth, mortality rates for select causes, alcohol use, smoking prevalence, obesity prevalence, and recommended physical activity using novel small area estimation techniques and the most up-to-date county-level information. Explore more results using the interactive US Health Map data visualization (http://vizhub.healthdata.org/subnational/usa). FINDINGS: LIFE EXPECTANCY Sex Zapata County Texas National National rank % change 1980-2014 Female 81.9 80.8 81.5 702 +1.7 Male 76.6 76.2 76.7 1117 +8.4 life expectancy at birth (years), 2014 Fig. 1: Female life expectancy, 2014 Fig. 2: Male life expectancy, 2014 FINDINGS: ALL-CAUSE MORTALITY Sex Zapata County Texas National National rank % change 1980-2014 Female 637.9 694.2 667.8 691 -3.2 Male 889.7 954.8 930.1 731 -30.2 rate per 100,000 population, age-standardized, 2014 Fig. 3: Female all-cause mortality, 2014 Fig. 4: Male all-cause mortality, 2014
Transcript
COUNTY PROFILE: Zapata County, Texas
http://www.healthdata.org Zapata County, Texas | page 1
US COUNTY PERFORMANCEThe Institute for Health Metrics and Evaluation (IHME) at the University of Washington analyzed the performance of all 3,142US counties or county-equivalents in terms of life expectancy at birth, mortality rates for select causes, alcohol use, smokingprevalence, obesity prevalence, and recommended physical activity using novel small area estimation techniques and themost up-to-date county-level information.
Explore more results using the interactive US Health Map data visualization (http://vizhub.healthdata.org/subnational/usa).
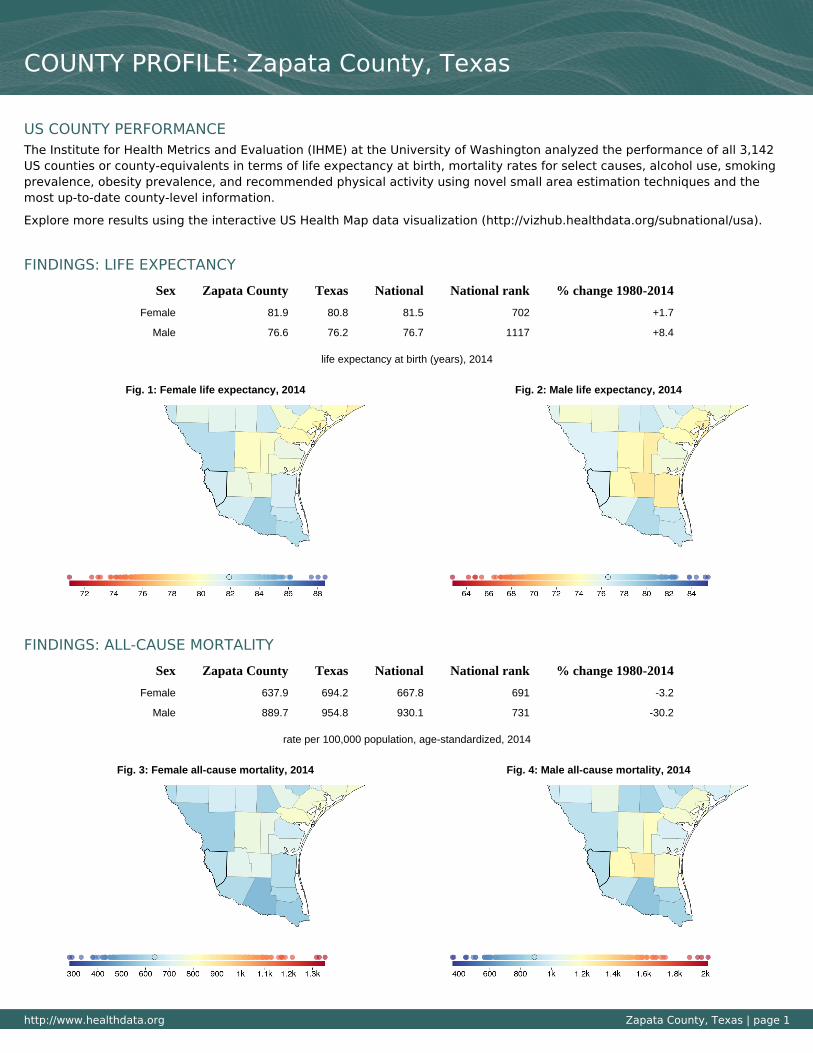
FINDINGS: LIFE EXPECTANCY
Sex Zapata County Texas National National rank % change 1980-2014
Female 81.9 80.8 81.5 702 +1.7
Male 76.6 76.2 76.7 1117 +8.4
life expectancy at birth (years), 2014
Fig. 1: Female life expectancy, 2014 Fig. 2: Male life expectancy, 2014
FINDINGS: ALL-CAUSE MORTALITY
Sex Zapata County Texas National National rank % change 1980-2014
Female 637.9 694.2 667.8 691 -3.2
Male 889.7 954.8 930.1 731 -30.2
rate per 100,000 population, age-standardized, 2014