+ All Categories
Home > Documents > COUPLED FLUID DYNAMIC AND HEAT TRANSFER … · COUPLED FLUID DYNAMIC AND HEAT TRANSFER ANALYSIS OF...

COUPLED FLUID DYNAMIC AND HEAT TRANSFER … · COUPLED FLUID DYNAMIC AND HEAT TRANSFER ANALYSIS OF...

Date post: 13-May-2018
Category:
Upload: hatuong
View: 215 times
Download: 1 times
Share this document with a friend
24
Márk Venczel, György Bicsák, Árpád Veress COUPLED FLUID DYNAMIC AND HEAT TRANSFER ANALYSIS OF A SMALL-SIZED RESEARCH GAS TURBINE COMBUSTION CHAMBER In phase of design and development of gas turbine jet engines, it is indispensable to be aware of the complex physical, chemical, fluid dynamic, heat transfer and thermodynamic phenomena occurring inside the main engine parts. With use of CFD tools and visualisation techniques, engineers are able to reveal and better understand the elaborate and hidden processes in gas turbine engines. The aim of this study is to perform a coupled fluid dynamic and heat transfer analysis on a small-sized research gas turbine combustion chamber with special care for the accuracy of combustion process and outlet temperature distribution compared to the combustion-theory require- ments and to available and suitable data for verification. The plausibility check was accomplished with the results of a MSc thesis and an ongoing PhD dissertation with same geometry and similar conditions and objectives. Keywords: CFD, combustion modelling, combustor, gas turbine jet engine, turbine inlet temperature 1. INTRODUCTION Nowadays, gas turbine jet engines are considered to be not only the relevant propulsion systems of the high power commercial and military aircrafts but the most practicable and economical machineries for energy production in gas and oil sectors. Their unprecedented advantages are the high power-weight index, few moving components, high reliability and availability, little sensitivity for overload and the fact that their operation does not require such type of liquid- based cooling system. Nevertheless, the maximum allowable temperature in the combustion chamber and at the turbine inlet section must be limited due to metallurgical reasons. To meas- ure and monitor this temperature date in an operating combustor is always a difficult task due to the high temperature ranges and sudden heat loads, which do not allow the application of conventional thermometers. Additionally, the presence of measuring equipment can have a re- markable effect on the streamlines (wakes), pressure drop, heat transfer, mixing and combustion process which can lead to significant errors in the measured results. Thus the obvious solution is to use well validated CFD tools in order to perform virtual tests on a combustion chamber operation in more cost-, time- and capacity-efficient ways. 1.1 Gas turbine jet engine performance Gas turbine jet engines involve three types of energy in a two-step energy transformation. The power of matter is stored in the fuel in form of chemical energy. A certain proportion of chem- ical energy is released during combustion as thermal energy and raises the power capacity of compressed air entering the combustion chamber. After this, during expansion the uniformly heated gas mixture with higher enthalpy (compared to ambient) leaves the combustor and drives the turbine. As a result, thermal energy is transferred into mechanical energy on the turbine blades and the engine generates shaft power or thrust.
Transcript

Márk Venczel, György Bicsák, Árpád Veress

COUPLED FLUID DYNAMIC AND HEAT TRANSFER

ANALYSIS OF A SMALL-SIZED RESEARCH GAS TURBINE

COMBUSTION CHAMBER

In phase of design and development of gas turbine jet engines, it is indispensable to be aware of the complex

physical, chemical, fluid dynamic, heat transfer and thermodynamic phenomena occurring inside the main engine

parts. With use of CFD tools and visualisation techniques, engineers are able to reveal and better understand the

elaborate and hidden processes in gas turbine engines. The aim of this study is to perform a coupled fluid dynamic

and heat transfer analysis on a small-sized research gas turbine combustion chamber with special care for the

accuracy of combustion process and outlet temperature distribution compared to the combustion-theory require-

ments and to available and suitable data for verification. The plausibility check was accomplished with the results

of a MSc thesis and an ongoing PhD dissertation with same geometry and similar conditions and objectives.

Keywords: CFD, combustion modelling, combustor, gas turbine jet engine, turbine inlet temperature

1. INTRODUCTION

Nowadays, gas turbine jet engines are considered to be not only the relevant propulsion systems

of the high power commercial and military aircrafts but the most practicable and economical

machineries for energy production in gas and oil sectors. Their unprecedented advantages are

the high power-weight index, few moving components, high reliability and availability, little

sensitivity for overload and the fact that their operation does not require such type of liquid-

based cooling system. Nevertheless, the maximum allowable temperature in the combustion

chamber and at the turbine inlet section must be limited due to metallurgical reasons. To meas-

ure and monitor this temperature date in an operating combustor is always a difficult task due

to the high temperature ranges and sudden heat loads, which do not allow the application of

conventional thermometers. Additionally, the presence of measuring equipment can have a re-

markable effect on the streamlines (wakes), pressure drop, heat transfer, mixing and combustion

process which can lead to significant errors in the measured results. Thus the obvious solution

is to use well validated CFD tools in order to perform virtual tests on a combustion chamber

operation in more cost-, time- and capacity-efficient ways.

1.1 Gas turbine jet engine performance

Gas turbine jet engines involve three types of energy in a two-step energy transformation. The

power of matter is stored in the fuel in form of chemical energy. A certain proportion of chem-

ical energy is released during combustion as thermal energy and raises the power capacity of

compressed air entering the combustion chamber. After this, during expansion the uniformly

heated gas mixture with higher enthalpy (compared to ambient) leaves the combustor and drives

the turbine. As a result, thermal energy is transferred into mechanical energy on the turbine

blades and the engine generates shaft power or thrust.

As far as performance is concerned, the most important parameter of the engine, after the pres-

sure ratio of the compressor, is the turbine inlet temperature (TIT). One way to enhance the

thermal efficiency and specific power of the engine is to increase TIT. This can be realized by

less intermediate, dilution and cooling air and/or increasing the pressure ratio which will result

higher thermal load on the first set of rotor blades and decreases the lifetime of turbine.

The very first gas turbines managed to reach the turbine inlet temperature value of only 400 °C

but between the world wars, technology allowed to raise this number to 775 °C. In the late

1960s, aviation industry achieved a TIT of 1010 °C at the use of JT9D-7 gas turbine in the

iconic Boeing 747-100. Nowadays, Rolls Royce Trent 1000 engine of Airbus 380 or the GE

NX engine of Boeing 787 operate with 1500–1600 °C TIT. This performance could not be

reached without a sophisticated cooling system as the result of thorough blade cooling and met-

allurgical developments with theoretical support of advanced material science (see Figure 1).

On the one hand, high performance alloys (called superalloys) are used for turbine blades,

which are capable of withstanding high temperature and stress in extremely oxidizing atmos-

pheres and show favourable creeping properties with low cycle fatigue [1].

On the other hand, turbine blades can be cooled with fuel or with film cooling which provides

thermal protection by forming a layer of cold air around the blades. In terms of combustor, the

best way of cooling is called transpiration cooling, where the chamber wall is made of porous

material that allows air to pass through it. Together with Thermal Barrier Coating system and air

cooling passages the combustor and turbine blades are protected from prompt thermal fatigue. [2]

Figure 1 Development of turbine blade cooling (left) and film cooling holes on a turbine blade (right) [3][4]

It is clearly seen, that combustion is the key phenomenon which governs the engine performance.

Because of its critical role, an accurate turbulent flame control is demanded so that we will be able

to burn fuels more efficiently, raise performance by TIT and reduce pollutants in the exhausted gas.

It appears as a real challenge to find accurate solution with help of CFD in the production of power.

1.2 The combustion process

Combustion is believed the oldest and fundamental technology of humanity, which has been

used for more than one million years in order to keep our world in development. It is a certain

type of oxidation that can be described as a rapid chemical reaction between fuel (which con-

serves huge amount of energy stored in material) and oxidizer (which creates proper environ-

ment for burning). An activation energy is also needed for reactants to begin an exothermal

process in form of self-propagating flames. In terms of gas turbine engines, combustion is a

continuous phenomenon, where Jet-A (kerosene) plays the role of fuel while oxygen in the air

is the oxidizer and activation energy is added as spark ignition.

Flame can be determined as the rapidly reacting body of hot gases, where the released chemical

energy is emitted in the visible spectrum. The flame front or reacting zone is a small region where

chemical reactions take place. Other physical phenomena can also accompany the combustion such

as explosion and detonation depending on the reaction velocity and the surrounding pressure [1][5].

Combustion is usually approached by reaction kinetic equations which describe the chemical

reaction mechanism among the initial components and the newly generated products. In case

of burning kerosene, a detailed list of kinetic equations can be found in [6] but to mention only

the most important processes in ideal condition, one can find the followings:

2𝐶10𝐻22 + 31𝑂2 → 20𝐶𝑂2 + 22𝐻2𝑂 (1)

𝐶9𝐻12 + 12𝑂2 → 9𝐶𝑂2 + 6𝐻2𝑂 (2)

Considering the products CO and NO due to incomplete combustion:

2𝐶𝑂 + 𝑂2 → 2𝐶𝑂2 (3)

𝑁2 + 𝑂2 → 2𝑁𝑂 (4)

Furthermore, to make combustion more realistic, some more phenomena must be taken into

account simultaneously as we can see in Figure 2.

Figure 2 Phenomena related to combustion [7]

The following part of this subchapter provides a deeper insight into the complex fluid dynamic

and thermodynamic processes in a combustion chamber. As in 1.1 subchapter turned out, com-

bustor is the heart of gas turbine engines and it has the challenging task of preparing air by

raising its power capacity before turbine extracts the energy from the flow of heated gas. Since

the air from compressor enters the combustor at around 150 m/s, which is a high velocity for

stable flame, the first step is to decelerate it and rise its static pressure in the diffuser. After this,

the airflow is split up by the liner. One part of the stream flows through the liner and casing

towards the dilution holes, this region is called annulus. The leftover part of the flow enters the

mixing chamber. The maximum speed in which kerosene can burn at normal fuel-air ratio is

only between 5–10 m/s. If the fuel is in liquid phase, it must be atomized and vaporized with

use of special injectors to ensure uniform, homogenous flames and to keep the burning effi-

ciency high. Fuel and air is assumed to be mixed in molecular level and they share same mean

velocity, pressure and temperature field. Applying swirler in the mixing chamber, the airflow,

around the fuel nozzle, is further decelerated, the air-fuel mixing is more efficient and a stabi-

lized zone is created, where the enthalpy of hot recirculating gas maintains the flame without

using spark ignition again. After mixing, fuel is partially burned in the recirculation zone, but

some amount of fuel will not burn completely. The remained fuel quantity will finally burn in

the intermediate zone. The hot gases will be then mixed with cooling air in the dilution zone

and provide a suitable TIT at the exit of combustor. Dilution holes protect the chamber wall

with entering fresh air from severe heat damage, feed and guide the flames towards the outlet.

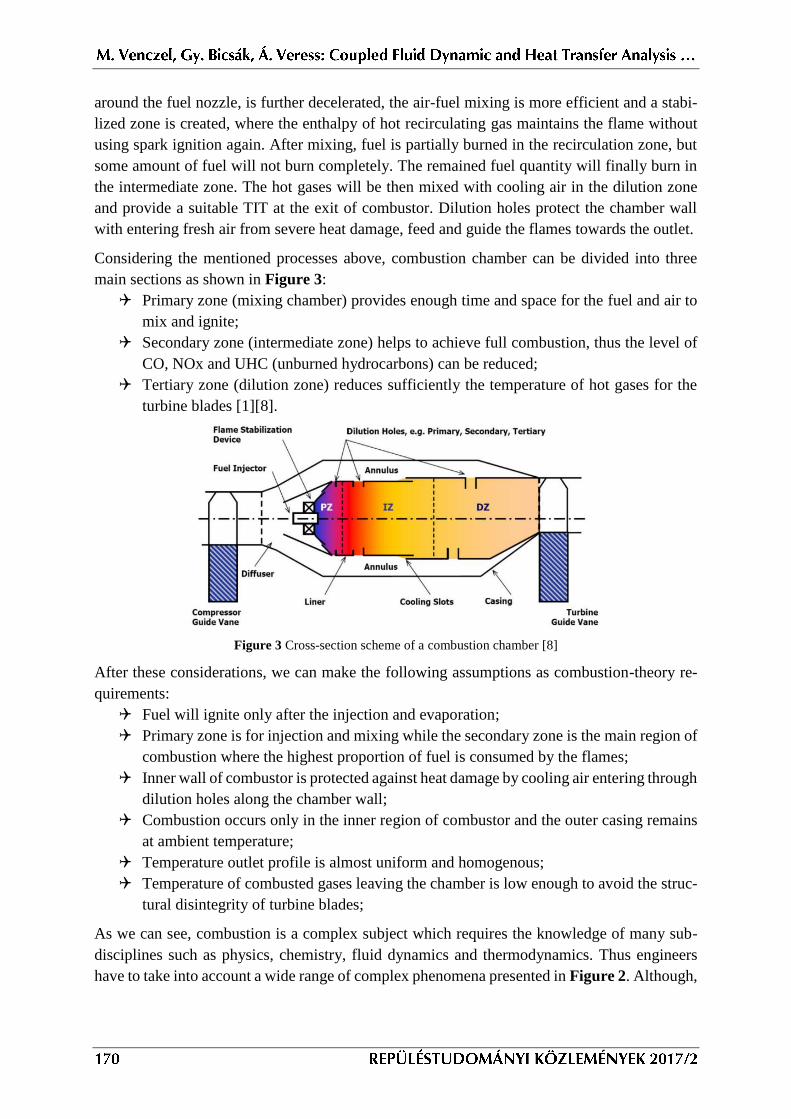
Considering the mentioned processes above, combustion chamber can be divided into three

main sections as shown in Figure 3:

Primary zone (mixing chamber) provides enough time and space for the fuel and air to

mix and ignite;

Secondary zone (intermediate zone) helps to achieve full combustion, thus the level of

CO, NOx and UHC (unburned hydrocarbons) can be reduced;

Tertiary zone (dilution zone) reduces sufficiently the temperature of hot gases for the

turbine blades [1][8].

Figure 3 Cross-section scheme of a combustion chamber [8]

After these considerations, we can make the following assumptions as combustion-theory re-

quirements:

Fuel will ignite only after the injection and evaporation;

Primary zone is for injection and mixing while the secondary zone is the main region of

combustion where the highest proportion of fuel is consumed by the flames;

Inner wall of combustor is protected against heat damage by cooling air entering through

dilution holes along the chamber wall;

Combustion occurs only in the inner region of combustor and the outer casing remains

at ambient temperature;

Temperature outlet profile is almost uniform and homogenous;

Temperature of combusted gases leaving the chamber is low enough to avoid the struc-

tural disintegrity of turbine blades;

As we can see, combustion is a complex subject which requires the knowledge of many sub-

disciplines such as physics, chemistry, fluid dynamics and thermodynamics. Thus engineers

have to take into account a wide range of complex phenomena presented in Figure 2. Although,

theories and empirical models for turbulent combustion have been created since many decades,

the practical use was restricted by the limited computational resources available [9].

1.3 Computational Fluid Dynamics and combustion modelling

From the second part of the 20th century, due to the fast evolution of computer technology and

the expectations from the side of industry, the numerical techniques for fluid flow, or in other

words Computational Fluid Dynamics (CFD), have become the primary method for solving

fluid dynamic problems in engineering sciences. It was originally developed for nuclear and

aerospace purpose, but nowadays this the most efficient way of saving cost, capacity and time

not only in case of nuclear, aerospace or automotive industry but also in the field of turbo ma-

chinery, manufacturing processes, security and building technology, nuclear power, meteorol-

ogy, environmental protection, astronomy and even in medicine [1][8][10].

CFD solvers are based on the finite volume method in most of the cases which means, the

investigated fluid domain is discretized into a set of control volumes (called cells). The general

conservation or transport equations for mass (continuity equation), momentum (Navier-Stokes

equation), energy, etc. are discretized into a system of algebraic equations which is then solved

numerically on this set of control volumes to render the solution field. The need for such and

approximated solution is that although the mentioned governing equations, which form a sys-

tem of nonlinear partial differential equations, have been already known since 150 years, they

do not have closed form solution over any kind and size of general and complex flows. Because

of this fact, CFD intends to replace the governing equations with numbers, and advance these

numbers in space and time in order to obtain a numerical representation of a given flow field

but this method usually requires high performance computational technique [10][11].

Turbulence is a chaotic phenomenon in the flow field, when the flow characteristics fluctuate

in time and space. This can have a significant effect on the results and can be fully described

by the Navier-Stokes equations. Taking into account the turbulence, with statistical averaging

and with different turbulence models, the nonlinear partial differential equations can be closed,

following the Boussinesq approximation, and numerically solved.

The combustion process can be simulated in CFD, but to describe the fluid accurately, some

data such as temperature, pressure, density, velocity and mass flow must be known. Basically,

they can be calculated by the governing equations but in case of realistic combustion approach,

they have to be completed with reaction kinetic models for the correct flame formation, pollu-

tant models for incomplete combustion, discrete phases models for multiphase flow and particle

tracking, heat transfer and radiation models for thermal phenomena and in certain cases with

ignition models to initiate the combustion. In terms of reaction kinetic models, combustion de-

pends directly on the mixing process and chemistry. Fast chemistry is limited by the mixing

whereas slow reactions are restricted by chemical kinetics. Damköhler-number (Da) relates the

reaction time scale to the convection time scale but it is also defined as the ratio of flow time

scale to the chemical time scale [8][10].

If Da >> 1 chemical reaction is faster than the turbulent mixing but in case Da << 1 turbulent

mixing plays the main role. In combustion modelling premixed and non-premixed flames can

be distinguished regarding when do oxidizer and fuel meet. In case of premixed flame, the

reagents meet each other before the combustion and are used in smaller applications such as

internal combustion engines or ovens, however, non-premixed flames occur rather in industrial

applications for example in gas turbine engines. [1] Based on the considerations above, CFD

offers a huge variety of combustion models and some of them are presented and compared in

Table 1. PDF Flamelet Model has been used in the present work due to its favourable charac-

teristics for modelling reaction kinetics in gas turbine combustion chamber.

Volume models Flame models

Reaction

models

Eddy Dissipa-

tion Model

Finite Rate

Chemistry

Model

Com-

bined

EDM-

FRCM

Model

PDF Flamelet

Model

Burning Ve-

locity Model

Extended

Coherent

Flame

Model

Flow turbulent laminar or

turbulent

turbulent turbulent turbulent turbulent

Reaction

speed

fast (Da>>1) slow

(Da<<1)

fast and

slow

fast (Da>>1) fast (Da>>1) fast (Da>>1)

Mixing non-premixed premixed premixed

or non-

premixed

non-premixed non-premixed

or partially

premixed

premixed

and partially

premixed

Model fea-

tures

• Reaction

speed de-

pends on

mixing time

• Mixing time

influenced

by vortices

• Mixing at

molecular

level

• No kinetic

control

• Avoid ex-

pensive Ar-

rheinus

equation cal-

culation

• Reaction

speed de-

pends on

chemistry

• Reaction

rates are

described

by compo-

nent inter-

actions

• Reaction

rates are

determined

by Ar-

rheinus

equation

calculation

• Mixing

time and

reaction

rates are

com-

puted

and the

smaller

is uti-

lized

• Combustion

on a thin sur-

face called

flamelet

• No influence

of chemical

reaction

• Use of proba-

bility density

function

(PDF)

• Use of pre-

calculated

modes

• Flow field

is split up

burnt and

unburnt

mixture

• Turbulent

flame speed

correlation

• Flame posi-

tion is de-

termined di-

rectly

• Turbulent

fluctuations

• Use of PDF

• Use of

flamelets

• More so-

phisticated

• Describes

extensive

and coher-

ent flame,

transient

combus-

tion pro-

cess

• Transport

equation

for flame

surface

• Steady

flame

Applica-

tion

gas phase

and coal com-

bustion

gas furnace liquid

combus-

tion

gas turbine

combustion

chamber

Bunsen

burner flame

internal

combustion

engine

Table 1 Comparison of different combustion models available [7][12][13]

The difficulty of combustion modelling lies in the size. It is called “the computational spatial-

scale dilemma” which implies the dynamic range of scales that must be resolved accurately [14]:

scale of combustor: 10–100 cm;

large eddies in real combustors: 1–10 cm;

small-scale mixing occurs at: 0.1–10 mm;

droplets with distinct identity: 1–100 µm;

molecular or chemical processes: 0.1–1 nm;

Research and development studies are being released more and more frequently which show

the importance and increasing spread of CFD tools in the field of combustion analysis:

In [15] a 2D axisymmetric model of gas turbine combustion chamber was used to investigate

the effect of Swirl-number on different multi-objective optimization process such as combus-

tion efficiency, emission, pattern factor and entropy generation minimization. The design cri-

teria of selecting the optimal Swirl-number was discussed in detail and the results were vali-

dated with Sydney Swirl Flame Database SM1. According to the results, a region of high swirl-

ing flow inside the combustor was identified which is attached to the swirler and characterized

with high Swirl-number. Inside this structure there is a region of negative axial velocity and

this region is called the internal recirculation zone. High Swirl-number causes high shear zones

near the dome walls, hence flame surface is anchored to this region.

In [16] the possibilities of hydrogen fuel, as alternative, renewable and environmentally friendly

energy source, was investigated in gas turbine combustion chamber, which does not cause

greenhouse gases, ozone layer depleting chemicals, acid rain ingredients or pollution. As it

turned out from the results, contrary to the conventional fuel combustion, the high temperature

zones are all at the rear of combustion chamber and formation of NOx happened there, and not

near the flames in the middle of the chamber.

In [17] the emission formation using Large Eddy Simulation was successfully reproduced in an

industrial gas turbine burner at pressure under laboratory conditions. Large Eddy Simulation tur-

bulence approach allows the analysis of a more detailed turbulent combustion close to the reality.

Also the influence of radiation heat losses was investigated and the impact of an alternative four-

step chemical mechanism was discussed. The results clearly showed that the thermal radiation

has a significant effect on the NOx formation rates as well as on the flame width and structure.

[18] describes an investigation of “micromix” hydrogen combustion with different combustion

models. In this technology, gaseous hydrogen is injected through miniaturized injector nozzles

perpendicularly into the air flow. This study helps understanding the flow phenomena related

to micromixing, reaction zone, flame and NOx formation in the combustor. According to the

results, miniaturized micro flames developed and anchored at the burner edge of injector nozzle.

Reacting time and averaged molar formation of NOx can be reduced significantly with this type

of injection technic. In comparison of different combustion models, Eddy Dissipation Concept

showed better agreement against Eddy Dissipation Model or Eddy Dissipation Model – Finite

Rate Chemistry model results.

[19] presents a method of experimentally analysed non-stationary thermoacoustic oscillations

that can be applied in high-pressure liquid-fuelled gas turbine combustors. The objective of this

study was to identify transient regions in which oscillations are being driven or damped based

on the dynamics of phase difference between heat release rate and pressure fluctuation. The

results allow to study the combustion behaviour inside a liquid-fuelled gas turbine combustor

and the temporal evolution of the local phase difference between heat release rate and pressure.

In [20] the focus of the numerical analysis was the fluid dynamics at the combustor – turbine inter-

face and its impact on the turbine blades in case of Cyclone gas turbine. Results were evaluated in

terms of their consistency with temperature indicating point observations obtained during the en-

gine development tests. According to the results, the presence of a highly rotating vortex core was

indicated in the combustor. This core is in strong relationship with high temperature peak which is

seen to be drawn over the suction surface of the first turbine blades. It is being attracted by the low

static pressure in this region but migrates towards the hub through the vane passage.

In [13] a three-dimensional gas phase combustion was modelled in a tubular combustion cham-

ber. The main goal of this investigation was to compare the effect of four different combustion

models such as Eddy Dissipation Model, PDF Flamelet model, Burning Velocity Model and

Fluent Non-Premixed with real tests. The most accurate results were calculated by Fluent Non-

Premixed model and the time-consumption of this combustion model was nearly ten times less

than in case of the other models.

2. PROBLEM SOLVING IN CFX

Ansys CFX has been used in the present work to perform coupled fluid dynamic and heat transfer

simulations. It is a high-performance fluid dynamics software for general purpose, which has

been used for over 20 years to solve a wide range of continuum based engineering problems. The

mesh has been generated in the software environment also which provides more opportunities

and high level of flexibility for creating appropriate mesh even for a complex geometry such as

an annular gas turbine combustion chamber. CFD tools for analysing fluid flow problems can be

applied only in case the flow characteristics meet the continuum mechanic requirements. In other

words, the Knudsen-number should be smaller than 0.01. In this study the Knudsen-number has

been estimated by using the flame temperature and related pressure values (marked by *), based

on the results of a very similar CFD analysis [1], in the following way [21][22]:

𝑲𝒏 = 𝜆

𝐿=

2.005∙10−7

0.0001 = 𝟎. 𝟎𝟎𝟐 < 0.01 (5)

where

mean free path of molecules:

𝜆 =𝑅∙𝑇

√2∙𝜋∙𝑑𝑎2∙𝐴∙𝑝

=8.3145∙2090

√2∙𝜋∙(3.57∙10−10)2∙6∙1023∙254200= 2.005 ∙ 10−7 𝑚 (6)

smallest size of mesh elements: L = 0.0001 m gas low constant: R = 8.3145 𝐽

𝑚𝑜𝑙∙𝐾 *flame tem-

perature: T = 2090 K *total pressure (related to flame temperature): p = 254200 Pa averaged

molecule diameter: 𝑑𝑎 = 3.57 ∙ 10−10 𝑚 Avogadro’s number: 𝐴 = 6 ∙ 1023 1

𝑚𝑜𝑙

2.1 Geometry and mesh

The investigated model (see Figure 4) is the annular combustion chamber of a modified TSz-

21 starting gas turbine for MiG-23 or Szu-22 military aircrafts used in the Hungarian Army.

Nowadays it is used for research purpose under the name of TKT-1 gas turbine on the Depart-

ment of Aeronautics, Naval Architecture and Railway Vehicles at the Budapest University of

Technology and Economics. The CAD model of this engine component was available by [1].

Figure 4 Geometry of investigated combustion chamber [1]

There are several possibilities for selecting the suitable segment of investigated geometry:

analysis in 2D in the cross-section plane of injector;

analysis in 3D with a segment angle smaller than 90°;

analysis in 3D with segment angle 90° (quarter geometry);

analysis in 3D with segment angle 180° (half geometry);

analysis in 3D with segment angle 360° (whole geometry).

It is obvious, that the whole geometry would provide the most realistic results and considering

the lower and lower sizes model in the list more and more simplification, inaccuracy and error

will be involved in the simulation. Due to time and computational capacity restrictions, only

the quarter and half geometry cases have been profoundly investigated in this work.

The numerical mesh must be able to handle the various phenomena related to combustion men-

tioned in 1.2 subchapter. Tetragonal, non-structured mesh has been generated in order to cap-

ture the complexity of the geometry (thin metal sheets close to each other with small holes) and

reduce the meshing time. The fuel is injected on a small circular surface so there must be used

the smallest mesh elements with maximal edge length of 0.1 mm. There will be generated

enough cells (more than 30) for the entering the fluid phase. In primary and secondary zone the

mesh must be fine (1 mm) so that the mixing and combustion process can be simulated with

high accuracy. Near the solid walls the effect of boundary layer must be taken into account to

describe the flow correctly. It demands a short preliminary calculation [21] with volume-aver-

aged temperature (880 K), volume-averaged total pressure (259,784 Pa) and averaged stream

velocity (50 m/s) values originated from [1]. The length of combustion chamber is 0.18 m and

the target of dimensionless distance of the wall in the first cell is 1. Thus the Reynolds-number:

𝑅𝑒 = 𝑉∙𝐿

𝜈=

50∙0.18

4.33∙10−5 = 207971.57 (7)

the first cell height:

𝑦 =𝑦+∙𝜈

𝑈𝜏=

1∙4.33∙10−5

2.5= 1.73 ∙ 10−5 𝑚 = 0.0173 𝑚𝑚 (8)

and the boundary thickness:

𝛿 = 0.035 ∙ 𝐿 ∙ 𝑅𝑒−1

7 = 0.035 ∙ 0.18 ∙ 207971.57−1

7 = 0.0011 𝑚 = 1.1 𝑚𝑚 (9)

In case of quarter geometry, the global volume was meshed with 5 mm large mesh elements

but at certain parts of the domain, such as primary zone, secondary zone and dilution holes,

mesh refinement (1 mm) was applied. An inflation layer was added near the wall with 1.2 mm

height (calculated by (9)) and consists of 7 sublayers with 1.5 growth rate. From the simulation

results turns out that the real thickness of boundary layer near the wall is corresponding with

the calculated value (1.2 mm). The final mesh (see Figure 5) was built up from 7,503,619

elements and contains 2,173,562 nodes.

Figure 5 Final mesh of quarter geometry (left) with refinement and inflation layers (right)

The quality of mesh was rated by the worst angle of each mesh element on a scale [0-1], where

the accepted angle is considered to be between 30o and 150o. According to the mesh qualifica-

tion, the mean quality is 0.74 which is acceptable for further investigation. The worst elements

are situated in the primary zone, concerning the inlet air holes and swirler sheets. This area is

the critical part of the geometry which requires really fine mesh with higher computational

capacity. Although mesh sensitivity analyses are going to be completed as a next step of the

present work, the used mesh has the best quality that could be reached at this time with consid-

ering the available computational resources.

Figure 6 Final mesh of half geometry (left) without refinement (right)

In case of half geometry, the same mesh element-sizes were used with one difference: due to

computational capacity limits, mesh refinement could not be applied in the primary and secondary

zone and the boundary layer near the walls was split up only for 5 sublayers. Sensibility investi-

gations should be carried out in this case also with higher computational capacity to reveal the

effect of different mesh configuration on the results. The final mesh (see Figure 6) was built up

from 9,767,342 elements and contains 2,801,512 nodes. The mean quality is 0.7 thus the mesh is

in the acceptable range.

2.2 Setting up the simulation

The first step is to define the fuel and the reaction kinetic mechanism. Jet-A (kerosene) was

selected for fuel, which can be describe in CFX as a surrogate: 60% n-decane (N C10H22) and

40% trimethylbenzene (TMB C9H12). An ideal combustion was assumed without NOx emis-

sion. The reaction kinetic equations, which govern the complex kerosene combustion processes

and involve every single element and side product, are collected in [6]. The software performs

a short calculation (oxidizer-fuel fraction, stoichiometric mixture ratio and composition of com-

bustion product) with use of Flamelet Library and writes the reaction kinetic results in a file.

The second step is to create a gaseous reacting mixture to make burning happen. The file of prelim-

inary calculations, written in the previous step, here can be referred to specify the burning process.

Next step is to couple the liquid and gaseous phases of the fuel by creating a homogenous binary

mixture and define the evaporation process with the Antoine-equation coefficients. Evaporation

has a significant influence on the combustion since the fraction of each reagents depends on it.

In other words, the behaviour of combustion and the flame position is determined by these

values. Instead of wasting time to find experimentally the proper coefficients through numerous

tests and sensibility simulations, the estimated values have been taken from [23]. With the use

of Liquid Evaporation Model, one of the two mass-transport equations will be solved depending

on the case if the droplets are above or below the boiling point.

Type of domain Fluid

Content Gas mixture and vaporized fuel droplets

Reference pressure 99.75 kPa

Turbulence model k-ε

Turbulence intensity 5 %

Heat transfer model Total enthalpy

Combustion model PDF Flamelet

Thermal radiation model P 1

Primary break up Blob method

Secondary break up Schmehl

Droplet surface tension coefficient 0.026 N/m

Droplet and gas mixture interaction Fully coupled

Drag force model Schiller Neumann

Table 2 Applied models and properties of the domain

The Antoine-equation (see equation (10)) determines that the state is above or below the boiling

point. Droplets change their phase if the vapour pressure (𝑃𝑣𝑎𝑝𝑜𝑢𝑟) is higher than the ambient

pressure:

𝑃𝑣𝑎𝑝𝑜𝑢𝑟 = 𝑃𝑠𝑐𝑎𝑙𝑒(𝐴−

𝐵

𝑇+𝐶) (10)

where

𝑃𝑠𝑐𝑎𝑙𝑒: pressure scale to adjust the pressure unit (1 Pa);

𝐴: Antoine reference state constant (53.3);

𝐵: Antoine enthalpy coefficient (5600 K);

𝐶: Antoine temperature coefficient (25 K);

𝑇: vaporization temperature.

Afterwards, material properties, reference values, physical settings and boundary conditions are

applied on the model (see Table 2).

Figure 7 Defined boundary surfaces of the domain

K-epsilon turbulence model is used in this work based on the results of [8]. In this thesis, the

effect of different turbulence models, such as k-ε, k-ω, SST-k-ω and RSM, were investigated

on a 3D, swirling, recirculating combustion process in a can type of experimental combustor.

The results were compared to measurement data as well. As it turned out, k-ε model is the most

acceptable approximation of the combustion process with same boundary conditions. In addi-

tion, k-ε model provides converged results in less iteration steps than the other models.

Boundary name Type Condition

Air inlet Inlet

Subsonic flow

Total pressure: 171723 Pa

Flow direction vector: [0.418; 0.82; 0.387]

Total temperature: 421.7 K

Material: oxidizer

Fuel inlet Inlet

Subsonic flow

Flow direction: Normal to boundary

Flow velocity: 12 m/s

Mass flow rate: 4.84 g/s

Particle diameter: 0.0001 m

Static temperature: 299.6 K

Material: fuel

Outlet Outlet

Subsonic flow

Mass flow rate: 0.25 kg/s (quarter geometry)

Mass flow rate: 0.5 kg/s (half geometry)

Inner wall Wall

No slip

Smooth

Adiabatic heat transfer

Cover Wall

No slip

Smooth

Heat transfer coefficient: 8 𝑊

𝑚2∙𝐾

Outside temperature: 299.6 K

Open faces Interface Rotational periodicity around the longitudinal axis (Y)

Table 3 Applied boundary conditions of the domain

The next step was defining the boundary conditions (see Table 3) on each boundary surface

(see Figure 7) based on [1] and [24].

The last step is setting up the solver (see Table 4), completing the initialization and running the

calculations.

Advection Scheme High resolution

Turbulence Numerics First order

Number of iteration Maximum 1000

Timescale At beginning: physical (0.01 s); With stabilized results: local (factor 30)

Residual type RMS

Residual target 10−4

Convergence criteria 1%

Table 4 Applied settings for the solver

Four parameters are created as monitoring points which provide useful information about the

fluid flow, thermodynamic processes and convergence during calculation: Maximal tempera-

ture (Tmax), Volume-averaged temperature (Tvolume), Area-averaged temperature in the out-

let surface (Toutlet) and Area-averaged temperature on the inner wall (Twall).

At combustion analysis, cold flow simulation is a commonly used step before main simulations.

In this case, every boundary condition is applied similarly to the main simulation, but combustion

and thermal radiation model are switched off. On the one hand, switching on boundary conditions

gradually, makes convergence easier and faster. On the other hand, having a closer look at the

streamlines without combustion, can reveal any anomaly or discrepancy in the flow field. It can

imply incorrect geometries or mesh and even a wrongly defined or missing boundary condition.

Because of these reasons, also a cold flow simulation was implemented in this work with quarter

geometry before the main calculations.

2.3 Presentation of results

Consistency, stability and convergence play an important role in verification of numerical results.

The outcome of a CFD simulation is acceptable for further engineering application if these three

properties are proved mathematically. Consistency means that the simplified algebraic equations,

which are solved during numerical calculations, capture the content of original nonlinear partial

differential equations. Stability proves the fact, that during calculation the numerical result ap-

proaches certain values and the difference between each resulted parameters, during the iteration

steps, if they are the cases, tends to zero. Convergence ensures that the difference between the exact

and numerical solution stays limited during calculation (numerical error does not increase) [11].

Figure 8 Defined inspections planes for quarter (left) and half geometry (right)

In the following sub-subchapters, the outcome of each CFX simulation will be presented. The

results are displayed in 3D view and also with use of perpendicular inspection planes defined

in Figure 8.

2.3.1 Cold flow results

Figure 9 Residual (left) and imbalance curves (right) of cold flow simulation

According to Figure 9 the imbalance curves ascertain the convergence: each parameter went well

below 1% which means the mass, momentum and energy conservation target (after 250 iteration

steps) are reached. The residual target of 104 (after 380 iteration steps) is also reached as well.

Figure 10 Surface streamlines in 1/4V (left) and in 1/4H (right) planes in case of cold flow

Figure 10 shows the surface streamlines and the velocity field in the background. The promi-

nent feature of this view is the vortex system caused by the complex geometry. The biggest

vortices in the primary and secondary zones help the compressed air to slow down (from

100 m/s to 1020 m/s) and to mix with the vaporized fuel droplets however, the smaller vortices

in the corners, between casing and inner wall, are unwanted since they cause pressure loss.

There is a temporary velocity increase (130 m/s) around the holes as the air flows through them.

It can be clearly seen that the incoming air from compressor is divided correctly into different

passages and provides sufficient supply for the chamber in each zone. Due to the lack of com-

bustion and expansion, a dominant flow direction is missing.

2.3.2 Quarter geometry results

Figure 11 Imbalance (left) and temperature curves (right) of quarter geometry simulation

Figure 12 Spatial streamlines of air (left) and fuel (right) of quarter geometry simulation

Figure 13 Surface streamlines in 1/4V (left) and in 1/4H (right) planes

Figure 14 Relative total pressure distribution in 1/4V (left) and in 1/4H (right) planes

Figure 15 Oxygen distribution (mass fraction in %) in 1/4V (left) and in 1/4H (right) planes

Figure 16 Temperature distribution in 1/4V (left) and in 1/4H (right) planes

Figure 17 Hot areas (left) and temperature distribution in 1/4O plane (right)

In Figure 11 the imbalance curves of mass, momentum and energy went below 1%. The area-

averaged temperature of inner wall, outlet section and the volume-averaged temperature show

clear convergence, the maximal temperature has some minor, continuous fluctuation. In spite

of this minor uncertainties, the residual curves converged under the value of 104 (after 180

iteration steps). The outcome of this simulation is found to be acceptable considering the results

as a snapshot of the transient combustion process which is always in change.

Figure 12 shows the spatial streamlines of compressed air and fuel coloured by velocity mag-

nitude in the combustor. The swirler sheets in the primary zone seem to work efficiently as it

causes the air slowing down, swirling and helping the vaporized fuel and air to mix each other.

Figure 13 displays surface streamlines and the velocity field in the background. The important

bigger vortices and the unwanted smaller vortices can be localized similarly to the cold flow

results. The flow shows dominantly axial direction with remarkable velocity increase (around

100 m/s) at the outlet due to the expansion process.

Figure 14 presents the pressure field and gives an explanation for the presented streamlines.

As the fluid moves from the higher-pressure inlet to the lower-pressure outlet, it suffers from

pressure loss due to collision, friction, separation and swirling. It can be taken into account as

𝜎1

4

pressure loss factor or 𝑟1

4

pressure recovery factor which are one of the most important aer-

odynamical features of a combustion chamber:

𝜎1

4

=(surface­averaged total pressure at inlet)−(surface­averaged total pressure at outlet)

(surface­averaged dynamic pressure at inlet)=

= 271430 𝑃𝑎−256958 𝑃𝑎

8493 𝑃𝑎= 1.704 (11)

𝑟1

4

=(surface­averaged total pressure at outlet)

(surface­averaged total pressure at inlet)=

256958 𝑃𝑎

271430 𝑃𝑎= 0.947 (12)

Figure 15 reveals the O2 mass fraction along the flow domain. It confirms the fact that the fuel-

air mixing happens sufficiently in the primary and secondary zone and allows to localize the

flames where the stoichiometric mixture appears and O2 mass fraction has a sudden change to

zero. Burning occurs on the periphery of blue areas where O2 is consumed by the flames. The

lack of enough amount of cooling air can also be clearly seen in the dilution zone which will

cause too high temperature at the outlet.

Figure 16 provides more information about combustion and flame structure in the combustor. The

cooling air entering through the dilution holes contributes to the wall protection against heat loads.

Even though combustion occurs not only in the secondary zone, the highest temperature flames are

anchored to the wall and touching the outlet section as well. Another interesting feature is that the

flames return almost to the fuel injection point along the swirler sheets. This implies the fact, that

the Antoine-equation coefficients need more refinement in order to delay and describe the combus-

tion process more accurately. The maximal flame temperature of the domain is 2137 K.

Figure 17 shows the flame position near the wall and localizes the high-temperature (2000 K)

regions close to the interfaces with rotational periodicity. The temperature distribution in the

outlet section is found to be less uniform due to the high temperature peaks. The area-averaged

temperature on this surface is 1136.97 K and considering the almost constant tendency of its

convergence line, the relative error is 13.7% compared to the expected value of 1000 K used in

the preliminary redesign phase. [1]

2.3.3 Half geometry results

Figure 18 Temperature distribution in 1/2V (left) and in 1/2H (right) planes

Figure 19 Hot areas (left) and temperature distribution in 1/2O plane (right)

The geometry is doubled, it has rotational periodicity with 180° in the presented simulation

case. Spatial streamlines of air and fuel, surface streamlines with velocity field, pressure field

and Oxygen mass fraction along the fluid domain show similarities to the quarter geometry

results. Bigger amount of cooling air remains in the secondary and dilution zones thus there

will be lower temperature peaks at the outlet. The pressure loss factor and recovery factor are:

𝜎1

2

=271420 𝑃𝑎−255470 𝑃𝑎

8498 𝑃𝑎= 1.877 (13)

𝑟1

2

=255470 𝑃𝑎

271420 𝑃𝑎= 0.941 (14)

Figure 18 displays a more concentrated flame structure which is closer to the ideal combustion

features described in 1.2 subchapter. However, combustion develops in the secondary zone, the

flames return almost to the injection point thus the combustion process must be fined by the

coefficients of Antoine-equation. The maximal flame temperature of the domain is 2085, it is

more than 50 K lower than in case of quarter geometry.

Similarly to the quarter geometry results in Figure 19, flames are anchored to the wall and the high-

temperature (2000 K) regions are situated close to the interfaces of rotational periodicity. The tem-

perature distribution in the outlet section is found to be more uniform due to the lower temperature

peaks. The area-averaged temperature in this section is 1037.55 K thus the relative difference is

only 3.8% compared to the expected value of 1000 K used in the preliminary redesign phase [1].

2.4 Plausibility check and verification of the results

The goal of the plausibility check and verification is to ensure the correctness of the used

method and decide whether the quarter or half geometry simulation provides closer result to a

combustion process in a gas turbine engine. Due to the lack of detailed combustion chamber

measurement, three different sources have been used to check and verify the presented results.

The video of Yyang CFD Studio [25] gives an insight into a transient combustion process with

a very detailed Large Eddy Simulation. All characteristics of an expected combustion (see in

1.2 subchapter) can be found in this video thus it is suitable to check the plausibility of the

presented results.

In the both simulations presented in this article, there is a pair of remarkable vortex in the sec-

ondary zone that enhances the fuel-air mixing and maintains the flame. The cooling air entering

through dilution holes form typical cooler air-sleeves in the hot gases. Additionally, it protects

the wall efficiently against heat damage however, flames tend to anchor to the wall. The com-

bustion occurs only in the inner part of the chamber and flames do not reach the outer regions

so casing is not loaded thermally. In case of half geometry simulation, flames have a more

concentrated structure similarly to the video. The temperature distribution at the outlet is more

uniform with lower temperature peaks and smaller hot-spot areas close to the video results.

As far as concrete temperature and pressure values are concerned, the results of [10] must be

considered. In this Master thesis, the quarter geometry of main parts of the original TKT-1

research gas turbine engine was separately investigated with CFD tool and measurements. Me-

thane was used as fuel that shows similar burning characteristics to kerosene.

Figure 20 Temperature distribution for verification [10]

Measured and simulated results [10]

Interfaces Total Temperature [K] Total Pressure [Pa]

Ambient-Intake (Measured) 299.6 99755.6

Intake-Compressor (Measured) 299.5 99409.5

Compr.-Combustor (Measured) 414.2 256910

Combustor-Turbine (Simulated) 1008.08 241390

Turbine-Nozzle (Measured) 905.4 114442

Nozzle-Ambient (Measured) 299.6 99755.6

Table 5 Temperatures and pressures for verification [10]

From the view “A” of Figure 20, as the cross-section of the combustor, it turns out that flames

touch the outlet even in this simulation and causes less uniform temperature distribution in that

section. Similarly to the presented results, the high-temperature regions are situated near the

interfaces and flames are anchored to the wall, as view “B” the interface section shows. The

maximal flame temperature of the domain is 2076.8 K which means only a 2.9% relative dif-

ference compared to quarter geometry whereas half geometry results only 0.4% deviation. The

area-averaged simulated temperature at the outlet of the combustor is 1008.08 K (see Table 5)

thus the relative difference is 12.7% with quarter geometry and only 2.9% with half geometry

result. According to Table 5 the pressure loss factor and pressure recovery factor are better than

in the present results which can be explained by the modified geometry and slightly different

boundary conditions.

𝜎𝑣𝑒𝑟_[10] =256910 𝑃𝑎−241390 𝑃𝑎

8100 𝑃𝑎= 1.92 (15)

𝑟𝑣𝑒𝑟_[10] =241390 𝑃𝑎

256910 𝑃𝑎= 0.94 (16)

In PhD dissertation of [1] the TKT-1 research gas turbine jet engine was redesigned, profoundly

CFD analysed, the vanned diffuser is optimized with inverse design method and validated with

available measured data. The quarter geometry of combustion chamber is the same that it was

used in this work. Applying similar boundary conditions and fuel, the results are summarized

and presented in Figure 21 and Figure 22.

Figure 21 Total temperatures along the TKT-1 research jet engine by [1] for verification

The maximal flame temperature of the domain is 2247 K, thus the relative difference is 4.9%

with quarter geometry result, whereas the case of half geometry causes 7.2% deviation. The

area-averaged temperature at the outlet is 1056 K which means 7.7% relative difference com-

pared to the quarter geometry simulation but in case of half geometry this difference is 1.8 %.

Figure 22 Total pressures along the TKT-1 research jet engine by [1] for verification

Pressure loss factor and pressure recovery factor show similarities with the presented results:

𝜎𝑣𝑒𝑟_[1] =271750 𝑃𝑎−254750 𝑃𝑎

8694 𝑃𝑎= 1.955 (17)

𝑟𝑣𝑒𝑟_[1] =254750 𝑃𝑎

271750 𝑃𝑎= 0.94 (18)

Based on the results discussed above, it can be concluded that the presently simulated results

are plausible, they are verified by three different approaches. A far as relative differences of the

outlet area-averaged temperature of combustion chamber are concerned, the average differ-

ences are below 11 %. In case of quarter geometry, this value is

12.7+7.7

2= 10.2% (19)

whereas for half geometry it is

2.9+1.8

2= 2.4% (20)

Hence, since the later one shows better agreement with the outcomes of the mentioned investi-

gations, it is proposed for future use. However, mesh size and configuration with model and

solver parameter sensitivity analyses should be completed beside measurement based validation

as next step of this investigation to recover better the limitations of the present method.

3. CONCLUSION

Coupled fluid dynamic and heat transfer simulations were completed on an annular combustion

chamber of a TKT-1 small-sized research gas turbine engine with CFD tool. The main goal of

this study is to analyse the combustion process and to find the suitable geometrical configuration

which describes accurately and in realistic way the phenomena in gas turbine combustion cham-

ber. Quarter and half segments of the chamber geometry was investigated with same boundary

conditions. Considering the summarized results in Table 6, the quarter and also the half geometry

calculations provided acceptable results as well. However, the outcome of half geometry simula-

tion is found to be more realistic approximation of combustion process regarding verification data

and preliminary redesign values. Nonetheless, the weaknesses of the applied mesh, interface

boundary condition and evaporation model were also highlighted. The need for mesh refinement

and sensibility studies with higher computational capacities were emphasized. It also turned out

that not only the properly selected boundary conditions but also the size of the investigated ge-

ometry segment has significant influence on the turbine inlet temperature. Hence, further inves-

tigations and measurements are desirable to improve the actual results.

Quarter

geometry

Half

geometry

Relative differences

for verification by

[10] (see Table 5)

Relative differences

for verification by

CFD results of [1]

Quarter Half Quarter Half

Pressure loss factor 1.704 1.877 11.3 % 2.2 % 12.8 % 4 %

Pressure recovery factor 0.947 0.941 0.8 % 0.1 % 0.8 % 0,1 %

Maximal flame temperature 2137 K 2085 K 2.9 % 0.4 % 4.9 % 7.2 %

Outlet area-averaged temperature 1136.97 K 1037.55 K 12.7 % 2.9 % 7.7 % 1.8 %

Relative difference to 1000 K 13.7 % 3.8 % Number of mesh elements 7503619 9767342

Temperature distribution at outlet

Table 6 Summary of the results with the relative differences

ACKNOWLEDGEMENTS

The present research is partially supported by the Hungarian national EFOP-3.6.1-16-2016-

00014 project. The introduced and verified calculation method is carried out to be applied in

small aircraft hybrid propulsion system development supported by Hungarian national EFOP-

3.6.1-16-2016-00014 project entitled by “Investigation and development of the disruptive tech-

nologies for e-mobility and their integration into the engineering education”.

BIBLIOGRAPHY

[1] Foroozan Zare, Dr. Veress Árpád: Advanced Research on Gas Turbine Components – Virtual Prototyping of

Jet Engines, PhD dissertation, Budapest University of Technology and Economics, Budapest, 2017

[2] Vinod Srinivasa: CFD for Aero Engines, HCL Technologies, 2011, (online), url: https://www.hcltech.com/sites/de-

fault/files/resources/whitepaper/files/2011/07/19/CFD_for_Aero_Engines.pdf (04.03.2017.)

[3] P. Meherwan: Gas turbine engineering handbook, Elsevier’s Science&Technology Rights, Texas,USA, 2011

[4] YXLON: Inspecting turbine blades non-destructively, (online), url: http://www.yxlon.de/Applications/Cast-

parts/Turbine-blades (04.03.2017.)

[5] Md Abdul Alim: CFD Modelling of Turbulent Combustion and Heat Transfer, Loughborough University

Institutional Repository, Loughborough, 2004, (online), url: https://dspace.lboro.ac.uk/dspace-jspui/bit-

stream/2134/7639/2/Thesis-2004-Alim.pdf (04.03.2017.)

[6] S. Honnet, K. Seshadri, U. Niemann, N. Peters: A Surrogate Fuel for Kerosene, Mc Gill University, Montreal,

2008, (online), url: https://www.itv.rwth-aachen.de/fileadmin/Downloadbereich/Comb_Symp08_Kero-

sene_Honnet_et_al_App.pdf (04.03.2017.)

[7] Carlos Eduardo Fontes, Raphael David A. Bacchi: Best Practice Guidelines for Combustion Modelling, An-

sys South American Conference & ESSS Users Meeting, Atibaia, 2010, (online), url:

http://www.esss.com.br/events/ansys2010/pdf/20_2_1630.pdf (04.03.2017.)

[8] Tajti József, Bicsák György: The Influence of Different Turbulence Models on Gas Turbine Combustion

Process with Particular Regard to the Temperature Distribution, BSc. Thesis, Budapest University of Tech-

nology and Economics, Budapest, 2015

[9] Ali Hussain Kadar: Modelling Turbulent Non-Premixed Combustion in Industrial Furnaces, MSc. Thesis,

Delft University of Technology, Delft, 2015, (online), url: http://ta.twi.tudelft.nl/users/vuik/numanal/ka-

dar_afst.pdf (04.03.2017.)

[10] Pallag Nándor, Beneda Károly: A TKT-1 gázturbinás sugárhajtómű áramlástani vizsgálata, diplomaterv, Bu-

dapesti Műszaki és Gazdaságtudományi Egyetem, Budapest, 2013

[11] Dr. Veress Árpád: Bevezetés az áramlástan numerikus módszereibe, Budapesti Műszaki és Gazdaság-

tudományi Egyetem, tanszéki oktatási segédlet, Budapest, 2002, (online), url:

http://www.vrht.bme.hu/letoltes/Tanszeki_letoltheto_anyagok/Oktatok_anyagai/Dr.Veress_Arpad_an-

yagai/Oktatott_targyak/Bevezetes_a_numerikus_aramlastanba_CFD/CFD-jegyzet.pdf (04.03.2017.)

[12] Dr. Veress Árpád: CFD számítási sablon, Budapest University of Technology and Economics, Budapest,

2014, (online), url: http://www.vrht.bme.hu/hu/hallgatoinknak/letoltesek.html (04.03.2017.)

[13] György Bicsák, Anita Hornyák, Dr. Árpád Veress: Numerical Simulation of Combustion Processes in Gas

Turbine, Budapest University of Technology and Economics, Budapest, 2012, (online), url: http://tehet-

seg.bme.hu/?letoltes/ecc166f70b53c784c4f4dbfb27f8ba029b6fbb8c/a438906f8e3a0fb2b29835505ef39c41c

4cb036f/1423/47b0b717d84c1f0c70c264262153ad18f9e3430f (04.03.2017.)

[14] Heinz Pitsch, Suresh Menon: CFD for Combustion Modeling, Lecture PPT, Georgia Institute of Technology,

Atlanta, 2015, (online), url: http://www.ccl.gatech.edu/sites/default/files/CCL/Papers/2011/Reports/CFD11-

Day2-Lecture1.pdf (04.03.2017.)

[15] M.M. Torkzadeh, F. Bolourchifard, E. Amani: An Investigation of Air-Swirl Design Criteria for Gas Turbine

Combustors Through a Multi-Objective CFD Optimization, Amirkabir University of Technology, Teheran,

2016, (online), url: http://www.sciencedirect.com/science/article/pii/S0016236116308791 (04.03.2017.)

[16] Jianzhong Li, Li Yuan, Hukam C. Mongia: Simulation of Combustion Characteristics in a Hydrogen Fuelled

Lean Single-Element Direct Injection Combustor, Elsevier Ltd, 2016, (online), url: http://www.sciencedi-

rect.com/science/article/pii/S0360319916332517 (04.03.2017.)

[17] G. Bulat, W.P. Jones, A.J. Marquis: NO and CO Formation in an Industrial Gas-Turbine Combustion Cham-

ber Using LES with the Eulerian Sub-Grid PDF Method, Elsevier Ltd, 2014, (online), url: http://www.sci-

encedirect.com/science/article/pii/S0010218014000042 (04.03.2017.)

[18] A. Haj Ayed, K. Kuserer, H.H.-W. Funke, J. Keinz, C. Striegan, D. Bohn: Experimental and Numerical Investigations

of the Dry-Low-NOx Hydrogen Micromix Combustion Chamber of an Industrial Gas Turbine, Elsevier Ltd, 2015,

(online), url: http://www.sciencedirect.com/science/article/pii/S2212540X15000504 (04.03.2017.)

[19] S. Kheirkhah, B.D. Geraedts, P. Saini, K. Venkatesan, A.M. Steinberg: Non-Stationary Local Thermoacous-

tic Phase Relationships in a Gas Turbine Combustor, Elsevier Ltd, 2016, (online), url: http://www.sciencedi-

rect.com/science/article/pii/S1540748916304217 (04.03.2017.)

[20] Mark D. Turrell, Philip J. Stopford, Khawar J. Syed, Eoghan Buchanan: CFD Simulation of the Flow Within

and Downstream of a High-Swirl Lean Premixed Gas Turbine Combustor, Proceedings of ASME Turbo

Expo 2004 Power for Land, Sea and Air, Vienna, 2004, (online), url: https://pdfs.seman-

ticscholar.org/10dd/16fe068c64189894e2e79ae2399ec29b5916.pdf (04.03.2017.)

[21] Dr. Veress Árpád: Hő-és áramlástani számítások, Előadásjegyzet, Budapesti Műszaki és Gazdaságtudományi Egyetem,

Budapest, 2016, (online), url: http://www.vrht.bme.hu/letoltes/Tanszeki_letoltheto_anyagok/Oktatok_anyagai/Dr.Ver-

ess_Arpad_anyagai/Oktatott_targyak/Ho-_es_aramlastani_szamitasok/CFD_v1.pdf (04.03.2017.)

[22] Widener University: Mean Free Path vs Pressure Altitude, (online), url: http://science.wid-

ener.edu/~svanbram/chem332/pdf/menfpath.pdf (04.03.2017.)

[23] Matej Zadravec, Bostjan Rajh, Niko Samec, Matjaz Hribersek: Numerical Analysis of Oil Combustion in a

Small Combustion Device, University of Maribor, Maribor, 2014, (online), url: http://www.anali-

pazu.si/sites/default/files/Separat_Numerical_analysis_of_oil_combustion.._0.pdf (04.03.2017.)

[24] G. Manoj Kumar, J. Bruce Ralphin Rose: Numerical Comparative Study on Convective Heat Transfer Co-

efficient in a Combustor Liner of Gas Turbine with Coating, International Journal of Mechanical Engineer-

ing and Research, Tamil Nadu, 2015, (online), url: https://www.ripublica-

tion.com/ijmer_spl/ijmaerv5n1spl_03.pdf (04.03.2017.)

[25] YYang CFD Studio: Gas Turbine Combustor LES Simulations, video, (online), url:

https://www.youtube.com/watch?v=Mim33CvQTUQ (04.03.2017.)

KISMÉRETŰ KISÉRLETI GÁZTURBINÁS SUGÁRHAJTÓMŰ ÉGÉSTERÉBEN LEJÁTSZÓDÓ

FOLYAMATOK CSATOLT ÁRAMLÁSTANI ÉS TERMIKUS VIZSGÁLATA

Gázturbinás sugárhajtóművek tervezési és fejlesztési fázisában elengedhetetlen a hajtómű főbb részeiben leját-

szódó összetett fizikai, kémiai, áramlástani és termikus jelenségek ismerete. Numerikus eszközök és vizualizációs

technikák alkalmazásával a mérnökök képesek feltárni és jobban megérteni a gázturbinás sugárhajtóművek bel-

sejében zajló összetett és rejtett folyamatokat. Ezen tanulmány célja egy kisméretű kísérleti gázturbina égésterében

lezajlódó csatolt áramlástani és termikus folyamatok szimulációja és vizsgálata numerikus eszközökkel különös

tekintettel az égési folyamat helyességére és a kilépési hőmérséklet eloszlására összevetve égéselméleti követelmé-

nyekkel és a rendelkezésre álló, verifikációra alkalmas adatokkal. A plauzibilitás ellenőrzésére egy korábbi MSc

diplomaterv és egy folyamatban lévő doktori disszertáció eredményei felhasználásra kerültek azonos geometria és

hasonló vizsgálati körülmények és célok mellett.

Kulcsszavak: égéstér, égésmodellezés, gázturbinás sugárhajtómű, numerikus áramlástan, turbina belépő hőmérséklet

Venczel Márk (BSc)

MSc. hallgató

Budapesti Műszaki és Gazdaságtudományi Egyetem

[email protected]

orcid.org/0000-0002-4319-1463

Venczel Márk (BSc)

MSc. Student

Budapest University of Technology and Economics

[email protected]

orcid.org/0000-0002-4319-1463

Bicsák György (MSc)

tanársegéd

Budapesti Műszaki és Gazdaságtudományi Egyetem

Vasúti Járművek Repülőgépek és Hajók Tanszék

[email protected]

orcid.org/0000-0002-3427-3918

Bicsák György (MSc)

Assistant lecturer

Budapest University of Technology and Economics

Department of Aeronautics Naval Architecture and

Railway Vehicles

[email protected]

orcid.org/0000-0002-3427-3918

Dr. Veress Árpád (PhD)

docens

Budapesti Műszaki és Gazdaságtudományi Egyetem

Vasúti Járművek Repülőgépek és Hajók Tanszék

[email protected]

orcid.org/ 0000-0002-1983-2494

Dr. Veress Árpád (PhD)

Associate professor

Budapest University of Technology and Economics

Department of Aeronautics Naval Architecture and

Railway Vehicles

[email protected]

orcid.org/ 0000-0002-1983-2494

http://www.repulestudomany.hu/folyoirat/2017_2/2017-2-14-0391_Venczel_M-Bicsak_Gy-Veress_A.pdf


Recommended