Published: July 05, 2011 r2011 American Chemical Society 6154 dx.doi.org/10.1021/ac200268f | Anal. Chem. 2011, 83, 6154–6162 ARTICLE pubs.acs.org/ac Coupled Isotachophoretic Preconcentration and Electrophoretic Separation Using Bidirectional Isotachophoresis Supreet S. Bahga, Robert D. Chambers, and Juan G. Santiago* Department of Mechanical Engineering, Stanford University, California 94305, United States b S Supporting Information I sotachophoresis (ITP) is a preconcentration and separation technique that leverages electrolytes with different electro- phoretic mobility to focus (and in some cases, separate) ionic analytes into distinct zones. In ITP, analytes simultaneously focus and separate between high effective mobility leading electrolyte (LE) ions and low effective mobility trailing electro- lyte (TE) ions. 1,2 The balance of electromigration and diffusion at the zone boundaries in ITP results in sharp moving boundaries, which can be described as ion concentration shock waves. 35 Shock waves due to nonlinear electromigration flux in electrophoresis and ITP have been shown theoretically by Zhukov 3 and Moore 4 and experimentally by, for example, Ermakov et al. 10 and Thormann. 11 Typically, ITP experiments are performed separately for focusing anions or cations in anionic and cationic ITP, respec- tively; however, anionic and cationic ITP can also be performed simultaneously in a single channel. 12,13 The latter approach, called bidirectional ITP, is characterized by anionic and cationic ITP shock waves propagating in opposite directions. Depending on the initial conditions, shocks in bidirectional ITP can be made to propagate either toward or away from each other. 13,14 Kohlrausch 13,15 first proposed the idea of bidirectional ITP with diverging shocks, characterized by anionic and cationic ITP shocks moving apart. Since then, it has been used to simulta- neously separate cationic and anionic components of samples. 12,16,17 Oshurkova and Ivanova 18 first demonstrated bidirectional ITP in so-called “converging” mode in which cationic and anionic shocks approach each other. They used bidirectional ITP to measure the concentration of a binary electrolyte solution. The anions and cations of this binary electrolyte solution formed the respective LE ions of the simultaneous anionic and cationic ITP processes. 18,19 Since the Oshurkova and Ivanova study, we know of no further work on the study of converging ITP shocks. To our knowledge, all bidirectional ITP studies with converging shocks are limited to the case that the system is analyzed prior to the interaction of anionic and cationic shock waves. 18,19 For example, the Oshurkova and Ivanova 18 quantified the concentration of the LE by analyzing the rate of convergence of the two shocks. However, they do not discuss or present analysis of ion con- centrations or shock propagation velocities after the interaction of cationic and anionic ITP shocks. We know of no previous work studying the effect of shock interactions on different zones in bidirectional ITP. We view shock interaction in bidirectional ITP as an impor- tant process because it can lead to fundamental modification of the electrophoretic conditions. For example, shock interaction can initiate changes in counterion species, concentration of co- ion species, local pH (e.g., changing effective mobility), and species zone order. We here submit that shock interactions in bidirectional ITP can be used to initiate either modified ITP modes or electrophoresis modes. In the current work, we establish a bidirectional ITP experiment in which shock interac- tion triggers a transformation from ITP preconcentration to Received: January 31, 2011 Accepted: July 5, 2011 ABSTRACT: We present a novel technique for coupling isotachophoretic preconcentration and electrophoretic separation using bidirectional isotacho- phoresis (ITP). Bidirectional ITP simultaneously sets up sharp ITP interfaces between relatively high- and low-mobility cations and high- and low-mobility anions. These two interfaces can migrate toward each other and be described as ion concentration shock waves. We here demonstrate a bidirectional ITP process in which we use the interaction of these anionic and cationic ITP shock waves to trigger a transformation from ITP preconcentration to electrophoretic separa- tion. We use anionic ITP to focus anionic sample species prior to shock interaction. The interaction of the counter-propagating anionic and cationic ITP shocks then changes the local pH (and ionic strength) of the focused analyte zones. Under this new condition, the analytes no longer focus and begin to separate electrophoretically. The method provides faster and much less dispersive transition from ITP preconcentration to electrophoretic separation compared with traditional (unidirectional) transient ITP. It eliminates the need for intermediate steps between focusing and separation, such as manual buffer exchanges. We illustrate the technique with numerical simulations of species transport equations. We have validated our simulations with experimental visualization of bidirectional ITP zones. We then show the effectiveness of the technique by coupling ITP preconcentration and high-resolution separation of a 1 kbp DNA ladder via shock interaction in bidirectional ITP.
Transcript
Published: July 05, 2011
r 2011 American Chemical Society 6154 dx.doi.org/10.1021/ac200268f |Anal. Chem. 2011, 83, 6154–6162
ARTICLE
pubs.acs.org/ac
Coupled Isotachophoretic Preconcentration and ElectrophoreticSeparation Using Bidirectional IsotachophoresisSupreet S. Bahga, Robert D. Chambers, and Juan G. Santiago*
Department of Mechanical Engineering, Stanford University, California 94305, United States
bS Supporting Information
Isotachophoresis (ITP) is a preconcentration and separationtechnique that leverages electrolytes with different electro-
phoretic mobility to focus (and in some cases, separate) ionicanalytes into distinct zones. In ITP, analytes simultaneouslyfocus and separate between high effective mobility leadingelectrolyte (LE) ions and low effective mobility trailing electro-lyte (TE) ions.1,2 The balance of electromigration and diffusionat the zone boundaries in ITP results in sharpmoving boundaries,which can be described as ion concentration shock waves.3�5 Shockwaves due to nonlinear electromigration flux in electrophoresis andITP have been shown theoretically by Zhukov3 and Moore4 andexperimentally by, for example, Ermakov et al.10 and Thormann.11
Typically, ITP experiments are performed separately forfocusing anions or cations in anionic and cationic ITP, respec-tively; however, anionic and cationic ITP can also be performedsimultaneously in a single channel.12,13 The latter approach,called bidirectional ITP, is characterized by anionic and cationicITP shock waves propagating in opposite directions. Dependingon the initial conditions, shocks in bidirectional ITP can be madeto propagate either toward or away from each other.13,14
Kohlrausch13,15 first proposed the idea of bidirectional ITP withdiverging shocks, characterized by anionic and cationic ITPshocks moving apart. Since then, it has been used to simulta-neously separate cationic and anionic components of samples.12,16,17
Oshurkova and Ivanova18 first demonstrated bidirectional ITP inso-called “converging” mode in which cationic and anionicshocks approach each other. They used bidirectional ITP tomeasure the concentration of a binary electrolyte solution. The
anions and cations of this binary electrolyte solution formed therespective LE ions of the simultaneous anionic and cationic ITPprocesses.18,19 Since the Oshurkova and Ivanova study, we knowof no further work on the study of converging ITP shocks. To ourknowledge, all bidirectional ITP studies with converging shocksare limited to the case that the system is analyzed prior to theinteraction of anionic and cationic shock waves.18,19 For example,the Oshurkova and Ivanova18 quantified the concentration of theLE by analyzing the rate of convergence of the two shocks.However, they do not discuss or present analysis of ion con-centrations or shock propagation velocities after the interactionof cationic and anionic ITP shocks.We know of no previous workstudying the effect of shock interactions on different zones inbidirectional ITP.
We view shock interaction in bidirectional ITP as an impor-tant process because it can lead to fundamental modification ofthe electrophoretic conditions. For example, shock interactioncan initiate changes in counterion species, concentration of co-ion species, local pH (e.g., changing effective mobility), andspecies zone order. We here submit that shock interactions inbidirectional ITP can be used to initiate either modified ITPmodes or electrophoresis modes. In the current work, weestablish a bidirectional ITP experiment in which shock interac-tion triggers a transformation from ITP preconcentration to
Received: January 31, 2011Accepted: July 5, 2011
ABSTRACT: We present a novel technique for coupling isotachophoreticpreconcentration and electrophoretic separation using bidirectional isotacho-phoresis (ITP). Bidirectional ITP simultaneously sets up sharp ITP interfacesbetween relatively high- and low-mobility cations and high- and low-mobilityanions. These two interfaces can migrate toward each other and be described asion concentration shock waves. We here demonstrate a bidirectional ITP processin which we use the interaction of these anionic and cationic ITP shock waves totrigger a transformation from ITP preconcentration to electrophoretic separa-tion. We use anionic ITP to focus anionic sample species prior to shockinteraction. The interaction of the counter-propagating anionic and cationic ITP shocks then changes the local pH (and ionicstrength) of the focused analyte zones. Under this new condition, the analytes no longer focus and begin to separateelectrophoretically. The method provides faster and much less dispersive transition from ITP preconcentration to electrophoreticseparation compared with traditional (unidirectional) transient ITP. It eliminates the need for intermediate steps between focusingand separation, such as manual buffer exchanges. We illustrate the technique with numerical simulations of species transportequations. We have validated our simulations with experimental visualization of bidirectional ITP zones. We then show theeffectiveness of the technique by coupling ITP preconcentration and high-resolution separation of a 1 kbp DNA ladder via shockinteraction in bidirectional ITP.
electrophoretic separation. Traditional ITP buffer systems useonly two co-ionic species (leading and trailing) and a singlecounterionic species. Here, our bidirectional experiments requirefour species (i.e., two oppositely charged pairs of leading andtrailing ions) which we term LE+, LE�, TE+, and TE�. Here,LE and TE again denote the leading and the trailing electrolyteions, respectively, and + and� correspond to cations and anions,respectively. We explore the case of anionic analytes initiallyfocused between TE� and LE�. Before the anionic and cationicITP shocks meet, the counterion of the focused analyte zones isLE+. After these shocks meet, TE+ replaces LE+ as the counter-ion for analyte zones. This changes the pH such that ITP focusingconditions for analyte ions no longer hold, and consequently,analytes begin to separate electrophoretically. The methodnegates the need for deactivating power during the experimentor manual buffer exchanges as in typical transient ITP (t-ITP)experiments.20�22
We begin by describing the principle of coupling ITP pre-concentration and electrophoretic separation using bidirectionalITP with converging anionic and cationic ITP shock waves. Wediscuss choices of electrolyte chemistries appropriate for cou-pling ITP focusing and electrophoretic separation. We thenpresent simulations to illustrate the technique and verify ourchoice of electrolyte chemistry. We confirm these simulations byexperimental visualization of interacting anionic and cationic ITPshocks. Using simulations, we then compare the separationresolution of bidirectional ITP and t-ITP. Finally, using ourtechnique, we experimentally demonstrate coupled ITP pre-concentration and high-resolution separation of a 1 kbp ds-DNA ladder.
’THEORY
Concept of Initiating Electrophoresis via ITP Shock Inter-action. In ITP, analyte ions focus only if their charge has thesame sign as respective LE and TE ions. Two other requirementsfor focusing analyte ions are that analyte ions should have highereffective mobility (μ) than TE ions in both TE and analyte zones,
jμa,T j > jμte,T j, jμa,Aj > jμte,Aj ð1Þ
and that the effective mobility of analyte ions should be smallerthan that of LE ions in both LE and analyte zones,23
jμa, Lj < jμle, Lj, jμa,Aj < jμle,Aj ð2Þ
In our notation, the first (lower case) subscript indicates thechemical species and the second (capital) subscript indicates thezone of interest. Subscripts a, te, le therefore denote analyte, TE,and LE ions, respectively, and subscripts A, T, L denote analyte,TE, and LE zones.Whether and when the ITP focusing conditions given by eqs 1
and 2 are valid depends strongly on local conditions, becauseeffective mobility is a strong function of pH24 and a weakerfunction of ionic strength.25,26 For example, the effectivemobility ofa weak acid analyte increases monotonically with increasing pHand saturates at the lowest (negative) valence. Conversely, theeffective mobility of a weak base decreases with increasing pHmay saturate at the highest valence. In this work, we will consideronly singly ionized ions so that the aforementioned saturationvalues are the fully ionized mobilities of the +1 cation and �1anion, respectively. See Persat et al.24 for a review of the interplay
between electromigration and buffer chemistry, particularlyeffective mobility versus pH.In this work, we use bidirectional ITP with converging shocks
to quickly and precisely alter the pH of migrating ITP zones sothat analytes isotachophoretically focus before the shock inter-action and electrophoretically separate thereafter. Figure 1 showsa schematic of our technique. We fill a simple, straight channelwith a mixture of LE+, LE�, and anionic analytes (S1� andS2�), as shown in Figure 1a. LE+ and LE� serve as leadingelectrolyte ions for cationic and anionic ITP, respectively. We fillthe reservoir on the left with a mixture of TE� and LE+ (LE+acts as the counterion). Similarly, we fill the reservoir on the rightwith TE+ and LE�. For anionic ITP, we choose LE�, TE�, anda background counterion (LE+) such that ITP focusing condi-tions (given by eqs 1 and 2) hold for analytes S1� and S2� priorto the shock interaction. As shown in Figure 1b, when voltage isapplied across the channel, S1� and S2� focus between theLE� and the TE� zones. The anionic ITP (LE�/TE� inter-face) shock propagates toward the right, and the cationic ITPshock (LE+/TE+ interface) propagates toward the left. Subse-quently, the shocks meet and interact. The LE+/TE+ shocksweeps over the focused anionic analytes, replacing the local LE+counterions with TE+ ions. In this newly created region whereTE+ ions replaced the LE+ ions, the pH and effective mobilities
Figure 1. Schematic illustrating focusing and separation of analytesusing bidirectional ITP. (a) The channel is initially filled with a mixtureof LE+, LE�, and analytes S1� and S2�. The reservoir on the left isfilled with the LE+/ TE�mixture, and the reservoir on the right is filledwith the TE+/LE�mixture. Buffers are chosen such that LE+ is a cationof a weak base with high mobility and TE+ is a cation of a strong basewith low mobility. Furthermore, LE� is an anion of a strong acid withhigh mobility, and TE� is an anion of weak acid with low mobility. (b)When voltage is applied, the anionic analytes focus between LE� andTE�. The focused analyte zones propagate toward the right. Simulta-neously, a leftward-propagating cationic ITP shock forms between LE+and TE+ zones. Because TE+ is a stronger base than LE+, TE+ raises thepH behind the LE+/TE+ shock. (c) When the LE+/TE+ shock washesover the focused anionic analytes, it similarly raises the pH of anionicITP zones. The increase in pH of anionic ITP zones increases the localvalue of the effective mobility of TE� (an anion of a weak acid).Thereafter, TE� ions overtake the focused analyte ions, breaking theITP focusing conditions for S1� and S2�. Consequently, the anionicanalytes S1� and S2� cease focusing and commence electrophoreticseparation.
of the buffer and analyte ions change. To initiate electrophoreticseparation, we choose the conditions such that the effectivemobility of TE� in the newly created zone is larger than theeffective mobilities of S1� and S2�. This causes TE� ions toovertake and pass the analyte zones. Thereafter, S1� and S2�separate, as in capillary zone electrophoresis (Figure 1c).In our bidirectional ITP experiments, the cationic ITP inter-
face plays no role in the initial ITP focusing of analytes at theanionic ITP interface. The purpose of cationic ITP is to initiateelectrophoretic separation of these analytes upon interaction ofthe anionic and cationic ITP shocks. Therefore, we note that ourtechnique differs markedly from unidirectional transient ITP(t-ITP)20�22 wherein LE ions are injected behind focusedanionic samples to initiate separation.There are several choices to be made in designing ITP shock
interactions that initiate electrophoretic separation. We herefocus our discussion on choosing electrolytes (LE+, LE�, TE+,and TE�) to preconcentrate and separate strongly ionizedanalytes, such as nucleic acids. However, we note that ourtechnique is also applicable to a wide variety of cases, includingthat of weak electrolyte species. In the Supporting Information,we describe a strategy of choosing electrolytes for the case ofweakly acidic species and present an example simulation ofpreconcentration and separation of two amino acids usingbidirectional ITP.For the case of strongly ionized analytes, we choose a high fully
ionized mobility (absolute mobility), weak base for the LE+ andstronger base with low mobility for TE+. This creates a pHgradient across the initial LE+/TE+ shock, with a higher pH onthe cationic TE+ side. For the anionic ITP component, wechoose from relatively strong acids for LE�. We then choose aweaker acid for TE�, but one that has a high, fully ionizedmobility. The latter is the key choice because we will usebidirectional ITP to effect a titration of the TE� (weak acid)to create TE� ions that overtake analyte ions after the shockinteraction. After the shock interaction, TE+ (cation of strongbase) replaces LE+ (cation of weak base) as the counterion foranionic ITP. This increases the local pH of anionic ITP zones andtherefore raises the local value of effective mobility of TE� ions.In contrast, the effective mobilities of LE� ions and the
anionic analytes do not change appreciably after the shockinteraction because they are anions of relatively stronger acids.If we make these choices correctly, the shock interaction causesthe effective mobility of TE� to increase to a value larger thanthat of analyte ions. This then violates the ITP focusing conditiongiven by eq 1 and initiates electrophoretic separation.This transition from focusing to separation is analogous in
function to t-ITP.20�22 However, in t-ITP, LE ions are injectedbehind the focused analytes (typically by deactivating appliedcurrent and effecting a buffer exchange at the TE reservoir22) toinitiate electrophoretic separation. Here, we use the titrationcaused by the interaction between cationic and anionic ITPshocks to effect a change in the mobility of TE ions such that theythemselves overtake the focused analytes. Our method thereforefeatures an initial condition that governs both focusing andseparation dynamics, and the transition from ITP to separationcan be initiated automatically with no buffer exchange or inter-mediate injections. As we show below, our method also achievesthis transition with much less dispersion of the focused analytescompared with that in t-ITP.We here provide specific examples of viable electrolyte che-
mistries for our method. Note that a key requirement is that the
LE+ should be a cation of a weak base with high fully ionizedmobility, and TE+ should be a cation of a strong base with lowfully ionized mobility. For strong base, fast cations, we can useNa+ and K+. However, several choices exist for high fully ionizedmobility cations of weak bases and low fully ionized mobilitycations of strong bases. Table 1 shows three choices each forcationic LE and TE (nine usable combinations of LE+ and TE+)that satisfy our requirements.Another requirement is that the effective mobility of TE� ions
should be less than that of analyte ions when the bufferingcounterion is LE+ and otherwise when the counterion is TE+. Toeffect a substantial increase in effective mobility of TE� after theshock interaction, TE� should therefore be a weak acid such thatpKa,LE+ < pKa,TE� < pKa,TE+. For example, in our experiments,we used tricine (pKa,TE� = 8.15) as TE� along with imidazole(pKa,LE+ = 7.15) as LE+ and arginine (pKa,TE+ = 8.92) as TE+.On the other hand, there are no specific constraints on LE�,which can be any fast ion, such as Cl� and SO4
2�.We note that our bidirectional ITP experiments are compa-
tible with both “semi-infinite” and “finite” sample injectionschemes. For example, in Figure 1a, we show a semi-infinitesample injection scheme wherein sample ions are initially mixedin the LE�/LE+ mixture. Such an injection scheme bothincreases sensitivity (by continuously focusing sample until theshock interaction) and minimizes the complexity of the injectionprotocol. Alternatively, semi-infinite sample injection can beperformed by mixing the sample ions in the TE�/LE+ reservoir.As a third alternative, sample ions can be injected using a moretraditional finite injection protocol wherein a finite amount ofanalyte mixture is initially sandwiched between pure LE�/LE+and TE�/LE+ zones. However, we emphasize that the choice ofsample injection scheme does not have a significant effect on thetransition from ITP to CE mode or the quality of CE separation.Simulations of Bidirectional ITP for both Focusing and
Separation of Analytes.We performed simulations of coupledITP focusing and electrophoretic separation of two modelanalytes in bidirectional ITP using the SPRESSO simulationtool.25,28,29 For our simulations, we used 75 mM HCl as LE�,20 mM tricine as TE�, 150 mM imidazole as LE+, and 30 mMarginine as TE+. To illustrate the technique, we used two modelanionic analytes, S1� and S2�, for the simulation withmobilities�20 � 10�9 m2V�1s�1 and �12 � 10�9 m2V�1s�1, respec-tively. These analytes were assumed to be fully ionized under the
Table 1. Possible Cationic Buffer Systems for Coupled Pre-concentration and Separation of Anions Using BidirectionalITP
μ+1(� 10�9 m2 V�1 S1�) pKa,1+
Cationic LE (LE+)
imidazole 52 7.15
3-methyl pyridine 40.1 5.2
4-methyl pyridine 40.1 6.2
Cationic TE (TE+)
argininea 26.9 8.92
Tris 29.5 8.08
amediol 33.5 8.78aArginine has two other ionization states corresponding to pKa,1� =12.48 and pKa,2+ = 1.78. However, Arginine is primarily disassociated inits 1+ state under safe pH10 conditions of 5 < pH < 9.
conditions of simulation. Figure 2a,b shows the initial conditionsof the simulation.Analytes S1� and S2� were initially mixed in the LE�/LE+
mixture at concentrations of 15 and 10 μM, respectively. Whenan electric field is applied, LE�/TE� and LE+/TE+ shockspropagate toward the right and the left, respectively. Prior toshock interaction, analytes S1� and S2� focus between the LE�and TE� ions, as shown in Figure 2d. For this particular bufferchemistry, LE+ and TE+ form a shared cationic ITP zone, asshown in Figure 2c. (We see a shared zone since the effectivemobility of LE+ ions in the TE+ zone is smaller than that ofTE+ ions, but the effective mobility of LE+ ions in the LE+ zone
is greater than that of TE+ ions.) When the LE+/TE+ and LE�/TE� shocks interact (Figure 2e,f) the effective mobility of TE�increases, and it overtakes the focused analytes S1� and S2�.This initiates electrophoretic separation of S1� and S2�.Figures 2g,h shows the final state when both analyte ions, S1�
and S2�, are fully separated. We note that for electrophoreticseparation to occur, it is necessary for TE� ions to overtake thefocused analytes. However, TE� ions need not overtake LE�ions, and the LE�/TE� shock may persist, as shown inFigures 2g,h. In contrast, the shock interaction interrupts theLE+/TE+ interface, and this interface mixes (via electromigra-tion dispersion) thereafter. That is, after the shock interaction,TE� replaces LE� as the counterion for cationic ITP. Since theconjugate acid of TE� is weaker than the conjugate acid of LE�,the pH of cationic ITP zones increases after the shock interac-tion. As a result, the effective mobility of LE+ (cation of a weakbase) decreases considerably compared with TE+ (cation of astrong base), causing disruption of the cationic ITP interface.Simulation results, shown in Figure 2, highlight the advantages
of focusing and separation using bidirectional ITP over t-ITP. Asshown in Figures 2e, f, TE� ions begin overtaking focusedanalyte ions (S1� and S2�) as soon as the LE+/TE+ shock wavewashes over the focused analyte ions. Thus, the transition fromfocusing to separation occurs quickly after shock interaction.This is in contrast with t-ITP, in which LE ions injected behindthe TE zone must first overtake the entire TE zone beforedisrupting the ITP focusing.20,21,30 More importantly, in t-ITP,LE ions injected behind the TE zone first tail into analyte zonesand effect a longer, more gradual disruption of ITP focusing.22
The latter can lead to significant electromigration dispersion ofthe analyte zones prior to separation. Here, we observe a rapidchange of local electromigration conditions (from ITP to zoneelectrophoresis separation) during which we observe negligibledispersion. (Later in this section, we compare the separationresolution of bidirectional ITP and t-ITP using numericalsimulations.) Rapid transition from ITP to CE in our techniqueis especially important for on-chip systems in which channellengths may be limited. Finally, the transition from focusing toseparation in bidirectional ITP is fully automated and does notrequire buffer replacement or switching electric field betweencolumn-coupled channels, as in t-ITP.20 Thus, the currenttechnique can be easily adapted for on- or off-chip single-channelsystems, including commercial CE systems.We also performed a simulation under conditions where we
can directly compare numerical predictions with experimentalvisualization of interacting shocks waves. For this, we used thesame ITP chemistry and the initial conditions as in the previoussimulation (Figure 2), but instead of analytes S1� and S2�, weused a fluorescent nonfocusing tracer (NFT). The NFT does notdisturb or change the ITP or focus during ITP, but its concen-tration adapts to the local electric fields in each ITP zone (seeFigure 3a). Thus, the regions of varying fluorescence intensityhighlight and denote different ITP zones (more on NFTvisualization technique27 in the Experiments section).Figure 3a shows a simulated spatiotemporal plot of the
fluorescence intensity of the fluorescent NFT in the channelduring bidirectional ITP. The scalar quantity plotted here is thefluorescence intensity of NFT (averaged along the channelwidth) as a function of distance along the axis of the channel(abscissa) and time (ordinate). Our simulation neglects theeffects of photobleaching, and we assume a linear relationshipbetween fluorescence intensity and the NFT concentration.
Figure 2. Simulation showing focusing and separation of species usingbidirectional ITP. Plots in second column are detailed views of thedistributions in the first column. (a, b) Initial distribution of chemicalspecies in the separation channel prior to activating current. (c, d) LE�/TE� and LE+/TE+ shocks after the electric field is applied. (c) showsLE�/TE� shock (x = 43 mm) propagating rightward and a LE+/TE+shock (x = 70 mm) propagating leftward. (d) shows anionic analytesS1� and S2� focused between LE� and TE�. (e, f) Transition fromfocusing to separation upon the interaction of LE�/TE� and LE+/TE+ITP shocks. The high pH TE+ zone washes over the focused anionicanalytes, increasing the effective mobility of TE� ions, but onlynegligibly affecting the mobility of S1� and S2�, which are strongeracids. Here, the effective mobility of TE� increases above those of S1�and S2�, thereby initiating separation. (f) TE� overtaking focused S1�and S2�, thus initiating electrophoretic separation. (g, h) Final state, inwhich analytes S1� and S2� are fully separated. (g) Anionic ITP shockat x = 68 mm and an expansion wave (x = 50 mm) due to disruptedcationic ITP. (h) Fully separated peaks of S1� and S2�, but an intactITP interface between LE� and TE�. Simulations were performedusing our open source code Spresso.28,29 Chemistry is described in text.We assumed a constant current of 1.4 μA and a D-shaped, wet-etchedchannel 74 μm wide and 12 μm deep. We approximately account forelectroosmotic flow using a constant and uniform electroosmoticmobility of 2 � 10�9 m2V�1s�1.
The plot shows an anionic ITP (LE�/TE�) shock and acationic ITP (LE+/TE+) shock propagating toward the rightand the left, respectively. After these shock waves meet, therightward traveling LE�/TE� shock remains intact becauseLE� ions (Cl�) have higher effective mobility than TE� ions(tricine), even after the shock interaction. On the other hand,shock interaction disrupts the leftward propagating LE+/TE+shock, creating a rarefaction wave (the zones gradually mix viaelectromigration dispersion). In this simulation, we used aconstant electroosmotic mobility of 2 � 10�9 m2 V�1 s�1 asour only fitting parameter to match all experimentally mea-sured wave speeds (see Experiments section).Comparison of Bidirectional and Transient ITP. We here
compare traditional unidirectional t-ITP and bidirectional ITPusing numerical simulations. Parts (a) and (b) of Figure 4, respec-tively, show simulated spatiotemporal plots of these two cases. Inboth cases, we consider the same anionic analytes (S1� and S2�)
as in Figure 2, but to aid in visualization of various ITP zones,we also consider addition of a NFT that is initially mixed withLE�/LE+ buffer. The background fluorescence intensity valuesin Figures 4a, b therefore correspond to the concentration ofNFT in the various ITP zones, and the brighter zones correspondto the analyte peaks.For the anionic t-ITP simulations, we used the anionic ITP
chemistry (with LE+ as the counterion), channel geometry, and
Figure 3. Numerical simulation and experimental visualization ofinteracting anionic and cationic ITP shocks. (a) Numerical simulationof propagating LE�/TE� and LE+/TE+ shocks. The spatiotemporalplot shows the intensity of a fluorescent nonfocusing tracer (NFT)27
versus distance along the channel axis, x, and time, t. The NFT does notfocus via ITP, but its concentration adapts to the local electric field ineach zone. Regions of different fluorescence intensity mark ITP zones.(b) Experimental visualization of the same process using the fluorescentnonfocusing tracer (NFT) technique.27 Both parts show LE�/TE� andLE+/TE+ shocks propagating toward the right and left, respectively.These shocks meet near x = 1.6 mm. The rightward-traveling LE�/TE� shock remains intact (positive slope to the right of x = 1.6 mm). Incontrast, the LE+/TE+ interface is disrupted, and the interface starts tomix (barely noticeable in this field of view). To account for electro-osmotic flow in our simulation, we used a constant electroosmoticmobility of 2� 10�9 m2 V�1 s�1. We used Rhodamine 6G as the NFT.We applied a 1.4 μA current across a D-shaped, wet-etched, 74 μmwideand 12 μm deep channel.
Figure 4. Simulations comparing unidirectional transient ITP (t-ITP)and bidirectional ITP. (a, b) Simulated spatiotemporal diagrams offocusing and separation of two anionic species (S1� and S2�) in t-ITPand bidirectional ITP, respectively. Both plots show fluorescenceintensity of S1�, S2� and a nonfocusing tracer (NFT)27 versus distancealong the channel axis, x, and time, t. Background fluorescence valuescorrespond to NFT concentration in various ITP zones. The brighterzones correspond to the analyte peaks. (a) t-ITP process in which S1�and S2� are initially (t < 25 s) focused in a narrow zone. This focusedITP zone propagates toward the right until it is disrupted by theovertaking LE� ions. Around t = 25 s, ITP focusing is disrupted, andthe S1� and S2� zones start separating. This transition is gradual andyields significant electromigration dispersion. (b) S1� and S2� ionsinitially (t < 25 s) focused at the LE�/TE� interface of bidirectionalITP. The LE�/TE� shock propagates rightward (positive slope fort < 25 s), and the LE+/TE+ shock propagates leftward. These shocksinteract near x = 4mm at t = 25 s and very quickly initiate electrophoreticseparation of S1� and S2�. This fast ITP-to-CE transition results inmuch less electromigration dispersion, higher separation resolution, andsmaller analysis time. The chemistry used here is described in the text.The channel dimensions, applied current, and EOF mobility were thesame as those used for Figure 2.
applied current of the simulation of Figure 2. Traditional anionict-ITP does not involve cationic ITP, so we did not use TE+ in thet-ITP simulations. We first performed simulation of ITP focusingof analyte ions, S1� and S2�, between zones of LE� and TE�ions. We then stopped the simulation and replaced TE� ions inthe TE�/LE+ reservoir (near the leftmost boundary) with LE�ions; this initiated the process of disrupting ITP. Figure 4a showsS1� and S2� ions initially focused in a narrow ITP zone thatpropagates rightward at a constant speed (the constant slope linefor t < 25). Around t = 25 s and x = 4 mm, LE� ions beginovertaking the focused analytes and initiate electrophoreticseparation of S1� and S2�. Figure 4a shows the separationphase of t-ITP for t > 25 s, during which the distance between theanalyte peaks increases over time while the peaks themselvesbroaden due to diffusion and electromigration dispersion. Inter-estingly, during the transition from ITP focusing to CE separa-tion, the speed of the analyte zones decreases considerably. Thisdeceleration of analyte zones is apparent in Figure 4a, where theanalyte peak locations vary nonlinearly with time after t = 25 s. Asimilar deceleration of analyte zones in t-ITP has been observedexperimentally by Chambers and Santiago.27 The transitionphase in t-ITP is slow, analytes zones disperse, and the distancebetween the analyte peaks does not exceed their characteristicwidths until about t = 90 s.For the bidirectional ITP simulation (Figure 4b), we used
the same conditions as those of Figure 2, including theelectrolyte chemistry, applied current, and the channel geo-metry; the only difference being the presence of NFT inFigure 4b. We note that the results shown in Figures 2 and4b are quite similar, because the presence of the NFT in traceamounts (100 μM initial concentration) has a negligible effecton local electric fields and focusing and separation of S1� andS2�. Figure 4b shows the LE�/TE� shock wave propagatingtoward the right and the LE+/TE+ shock wave propagatingtoward the left (for t < 25 s). Analytes S1� and S2� initiallyfocus at the LE�/TE� interface. When the LE�/TE�and LE+/TE+ shock waves interact around x = 4 mm andt = 25 s, ITP focusing of S1� and S2� very quickly transitions toCE separation. Thereafter (for t > 25 s), the relative distancebetween S1� and S2� peaks keeps increasing while the peaksgradually diffuse over time.Comparison of Figures 4a and b show that the analyte peaks in
bidirectional ITP are much better resolved than in t-ITP. That is,for the same distance between the two peaks, the peaks inbidirectional ITP are much less dispersed than in t-ITP. Bidirec-tional ITP yields higher resolution separations, since the ITP-to-CE transition in bidirectional ITP occurs quickly after the anionicand cationic ITP shocks interact. Thus, analytes are exposed tolocal conductivity gradients (which cause electromigration dis-persion) for a much shorter distance and time. In contrast, int-ITP, LE� ions injected behind the TE� zone tail significantlyinto the focused analyte zones and only gradually and slowlydisrupt ITP preconcentration,22 yielding significant and prolongedelectromigration dispersion. In addition to better resolution, thefaster ITP-to-CE transition offered by bidirectional ITP results inreduced separation time and an increased signal-to-noise ratio fora given resolution. Compare, for example, the resolution ob-tained by bidirectional ITP in Figure 4b at t = 45 s. Suchresolution is not observed in the t-ITP case (Figure 4a), evenat t = 150 s. In the Supporting Information, we show a plot ofresolution vs time for both bidirectional ITP and t-ITP using thesimulation data of Figures 4a,b.
’MATERIALS AND METHODS
We performed experiments to visualize interacting cationic andanionic ITP shock waves in bidirectional ITP using the NFTtechnique27 (cf. the Experiments section). For these visualizationexperiments, LE�was the chloride ion from75mMHCl,TE�was20 mM tricine, LE+ was 150 mM imidazole, and TE+ was 30 mMarginine.We prepared 10mM stock solution of the Rhodamine-6Gdye (Invitrogen, Carlsbad, CA) and used it as anNFTbymixing at aconcentration of 100 μM in the LE+/LE� mixture.
For the experiments demonstrating coupled ITP preconcen-tration and separation of DNA fragments, we used the chlorideion from 150 mMHCl as LE�, 20 mM tricine as TE�, 300 mMimidazole as LE+, and 30mM arginine as TE+.We added a 1 kbpDNA ladder from New England BioLabs (Ipswich, MA) to themixture of LE+ and LE�, with a final concentration of 50 ng/mL.We used 0.75% w/w hydroxyl ethyl cellulose (HEC) as a sievingmatrix (mixed with LE�) to achieve a size dependence on themobility of fragments, because the free solution mobility of ds-DNA fragments greater than∼400 bp is effectively independentof molecular weight.31 To visualize the DNA fragments, we usedthe fluorescent intercalating dye SYBR Green I (Invitrogen,Carlsbad, CA). (We note that intercalating dyes, such as SYBRGreen I, should be handled carefully due to their potentialmutagenic properties.32)
We prepared 1 M stock solutions of HCl, tricine, andimidazole and 300 mM stock solution of arginine hydrochloridebefore diluting them to the desired concentrations in differentsolutions. We added 1% w/w polyvinylpyrrolidone (PVP) to allsolutions to suppress electroosmotic flow. All chemicals wereobtained from Sigma Aldrich (St. Louis, MO) and were preparedin UltraPure DNase/RNase-free distilled water (GIBCO Invi-trogen, Carlsbad, CA).
We captured images using an inverted epifluorescent micro-scope (IX70, Olympus, Hauppauge, NY) equipped with a LEDlamp (LEDC1, ThorLabs, Newton, NJ), U-MWIBA filter cubefrom Olympus (460�490 nm excitation, 515 nm emission, and505 nm cutoff dichroic) and a 10� (NA = 0.3) UPlanApoobjective (Olympus, Hauppauge, NY). Images were capturedusing a 12 bit, 1300 � 1030 pixel array CCD camera(Micromax1300, Princeton Instruments, Trenton NJ). We con-trolled the camera using Winview32 (Princeton Instruments,Trenton NJ) and processed the images with MATLAB (R2007b,Mathworks, Natwick, MA). We conducted the experiments byapplying either constant voltage or current using a sourcemeter(model 2410, Keithley Instruments, Cleveland, OH).
For all our experiments, we used off-the-shelf Caliper NS-95borosilicate glass microchips from Caliper Life Sciences(Mountain View, CA). Figure 5a shows a schematic of thechannels with cross-geometry. The channels consist of a widerloading section (50 μm mask width) and a narrower separationsection (10 μm mask width). All channels are wet-etched to adepth of 12 μm. The variable cross-sectional geometry allows usto achieve higher sensitivity in ITP by focusing a large amount ofsample in the loading section prior to entering the separationchannel.33,34
’EXPERIMENTS
We first performed on-chip bidirectional ITP experiments tovisualize interacting cationic and anionic ITP shock waves. Forthese experiments, we did not focus analytes, but instead, visualizedthe interaction of cationic and anionic LE/TE interfaces.
We used these visualization experiments to optimize our injec-tion protocol to precisely control the location of shock interac-tion. We then performed bidirectional ITP experiments todemonstrate coupled preconcentration and high-resolution se-paration of DNA fragments from a 1 kbp ds-DNA ladder.Visualization of Interacting Shocks in Bidirectional ITP.
We visualized interacting anionic and cationic ITP shocks inbidirectional ITP using the NFT technique.27 In the NFTtechnique, fluorescent, co-ionic species that do not obey theITP focusing conditions given by eqs 1 and 2 are mixed with theITP buffers. These fluorescent species do not focus, but theirconcentration adapts to a local electric field in different ITPzones to maintain the continuity of electromigration flux. For ourexperiments, we used a 100 μM concentration of Rhodamine-6G(R6G, a cationic dye) in the LE+/LE�mixture as theNFT. In ourexperiments, R6G is slower than the cationic TE ions and so doesnot focus. Hence, we visualized propagating anionic and cationicITP shock waves simultaneously using a single nonfocusingfluorescent species (Rhodamine-6G). The experimental protocolfor these experiments is discussed in the Supporting Information.Figure 3b shows an experimentally measured spatiotemporal
plot of fluorescence intensity in a bidirectional ITP experimentwith converging shock waves. To obtain this spatiotemporal plot,we captured CCD camera images of fluorescence intensity in a3.25 mm long section of the channel at a rate of 10 frames/s. Wethen width-averaged the fluorescent intensity for 210 images andplotted this axial intensity distribution for each point (in time)along the ordinate. In Figure 3b, the abscissa is the axial distancealong the channel, the ordinate is time, and the intensity of theplotted scalar is the measured fluorescence intensity. The slopesof features in such spatiotemporal plots are therefore inverselyproportional to the velocities of ITP zone interfaces. Figure 3bshows that, prior to the shock interaction (t < 15 s), the LE�/TE� shock propagates toward the right, and the LE+/TE+shock, toward the left. After the LE�/TE� and LE+/TE+shocks interact (at x = 1.6 mm and t = 15 s), the LE+/TE+interface is disrupted, and a rarefaction wave ensues. This isbecause the effective mobility of TE+ becomes higher than LE+after the shock interaction. However, after the shock interaction(t > 15s), the LE�/TE� interface remains intact because themobility of fully ionized chloride ion (LE�) remains higher thanthe effectivemobility of tricine (TE�) throughout the experiment.Our experimental visualization results compare well with thesimulated spatiotemporal diagram shown in Figure 3a.Our simula-tions correctly predict the persistence of LE�/TE� interface andthe disruption of the LE+/TE+ interface after the shock interac-tion.We use an electroosmotic mobility value of 2� 10�9 m2 V�1
s�1 as the only fitting parameter, and yet, the simulations correctlypredict the time and the location of shock interaction and the fourobservable propagation velocities.We note that experimental visualization and simulations of
interacting shocks in bidirectional ITP are particularly helpful intuning the initial conditions to precisely select the location ofshock interaction and transition from ITP focusing to electro-phoretic separation. For our experiments on DNA separations,we used a NFT27 to tune our injection protocol to initiateelectrophoretic separation as soon as the focused analytesentered the narrow separation channel. This allowed us to obtainhigher resolution by using the entirety of the separation channelfor the CE mode.Coupled Preconcentration and Separation of DNA Frag-
ments.We performed experiments to demonstrate coupled ITP
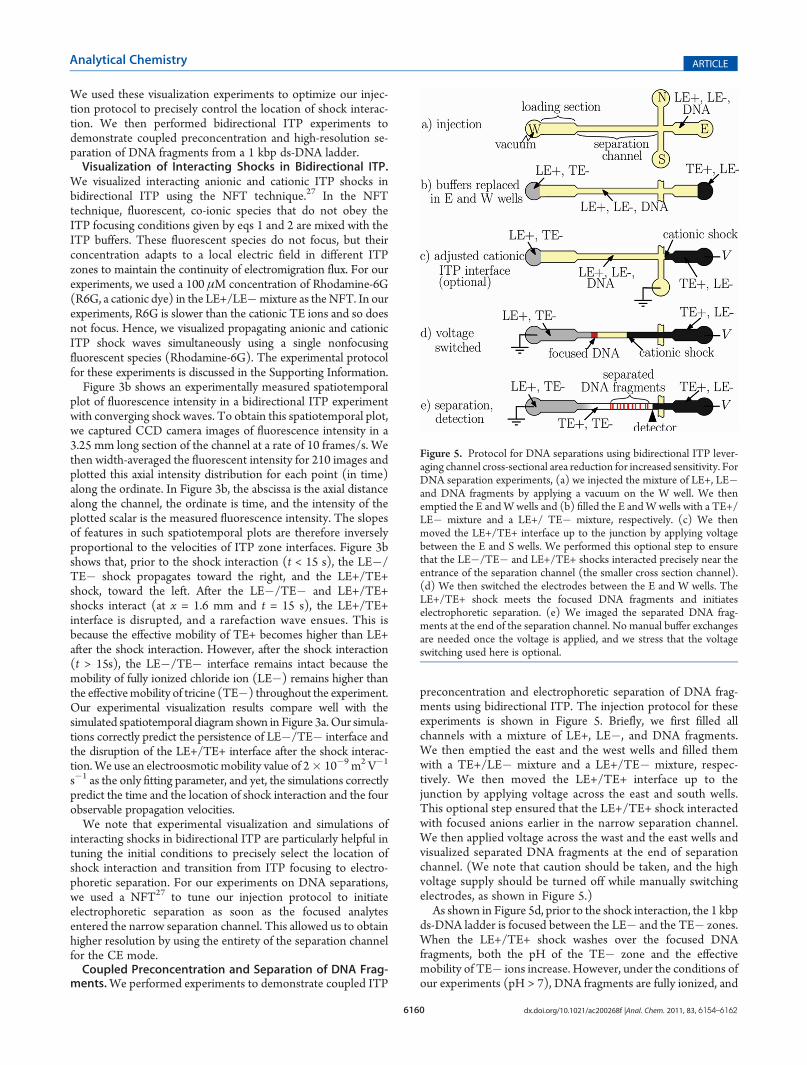
preconcentration and electrophoretic separation of DNA frag-ments using bidirectional ITP. The injection protocol for theseexperiments is shown in Figure 5. Briefly, we first filled allchannels with a mixture of LE+, LE�, and DNA fragments.We then emptied the east and the west wells and filled themwith a TE+/LE� mixture and a LE+/TE� mixture, respec-tively. We then moved the LE+/TE+ interface up to thejunction by applying voltage across the east and south wells.This optional step ensured that the LE+/TE+ shock interactedwith focused anions earlier in the narrow separation channel.We then applied voltage across the wast and the east wells andvisualized separated DNA fragments at the end of separationchannel. (We note that caution should be taken, and the highvoltage supply should be turned off while manually switchingelectrodes, as shown in Figure 5.)As shown in Figure 5d, prior to the shock interaction, the 1 kbp
ds-DNA ladder is focused between the LE� and the TE� zones.When the LE+/TE+ shock washes over the focused DNAfragments, both the pH of the TE� zone and the effectivemobility of TE� ions increase. However, under the conditions ofour experiments (pH > 7), DNA fragments are fully ionized, and
Figure 5. Protocol for DNA separations using bidirectional ITP lever-aging channel cross-sectional area reduction for increased sensitivity. ForDNA separation experiments, (a) we injected the mixture of LE+, LE�and DNA fragments by applying a vacuum on the W well. We thenemptied the E andWwells and (b) filled the E andW wells with a TE+/LE� mixture and a LE+/ TE� mixture, respectively. (c) We thenmoved the LE+/TE+ interface up to the junction by applying voltagebetween the E and S wells. We performed this optional step to ensurethat the LE�/TE� and LE+/TE+ shocks interacted precisely near theentrance of the separation channel (the smaller cross section channel).(d) We then switched the electrodes between the E and W wells. TheLE+/TE+ shock meets the focused DNA fragments and initiateselectrophoretic separation. (e) We imaged the separated DNA frag-ments at the end of the separation channel. No manual buffer exchangesare needed once the voltage is applied, and we stress that the voltageswitching used here is optional.
any increase in pH has no significant effect on the effectivemobility of DNA fragments. TE� ions, therefore, overtake focusedDNA after the shock interaction, initiating electrophoretic separa-tion in the HEC sieving matrix (shown schematically in Figure 5e).In our experiments, we used a semi-infinite injection scheme bymixing DNA fragments with the LE� and LE+ mixture toincrease the sensitivity by continuously focusing DNA frag-ments until the shock interaction. We note that the DNAfragments can also be initially mixed with LE+/TE� mixture.Figure 6 shows the results of DNA preconcentration and
separation using bidirectional ITP. Initially, all DNA fragmentsare focused in a thin zone between the LE� and TE� zones(Figure 6a). Later, the shock interaction initiates CE separationof focused DNA fragments. The initial phase of CE separation isshown in Figure 6b. Figure 6c shows an electropherogrammeasured at the end of separation channel showing a fullyresolved DNA ladder consisting of distinct peaks 1�11 corre-sponding to the 10, 8, 6, 5, 4, 3, 2, 1.5, 1, 0.517, and 0.500 kbpfragments. The electropherogram from our experiments is inqualitative agreement with slab gel separations of the sameDNA ladder (provided by the vendor, New England BioLabs,Ipswich, MA). We note that peaks 10a and 10b (correspondingto 500 and 517 bp) are clearly resolved by our technique (seeFigure 6c) but not resolved in agarose gel electrophoresis(e.g., Figure 6d). These distinct peaks corresponding to 500and 517 bp have also been observed for this ladder in higherresolution separations on polyacrylamide gels.35 For these
experiments, we diluted the DNA to 50 ng/mL concentrationin the LE+/LE� mixture with only 1 pg of DNA initiallyinjected into the separation channel.
’CONCLUSIONS
We have developed a new technique to automatically coupleisotachophoretic preconcentration and electrophoretic separa-tion via shock interaction in bidirectional ITP.We have describedhow interaction of cationic and anionic ITP shocks in convergingbidirectional ITP can lead to fundamental changes in focusingbehavior of analytes. We leveraged shock interaction in bidirec-tional ITP to precisely change the pH of migrating zones so thatinitially focused analytes initiate electrophoretic separation uponshock interaction. To the best of our knowledge, this is the firsttime that shock interaction in bidirectional ITP has beenleveraged to couple different electrophoresis modes.
We discussed practical choices of electrolyte chemistries forbidirectional ITP that give electrophoretic separation after theinteraction of cationic and anionic ITP shocks. To illustrate thetechnique and verify our choice of buffer chemistry, we per-formed numerical simulations using 1-D area-averaged electro-migration-diffusion transport equations. On the basis of thesesimulations, we showed that the transition from focusing toseparation in bidirectional ITP is fast and results in negligibleelectromigration dispersion of electrophoretic zones.We confirmedthe simulation results with indirect fluorescence visualizationexperiments of bidirectional ITP zones. Using a single fittingparameter (electroosmotic mobility), we showed that our simu-lations accurately capture the observed dynamics of shockinteraction, including shock velocities and disruption of ITPinterfaces after shock interaction. We then used simulations tocompare separation resolution of bidirectional ITP and unidirec-tional t-ITP. Our simulations show that bidirectional ITP yieldsseparations with significantly higher resolution and shorter analysistime compared with t-ITP. Finally, as an example application, weused bidirectional ITP to couple ITP preconcentration and high-resolution electrophoretic separation of DNA fragments of a1 kbp DNA ladder. We fully resolve the ladder in 7 min (only 3min after shock interaction) starting from a 30 μL sampledispensed into the chip reservoir at 50 ng/mL concentration(after which ∼1 pg of DNA was injected into the channel) andusing no manual steps.
Shock interaction in bidirectional ITP is an elegant way tocouple ITP preconcentration and electrophoretic separation.The method eliminates the need for intermediate steps, suchas buffer exchange and deactivation and reactivation of a powersupply. Unlike t-ITP, the transition from focusing to separationin bidirectional ITP occurs over a relatively small distance (here,on the order of 1 mm), allowing optimal use of the channel lengthfor the ITP focusing and electrophoretic separation phases. Thisaspect is particularly important for on-chip systems that haveconstraints on maximum channel length. The technique can alsobe applied to conventional single-channel CE systems (e.g., usingfused-silica capillaries) and eliminates the need for column-coupled channels for buffer replacement.
’ASSOCIATED CONTENT
bS Supporting Information. Additional information as notedin text. This material is available free of charge via the Internet athttp://pubs.acs.org.
Figure 6. Experimental preconcentration and separation of 1 kb ds-DNA ladder using bidirectional ITP. (a) Initially focused DNA frag-ments in anionic ITP. (b) Transition from focusing to separation afterthe cationic ITP interface washes over the focused DNA fragments. (c)Fully resolved DNA ladder with 11 peaks at the end of separationchannel. (d) Visualization (inverted) of agarose gel electrophoresis separa-tion (provided by the vendor, New England BioLabs, Ipswich, MA). Notethat the agarose gel does not resolve peaks 10a and 10b corresponding to517 and 500 bp fragments. The electropherogram at (c) is measured 15mm to the right of the point where the shocks interact. For thisexperiment, we used a semi-infinite injection of DNA sample to increasethe detection sensitivity and minimize the injection complexity.
S.S.B. is supported by a Mayfield Stanford Graduate Fellow-ship and a Kodak Fellowship. R.D.C. was supported by a KodakFellowship. We gratefully acknowledge funding from the De-fense Advanced Research Projects Agency (DARPA) undergrant number N660001-09-C-2082, and the DARPA sponsoredMicro/Nano Fluidics Fundamental Focus (MF3) under contractnumber N66001-10-1-4003.
’REFERENCES
(1) Everaerts, F. M.; Beckers, J. L.; Verheggen, Th. P. E. M.Isotachophoresis�Theory, Instrumentation and Applications; Elsevier:Amsterdam, 1976.(2) Bocek, P. Top. Curr. Chem. 1981, 95, 131–178.(3) Zhukov, M. Yu. U.S.S.R. Comput. Math. Math. Phys. 1984, 24,
138–149.(4) Moore, G. T. J. Chromatogr. 1975, 106, 1–16.(5) We note that “shock wave” is a generic term that has been used in
the literature to describe discontinuities due to nonlinear advection fluxin a variety of physical processes, such as fluid flow,6 chromatography,7
ITP,3,4 sedimentation boundaries,8 and automotive traffic flow.9
(6) Leveque, R. J. Finite Volume Methods for Hyperbolic Problems;Cambridge University Press: Cambridge, U.K., 2004.(7) Rhee, H.-K.; Aris, R.; Amundson, N. R. Philos. Trans. R. Soc. A
1970, 267, 419–455.(8) Probstein, R. F. Physicochemical Hydrodynamics: An Introduction;
Wiley-Interscience: New York, 1994; Chapter 5.(9) Richards, P. I. Oper. Res. 1956, 4, 42–51.(10) Ermakov, S. V.; Zhukov, M. Y.; Capelli, L.; Righetti, P. G.
Electrophoresis 1998, 19, 192–205.(11) Thormann, W. Electrophoresis 1983, 4, 383–390.(12) Thormann, W.; Arn, D.; Schumacher, E. Electrophoresis 1985,
6, 10–18.(13) Oshurkova, O. V.; Gorshkov, A. I. Russ. Chem. Rev. 1993, 62,
729–742.(14) Oshurkova, O. V.; Gorshkov, A. I.; Nesterov, V. P. Russ. J.
Electrochem. 2004, 40, 516–520.(15) Kohlrausch, F. Ann. Phys. Chem. 1897, 62, 209–239.(16) Hirokawa, T.; Watanabe, K.; Yokota, Y.; Kiso, Y. J. Chromatogr.
1993, 633, 251–259.(17) Prest, J. E.; Baldock, S. J.; Fielden, P. R.; Goddard, N. J.; Treves
Brown, B. J. Analyst 2002, 127, 1413–1419.(18) Oshurkova, O. V.; Ivanova, I. A. Dokl. Akad. Nauk SSSR 1976,
227, 1371–1374.(19) Oshurkova, O. V.; Ivanova, I. A. J. Anal. Chem. USSR 1977,
32, 1707–1711.(20) Foret, F.; Szoko, E.; Karger, B. L. J. Chromatogr. 1992, 608, 3–12.(21) Foret, F.; Szoko, E.; Karger, B. L. Electrophoresis 1993, 14,
417–528.(22) Krivankova, L.; Pantuckova, P.; Bocek, P. J. Chromatog., A 1999,
838, 55–70.(23) Gebauer, P.; Bocek, P. J. Chromatogr. 1983, 267, 49–65.(24) Persat, A.; Suss, M. E.; Santiago, J. G. Lab Chip 2009,
9, 2454–2469.(25) Bahga, S. S.; Bercovici, M.; Santiago, J. G. Electrophoresis 2010,
31, 910–919.(26) Porras, S. P.; Riekkola, M.; Kenndler, E. Electrophoreis 2003,
24, 1485–1498.
(27) Chambers, R. D.; Santiago, J. G. Anal. Chem. 2009, 81,3022–3028.
(28) Bercovici, M.; Lele, S. K.; Santiago, J. G. J. Chromatogr., A 2009,1216, 1008–1018.
(29) Bercovici, M.; Lele, S. K.; Santiago, J. G. J. Chromatogr., A 2010,1217, 588–599.
(30) Xu, Z. Q.; Nishine, T.; Arai, A.; Hirokawa, T. Electrophoresis2004, 25, 3875–3881.
(31) Stellwagen, N. C.; Stellwagen, E. J. Chromatogr., A 2009,1216, 1917–1929.
(32) Singer, V. L.; Lawlor, T. E.; Yue, S. Mutat. Res. 1999, 439,37–47.
(33) Dolink, V.; Deml, M.; Bocek, P. J. Chromatogr. 1985, 320,89–97.
(34) Bahga, S. S.; Kaigala, G. V.; Bercovici, M.; Santiago, J. G.Electrophoresis 2011, 32, 563–572.
(35) New England Biolabs. http://www.neb.com/nebecomm/products/productn3232.asp.