This article was downloaded by: [Lakehead University] On: 14 March 2013, At: 09:31 Publisher: Taylor & Francis Informa Ltd Registered in England and Wales Registered Number: 1072954 Registered office: Mortimer House, 37-41 Mortimer Street, London W1T 3JH, UK International Journal of Digital Earth Publication details, including instructions for authors and subscription information: http://www.tandfonline.com/loi/tjde20 Coupling the 4M crop model with national geo-databases for assessing the effects of climate change on agro- ecological characteristics of Hungary Nándor Fodor a , László Pásztor a & Tamás Németh b a Institute for Soil Science and Agricultural Chemistry, Centre for Agricultural Research, Hungarian Academy of Sciences, Budapest, Hungary b Hungarian Academy of Sciences, Budapest, Hungary Accepted author version posted online: 09 May 2012.Version of record first published: 30 May 2012. To cite this article: Nándor Fodor , László Pásztor & Tamás Németh (2012): Coupling the 4M crop model with national geo-databases for assessing the effects of climate change on agro-ecological characteristics of Hungary, International Journal of Digital Earth, DOI:10.1080/17538947.2012.689998 To link to this article: http://dx.doi.org/10.1080/17538947.2012.689998 PLEASE SCROLL DOWN FOR ARTICLE Full terms and conditions of use: http://www.tandfonline.com/page/terms-and- conditions This article may be used for research, teaching, and private study purposes. Any substantial or systematic reproduction, redistribution, reselling, loan, sub-licensing, systematic supply, or distribution in any form to anyone is expressly forbidden. The publisher does not give any warranty express or implied or make any representation that the contents will be complete or accurate or up to date. The accuracy of any instructions, formulae, and drug doses should be independently verified with primary sources. The publisher shall not be liable for any loss, actions, claims, proceedings, demand, or costs or damages whatsoever or howsoever caused arising directly or indirectly in connection with or arising out of the use of this material.
Transcript
This article was downloaded by: [Lakehead University]On: 14 March 2013, At: 09:31Publisher: Taylor & FrancisInforma Ltd Registered in England and Wales Registered Number: 1072954 Registeredoffice: Mortimer House, 37-41 Mortimer Street, London W1T 3JH, UK
International Journal of Digital EarthPublication details, including instructions for authors andsubscription information:http://www.tandfonline.com/loi/tjde20
Coupling the 4M crop model withnational geo-databases for assessingthe effects of climate change on agro-ecological characteristics of HungaryNándor Fodor a , László Pásztor a & Tamás Németh ba Institute for Soil Science and Agricultural Chemistry, Centre forAgricultural Research, Hungarian Academy of Sciences, Budapest,Hungaryb Hungarian Academy of Sciences, Budapest, HungaryAccepted author version posted online: 09 May 2012.Version ofrecord first published: 30 May 2012.
To cite this article: Nándor Fodor , László Pásztor & Tamás Németh (2012): Coupling the4M crop model with national geo-databases for assessing the effects of climate changeon agro-ecological characteristics of Hungary, International Journal of Digital Earth,DOI:10.1080/17538947.2012.689998
To link to this article: http://dx.doi.org/10.1080/17538947.2012.689998
PLEASE SCROLL DOWN FOR ARTICLE
Full terms and conditions of use: http://www.tandfonline.com/page/terms-and-conditions
This article may be used for research, teaching, and private study purposes. Anysubstantial or systematic reproduction, redistribution, reselling, loan, sub-licensing,systematic supply, or distribution in any form to anyone is expressly forbidden.
The publisher does not give any warranty express or implied or make any representationthat the contents will be complete or accurate or up to date. The accuracy of anyinstructions, formulae, and drug doses should be independently verified with primarysources. The publisher shall not be liable for any loss, actions, claims, proceedings,demand, or costs or damages whatsoever or howsoever caused arising directly orindirectly in connection with or arising out of the use of this material.
Coupling the 4M crop model with national geo-databases forassessing the effects of climate change on agro-ecological
characteristics of Hungary
Nandor Fodora, Laszlo Pasztora* and Tamas Nemethb
aInstitute for Soil Science and Agricultural Chemistry, Centre for Agricultural Research,Hungarian Academy of Sciences, Budapest, Hungary; bHungarian Academy of Sciences,
Budapest, Hungary
(Received 12 December 2011; final version received 27 April 2012)
The 4M crop model was used to investigate the prospective effects of climatechange on the agro-ecological characteristics of Hungary. The model was coupledwith a detailed meteorological database and spatial soil information systemscovering the whole territory of Hungary. Plant-specific model parameters weredetermined by inverse modeling. Future meteorological data were produced fromthe present meteorological data by combining a climate change scenario and astochastic weather generator. Using the available and the generated data, thepresent and the prospective agro-ecological characteristics of Hungary weredetermined. According to the simulation results, average yields will decreaseconsiderably (�30%) due to climate change. The rate of nitrate leaching willprospectively decrease as well. The fluctuations of both the yields and the annualnitrate leaching rates will most likely increase approaching the end of the twenty-first century. On the basis of the simulation results, the role of autumn crops islikely to become more significant in Hungary. The achieved results can begeneralized for more extended regions based on the concept of spatial(geographical) analogy.
Keywords: agro-ecological features; crop modeling; climate change effects; spatialsoil information systems
Introduction
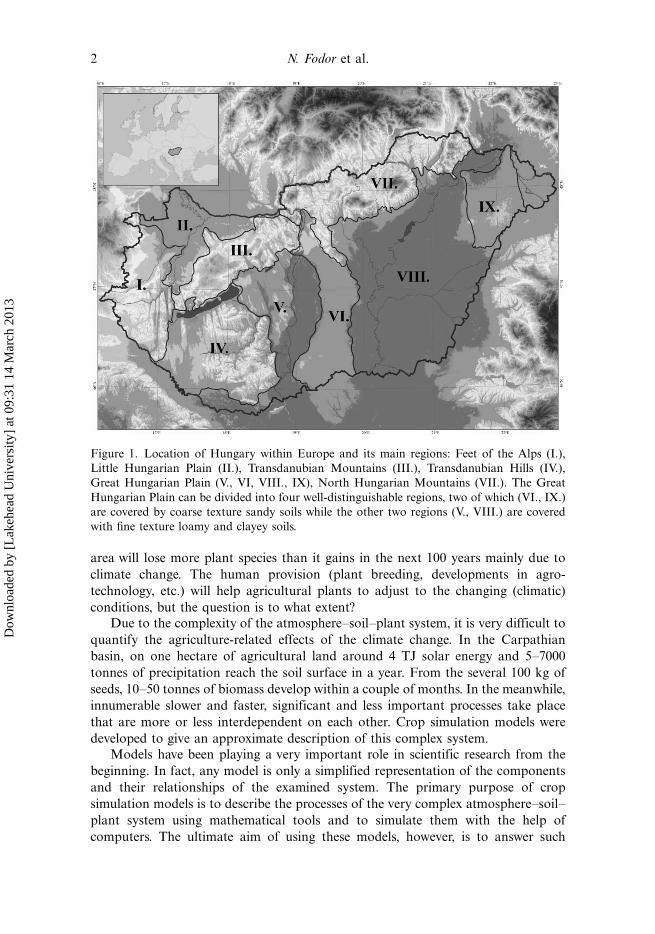
The Carpathian basin is an important area of crop production in Europe. Around
107 tonnes of yields of different crops are produced here for eight countries, not
counting the exports. The majority of the agricultural land in the basin is located in
Hungary (Figure 1). Regarding its plant production, Hungary ranks among the best
in the world concerning the average yields of her main crops. One of the most
important questions that Hungarian agriculture faces is whether this performance
can be maintained in the future. Will the present agricultural practice be sustainable
in the future or do we need new, profitable alternatives for sustainable agriculture in
Hungary?
More and more observations prove that the Middle-European climate is
changing faster than in any other period since the end of the Pleistocene epoch. A
recent report of the European Environment Agency (EEA 2007) predicts that this
area will lose more plant species than it gains in the next 100 years mainly due to
climate change. The human provision (plant breeding, developments in agro-
technology, etc.) will help agricultural plants to adjust to the changing (climatic)
conditions, but the question is to what extent?Due to the complexity of the atmosphere�soil�plant system, it is very difficult to
quantify the agriculture-related effects of the climate change. In the Carpathian
basin, on one hectare of agricultural land around 4 TJ solar energy and 5�7000
tonnes of precipitation reach the soil surface in a year. From the several 100 kg of
seeds, 10�50 tonnes of biomass develop within a couple of months. In the meanwhile,
innumerable slower and faster, significant and less important processes take place
that are more or less interdependent on each other. Crop simulation models were
developed to give an approximate description of this complex system.
Models have been playing a very important role in scientific research from the
beginning. In fact, any model is only a simplified representation of the components
and their relationships of the examined system. The primary purpose of crop
simulation models is to describe the processes of the very complex atmosphere�soil�plant system using mathematical tools and to simulate them with the help of
computers. The ultimate aim of using these models, however, is to answer such
Figure 1. Location of Hungary within Europe and its main regions: Feet of the Alps (I.),
Little Hungarian Plain (II.), Transdanubian Mountains (III.), Transdanubian Hills (IV.),
Great Hungarian Plain (V., VI, VIII., IX), North Hungarian Mountains (VII.). The Great
Hungarian Plain can be divided into four well-distinguishable regions, two of which (VI., IX.)
are covered by coarse texture sandy soils while the other two regions (V., VIII.) are covered
with fine texture loamy and clayey soils.
2 N. Fodor et al.
Dow
nloa
ded
by [
Lak
ehea
d U
nive
rsity
] at
09:
31 1
4 M
arch
201
3
production and environment-related questions that otherwise could only be
answered by carrying out expensive and time-consuming experiments. The main
advantage of simulation models is that they are capable of exactly describing the
processes within, and interactions between complex systems. Theoretically, systemmodels are the only scientific tools with which we can look into the future and assess
the prospective effects of climate change (Rosenzweig and Parry 1994, Dhakhwa and
Campbell 1998, Tubiello et al. 2000, Rosenzweig et al. 2002, Fodor 2006).
Practically, every model includes some kind of approximation, assumption, or
simplification introducing some extent of error in the model calculations. Obviously,
the main goal of model developers is to decrease this type of error. However, there is
another error source. The main hindrance of improving and using crops simulation
models is the lack of good quality measured input data that is required for operatingand testing these models. Missing data could be provided by estimation procedures
(Vereecken et al. 2010, Fodor and Mika 2011) or from databases (Gijsman et al.
2007, Horvath et al. 2007).
Despite the fact that many aspects of the potential effects of climate change in
Hungary have already been investigated by researchers (Ladanyi and Hufnagel 2006,
Sipkay et al. 2008, Ladanyi and Horvath 2010), very few studies have been carried
out investigating the possible effects from an agro-ecological point of view (Harnos
2000, Boksai and Erdelyi 2009, Dios et al. 2009). These studies either focused on thechanges in phenology and biomass production of some selected crops/species only, or
used simplified soil databases and/or obsolete climate change scenarios. The main
objective of the present study is to enlarge the scope of the previous studies
by exploring and estimating the prospective effects of climate change on the
agro-ecological characteristics of Hungary in more detail, more accurately by
coupling the 4M crop simulation model with national geodatabases.
Materials and methods
Hungary is situated in the deepest part of the hydrogeologically closed Carpathian
basin, where the majority of the parent material is of relatively young geological
formation. The climate includes Atlantic, Continental, and Mediterranean elements.
The water balance of the Great Hungarian Plain is negative (the deficit being
mitigated by surface runoff, seepage, or groundwater flow from the more humid
mountainous regions). Horizontal and vertical drainage conditions are poor;
consequently the accumulation processes prevail in soil formation. Human activities(such as deforestation, grazing, water regulation, intensive farming, and urbaniza-
tion) have had both significant effects on the soil formation and soil-degradation
processes. Hungarian soil cover is highly heterogeneous.
Land, including soil, water, and near-surface atmosphere continuum, with its
geology, relief, and biota, represents the most important part of Hungary’s natural
resources. The natural conditions (climate, water, soil, and biological resources) of
the Carpathian basin (particularly in the lowlands and plains) are generally favorable
for rain-fed biomass production. However, these conditions show high spatial andtemporal variability; they are often extreme and sensitive to various natural or
human-induced stresses.
Water resources are limited in Hungary. Spatio-temporal distribution of
precipitation is highly irregular and more and more frequently produce extremities.
International Journal of Digital Earth 3
Dow
nloa
ded
by [
Lak
ehea
d U
nive
rsity
] at
09:
31 1
4 M
arch
201
3
Most surface waters rise from beyond the national borders, whilst a considerable part
of the limited amount of sub-surface waters is of poor quality (exhibiting high
salinity and/or sodicity).
The arable lands (5.77 million hectares) in the country cover 62.5% of the totalarea. The average area of the farms is very low (8.6 ha). More than 90% of the private
farms are smaller than 10 ha. Only 1% of the farms are over 100 ha. Fifty percent of
the arable land is used for growing cereals (maize, winter wheat, and spring barley).
Another 20% is used for growing industrial crops (sunflower and rape). Fertilizer
consumption in Hungary is under the European average. The annual N balance of
the country is around 20 kg ha�1 compared to the �100 kg ha�1 average of the
Western European countries. The role of irrigation is insignificant in Hungary.
Meteorological data
A database of the Hungarian Meteorological Service for the 2002�2006 period was
used in the study: including daily maximum temperature, daily minimum tempera-
ture, and daily precipitation, covering the area of Hungary with an one-sixth degree
resolution grid. The Meteorological Interpolation based on Surface Homogenized
Data Basis (MISH) interpolation technique (Szentimrey et al. 2011) was used for
producing the grid of meteorological data from the local observations. The country iscovered by 466 rectangles considered meteorologically homogenous. Despite of its
shortness, the 2002�2006 period is representative for Hungary regarding the average
annual precipitation sum and the mean temperature. Within this five-year period
there is an average year, two years that are slightly under and above the average and
two years that are considerably under and above the average regarding both the
above-mentioned meteorological parameters. The average precipitation sum in the
vegetation period is the one climatic factor that affects the final yield in Hungary the
most. The spatial distribution of this parameter is presented in Figure 2.Using the MV-WG stochastic weather generator (Fodor et al. 2010), a 31-year-
long (1985�2015) artificial weather data series were produced for every meteorolo-
gical grid cell based on their measured data series (2002�2006). The data generation
procedure of MV-WG guarantees that there are no significant differences (B5%)
between the synthetic and the observed data with regard to the most relevant climatic
characteristics (annual precipitation amount, average temperature, etc.).
A climate scenario was constructed based on the outputs of the ARPEGE-
CLIMATE global circulation model (Deque et al. 1998), which was thendynamically downscaled for Hungary with the ALADIN-Climate V4.5 regional
climate model (RCM) (Bubnova et al. 1995, Wang et al. 2011). The IPCC SRES A1B
scenario (Nakicenovic and Swart 2000) was used in the ALADIN simulations. The
10 km horizontal resolution outputs of the RCM (daily maximum/minimum
temperature and precipitation data for the 1951�2100 period) were validated using
the interpolated gridded data-set (0.1 deg regular grid) of observed data over
Hungary for the 1961�1990 reference period (CECILIA 2009). The average
prospective changes of the monthly climatic variables were estimated by comparingthe 1961�1990 and 2071�2100 periods of the climate model outputs (Table 3). The
parameterization of the MV-WG weather generator was altered according to these
changes for every meteorological grid cell and two different 31-year-long (2085�2115) data series were generated for the future. The first parameterization was based
4 N. Fodor et al.
Dow
nloa
ded
by [
Lak
ehea
d U
nive
rsity
] at
09:
31 1
4 M
arch
201
3
solely on the climate model outputs, while in the second one the predicted increase of
the possibility of extreme weather events (Mika and Lakatos 2008) was also taken
into account.Based on the available generated temperature and precipitation data, the daily
global solar radiation values were estimated using the S-shape method (Fodor and
Mika 2011).The atmospheric CO2 concentration raised from 350 to 400 and from
660 to 760 ppm in the 1985�2015 and the 2085�2115 series, respectively. Figure 3
summarizes the most important climatic characteristics of the weather data used in
the study. The presented graphs provide an overview of the prospective changes of
climatic conditions (elevated temperature and considerably less precipitation during
the summer) as well as the increased possibility of extreme weather events (lower/higher minimum/maximum temperatures, higher one day precipitation rates and
longer dry periods).
Soil- and land-use data
The majority of the soil properties are much less variable in time than the climatic
characteristics. This is especially valid for the set of the soil parameters used in crop
simulation models. Consequently, these can be represented by static data in modeling
and there is no need for new data collection, input requirements can be fulfilled byavailable datasets.
An impressive amount of soil information is available in Hungary as a result of
long-term observations, various soil surveys, analyses, and mapping activities
(Varallyay 2002). The collected data are accessible in different scales: national,
Figure 2. Spatial distribution of the cumulative precipitation in the vegetative period in
Hungary, 2002�2006.
International Journal of Digital Earth 5
Dow
nloa
ded
by [
Lak
ehea
d U
nive
rsity
] at
09:
31 1
4 M
arch
201
3
regional, micro-regional, farm, and field level. Generally, these are related to maps
and serve different needs for spatial and/or thematic aspects. Since spatial and
semantic resolution can (and usually does) significantly differ, better results could be
achieved by the integrated usage of various datasets (Szabo 2002).
Since the late 1980s, a gradually increasing part of these soil-related data has been
digitally processed and organized into various spatial soil information systems
(SSIS). The first national SSIS was the so-called AGROTOPO, which is practically
the GIS adaptation of the ‘Assessment of the agro-ecological potential of Hungary’
program output in the form of 1:100,000 scale maps (Varallyay et al. 1979).
AGROTOPO provides a suitable data source on the national�regional level for
various applications. The Hungarian Soil Information and Monitoring System
(SIMS) thematically covers a very wide range of soil characteristics providing a
unique opportunity for detailed monitoring of the state of Hungarian soils and
follow up of major trends in their conditions. Unfortunately, the 1200 SIMS
Figure 3. Climatic characteristics of weather data used in the study: (A) Minima of the daily
minimum temperatures, (B) monthly mean temperatures, (C) maxima of the daily maximum
temperature, (D) average monthly precipitation sums, (E) maxima of the daily precipitations,
(F) longest dry spells.
6 N. Fodor et al.
Dow
nloa
ded
by [
Lak
ehea
d U
nive
rsity
] at
09:
31 1
4 M
arch
201
3
observation locations were not selected to be spatially representative. The sampling
was not designed for spatial inference of spatial information collected at SIMS
points. As a consequence, SIMS provides vast and suitable information on actual soil
conditions while the spatial features of this information are rather unsatisfactory. In
order to provide reliable spatial inventories on the state of national soil resources,
SIMS-based information need to be regionalized by adequate spatial inference of the
collected data. This can be supported by spatially more detailed auxiliary soil
information. This process requires the existence of an adequate national spatial soil
information system with appropriate data structure and spatial resolution, as well as
a proper methodology for the integration of the different type of datasets. The
Digital Kreybig Soil Information System (DKSIS; Pasztor et al. 2010) represents a
suitable candidate being the most detailed spatial data-set covering the whole
country.
In order to combine the advantages of the two datasets, they were integrated in a
specific way, elaborated by Pasztor et al. (2011). As a result, the quantitative
parameters of SIMS could be regionalized for the area of the whole country with
increased spatial resolution and accuracy, providing a more complex and realistic
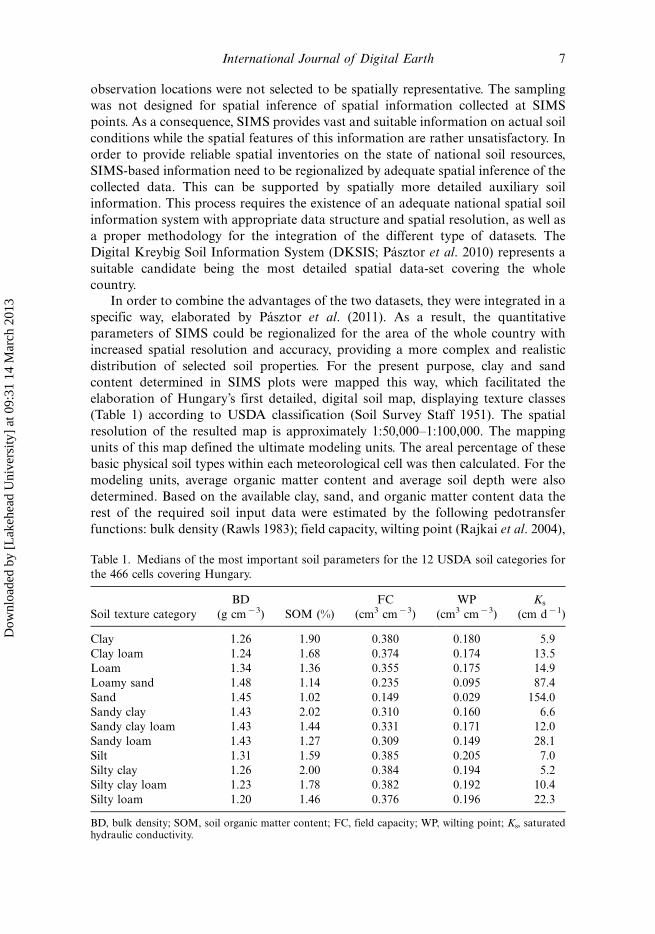
distribution of selected soil properties. For the present purpose, clay and sand
content determined in SIMS plots were mapped this way, which facilitated the
elaboration of Hungary’s first detailed, digital soil map, displaying texture classes
(Table 1) according to USDA classification (Soil Survey Staff 1951). The spatial
resolution of the resulted map is approximately 1:50,000�1:100,000. The mapping
units of this map defined the ultimate modeling units. The areal percentage of these
basic physical soil types within each meteorological cell was then calculated. For the
modeling units, average organic matter content and average soil depth were also
determined. Based on the available clay, sand, and organic matter content data the
rest of the required soil input data were estimated by the following pedotransfer
functions: bulk density (Rawls 1983); field capacity, wilting point (Rajkai et al. 2004),
Table 1. Medians of the most important soil parameters for the 12 USDA soil categories for
and saturated hydraulic conductivity (Campbell 1985). Land-use information has
also been available in various scales and details for Hungary. In the recent study
the National Land Cover Database (CLC50; Buttner et al. 2004) was used for the
calculation of agricultural areas within the meteorological cells used for thesimulation. The standard CORINE Land Cover (CLC) database (scale 1:100,000)
covers most of the EU Member States and is used to support policy-making at the
pan-European level while national applications represent more detailed databases on
land cover. In CLC50, the standard (level 3) CLC nomenclature was enhanced to
include nearly 80 (levels 4 and 5) sub-classes. The 4 ha area minimum mapping unit
provides enhanced geometric details. We exploited this latter feature. In each cell,
only those areas were included in the model simulations that lie within the borders of
Hungary and are involved in agricultural production.
Plant data
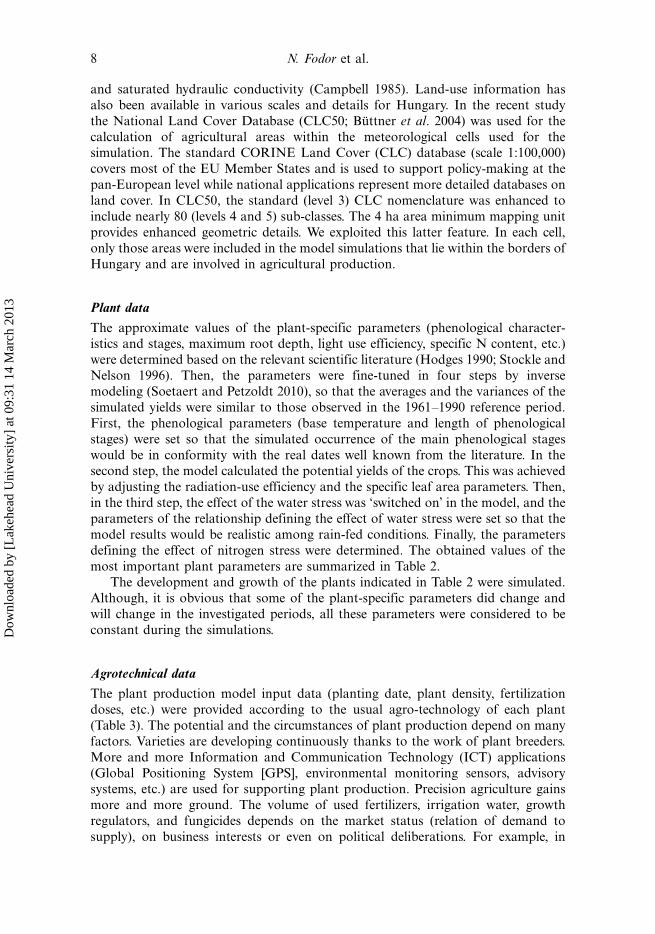
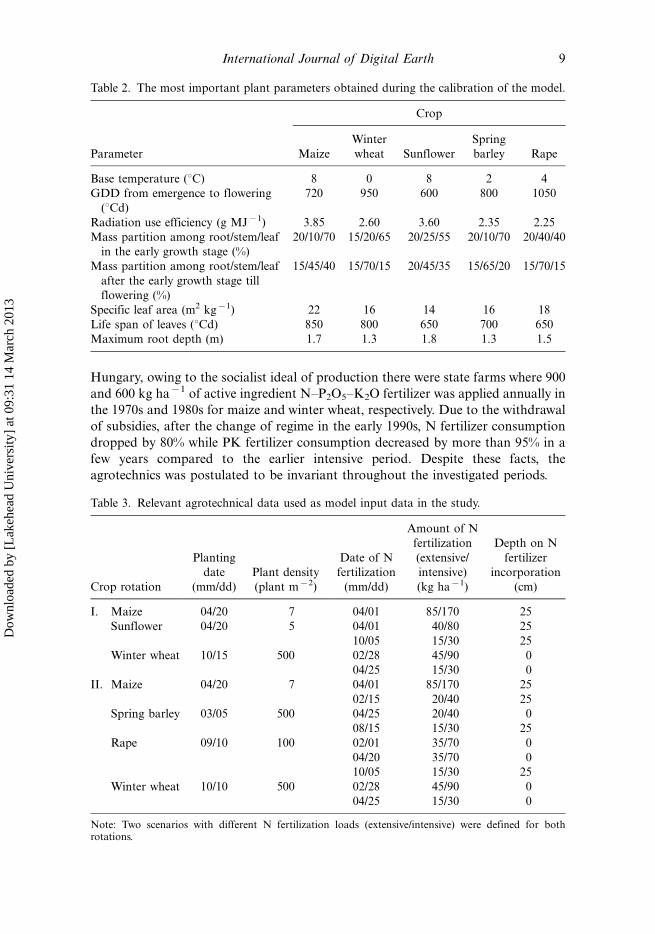
The approximate values of the plant-specific parameters (phenological character-istics and stages, maximum root depth, light use efficiency, specific N content, etc.)
were determined based on the relevant scientific literature (Hodges 1990; Stockle and
Nelson 1996). Then, the parameters were fine-tuned in four steps by inverse
modeling (Soetaert and Petzoldt 2010), so that the averages and the variances of the
simulated yields were similar to those observed in the 1961�1990 reference period.
First, the phenological parameters (base temperature and length of phenological
stages) were set so that the simulated occurrence of the main phenological stages
would be in conformity with the real dates well known from the literature. In thesecond step, the model calculated the potential yields of the crops. This was achieved
by adjusting the radiation-use efficiency and the specific leaf area parameters. Then,
in the third step, the effect of the water stress was ‘switched on’ in the model, and the
parameters of the relationship defining the effect of water stress were set so that the
model results would be realistic among rain-fed conditions. Finally, the parameters
defining the effect of nitrogen stress were determined. The obtained values of the
most important plant parameters are summarized in Table 2.
The development and growth of the plants indicated in Table 2 were simulated.Although, it is obvious that some of the plant-specific parameters did change and
will change in the investigated periods, all these parameters were considered to be
constant during the simulations.
Agrotechnical data
The plant production model input data (planting date, plant density, fertilization
doses, etc.) were provided according to the usual agro-technology of each plant
(Table 3). The potential and the circumstances of plant production depend on many
factors. Varieties are developing continuously thanks to the work of plant breeders.
More and more Information and Communication Technology (ICT) applications
(Global Positioning System [GPS], environmental monitoring sensors, advisorysystems, etc.) are used for supporting plant production. Precision agriculture gains
more and more ground. The volume of used fertilizers, irrigation water, growth
regulators, and fungicides depends on the market status (relation of demand to
supply), on business interests or even on political deliberations. For example, in
8 N. Fodor et al.
Dow
nloa
ded
by [
Lak
ehea
d U
nive
rsity
] at
09:
31 1
4 M
arch
201
3
Hungary, owing to the socialist ideal of production there were state farms where 900
and 600 kg ha�1 of active ingredient N�P2O5�K2O fertilizer was applied annually in
the 1970s and 1980s for maize and winter wheat, respectively. Due to the withdrawal
of subsidies, after the change of regime in the early 1990s, N fertilizer consumption
dropped by 80% while PK fertilizer consumption decreased by more than 95% in a
few years compared to the earlier intensive period. Despite these facts, the
agrotechnics was postulated to be invariant throughout the investigated periods.
Table 2. The most important plant parameters obtained during the calibration of the model.
Crop
Parameter Maize
Winter
wheat Sunflower
Spring
barley Rape
Base temperature (8C) 8 0 8 2 4
GDD from emergence to flowering
(8Cd)
720 950 600 800 1050
Radiation use efficiency (g MJ�1) 3.85 2.60 3.60 2.35 2.25
Mass partition among root/stem/leaf
in the early growth stage (%)
20/10/70 15/20/65 20/25/55 20/10/70 20/40/40
Mass partition among root/stem/leaf
after the early growth stage till
flowering (%)
15/45/40 15/70/15 20/45/35 15/65/20 15/70/15
Specific leaf area (m2 kg�1) 22 16 14 16 18
Life span of leaves (8Cd) 850 800 650 700 650
Maximum root depth (m) 1.7 1.3 1.8 1.3 1.5
Table 3. Relevant agrotechnical data used as model input data in the study.
Crop rotation
Planting
date
(mm/dd)
Plant density
(plant m�2)
Date of N
fertilization
(mm/dd)
Amount of N
fertilization
(extensive/
intensive)
(kg ha�1)
Depth on N
fertilizer
incorporation
(cm)
I. Maize 04/20 7 04/01 85/170 25
Sunflower 04/20 5 04/01 40/80 25
10/05 15/30 25
Winter wheat 10/15 500 02/28 45/90 0
04/25 15/30 0
II. Maize 04/20 7 04/01 85/170 25
02/15 20/40 25
Spring barley 03/05 500 04/25 20/40 0
08/15 15/30 25
Rape 09/10 100 02/01 35/70 0
04/20 35/70 0
10/05 15/30 25
Winter wheat 10/10 500 02/28 45/90 0
04/25 15/30 0
Note: Two scenarios with different N fertilization loads (extensive/intensive) were defined for bothrotations.
International Journal of Digital Earth 9
Dow
nloa
ded
by [
Lak
ehea
d U
nive
rsity
] at
09:
31 1
4 M
arch
201
3
Crop simulation model
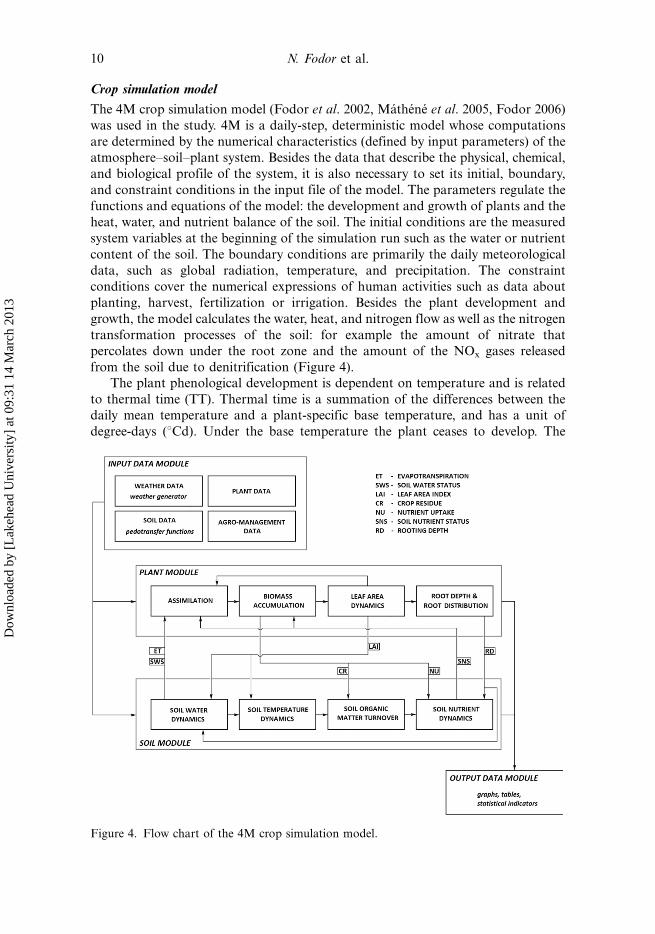
The 4M crop simulation model (Fodor et al. 2002, Mathene et al. 2005, Fodor 2006)
was used in the study. 4M is a daily-step, deterministic model whose computations
are determined by the numerical characteristics (defined by input parameters) of the
atmosphere�soil�plant system. Besides the data that describe the physical, chemical,
and biological profile of the system, it is also necessary to set its initial, boundary,
and constraint conditions in the input file of the model. The parameters regulate the
functions and equations of the model: the development and growth of plants and the
heat, water, and nutrient balance of the soil. The initial conditions are the measured
system variables at the beginning of the simulation run such as the water or nutrient
content of the soil. The boundary conditions are primarily the daily meteorological
data, such as global radiation, temperature, and precipitation. The constraint
conditions cover the numerical expressions of human activities such as data about
planting, harvest, fertilization or irrigation. Besides the plant development and
growth, the model calculates the water, heat, and nitrogen flow as well as the nitrogen
transformation processes of the soil: for example the amount of nitrate that
percolates down under the root zone and the amount of the NOx gases released
from the soil due to denitrification (Figure 4).
The plant phenological development is dependent on temperature and is related
to thermal time (TT). Thermal time is a summation of the differences between the
daily mean temperature and a plant-specific base temperature, and has a unit of
degree-days (8Cd). Under the base temperature the plant ceases to develop. The
Figure 4. Flow chart of the 4M crop simulation model.
10 N. Fodor et al.
Dow
nloa
ded
by [
Lak
ehea
d U
nive
rsity
] at
09:
31 1
4 M
arch
201
3
length of the phenological stages (in degree day) should be provided by the user.
Daily assimilation is calculated by a light-to-biomass conversion equation (Equation
1). Its key parameter is the radiation use efficiency (RUE). The daily assimilation rate
(M) depends on the global radiation (R), the leaf area index (LAI), the plant density(D), the minima of the heat (ST), water (SW), and nitrogen (SN) stress-factors and a
function of CO2 concentration in the air.
M ¼ RUE � R � 1 � e�0:55�LAIð ÞD
� min ST; SW; SNð Þ � f CO2ð Þ (1)
After calculating its mass, the generated matter is divided into the major parts (root,
stem, leaf, yield) of the plant. The ratios of the partitioning (Table 2) change with thephenological stages. In the early development period, the majority of the matter is
allocated to the leaves. For the simulated plants, in the last stage almost 100% of the
matter is moved to the grains (The exception is the sunflower as its head stores lots of
matter.). The matter allocated to the leaves is converted to area by multiplying the
mass with the specific leaf area. The age of every leaf area portion that is added to
the total area in a day is kept on record. If the age of a portion exceeds the value of
the ‘life span of leaves’ parameter it ‘dies’ ceasing to take part in the photosynthesis.
Root expansion (RE) is dependent on the daily thermal time (TTd) and the minimaof the water (SW) and nitrogen (SN) stress factors (Equation 2). The value of a
parameter may change during plant development.
RE ¼ a � TTd � min SW; SNð Þ (2)
The shape of the root distribution function is defined by the user.
The water balance module calculates the following elements: runoff, evaporation,
transpiration, and the volume of water percolating both downward and upward. It
models the soil layers as a series of water reservoirs characterized by four parameters:
maximum water-storing capacity (Umax), field capacity or drained upper limit (Ufc),
water content at wilting point or lower limit (Uwp), and saturated hydraulic
conductivity (KS). If the incoming water fills up the layer (U�Umax) the excess
water is redistributed in the layers above. If the water content is above the fieldcapacity (Umax] U� Ufc) a definite portion of water flows (Q) to the layer below
(Equation 3).
Q ¼ DC � H � Hfcð Þ � Dz (3)
DC is the drain constant, which is derived from KS, and Dz is the thickness of the soil
layer. If the water content is less than the field capacity (Ufc]U�Uwp) no
downward flow occurs, however the water content of the layer can decrease due to
plant uptake. If the water content is below Uwp the plant water uptake ceases.
When calculating the actual soil temperature (Tsoil) at a given depth (x), this
model takes into account that the upper soil layers absorb energy and the heat needs
time to reach the lower layers. The effect of the energy reaching the soil surfaceappears delayed and decreased in the lower soil layers. The extent of the delay and
the decrease is a function of the actual average moisture content (Uavg) and the
average bulk density of the topsoil (BDavg). The model assumes a sinusoidal annual
course of the soil surface temperature that is modified by an additive term of a 5-day
moving average of a factor (FD5), which is a function of the albedo of the surface, the
International Journal of Digital Earth 11
Dow
nloa
ded
by [
Lak
ehea
d U
nive
rsity
] at
09:
31 1
4 M
arch
201
3
daily mean, and maximum temperature as well as the daily global radiation
(Equation 4).
Tisoil xð Þ ¼ Tavg þ
Tamp � cos 0:0174 � ði � IÞ þ x � f Havg;BDavg
� �� �
2þ FD5
0@
1A
� ex�f Havg;BDavgð Þ (4)
where Tavg and Tamp denote the average temperature and the average temperature
difference of the site, i denotes the day of the year, I equals 200 on the Northern
hemisphere, while it is 20 on the Southern hemisphere.
The soil organic matter (SOM) sub-model is based on the work of Parton et al.
(1987). The sub-model includes three SOM pools (active, slow, and passive) with
different potential decomposition rates, above and belowground crop residue pools
and a surface microbial pool, which is associated with decomposing surface residue.The decomposition of both plant residues and SOM is assumed to be microbially
mediated with an associated loss of CO2 due to microbial respiration. Each pool is
characterized by different maximum decomposition rates, which are reduced by
multiplicative functions of soil moisture and soil temperature. The decomposition
rate of the active SOM pool (turnover time: months to a few years) is influenced by
the soil texture (lower rates for clayey soils), as well.
The nutrient sub-model uses simple equations to represent N inputs and outputs
attributed to atmospheric deposition, fertilization, mineralization, nitrification,immobilization, denitrification, plant uptake, and nitrate leaching. Atmospheric N
input is a linear function of precipitation. The model includes N inputs through
inorganic and organic fertilizer additions. The rate of mineralization is function of
the soil humus content as well as of the water content and temperature. The soil
water content and temperature also influence the nitrification and the denitrification
rates, which are functions of the soil NH4 and NO3 contents, respectively. The
potential rate of plant N uptake depends on the volume of roots present in the soil
and is reduced by a multiplicative function of soil moisture. The actual uptakedepends on the plant N demand, which is a function of the daily matter production
and the specific N content of the plant. The latter changes during the phenological
development of the plant. The amount of nitrate leaching is proportional to the soil
NO3 concentration and the volume of drainage water.
Verification of the model
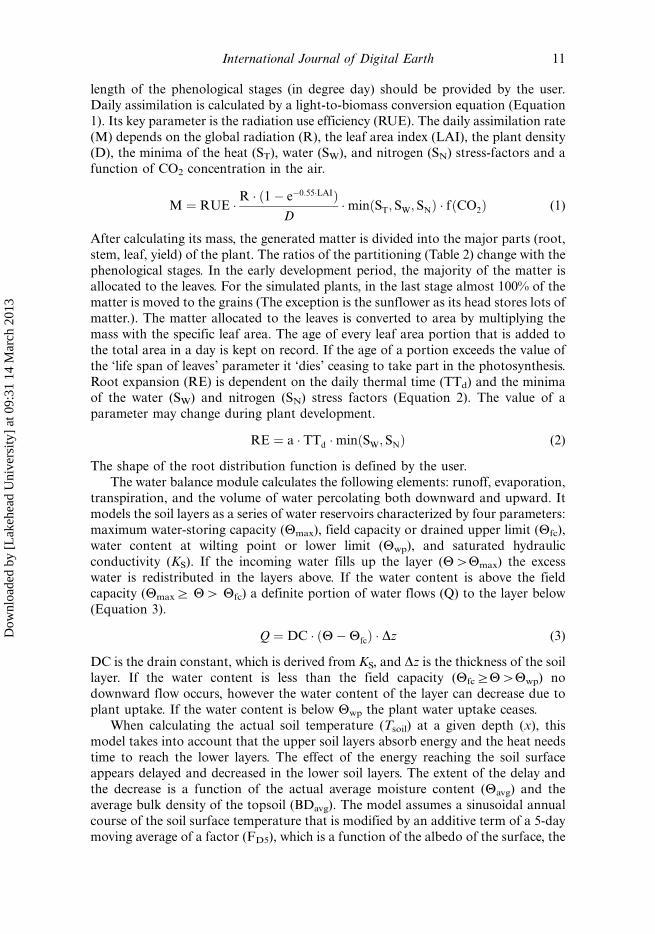
The actual fertilization levels as well as the observed yield levels for maize, wheat,
sunflower, barley, and rape were collected from the yearbooks of the Hungarian
Central Statistical Office for the 2002�2006 period for the 19 counties of Hungary
(Figure 5). The available (weather, soil, plant, etc.) data were given to the model as
inputs. For each cell, five-year-long monocultures were simulated with theinvestigated crops. The calculated yields were standardized as these were converted
into cereal units (CU) by multiplying the actual yields with 1 for maize, wheat, and
barley, with 1.3 for sunflower and with 1.8 for rape. County averages were calculated
by averaging the CU yields of the five crops for the five years over the modeling units
pertaining to the counties.
12 N. Fodor et al.
Dow
nloa
ded
by [
Lak
ehea
d U
nive
rsity
] at
09:
31 1
4 M
arch
201
3
Numerical experiments
The weather, soil, and plant data described previously were provided as inputs for the
4M model. The model was run for every meteorological cell for every existing USDA
soil texture category within the cell for both crop rotations and fertilization levels.
This resulted in 1652�2�2�6608 runs as there are 1652 existing combinations of
the 466 meteorological cells and 12 soil categories. Normally, only three or four
categories are represented in a meteorological cell. These simulations were carried
out with the present (1985�2015) and the two types of future (2085�2115) weather
data series. Simulation results were then summarized for each cell using territorial
occurrence percentage of the soil categories present in the given cell as weights. The
following model outputs were investigated:
� Average cumulative precipitation in the growing season, mm.
� Average denitrification rate, kg ha�1 y�1.
� Average nitrate leaching rate, kg ha�1 y�1.� Average cumulative evapotranspiration in the growing season, mm.
� Average biomass, tha�1 and t per cell.
� Average yield, t ha�1 and t per cell (in cereal unit: yields of the sunflower and
the rape were multiplied with 1.3 and 1.8, respectively).
� Cumulative water stress.
� Cumulative nitrogen stress.
� Cumulative heat stress.
Figure 5. Observed and calculated county average yields in cereal unit for the 2002�2006
period in Hungary.
International Journal of Digital Earth 13
Dow
nloa
ded
by [
Lak
ehea
d U
nive
rsity
] at
09:
31 1
4 M
arch
201
3
Water stress factor (WSF): As the soil dries out the plant water uptake and the
transpiration become limited. WSF is the ratio of the actual and the potential daily
transpiration. Its value is between 0 and 1. It is used as a multiplicative factor when
calculating mass production. Since the WSF works with a logic opposite tothe common sense (it is small/great when the stress is great/small) in the output
file the 1-WSF value is cumulated and defined as cumulative water stress.
Nitrogen stress factor (NSF): The ratio of the actual plant N uptake and the
plant N demand. It works similarly to WSF.
Heat stress factor (HSF): There is a range for every plant (depending on
the species) when the temperature does not limit the development and growth. As the
temperature decreases/increases below/above the lower/upper limit of this range, the
plant senses more and more heat stress as the HSF tends to zero. HSF workssimilarly to the other two stress factors.
Every day, only one of the stress factors (with the lowest value) affects mass
production. If the WSF/NSF/HSF are 0.25/0.35/0.55 on a given day the actual mass
production is only one quarter of the potential and only the ‘cumulative water stress’
variable is increased with 0.75.
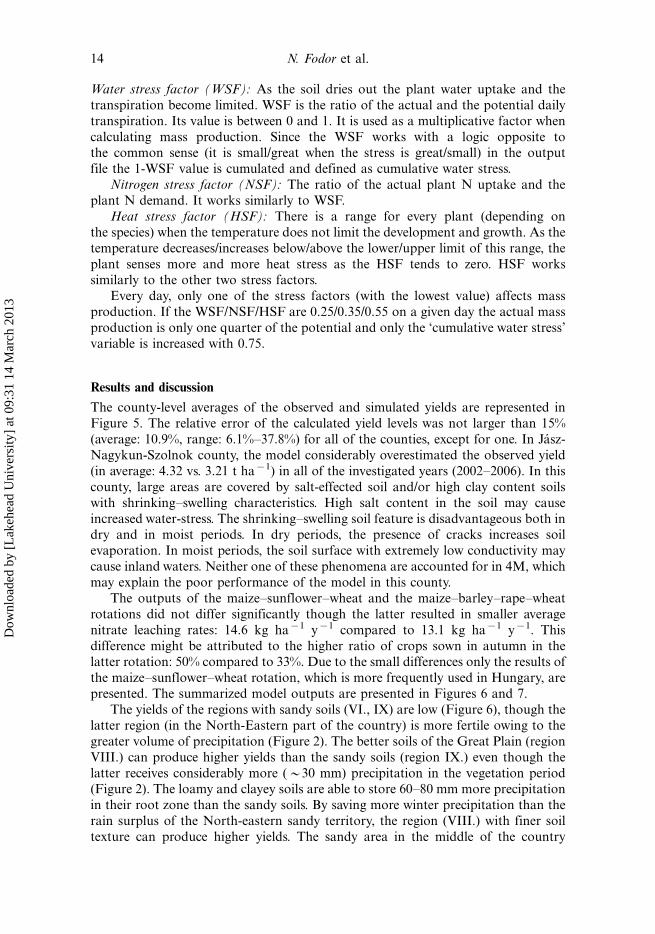
Results and discussion
The county-level averages of the observed and simulated yields are represented in
Figure 5. The relative error of the calculated yield levels was not larger than 15%
(average: 10.9%, range: 6.1%�37.8%) for all of the counties, except for one. In Jasz-
Nagykun-Szolnok county, the model considerably overestimated the observed yield
(in average: 4.32 vs. 3.21 t ha�1) in all of the investigated years (2002�2006). In this
county, large areas are covered by salt-effected soil and/or high clay content soils
with shrinking�swelling characteristics. High salt content in the soil may cause
increased water-stress. The shrinking�swelling soil feature is disadvantageous both indry and in moist periods. In dry periods, the presence of cracks increases soil
evaporation. In moist periods, the soil surface with extremely low conductivity may
cause inland waters. Neither one of these phenomena are accounted for in 4M, which
may explain the poor performance of the model in this county.
The outputs of the maize�sunflower�wheat and the maize�barley�rape�wheat
rotations did not differ significantly though the latter resulted in smaller average
nitrate leaching rates: 14.6 kg ha�1 y�1 compared to 13.1 kg ha�1 y�1. This
difference might be attributed to the higher ratio of crops sown in autumn in thelatter rotation: 50% compared to 33%. Due to the small differences only the results of
the maize�sunflower�wheat rotation, which is more frequently used in Hungary, are
presented. The summarized model outputs are presented in Figures 6 and 7.
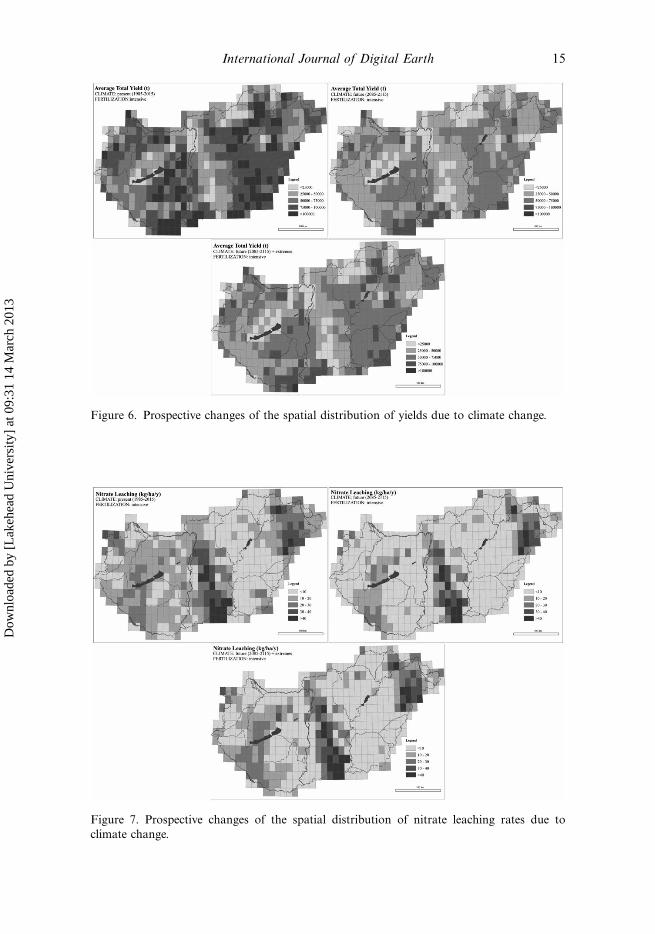
The yields of the regions with sandy soils (VI., IX) are low (Figure 6), though the
latter region (in the North-Eastern part of the country) is more fertile owing to the
greater volume of precipitation (Figure 2). The better soils of the Great Plain (region
VIII.) can produce higher yields than the sandy soils (region IX.) even though the
latter receives considerably more (�30 mm) precipitation in the vegetation period(Figure 2). The loamy and clayey soils are able to store 60�80 mm more precipitation
in their root zone than the sandy soils. By saving more winter precipitation than the
rain surplus of the North-eastern sandy territory, the region (VIII.) with finer soil
texture can produce higher yields. The sandy area in the middle of the country
14 N. Fodor et al.
Dow
nloa
ded
by [
Lak
ehea
d U
nive
rsity
] at
09:
31 1
4 M
arch
201
3
Figure 6. Prospective changes of the spatial distribution of yields due to climate change.
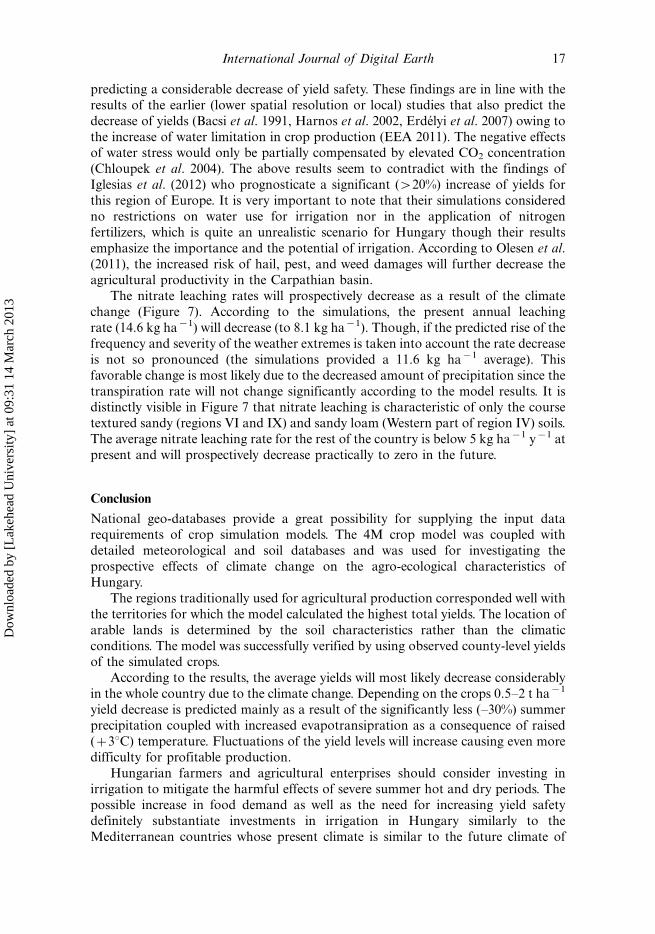
Figure 7. Prospective changes of the spatial distribution of nitrate leaching rates due to
climate change.
International Journal of Digital Earth 15
Dow
nloa
ded
by [
Lak
ehea
d U
nive
rsity
] at
09:
31 1
4 M
arch
201
3
(region VI.) is the most disadvantageous part of Hungary regarding plant production
as it receives a relatively small amount of precipitation in the vegetation period and
has poor hydrological characteristics.
Among the plant stress reactions water stress is the most significant. Water stress
was clearly dominating on the soils with poor hydrological characteristics combined
with extensive fertilization as well as on every soil type with intensive fertilization.There were exceptions, of course. Sunflower has low N demand, thus with the
exception of the ‘low humus content sandy soil � extensive fertilization’ combination,
N stress is negligible compared to the water stress in case of this plant. The nitrogen
and the HSFs were found to be invariant for the two investigated periods. It is not
surprising in case of the NSF, since the N demand of plants were constant during the
simulations. The invariance of the HSF can be explained by the fact that hot days
coincide with the days with high potential transpiration when water deficit usually
occurs. The water stress typically exceeds heat stress since plants are more sensitive to
water shortage. The difference between the calculated WSFs of the present and
future scenarios was significant. The increase of water shortage has a clear effect on
the biomass production.
Prospective yields will considerably decrease due to the climate change (Figure 6).
One hundred years from now average yields will be some 34% lower than the present
yields according to the simulation results. Owing to the decreased precipitation sum
in the summer the typical cumulative WSFs in the vegetation period will besignificantly higher in the future. Though higher CO2 concentration in the atmo-
sphere results in an increased plant stomatal resistance and a better water-use
efficiency (Garcia et al. 1998, Anda and Kocsis 2008), this effect cannot counter-
balance the summer water shortage. According to the simulation results, average
future yields for the country will be 3475 or 3800 kg ha�1 cereal unit depending on
whether the predicted increase of extreme weather events will or will not take place.
At present, this figure is 5200 kg ha�1. The higher yields of the future scenario with
more extremes could be attributed to the soil, which can store the increased amount
of precipitation coming with the more intense rainfall events (Figure 3E). It has to be
noted that the applied crop simulation model is a daily step model that postulates
evenly distributed precipitation throughout the day during the water balance
calculations. This may result in underestimating the runoff (especially for clayey
soils) as it is obviously not indifferent whether the daily precipitation reaches the soil
surface within 30 minutes or 24 hours. Consequently, it cannot be stated explicitly
that the increased extreme weather events would result in increased yields. The ‘effect’
of hail storms was not (and cannot be) simulated. Nonetheless, it seems that the
increased temperature (longer heat waves) will not cause serious yield loss as it willnot affect the simulated plants considerably. As a result of the shortened vegetation
period, wheat will be harvested in the second half of June, thus it is less likely to be
affected by the extremely hot periods usually occurring in July and August. Maize
and sunflower originate from the subtropical climate, thus they tolerate high
temperatures well. Due to its earlier harvest time, winter wheat yields will change
to a considerably smaller extent than that of the maize and sunflower. According to
the simulation results, the average yields will decrease with 500, 2000, and 800 kg
ha�1 for wheat, maize, and sunflower, respectively. The coefficient of variation of the
simulated yields (31 years for each cell) was higher for the future climate scenarios
(53%) than for the present (46%). This difference corresponds with a 15% increase
16 N. Fodor et al.
Dow
nloa
ded
by [
Lak
ehea
d U
nive
rsity
] at
09:
31 1
4 M
arch
201
3
predicting a considerable decrease of yield safety. These findings are in line with the
results of the earlier (lower spatial resolution or local) studies that also predict the
decrease of yields (Bacsi et al. 1991, Harnos et al. 2002, Erdelyi et al. 2007) owing to
the increase of water limitation in crop production (EEA 2011). The negative effectsof water stress would only be partially compensated by elevated CO2 concentration
(Chloupek et al. 2004). The above results seem to contradict with the findings of
Iglesias et al. (2012) who prognosticate a significant (�20%) increase of yields for
this region of Europe. It is very important to note that their simulations considered
no restrictions on water use for irrigation nor in the application of nitrogen
fertilizers, which is quite an unrealistic scenario for Hungary though their results
emphasize the importance and the potential of irrigation. According to Olesen et al.
(2011), the increased risk of hail, pest, and weed damages will further decrease theagricultural productivity in the Carpathian basin.
The nitrate leaching rates will prospectively decrease as a result of the climate
change (Figure 7). According to the simulations, the present annual leaching
rate (14.6 kg ha�1) will decrease (to 8.1 kg ha�1). Though, if the predicted rise of the
frequency and severity of the weather extremes is taken into account the rate decrease
is not so pronounced (the simulations provided a 11.6 kg ha�1 average). This
favorable change is most likely due to the decreased amount of precipitation since the
transpiration rate will not change significantly according to the model results. It isdistinctly visible in Figure 7 that nitrate leaching is characteristic of only the course
textured sandy (regions VI and IX) and sandy loam (Western part of region IV) soils.
The average nitrate leaching rate for the rest of the country is below 5 kg ha�1 y�1 at
present and will prospectively decrease practically to zero in the future.
Conclusion
National geo-databases provide a great possibility for supplying the input datarequirements of crop simulation models. The 4M crop model was coupled with
detailed meteorological and soil databases and was used for investigating the
prospective effects of climate change on the agro-ecological characteristics of
Hungary.
The regions traditionally used for agricultural production corresponded well with
the territories for which the model calculated the highest total yields. The location of
arable lands is determined by the soil characteristics rather than the climatic
conditions. The model was successfully verified by using observed county-level yieldsof the simulated crops.
According to the results, the average yields will most likely decrease considerably
in the whole country due to the climate change. Depending on the crops 0.5�2 t ha�1
yield decrease is predicted mainly as a result of the significantly less (�30%) summer
precipitation coupled with increased evapotransipration as a consequence of raised
(�38C) temperature. Fluctuations of the yield levels will increase causing even more
difficulty for profitable production.
Hungarian farmers and agricultural enterprises should consider investing inirrigation to mitigate the harmful effects of severe summer hot and dry periods. The
possible increase in food demand as well as the need for increasing yield safety
definitely substantiate investments in irrigation in Hungary similarly to the
Mediterranean countries whose present climate is similar to the future climate of
International Journal of Digital Earth 17
Dow
nloa
ded
by [
Lak
ehea
d U
nive
rsity
] at
09:
31 1
4 M
arch
201
3
the Carpathian basin (Horvath 2008). One possible way of accommodating the
climatic changes is to increase the ratio of crops sown in the autumn in the crop
rotation since these crops are less affected by the summer droughts. Moreover, the
amount of nitrate leaching could also be decreased by using these kinds of crop
rotations. Another alternative for Hungarian agriculture is to start experimenting
with alternative crops, such as energy crops (robinia (Robinia pseudoacacia), poplar
(Populus), etc.) or crops native to or successfully produced in Mediterranean areas
Gaernt.) or cotton (Gossypium), etc.). Well-calibrated crop simulation models could
support these testing efforts by carrying out virtual experiments.Probably the only positive effect of climate change is the decreased risk of
polluting sub-surface water reservoirs thanks to the reduced nitrate leaching rates. In
the regions traditionally used for agricultural production, the annual nitrate leaching
rates will most likely decrease to zero approaching 2100.Since soil- and land-use information is available with considerably higher spatial
resolution, better results could be achieved with a spatially more detailed
meteorological database.
Acknowledgements
The authors gratefully acknowledge the financial support of the ONTTECH Project (TECH-08-A3/2-2008-0379).
References
Anda, A. and Kocsis, T., 2008. Impact of atmospheric CO2 enrichment on some elements ofmicroclimate and physiology of locally grown maize. Applied Ecology and EnvironmentalResearch, 6, 85�94.
Bacsi, Z., Thornton, P.K., and Dent, J.B., 1991. Impacts of future climate change onHungarian crop production: an application of crop growth simulation models. AgriculturalSystems, 37, 435�450.
Boksai, D. and Erdelyi, E., 2009. Importance and possibilities of maize production ofHungary in the future. In: M. Mihailovic, ed. Environmental, health and humanity issues inthe down Danubian Region: multidisciplinary approaches. Singapore: World ScientificPublishing Company, 297�307.
Bubnova, R., et al., 1995. Integration of the fully elastic equations cast in the hydrostaticpressure terrain-following coordinate in the framework of the ARPEGE/Aladin NWPSystem. Monthly Weather Review, 123, 515�535.
Buttner, G., et al., 2004. National land cover database at scale 1:50,000 in Hungary. EARSeLeProceedings, 3 (3), 323�330.
Campbell, G.S., 1985. Soil physics with BASIC: transport models for soil�plant systems. NewYork: Elsevier.
CECILIA, 2009. Deliverable 3.3: assessment of the applicability of RCM and SDS models in theimpact target areas by their validation according to relevant criteria; ranking of the models ifpossible [online], 34-40. Available from: http://www.cecilia-eu.org/restricted/deliverables.php[Accessed 9 March 2012].
Chloupek, O., Hrstkova, P., and Schweigert, P., 2004. Yield and its stability, crop diversity,adaptability and response to climate change, weather and fertilisation over 75 years in theCzech Republic in comparison to some European countries. Field Crops Research, 85,167�190.
Deque, M., Marquet, P., and Jones, R.G., 1998. Simulation of climate change over Europeusing a global variable resolution general circulation model. Climate Dynamics, 14,173�189.
Dhakhwa, G.B. and Campbell, C.L., 1998. Potential effects of differential day-night warmingin global climate change on crop production. Climatic Change, 40, 647�667.
Dios, N., et al., 2009. A climate profile indicator based comparative analysis of climate changescenarios with regard to maize (Zea Mays L.) cultures. Applied Ecology and EnvironmentalResearch, 7, 199�214.
EEA, 2007. Impact of climate change on number of plant species, 2100 [online]. Available from:http://www.eea.europa.eu/data-and-maps/figures/impact-of-climate-change-on-number-of-plant-species-2100 [Accessed 6 March 2012].
EEA, 2011. Present and projected water limitation of crop primary production in Europe underrain-fed conditions [online]. Available from: http://www.eea.europa.eu/data-and-maps/fig-ures/water-limitation-of-crop-primary [Accessed 6 March 2012].
Erdelyi, E., Ferenczy, A., and Boksai, D., 2007. Climate change and cereal crops growing inHungary. EFITA 2007 proceedings � Glasgow (UK) [online]. www.efita.net [Accessed: 08Mar 2012].
Fodor, N., et al., 2002. 4M � software package for modelling cropping systems. EuropeanJournal of Agriculture, 18, 389�393.
Fodor, N., 2006. 4M � software for modelling and analysing cropping systems. Journal ofUniversal Computer Science, 12, 1196�1207.
Fodor, N., et al., 2010. MV-WG: a new multi-variable weather generator. Meteorology andAtmospheric Physics, 107, 91�101.
Fodor, N. and Mika, J., 2011. Using analogies from soil science for estimating solar radiation.Agricultural and Forest Meteorology, 151, 78�85.
Garcia, R.L., et al., 1998. Photosynthesis and conductance of spring-wheat leaves: fieldresponse to continuous free-air atmospheric CO2 enrichment. Plant. Cell and Environment,21, 659�669.
Gijsman, A.J., Thornton, P.K., and Hoogenboom, G., 2007. Using the WISE database toparameterize soil inputs for crop simulation models. Computers and Electronics inAgriculture, 56, 85�100.
Harnos, N., 2000. Analyzing the prospective effects of climate change on winter wheatproduction using simulation models. Novenytermeles, 50, 41�55 (in Hungarian).
Harnos, N., et al., 2002. Interactions between elevated CO2 and water stress in two winterwheat cultivars differing in drought resistance. Cereal Research Communications, 30, 359�366.
Hodges, T., 1990. Predicting crop phenology. Boca Raton, FL: CRC Press.Horvath, E., et al., 2007. Analysing soil hydraulic properties in the Bodrogkoz Region for
supporting sustainable land use. Cereal Research Communications, 35, 485�488.Horvath, L., 2008. Use of spatial analogy method to analyse to possible land use change in
Hungary. CLIMA-21 Brochures, 55, 23�27.Iglesias, A., et al., 2012. A regional comparison of the effects of climate change on agricultural
crops in Europe. Climatic Change, 112, 29�46.Ladanyi, M. and Hufnagel, L., 2006. The effect of climate change on the population of
sycamore lace bug (Corythuca Ciliata, Say, Tingidae Heteroptera) based on a simulationmodel with phenological response. Applied Ecology and Environmental Research, 4, 85�112.
Ladanyi, M. and Horvath, L., 2010. A review of the potential climate change impact on insectpopulations � general and agricultural aspects. Applied Ecology and EnvironmentalResearch, 8, 143�152.
Mathene, G.G., et al., 2005. Crop modelling as a tool to separate the influence of the soil andweather on crop yields. Physics and Chemistry of the Earth, 30, 165�170.
Mika, J. and Lakatos, M., 2008. Extreme weather tendencies in Hungary: one empirical andtwo model approaches. In: J. Sigro, M. Brunet and E. Aguilar, eds. Regional climatic changeand its impacts, Tarragona, Spain: Spanish Association of Climatology, 521�531.
Nakicenovic, N. and Swart, R., eds. 2000. Special report on emission scenarios. Cambridge:Cambridge University Press.
Olesen, J.E., et al., 2011. Impacts and adaptation of European crop production systems toclimate change. European Journal of Agronomy, 34, 96�112.
Parton, W.J., et al., 1987. Analysis of factors controlling soil organic matter levels in GreatPlains grasslands. Soil Science Society of America Journal, 51, 1173�1179.
Pasztor, L., Szabo, J., and Bakacsi, Z., 2010. Digital processing and upgrading of legacy datacollected during the 1:25.000 scale Kreybig soil survey. Acta Geodaetica et GeophysicaHungarica, 45, 127�136.
Pasztor, L., Bakacsi, Z., and Szabo, J., 2011. Spatio-temporal integration of soil dataoriginating from different sources for the estimation of national carbon stock in Hungary.Geophysical Research Abstracts Vol. 13. Vienna: EGU2011-10960, 1.
Rajkai, K., Kabos, S., and van Genuchten, M.Th., 2004. Estimating the water retention curvefrom soil properties: comparison of linear, nonlinear and concomitant variable methods.Soil and Tillage Research, 79, 145�152.
Rawls, W.J., 1983. Estimating soil bulk density from particle size analysis and organic mattercontent. Soil Science, 135, 123�125.
Rosenzweig, C. and Parry, M.L., 1994. Potential impacts of climate change on world foodsupply. Nature, 367, 133�138.
Rosenzweig, C., et al., 2002. Increased crop damage in the US from excess precipitation underclimate change. Global Environmental Change, 12, 197�202.
Sipkay, C., et al., 2008. Analysis of climate change scenarios based on modeling of seasonaldynamics of a Danubian copepod species. Applied Ecology and Environmental Research, 6,101�109.
Soetaert, K. and Petzoldt, T., 2010. Inverse modelling, sensitivity and Monte Carlo analysis inR using package FME. Journal of Statistical Software, 33 (3), 1�28.
Stockle, C.O. and Nelson, R.L., 1996. Cropsyst user’s manual (Version 2.0). Pullman, WA:Biological Systems Engineering Dept., Washington State University.
Szabo, J., 2002. Compilation of a watershed level, complex land information system forInternet service. Agrokemia es Talajtan, 51, 283�292.
Szentimrey, T., et al., 2011. Mathematical, methodological questions concerning the spatialinterpolation of climate elements. Idojaras, 115, 1�11.
Tubiello, F.N., et al., 2000. Effects of climate change and elevated CO2 on cropping systems:model predictions at two Italian locations. European Journal of Agronomy, 12, 179�189.
Varallyay, G., et al., 1979. Map of soil factors determining the agro-ecological potential ofHungary, 1:100 000 I. Agrokemia es Talajtan, 28, 363�384 (In Hungarian).
Varallyay, G., 2002. Soil survey and soil monitoring in Hungary. European Soil Bureau.Research Report, 9, 139�149.
Vereecken, H., et al., 2010. Using pedotransfer functions to estimate the van Genuchten�Mualem soil hydraulic properties: a Review. Vadose Zone Journal, 9, 795�820.
Wang, Y., et al., 2011. The Central European limited area ensemble forecasting system:ALADIN-LAEF. Quarterly Journal of Royal Meteorological Society, 137, 483�502.