• COURSE CODE: ECO 113 • COURSE TITLE: Introductory Statistics 1 • NUMBER OF UNITS:2 Units • COURSE DURATION: Two hours per week • COURSE LECTURER: Dr. Sylvester Ohiomu INTENDED LEARNING OUTCOMES At the completion of this course, students are expected to: • Students should be able to define and explain Statistics • Students should be able to differentiate and appraise Statistical scenarios • Students should be able to apply knowledge of Statistics to solve problems in other disciplines • Students should be able to gather data and develop tables and models from observations • Students should be able to apply statistics to daily problems, economic, national and global challenges Course Details Week 1: The Meaning, Nature, Scope and Purpose of Statistics Week 2: Sources of Statistical Data and Problems of data Collection Week 3: Frequency Distribution Formats Week 4: Pie Charts, Bar Charts, Quartiles and Percentiles Week 5: Measure of Central Tendency: Mean of Grouped and ungrouped Data Week 6: Median of Grouped and ungrouped Data Week 7: Mode of Grouped and ungrouped Data Week 8: Measure of Dispersion: Range and Mean Deviation Week 9: Variance Week 10: Standard Deviation
Transcript
• COURSE CODE: ECO 113
• COURSE TITLE: Introductory Statistics 1
• NUMBER OF UNITS:2 Units
• COURSE DURATION: Two hours per week
• COURSE LECTURER: Dr. Sylvester Ohiomu
INTENDED LEARNING OUTCOMES
At the completion of this course, students are expected to:
• Students should be able to define and explain Statistics
• Students should be able to differentiate and appraise Statistical scenarios
• Students should be able to apply knowledge of Statistics to solve problems in other
disciplines
• Students should be able to gather data and develop tables and models from observations
• Students should be able to apply statistics to daily problems, economic, national and
global challenges
Course Details
Week 1: The Meaning, Nature, Scope and Purpose of Statistics
Week 2: Sources of Statistical Data and Problems of data Collection
Week 3: Frequency Distribution Formats
Week 4: Pie Charts, Bar Charts, Quartiles and Percentiles
Week 5: Measure of Central Tendency: Mean of Grouped and ungrouped Data
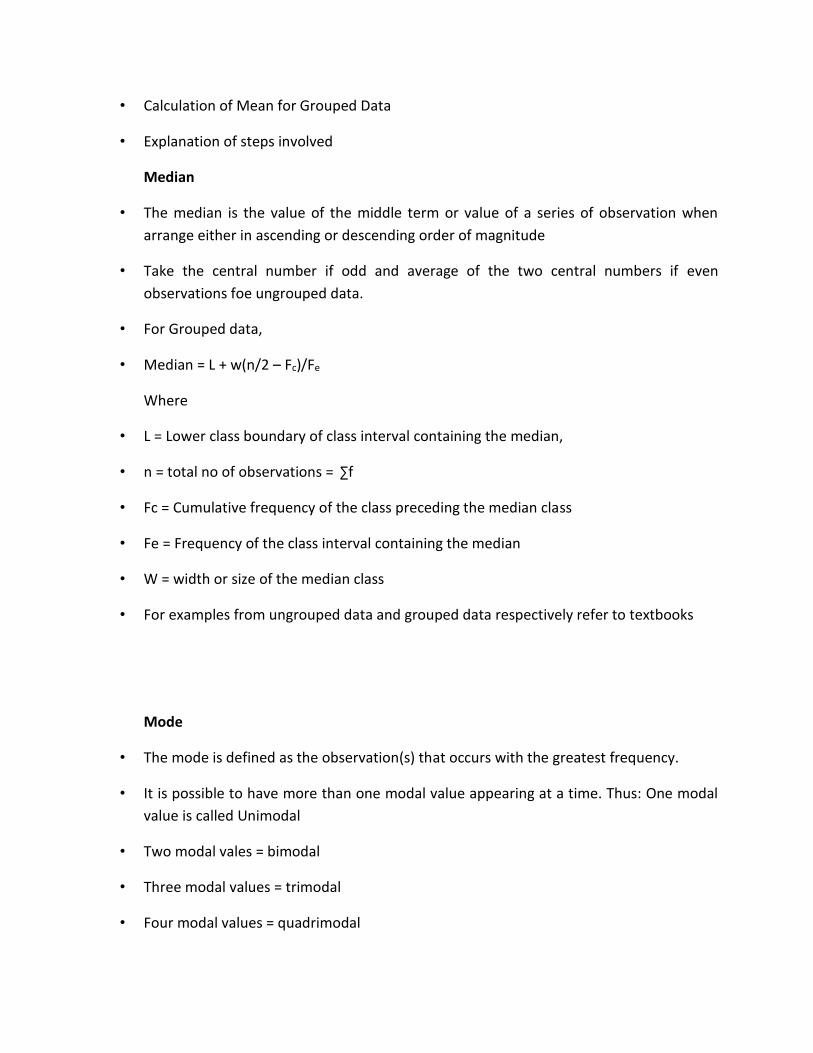
Week 6: Median of Grouped and ungrouped Data
Week 7: Mode of Grouped and ungrouped Data
Week 8: Measure of Dispersion: Range and Mean Deviation
Week 9: Variance
Week 10: Standard Deviation
OJ
Stamp
Week 11: Probability Distributions: Probability Theory
Anyiwe M.A. (2006). Applied Statistics in Social Sciences. Ethiope publishing Corp, Benin City,
Elements of Statistics I: Descriptive Statistics and probability: Volume 1 (Schaum's Outline
Series).
Gupta, S.C.(1984), Statistical Methods, New Delhi; Sultan Chand & Sons Publishers
Structure of the Programme/ Method of Grading
Grading method is organized into two basic parts namely:
Continuous assessment: 30%
End of Semester Examination: 70%
Assignments & Grading • Academic Honesty: All classwork should be done independently, unless explicitly stated otherwise on the assignment handout. • You may discuss general solution strategies, but must write up the solutions yourself. • If you discuss any problem with anyone else, you must write their name at the top of your assignment, labeling them “collaborators”. • NO LATE HOMEWORKS ACCEPTED • Turn in what you have at the time it’s due. • All home works are due at the start of class. • If you will be away, turn in the homework early.
Preamble
Meaning and Nature of Statistics
• Statistics deals with quantitative data i.e. the collection, analysis, interpretation of data
and drawing of necessary inferences
• Statistics is subdivided into three modern subgroups namely:
• Simple Statistics which deals with data collection
• Descriptive statistics which deals with methods of organizing, summarizing and
presentation of data in a convenient and informative way
• Inferential or deductive statistics which deals with methods used to draw conclusion or
inferences about the characteristics of populations based on sample data
Data Collection
• Data is very important in any statistical investigation
• Sources of data collection include the following:
• Primary sources: questionnaire, personal interview, direct interview, registration of
events, by telephone etc
• Secondary sources: regular records, periodic records and irregular records
• Problems of data collection in Nigeria include: secrecy, illiteracy, scanty records, under
developed ICT and cumbersome nature of manual data storage
Data Presentation and Organization
• Forms of presentation of data include the following
• Visual presentation
• Visual Presentation: Examples are (1) tabular presentation with practical demonstration
the class (Frequency distribution table)
• (2) Graphical presentation with practical demonstration on graphs (Histogram and
frequency polygon)
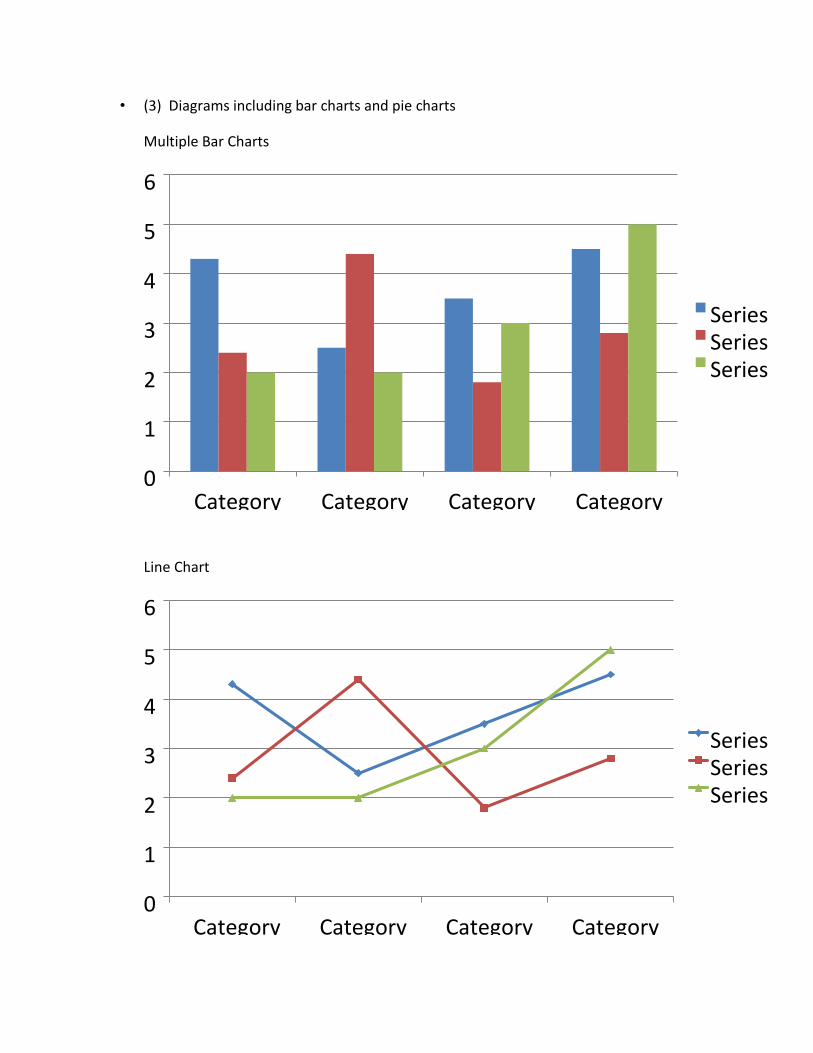
• (3) Diagrams including bar charts and pie charts
Multiple Bar Charts
Line Chart
0
1
2
3
4
5
6
Category Category Category Category
Series Series Series
0
1
2
3
4
5
6
Category Category Category Category
Series Series Series
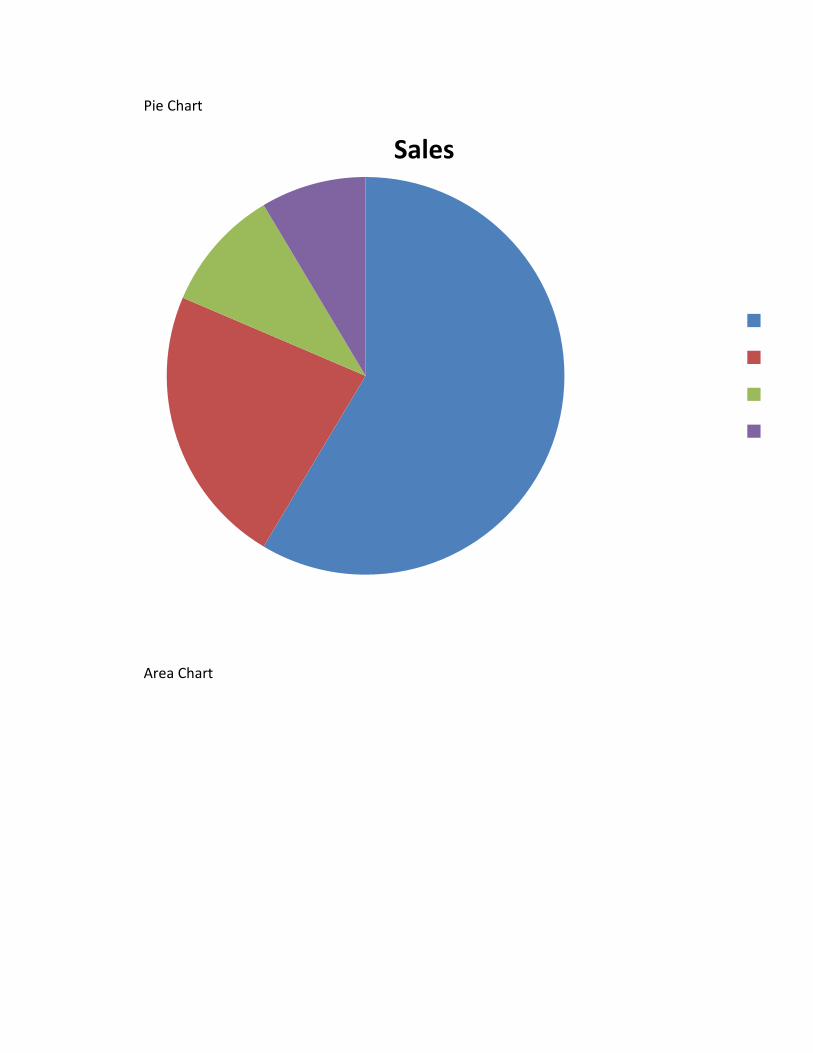
Pie Chart
Area Chart
Sales
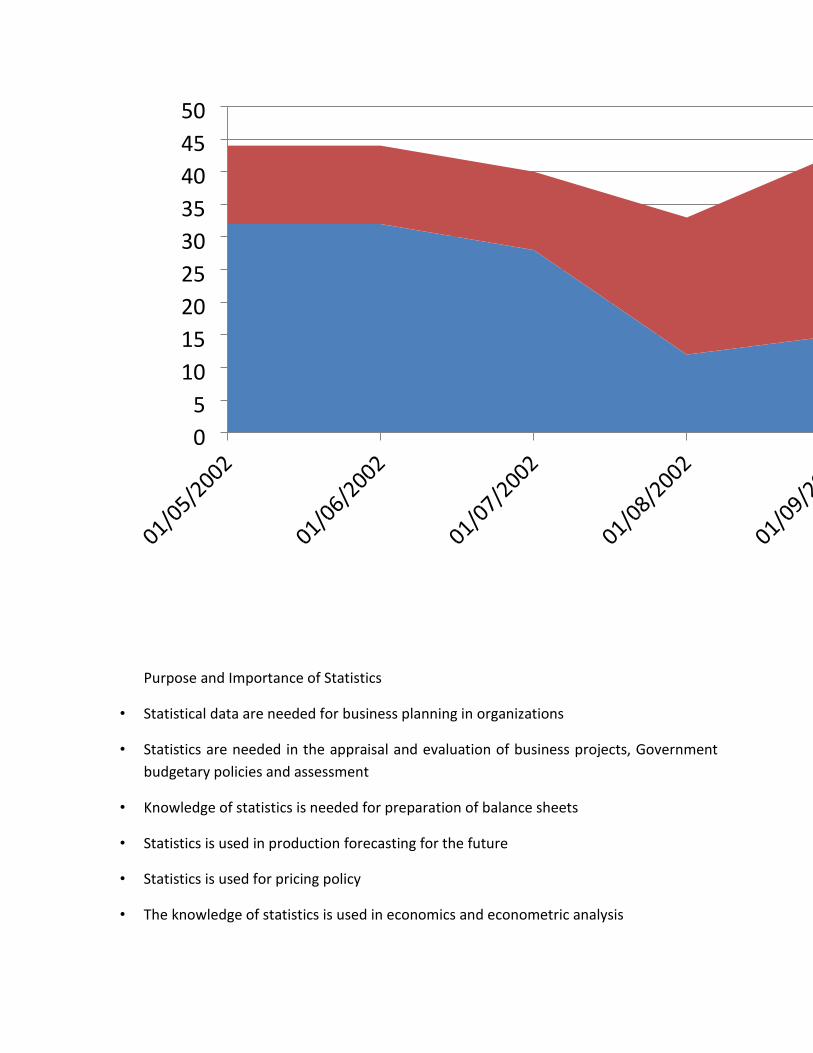
Purpose and Importance of Statistics
• Statistical data are needed for business planning in organizations
• Statistics are needed in the appraisal and evaluation of business projects, Government
budgetary policies and assessment
• Knowledge of statistics is needed for preparation of balance sheets
• Statistics is used in production forecasting for the future
• Statistics is used for pricing policy
• The knowledge of statistics is used in economics and econometric analysis
0
5
10
15
20
25
30
35
40
45
50
Summary
• Statistics deals with the collection, analysis, interpretation of data and drawing of
inferences
• Three subdivisions of statistics include: simple statistics, descriptive statistics and
inferential statistics
• Data can be collected from primary and secondary sources
• Problems of data collection include: illiteracy, secrecy, scanty data, under developed ICT
and challenges in manual data storage
• Data can be presented through verbal and visual modes
• Statistics is used for planning, forecasting, evaluation, assessment, pricing policy,
economic and econometric analysis
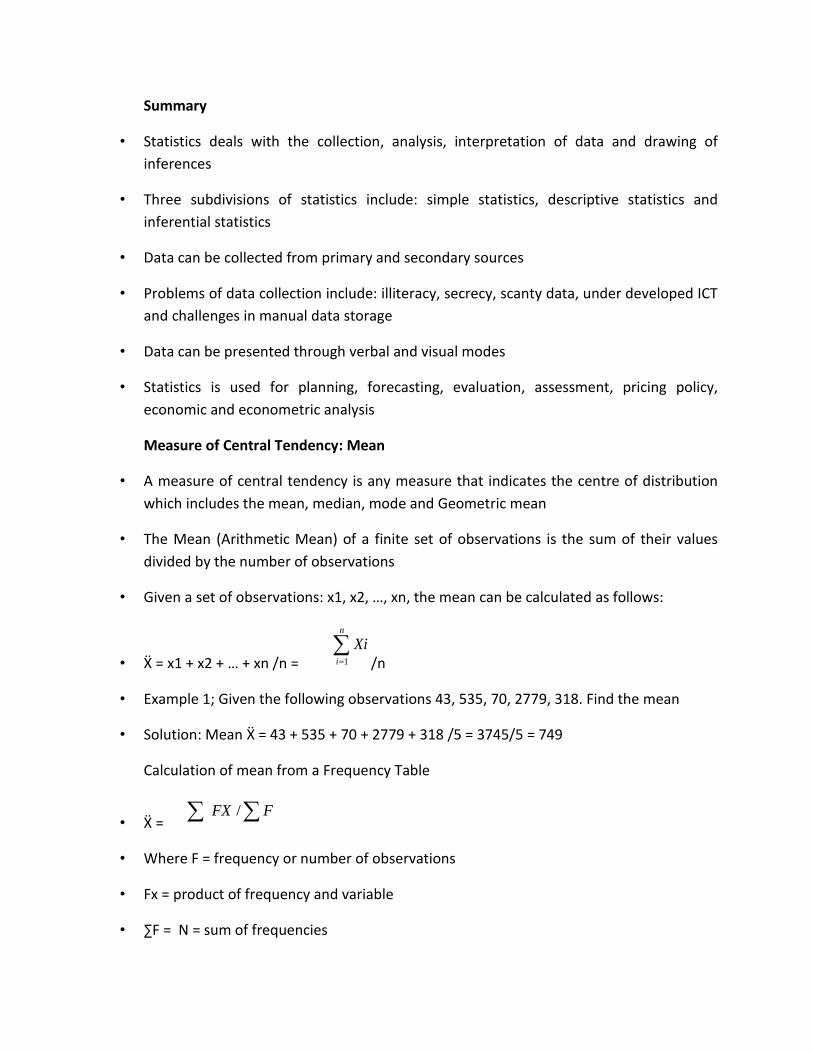
Measure of Central Tendency: Mean
• A measure of central tendency is any measure that indicates the centre of distribution
which includes the mean, median, mode and Geometric mean
• The Mean (Arithmetic Mean) of a finite set of observations is the sum of their values
divided by the number of observations
• Given a set of observations: x1, x2, …, xn, the mean can be calculated as follows:
• Ẍ = x1 + x2 + … + xn /n =
n
i
Xi1 /n
• Example 1; Given the following observations 43, 535, 70, 2779, 318. Find the mean