44

Acknowledgements
Apollo Hospital Annexe, Basement, Indraprastha Apollo Hospitals, Sarita Vihar, Delhi - Mathura Road, New Delhi - 110 076, IndiaTel. : 26925858 Extn. : 5018 Direct: 26925825 Fax : 41677024
Apollo Hospitals Educational and Research Foundation (AHERF) dedicates this first evidence based retrospective basic retrospective research study report to Dr Prathap C. Reddy, Founder Chairman of the Apollo Hospitals Group on the special occasion of the 25th Anniversary of Apollo Hospitals Group.
AHERF acknowledges the current and former members of the Governing Board and the Scientific Advisory Committee for their continuous advice and guidance in development and periodic review of the study proposals. Our special thanks to Ms.Shobana Kamineni - Vice Chairman AHERF and Mr. Sridhar, Chief Operating Officer of Apollo Pharmacy for sponsoring the prestigious national level study.
AHERF respects Prof. Ranjit Roy Chaudhury - Chairman - Apollo Task Force for Research AHERF for his leadership and encouragement for successful completion of the first study of its kind.
AHERF acknowledges and admires Dr. Udhaya Balasubramaniam for taking captaincy as Principal Investigator & continuous support and Ms. Jayanthi Swaminathan for constant guidance throughout the study duration.
AHERF acknowledges the efforts taken by Dr. Deepak Raut for developing the initial protocol for the study. Our exceptional thanks to Dr. Srilekha Sairam, who took the entire responsibility for reviewing and amending the protocol, database development, report writing, interaction with statisticians and finalizing the manuscript for publication.
AHERF recognizes the input and ideas given by Apollo clinicians of Ahmedabad, Chennai, Hyderabad and New Delhi in finalizing the protocol and review of the report for publication.
A special mention and acknowledgement to the chairman and members of Central Ethics Committee of Apollo Hospitals Group for review and approval for initiation of the study.
AHERF takes this opportunity to thank Dr. Suhashini, HOD Biochemistry, Apollo Hyderabad for extending her continuous support in review of analysed statistical laboratory parameters and review of the report and continuous contribution.
AHERF acknowledges the chief of Biochemistry and Hematology at Apollo Ahmedabad, Chennai, Hyderabad and New Delhi for contribution and input on the review of the report for publication.
We acknowledge and recognize the enormous effort taken by Ms. Alamelu ANSI Techniques for statistical analysis and data outcome for the entire study with rigorous timelines.
Our special thanks and acknowledgement to Dr Ramakrishnan – Deputy Director, National Institute of Epidemiology and Dr. Manjula Dutta – Epidemiologist for review of the report and guidance, Last but not the least AHERF is proud of the outstanding efforts taken by all staff members and profusely thank and acknowledges for their relevant contribution in completion of this esteemed and dream project of our Chairman come true.
© A
NA
LYS
IS :
01
1 -
26
95
85
18
(09
- 2
00
8) 1
20
0

40
Hematological & Biochemical Values in Indian Population
Governing Board Members
Dr. Prathap C. ReddyPresident – Apollo Hospitals Educational and Research Foundation, Chennai President
Mrs. Shobana KamineniVice-President – Apollo Hospitals Educational and Research Foundation, Hyderabad Vice-President
Prof. Nirmal Kumar GangulyFormer Director GeneralIndian Council of Medical Research, New Delhi Member Dr. Mohan D. NairConsultant to Health Care Industry MemberChennai
Mr. A. Ranga RaoChairman – Central Ethics CommitteeApollo Hospitals Group, Hyderabad Member Mrs. Preetha ReddyManaging DirectorApollo Hospitals, Chennai Member
Prof. Ranjit Roy ChaudhuryChairman – Task Force for ResearchApollo Hospitals Educational and Research Foundation, New Delhi Member Dr.Anupam SibalGroup Medical DirectorApollo Hospitals Group, New Delhi Member
Prof. M.S. SwaminathanChairman – M. S. Swaminathan Research Foundation, Chennai Member
Ms. Jayanthi SwaminathanClinical Project ManagerApollo Hospitals Educational and Research Foundation, Chennai Secretary

40
Hematological & Biochemical Values in Indian Population
A Research Initiative of the Apollo Hospital Educational and Research Foundation (AHERF)
Hematological & Biochemical Valuesin Indian Population
D e f i n i n g R e f e r e n c e I n t e r v a l s
Governing Board Members
Dr. Prathap C. ReddyPresident – Apollo Hospitals Educational and Research Foundation, Chennai President
Mrs. Shobana KamineniVice-President – Apollo Hospitals Educational and Research Foundation, Hyderabad Vice-President
Prof. Nirmal Kumar GangulyFormer Director GeneralIndian Council of Medical Research, New Delhi Member Dr. Mohan D. NairConsultant to Health Care Industry MemberChennai
Mr. A. Ranga RaoChairman – Central Ethics CommitteeApollo Hospitals Group, Hyderabad Member Mrs. Preetha ReddyManaging DirectorApollo Hospitals, Chennai Member
Prof. Ranjit Roy ChaudhuryChairman – Task Force for ResearchApollo Hospitals Educational and Research Foundation, New Delhi Member Dr.Anupam SibalGroup Medical DirectorApollo Hospitals Group, New Delhi Member
Prof. M.S. SwaminathanChairman – M. S. Swaminathan Research Foundation, Chennai Member
Ms. Jayanthi SwaminathanClinical Project ManagerApollo Hospitals Educational and Research Foundation, Chennai Secretary

2 3
Preface
This report contains the results of a study carried out by the Apollo Hospitals Educational and Research Foundation (AHERF) to obtain hematological and biochemical values in a segment of the healthy Indian population. The study was carried out at the four Apollo Hospitals at Ahmedabad, Chennai, Hyderabad and Delhi on a sample of 10,665 healthy persons screened from 76,000 persons who underwent the Apollo Hospitals Health Check-up.
It has long been felt that reference levels based on our own population need to be developed as this would help in providing quality care. The World Health Organization and the Indian Council of Medical Research encouraged AHERF to carry out this work. Further studies, based on the results obtained, have been planned in different areas such as cardiovascular disease and diabetes on sub samples of the healthy individuals.
The Apollo Hospitals Educational and Research Foundation (AHERF) was created in keeping with the vision of the Chairman of the Apollo Group of Hospitals, Dr. Prathap C. Reddy who is deeply committed to the development of high quality research at the Apollo Hospitals. AHERF is carrying out several projects in clinical, epidemiological and translational research in collaboration with other national and international institutions and a basic Research Centre is being established at the Apollo Health City, Hyderabad.
Professor Ranjit Roy Chaudhury Dr. Anupam SibalChairman – Task Force for Research Group Medical DirectorApollo Hospitals Educational and Apollo Hospitals GroupResearch Foundation
Dr. Udhaya Balasubramaniam Director – Preventive Medicine Principal InvestigatorApollo Hospitals Group, Chennai
Dr. Palak Pandeya Dentist Co-InvestigatorApollo Hospitals, Ahmedabad Dr. Srilekha Sairam Consultant – Internal Medicine & Rheumatology Co-InvestigatorApollo Hospitals, Chennai Dr. D. Suhasini Senior Consultant & Head of Biochemistry Co-InvestigatorApollo Hospitals, Hyderabad Dr. Lalita Sekhar Senior Consultant – Internal Medicine Co-InvestigatorIndraprastha Apollo Hospitals, New Delhi
Dr. ManjariTechnical Advisor Project Co-ordinatorApollo Hospitals Educational and Research Foundation, Ahmedabad Ms. Hilda SolomonSenior Clinical Trials Manager Project Co-ordinatorApollo Hospitals Educational andResearch Foundation, Chennai Dr. Shyamala SesikeranMedical Advisor Project Co-ordinatorApollo Hospitals Educational andResearch Foundation, Hyderabad
Dr. Shaloo SrikrishnaSenior Clinical Research Associate Project Co-ordinatorApollo Hospitals Educational andResearch Foundation, New Delhi
Ms. Jayanthi SwaminathanClinical Project Manager Senior AdministratorApollo Hospitals Educational andResearch Foundation, Chennai
Ms. Raji ChandruDeputy General Manager Senior AdministratorIndraprastha Apollo Hospitals, New Delhi
Study Team

4
Hematological & Biochemical Values in Indian Population
5
A Research Initiative of AHERF
Similarly Johnson et al also observed that plasma protein Alpha-1- antitrypsin levels were significantly different between Caucasians and Asians living in Leeds, England. Another study by Ichihara et al showed major differences between people living in Tokyo and other cities, Hong Kong and Singapore. Clearly there exist differences between various populations, necessitating separate reference intervals for different populations. However such studies are cumbersome and expensive that often results in transference of reference intervals identified on a single population.
India is a large country known for its diversity in religion, culture and social background. This highly heterogeneous population poses a challenge in identifying reference intervals. Few studies have looked at the reference intervals among the Indian population. Ashavaid et al arrived at reference intervals for several analytes among 4466 healthy individuals who underwent health check up at the Hinduja Hospital Mumbai. Their observed reference intervals showed only minor variations compared with the laboratory reported intervals for most analytes. Bilirubin, uric acid and ALT were higher in their population and hemoglobin was lower. However major variations were observed between their population and lab reference intervals for the lipids. Furruqh evaluated the reference intervals for liver function tests among 664 individual who attended the health plan clinic of St. John Medical center, Bangalore. Among men, total protein, bilirubin, AST, ALT and GGTP were observed to be higher than those reported as reference intervals by the laboratory. For the women, total protein was higher and albumin was lower. Verma et al 13 studied the serum creatinine levels among 1121 subjects who underwent health check at the SRL Ranbaxy Laboratory their observed serum creatinine was similar to the reference range recommended by the manufacturer.
Apollo Hospitals Educational and Research Foundation, the Clinical Research Unit of Apollo Hospitals, Chennai decided to establish reference interval for haematological and biochemical parameters for the regional population. The preventive health check package offered by Apollo Hospitals contains several laboratory tests and is favored by a large number of healthy persons. As Apollo has several branches, it provides a unique opportunity to study regional differences as well. We undertook a large multi-center trial to identify the reference interval of biochemical and haematological parameters at four centers from 4 different regions of the country. Healthy individuals from those undergoing Apollo Health check were identified and their laboratory reports were analyzed. Apollo Hospitals - Ahmedabad, Chennai, Hyderabad and New Delhi participated in the study.
Objectives• To identify 95% reference interval for haematologic and biochemical parameters • Partitioning of the data for age, sex and recommend separate reference interval if significantly different. • To study regional difference, if any for these laboratory parameters.
MethodologyWe undertook a multi-center retrospective study with posteriori sampling of individuals. The reference population comprised of persons undergoing Apollo health Check, a preventive health package offered by Apollo, between August 2004 and March 2008 at the four centers, Apollo Ahmedabad, Chennai, Hyderabad and New Delhi. The reference individuals were those persons identified as healthy from this reference population. Defining healthy and normal has been a challenge. Drawing from the guidance published by NCCLS 7 and EPRTV part 3, 3 strict inclusion, exclusion criteria
Establishment of Reference Intervals for Haematological and Biochemical Parameters in an Indian Population.
Introduction
Laboratory tests to identify disease states are multitude and varied. To interpret these tests and to differentiate normal values from abnormal values, reference intervals are used. The observed laboratory value is compared to the reference range to make clinical and meaningful decisions. Identifying the reference intervals hence is an important aspect of laboratory medicine. Appreciating the importance of the reference intervals and the need for scientific rigor in establishing these intervals, International federation of Clinical Chemistry (IFCC) published guidelines in a series of 6 papers outlining the definition, procedure and statistical methods used in arriving at the reference interval as developed by the Expert Panel on Theory of Reference Values (EPTRV) and the Standing Committee on Reference values of the International Council for Standardization in Haematology (ICSH). These guidelines are used widely in establishing the reference Intervals.
The establishment of reference intervals involves the following steps
1. Selection of reference individuals: Identifying healthy individuals in a reference population.2. Standardization of pre-analytical procedures: The preparation of individuals before blood collection (fasting, sitting), specimen collection and handling of the collected specimen prior to analysis.3. Control of analytical variation with standard and recommended internal and external quality control for control of precision and inaccuracy.4. Statistical analysis to arrive at the 95% reference interval of the collected reference values.
The reference interval is defined as “The interval between, and including, two reference limits. It is designated as the interval of values from the lower reference limit to the upper reference limit. The reference limit is a stated fraction of the distribution of the healthy reference population. For the 95% reference interval, 2.5-percentile reference value is the lower reference limit and 97.5-percentile reference value is the upper reference limit.Definitions and guidelines for each step are elaborated by the EPRTV as separate articles. Subsequently in 2000 NCCLS published guidelines for determining reference intervals for quantitative clinical laboratory tests.
Under ideal circumstances, the reference individuals selected for establishing reference intervals should reflect the population the laboratory caters to. Significant variation in populations due to ethnic, social and environmental differences has been observed.
P.S.Horn et al looked at the effect of ethnicity on reference intervals using the NHANES 111 survey data. Among this group about 5800 patients whose health was considered excellent by the physician, were studied for ethnic differences. They were partitioned to 3 groups, Non-Hispanic whites, Non-Hispanic blacks and Mexican Americans. Of the 33-biochemical analytes, 18 needed separate reference intervals between the 3 racial groups. They concluded that separate reference intervals are warranted among the 3 ethnic groups.

6
Hematological & Biochemical Values in Indian Population
7
A Research Initiative of AHERF
were used to identify reference individuals. As the study is aimed at identifying reference intervals for biochemical and haematologic parameters, normal and healthy was defined by history and physical examination. Care was taken to identify the selection criteria that were reflective of the healthy individuals the lab caters to.
Selecting the reference individualsPhysicians at each center screened the data from the health records to identify persons fulfilling the selection criteria. Patients with known pathophysiologic states, those taking pharmacologically active substances and those in modified physiologic states were excluded.
Selection criteria • Adults upto the age of 70 years• BMI of 18 to 35 Kg/m2• Patients deemed healthy by their respective physicians • Patients with known pathophysiologic states: diabetes mellitus, chronic renal insufficiency, hypertension, ischemic heart disease, anaemia, thyroid and liver diseases were excluded.• Patients with complaints that may reflect biochemical and haematological abnormality such as weight loss, fever, chest pain, giddiness, polyarthralgia and loss of appetite were excluded.• Those taking pharmacologically active substances: all prescription drugs, multiple and regular vitamins, oral contraceptive pills, smokers, alcohol consumption exceeding 2 drinks a week (60 ml of alcohol) were excluded.• Patients with past illness of typhoid, tuberculosis, malaria, dengue within 6 months of the study date and jaundice or major surgery within 1 year were excluded. • Pregnant and lactating women were excluded.• Patient’s whose physical examination revealed abnormalities or whose blood pressure was more than 140/90 were excluded.
Sample Collection and Handling Prior to Analyte testingAll samples were collected from patients after fasting overnight. The health check up instruction sheet handed to patients recommends 10-12 hours of fasting. The samples were drawn between 7.30 am and 10.30 am after an overnight fast. All patients were seated and cubital vein sampling was most often done. Evacuated blood collection tubes were used. Blood was collected in plain or SST gel tubes for analysis of liver function tests, urea, creatinine, uric acid; plain, SST gel or heparinised tubes for lipoprotein profile analysis; plain, SST or Sodium Fluoride/EDTA tubes for glucose analysis and EDTA tubes for haematological parameters.
Automated analysers were used at the four centers. For biochemical analysis, Hitachi 911/912 analyzer from company Roche was used at Ahmedabad, Chennai, and New Delhi centers. Dade Behring (now Siemens) equipment, Dimension RxL was used at the Hyderabad center. Dedicated reagents were used at the Chennai and Hyderabad center and aternative reagents were used at Delhi. Combinations of dedicated and alternative reagents were used at the Ahmedabad center. All four laboratories used two levels of controls per day for internal quality control for biochemical parameters. laboratories at Chennai and New Delhi used dedicated optimized controls; Ahmedabad used an assortment of controls, Hyderabad used third party controls (Bio-Rad) for internal QC during the entire period of study.
Data on biochemical parameters, fasting blood glucose, 2 hour post glucose (75 gms) blood glucose, total cholesterol, low density lipoprotein (LDL) cholesterol, high density lipoprotein (HDL) cholesterol, triglycerides, total bilirubin, aspartate amino transferase (AST or SGOT), alanine amino transferase (ALT or SGPT), alkaline phosphatase, gamma-glutamyl transferase (GGTP), serum urea, serum creatinine, serum uric acid, serum calcium and haematologic parameters, red blood cell count, haemoglobin, packed cell volume (PCV), mean cell volume (MCV), mean cell haemoglobin concentra-tion (MCHC), mean cell haemoglobin (MCH), erythrocyte sedimentation rate (ESR), platelet count, total white blood cell count, neutrophil, lymphocyte and eosinophil count, were recorded. All data were entered in Microsoft Access database and was transferred to SPSS for statistical analysis. Additional data on age, dietary habit (vegetarian vs. non-vegetarian), blood group, height and weight were also noted.
All the four centers participated in a monthly External Quality Assessment Programmes (EQAS); Ahmedabad, Chennai and Hyderabad with Bio-Rad and the New Delhi center with the Randox programmes during the period of study.
The methodologies were similar for the analytes tested at the 4 centers except for plasma glucose, alkaline phosphatase and serum albumin. Plasma glucose was measured using the glucose oxidase method at Ahmedabad, Chennai and New Delhi centers and using the hexokinase methodology at the Hyderabad center. For alkaline phosphatase measurement DEA (diethanolamine) buffer was used at Chennai center and AMP (2-amino-1-propanol) buffer was used at the other 3 centers. Albumin was analyzed by bromocresol purple (BCP) method at Hyderabad center and by bromocresol green (BCG) method at the other 3 centers. LDL cholesterol was measured by direct method at Ahmedabad and Chennai. At Hyderabad and New Delhi, it was estimated by calculation using Friedewald equation and directly measured when triglyceride level exceeded 250 mg/dl.
For haematological parameters analyzer from Sysmex (three different models ) were used by the Ahmedabad, Chennai and New Delhi centers and ABX Pentra 120 from company Biomerieux was used by the Hyderabad Center. All four labs used dedicated reagents using standard methodologies. The centers participated in internal and external quality control programs. Three levels of manufacturer’s controls for internal quality control were carried it. All centers participated in external quality program conducted by the All India Institute of Medical Science, New Delhi; additionally, Chennai center participated in the EQAS programmed offered by RCPA, Australia and the Hyderabad center participated in the Randox programme: RIQAS.
Data handlingApproximately a total of 76,000 charts were reviewed at the four centers. Of these 10,665 persons met the inclusion criteria and were included in the study.
Center Ahmedabad Chennai Hyderabad New Delhi
No. of charts approximately screened 11,000 27,000 13,000 25,000
No. fulfilling criteria 812 4,128 4,446 1,279

9
A Research Initiative of AHERF
than 9000 values; RBC (n=8,665), serum urea (n=7,761), serum uric acid (n=7,416), total bilirubin (n=7,982), serum alkaline phosphatase (n=6,535) and serum calcium (n=1,832): Ahmedabad 812, Delhi 182, Hyderabad 838).
Patient demographics: Baseline characteristicsOf the 10,665 patients 7,478 (70.1%) were men and 3,187 (29.9%) were women. The sex ratio at the Hyderabad center was different from the other centers in having a higher percentage of men. Center-wise distribution is given in table 1. Majority of the patients were in the 20-40 age groups. Between centers difference in the age wise distribution was seen. In Ahmedabad most of the patients were in the 41-50 age groups, while at Hyderabad center the majority were in the 21-30 age groups. Chennai and New Delhi had more patients in the 31-40 age groups. (Table 2 and figures 1-4). Equal number of vegetarians and non-vegetarians were observed (4921 vegetarians and 4938 non-vegetarians among 9859 persons with information on dietary habits). The mean body mass index was 24.34 with standard deviation of 3.195.
Table 1: Number of Persons from Each Center
Ahmedabad Chennai Hyderabad New Delhi Total
Number 812 4,128 4,446 1,279 10,665
Male 532 (65.5%) 2,564(62.1%) 3,492(78.5%) 890 (69.6%) 7,469(70.1%)
Female 280 (34.5%) 1,564(37.9%) 952 (21.5%) 389 (30.4%) 3,185(29.9%)
Ahmedabad Chennai Hyderabad New Delhi Total
Age <20 9 141 23 7 180
Age: 21-30 86 940 2148 332 3506
Age: 31-40 198 1239 1254 410 3101
Age: 41-50 279 1112 610 316 2317
Age: 51-60 179 521 364 178 1242
Age: >60 61 175 47 36 319
Table 2: Age-wise distribution between centers
8
Hematological & Biochemical Values in Indian Population
Ethical considerationPatient confidentiality was maintained. Hospital ID numbers were used predominantly. At final analysis no identifiers were used. The study protocol was approved by the Central Ethics Committee.
Statistical AnalysisTo identify the 95% reference interval, the central 95% of the reference distribution was estimated using reference limits at 0.025 fractile (2.5th percentile) for the lower reference limit and 0.975 fractile (the 97.5th percentile) as the upper reference limit. Procedures as recommended by IFCC and NCCLS guidelines were followed. Whenever the analytes did not follow a Gaussian (normal) distribution (as tested by Klmogorov Smirnov test), non-parametric method was used to identify the 0.025 and 0.975 fractiles for the analytes. These fractiles were accompanied by 90% confidence interval around each reference limit. The confidence intervals were identified using pre-defined tables identifying rank numbers for the given sample size. When the sample size exceeded 1000, for which predefined table values were unavailable, normal approximation of binomial distribution was used to identify the confidence intervals.
From these reference values outliers were identified and removed prior to calculating the 2.5% and 97.5% reference limits. After trial with Dixon D/R ratio, use of 3 or 4 standard deviations and 1.5 inter quartile range (IQR) criteria, it was decided to follow the 1.5 IQR procedure to identify outliers. The Q1 and Q3 values were calculated for a given analyte. When a value was lower than Q1 -1.5(Q3-Q1) or higher than Q3+1.5 (Q3-Q1) it was considered as an outlier and removed prior to analysis.
Partitioning of ValuesSeparate reference intervals were calculated for subclass age and gender. Gender based partitioning suggested statistically significant difference in means between males and females for most analytes. The large sample size made small differences in mean statisticatically significant. In order to make the partitioning clinically meaningful, we decided to report separate reference intervals for males and females only if the lower and upper reference limits fell outside the 90 % confidence intervals of the two groups. Otherwise single reference interval for both men and women was calculated.
Some analytes showed consistent increase in mean with age. Graphs with standardized mean vs. age are plotted for the clinician’s interest. As we have shown 3 or 4 parameters in one figure, using the actual mean resulted in wide variation in the y axis because of the difference in actual values (e.g. about 12 gms/dl for haemoglobin, 4000 cells/cumm for WBC and 1.5 lakhs/cumm for Platelets) and hence standardized mean was used to show trend with age.
Age wise partitioning based on decadel interval was done. This resulted in large set of numbers. Hence the data was broadly divided into two groups based on age: upto 40 years and 40 years and above.
ResultsData from 10,665 persons from all four centers were used to establish reference intervals. As the health check package differed slightly between centers, most analytes had data from 9000 or more persons. The following analytes had less

11
A Research Initiative of AHERF
10
Hematological & Biochemical Values in Indian Population
Figure 1: Age wise distribution: All Centers
Sexn Total
Female Male
Centre Chennai 1564 2564 4128
Hyderabad 954 3492 4446
Delhi 389 890 1279
Ahmedabad 280 532 812
Total 3187 7478 10665
Case Processing Summary
Cases
Valid Missing Total
N Percent N Percent N Percent
Centre * sexn 10665 100.0% 0 .0% 10665 100.0%
Centre * Age Grouped 10665 100.0% 0 .0% 10665 100.0%
Centre * Age Group 10665 100.0% 0 .0% 10665 100.0%
Centre * sexn Cross tabulationCount
Age Wise Distribution: All Centers
180
3506 3101
23171242
319
0
500
1000
1500
2000
2500
3000
3500
4000
<20 21-30 31-40 41-50 51-60 >60 Age
Figure :2 All centers sexn distribution
Age Grouped Total
Upto 20 21 - 30 31 - 40 41 - 50 51 - 60 >60
Centre Chennai 141 940 1239 1112 521 175 4128
Hyderabad 23 2148 1254 610 364 47 4446
Delhi 7 332 410 316 178 36 1279
Ahmedabad 9 86 198 279 179 61 812
Total 180 3506 3101 2317 1242 319 10665
Centre * Age Grouped Cross tabulationCount
0
Bar Chart SexnFemale
Male
Chennai Hyderabad Delhi Ahmedabad Centre
Cen
tre
1,000
2,000
3,000
4,000
1,564
2,564
954
3,492
389
890
280532

13
A Research Initiative of AHERF
12
Hematological & Biochemical Values in Indian Population
>60 51 - 60 41 - 5031 - 4021 - 30 Upto 20
Age Grouped
50.0%
40.0%
30.0%
20.0%
10.0%
0.0%
AhmedabaDelhi
Hyderabad
Chennai
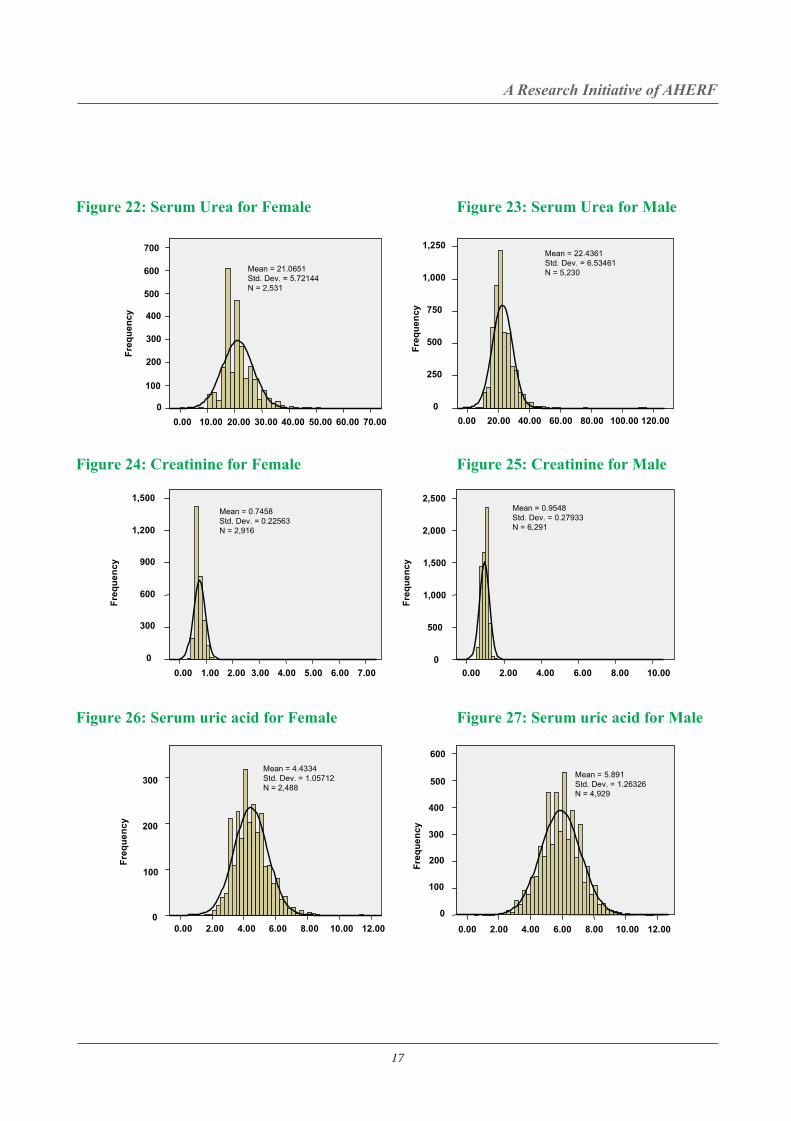
When the reference values were plotted in a frequency histogram, only few analytes followed the Gaussian (normal) distribution. Figure 6 - 47 shows the observed frequency histogram for the various analytes for the entire data of all centers .
Distribution of Reference Values Parametric Versus Non Parametric
Figure 5: All centers – Age wise distribution
AhmedabaDelhiHyderabadChennai
Centre
4,000
3,000
2,000
1,000
0
Cou
nt
519530
1,021
1,808
293
749
3,425
2,320
Bar ChartAge Group
Above 40
Upto 40
Percentage
Age Grouped
Bar Chart
Figure :3 Age Group distribution for all centers
AhmedabaDelhiHyderabadChennai
Centre
2,500
2,000
1,500
1,000
500
0
Cou
nt
>6051 - 6041 - 5031 - 40
Figure :4 All centers age group from upto40 yrs and above 40 yrs distribution
Centre * Age Group Cross tabulation
Count
Age Group Total
Upto 40 Above 40
Centre Chennai 2320 1808 4128
Hyderabad 3425 1021 4446
Delhi 749 530 1279
Ahmedabad 293 519 812
Total 6787 3878 10665
21 - 30Upto 20

13
A Research Initiative of AHERF
12
Hematological & Biochemical Values in Indian Population
>60 51 - 60 41 - 5031 - 4021 - 30 Upto 20
Age Grouped
50.0%
40.0%
30.0%
20.0%
10.0%
0.0%
AhmedabaDelhi
Hyderabad
Chennai
When the reference values were plotted in a frequency histogram, only few analytes followed the Gaussian (normal) distribution. Figure 6 - 47 shows the observed frequency histogram for the various analytes for the entire data of all centers .
Distribution of Reference Values Parametric Versus Non Parametric
Figure 5: All centers – Age wise distribution
AhmedabaDelhiHyderabadChennai
Centre
4,000
3,000
2,000
1,000
0
Cou
nt
519530
1,021
1,808
293
749
3,425
2,320
Bar ChartAge Group
Above 40
Upto 40
Percentage
Age Grouped
Bar Chart
Figure :3 Age Group distribution for all centers
AhmedabaDelhiHyderabadChennai
Centre
2,500
2,000
1,500
1,000
500
0
Cou
nt
>6051 - 6041 - 5031 - 40
Figure :4 All centers age group from upto40 yrs and above 40 yrs distribution
Centre * Age Group Cross tabulation
Count
Age Group Total
Upto 40 Above 40
Centre Chennai 2320 1808 4128
Hyderabad 3425 1021 4446
Delhi 749 530 1279
Ahmedabad 293 519 812
Total 6787 3878 10665
21 - 30Upto 20

15
A Research Initiative of AHERF
14
Hematological & Biochemical Values in Indian Population
Female Histogram Male Histogram
Figure 6: Haemoglobin for Female
400
300
200
100
0
5.00 7.50 10.00 12.50 17.5015.00
Freq
uenc
y
Mean = 12.1757 Std. Dev. = 1.29736 N = 3,165
Freq
uenc
y
Figure 8: PCV for Female
0
60.00 50.00 40.00 30.00 20.00
500
400
300
500
400
300
200
100
Mean = 37.1472 Std. Dev. = 3.53162 N = 3,159
Figure 9: PCV for Male
0
60.00 50.00 40.00 30.00 20.00 10.00
Freq
uenc
y
Mean = 43.8202 Std. Dev. = 4.11811N = 7,302
1,000
800
600
400
200
Figure 7: Haemoglobin for Male
05.00 7.50 10.00 12.50 17.50 20.0015.00
800
1,200
1,000
400
800
600
200
Mean = 14.6958 Std. Dev. = 1.41775 N = 7,314
Freq
uenc
y
Figure 10: ESR for Female
120.00
Freq
uenc
y
300
250
200
150
100
50
0 100.00 80.00 60.00 40.00 20.00 0.00
Mean = 25.1325 Std. Dev. = 16.40851N = 3,017
Figure 11: ESR for Male
120.00 100.00 80.00 60.00 40.00 20.00 0.00 0
Mean = 9.7281 Std. Dev. = 10.5971
N = 6,954
Freq
uenc
y
1,500
1,000
500
8.00 7.00 6.00 5.00 4.00 3.00 2.00 600
200
0
400
800
600
1,000
Figure 12: RBC for Female
Mean = 4.374Std. Dev. = 0.50154N = 2,594
8.00 7.00 6.00 5.00 4.00 3.00 2.00 1.00 0
Freq
uenc
y
Figure 13: RBC for Male
3,000
2,500
2,000
1,500
1,000
500
Mean = 5.0569 Std. Dev. = 0.58668N = 6,071
20000.00 15000.00 10000.00 5000.00 0.00
Figure 14: WBC for Female
200
300
100
0
Mean = 6925.3211Std. Dev. = 1805.75792N = 3,161
25000.00 20000.00 15000.00 10000.00 5000.00 0.00
Freq
uenc
y
Figure 15: WBC for Male
1,000
800
600
400
200
0
Mean = 6750.2877Std. Dev. = 1613.76755N = 7,300
Freq
uenc
yFr
eque
ncy

17
A Research Initiative of AHERF
16
Hematological & Biochemical Values in Indian Population
Figure 16: Platelet count for Female Figure 17: Platelet count for Male
Figure 18: Fasting Glucose for Female
Figure 20 Two hours post glucose for Female Figure 21 Two hours post glucose for Male
200 0
800000.00 600000.00 400000.00 200000.00 0.00
400.00 300.00 200.00 100.00 0.00 400.00 300.00 200.00 100.00
200.00 150.00 100.00 50.00
800
600
300
250
200
150
100
50
800000.00600000.00400000.00200000.000.00
800
600
400
200
0
Freq
uenc
y Fr
eque
ncy
Freq
uenc
y
Freq
uenc
y Fr
eque
ncy
Freq
uenc
y
Mean = 248077.0865Std. Dev. = 71148.81387N = 7,249
Mean = 257531.3857Std. Dev. = 81734.87388 N = 3,132
400
300
200
100
0
1,200
1,000
800
600
400
200
0
2,000
1,500
1,000
500
0
400
600
800
200
0150.00 200.00 100.00 50.00 0.00
Mean = 102.72Std. Dev. = 21.68393N = 6,401
Mean = 103.881Std. Dev. = 20.89765N = 2,967
Mean = 92.8406Std. Dev. = 17.77724N = 3,117
Mean = 95.6954Std. Dev. = 18.03939N = 7,068
Figure 19: Fasting Glucose for Male
Figure 22: Serum Urea for Female Figure 23: Serum Urea for Male
Figure 24: Creatinine for Female Figure 25: Creatinine for Male
Figure 26: Serum uric acid for Female Figure 27: Serum uric acid for Male
70.00 60.00 50.00 40.00 30.00 20.00 10.00 0.00 0
7.00 6.00 5.00 4.00 3.00 2.00 1.00 0.00
1,500
1,200
900
600
300
0
12.00 10.00 8.00 6.00 4.00 2.00 0.00
300
200
100
0
Freq
uenc
y Fr
eque
ncy
Freq
uenc
y
700
600
500
400
300
200
100
Mean = 21.0651 Std. Dev. = 5.72144 N = 2,531
120.00 100.00 80.00 60.00 40.00 20.00 0.00
1,250
1,000
750
500
250
0
Mean = 22.4361 Std. Dev. = 6.53461 N = 5,230
Mean = 0.7458 Std. Dev. = 0.22563 N = 2,916
10.00 8.00 6.00 4.00 2.00 0.00
2,500
2,000
1,500
1,000
500
0
Freq
uenc
y Fr
eque
ncy
Freq
uenc
y
Mean = 0.9548 Std. Dev. = 0.27933 N = 6,291
Mean = 4.4334 Std. Dev. = 1.05712 N = 2,488
12.00 10.00 8.00 6.00 4.00 2.00 0.00
600
500
400
300
400
500
600
200
100
0
Mean = 5.891 Std. Dev. = 1.26326 N = 4,929

19
A Research Initiative of AHERF
18
Hematological & Biochemical Values in Indian Population
400.00 300 .00 200.00 100.00
300.00 250.00 200.00 150.00 100.00 50.00 0.00
400
200
100
0 300.00 250.00 200.00 150.00 100.00 50.00 0.00
140.00 120.00 100.00 80.00 60.00 40.00 20.00 0.00
400.00 300.00 200.00 100.00
Figure 28: Total cholesterol for Female Figure 29: Total cholesterol for Male
Freq
uenc
y Fr
eque
ncy
Freq
uenc
y
Freq
uenc
y Fr
eque
ncy
Freq
uenc
y
100
50
0
300
250
150
200
Mean = 178.9463 Std. Dev. = 37.88448 N = 3,107
Mean = 181.2666 Std. Dev. = 37.7302 N = 6,958
600
500
400
300
200
100
0
Figure 30: HDL cholesterol for Female Figure 31: HDL cholesterol for Male
Figure 32: LDL cholesterol for Female Figure 33: LDL cholesterol for Male
400
300
200
100
0 140.00 120.00 100.00 80.00 60.00 40.00 20.00 0.00
1,000
800
600
400
200
0
Mean = 41.4808 Std. Dev. = 10.5337 N = 6,815
Mean = 48.327 Std. Dev. = 11.27615 N = 3,095
300
700
600
500
400
300
200
100
0
Mean = 110.7078 Std. Dev. = 30.93961 N = 3,090
Mean = 115.6564 Std. Dev. = 31.16252 N = 6,782
800.00 600.00 400.00 200.00 0.00
600
500
400
300
200
100
0 2000.00 1500.00 1000.00 500.00 0.00
Figure 34: Triglycerides for Female Figure 35: Triglycerides for Male
Freq
uenc
y
Freq
uenc
y
Mean = 116.2145 Std. Dev. = 60.45965 N = 2,937
1,500
1,000
500
0
2,000
2,500
Mean = 143.1771 Std. Dev. = 87.50548 N = 6,646
30.00 25.00 20.00 15.00 10.00 5.00 0.00
4,000
3,000
2,000
1,000
0 25.00 20.00 15.00 10.00 5.00 0.00
2,000
1,500
1,000
500
0
Figure 36: Bilirubin total for Female Figure 37: Bilirubin total for Male
Freq
uenc
y
Freq
uenc
y
Mean = 0.682 Std. Dev. = 0.93647 N = 2,622
Mean = 0.8093 Std. Dev. = 0.6674 N = 5,381
10.00 9.00 8.00 7.00 6.00 5.00 4.00 3.00
400
300
200
100
0
600
500
10.00 9.00 8.00 7.00 6.00 5.00 4.00 3.00 Fr
eque
ncy
Freq
uenc
y
Figure 38: Total protein for Female
Mean = 7.6003 Std. Dev. = 0.48821 N = 2,878
1,200
1,000
800
600
400
200
0
Mean = 7.6681 Std. Dev. = 0.47685 N = 6,082
Figure 39: Total protein Male

19
A Research Initiative of AHERF
18
Hematological & Biochemical Values in Indian Population
400.00 300 .00 200.00 100.00
300.00 250.00 200.00 150.00 100.00 50.00 0.00
400
200
100
0 300.00 250.00 200.00 150.00 100.00 50.00 0.00
140.00 120.00 100.00 80.00 60.00 40.00 20.00 0.00
400.00 300.00 200.00 100.00
Figure 28: Total cholesterol for Female Figure 29: Total cholesterol for Male
Freq
uenc
y Fr
eque
ncy
Freq
uenc
y
Freq
uenc
y Fr
eque
ncy
Freq
uenc
y
100
50
0
300
250
150
200
Mean = 178.9463 Std. Dev. = 37.88448 N = 3,107
Mean = 181.2666 Std. Dev. = 37.7302 N = 6,958
600
500
400
300
200
100
0
Figure 30: HDL cholesterol for Female Figure 31: HDL cholesterol for Male
Figure 32: LDL cholesterol for Female Figure 33: LDL cholesterol for Male
400
300
200
100
0 140.00 120.00 100.00 80.00 60.00 40.00 20.00 0.00
1,000
800
600
400
200
0
Mean = 41.4808 Std. Dev. = 10.5337 N = 6,815
Mean = 48.327 Std. Dev. = 11.27615 N = 3,095
300
700
600
500
400
300
200
100
0
Mean = 110.7078 Std. Dev. = 30.93961 N = 3,090
Mean = 115.6564 Std. Dev. = 31.16252 N = 6,782
800.00 600.00 400.00 200.00 0.00
600
500
400
300
200
100
0 2000.00 1500.00 1000.00 500.00 0.00
Figure 34: Triglycerides for Female Figure 35: Triglycerides for Male
Freq
uenc
y
Freq
uenc
y
Mean = 116.2145 Std. Dev. = 60.45965 N = 2,937
1,500
1,000
500
0
2,000
2,500
Mean = 143.1771 Std. Dev. = 87.50548 N = 6,646
30.00 25.00 20.00 15.00 10.00 5.00 0.00
4,000
3,000
2,000
1,000
0 25.00 20.00 15.00 10.00 5.00 0.00
2,000
1,500
1,000
500
0
Figure 36: Bilirubin total for Female Figure 37: Bilirubin total for Male
Freq
uenc
y
Freq
uenc
y
Mean = 0.682 Std. Dev. = 0.93647 N = 2,622
Mean = 0.8093 Std. Dev. = 0.6674 N = 5,381
10.00 9.00 8.00 7.00 6.00 5.00 4.00 3.00
400
300
200
100
0
600
500
10.00 9.00 8.00 7.00 6.00 5.00 4.00 3.00
Freq
uenc
y
Freq
uenc
y
Figure 38: Total protein for Female
Mean = 7.6003 Std. Dev. = 0.48821 N = 2,878
1,200
1,000
800
600
400
200
0
Mean = 7.6681 Std. Dev. = 0.47685 N = 6,082
Figure 39: Total protein Male

21
A Research Initiative of AHERF
20
Hematological & Biochemical Values in Indian Population
Freq
uenc
y
2.00 3.00 4.00 5.00 6.00 7.00 8.00 9.00 8.00 7.00 6.00 5.00 4.00 3.00 2.00
1000.00 800.00 600.00 400.00 200.00 0.00 500.00 400.00 300.00 200.00 100.00 0.00
7.0 6.0 5.0 4.0 3.0 2.0 1.0
Freq
uenc
y
Freq
uenc
y
Freq
uenc
y
Freq
uenc
y
Freq
uenc
y
Figure 40: Albumin for Female Figure 41: Albumin for Male
Mean = 4.3036 Std. Dev. = 0.33999 N = 2,881
600
500
400
300
200
100
0
1,500
1,000
500
0
Mean = 4.4956 Std. Dev. = 0.33466 N = 6,080
Figure 42: Globulin for Female
600
500
400
300
200
100
0 8.0 6.0 4.0 2.0 0.0
1,200
1,000
600
400
200
0
800
Mean = 3.304 Std. Dev. = 0.4634 N = 2,878
Figure 43: Globulin for Male
Mean = 3.178 Std. Dev. = 0.4307 N = 6,075
2,000
1,500
1,000
500
0
Figure 44:AST for Female Figure 45: AST for Male
Mean = 27.811 Std. Dev. = 15.14321 N = 6,132
3,000
2,500
2,000
1,500
1,000
500
0
Mean = 24.295 Std. Dev. = 20.90409 N = 2,883
500.00 400.00 300.00 200.00 100.00 0.00
Figure 46 GGTP for Female Figure 47 GGTP for Male
Mean = 23.9796 Std. Dev. = 18.55378 N = 2,892
1,400
1,200
1,000
800
600
400
200
0
Freq
uenc
y
500.00 400.00 300.00 200.00 100.00 0.00
2,000
1,500
1,000
500
0
Freq
uenc
y
Mean = 35.3285 Std. Dev. = 25.72435 N = 6,101
Parametric method of identifying reference intervals has been used for those analytes showing Gaussian distribution. For the rest, non-parametric method is adopted. At all 4 centers parametric distribution was observed for serum uric acid and total cholesterol. Other analytes for which parametric distribution was observed are
• Ahmedabad Females: RBC, PCV, WBC, platelet count, fasting glucose, Serum Urea, HDL cholesterol and serum calcium• Ahmedabad Males: RBC, neutrophil count. • Hyderabad Females: alkaline phosphatase and serum calcium.• Hyderabad Males: alkaline phosphatase• New Delhi Females: hemoglobin, neutrophil count, lymphocyte count, platelet count, 2hour post glucose, serum HDL cholesterol, LDL cholesterol and total protein.• New Delhi Males: hemoglobin, neutrophil, lymphocyte and LDL cholesterol.• For Chennai Non-parametric distribution was observed.
Reference Intervals for the analytesTable 3 lists the reference intervals for the analytes for the two genders. As the methodology for ALT and alkaline phosphatase were different between the four centers, their reference intervals has been reported separately for each center in Table 5 – 9.

23
A Research Initiative of AHERF
22
Hematological & Biochemical Values in Indian Population
Analyte Female Male 90% confidence
interval for 2.5%
90% Confidence
interval for 97.5%
Haemoglobin
(gm/dL)
9.9 – 14.3 12.3 – 17 F = 9.80 - 10.00
M = 12.20 - 12.40
F = 14.20 - 14.40
M = 17.00 - 17.10
PCV
(%)
30 – 43 37 – 51 F = 30.00 - 31.00
M = 37.00
F = 43.00 - 44.00
M = 50.00 - 51.00
MCV
(fl)
72 – 96 78 – 97 F = 71.80 - 73.00
M = 77.10 - 78.00
F = 96.00
M = 96.00 - 97.00
MCH
(uug)
23 – 32 26 – 33 F = 22.00 - 23.00
M = 26.00
F = 32.00
M = 32.30 - 33.00
MCHC
(grms/dl )
30 – 35 31 – 36 F = 30.00
M = 31.00
F =
35.00
M = 36.00
ESR
(mm/hour)
4 - 55 2 – 22 F = 4.00
M = 2.00
F = 55.00 - 57.00
M = 22.00 - 23.00
RBC
(Millions/µL)
3.5 – 5.2 4.5 – 5.5 F = 3.50 - 3.60
M = 4.50
F = 5.10 - 5.30
M = 5.50
WBC
(Cells/µL)
4,000 –
10,400
4,200 –
9,800
F = 4,000.00 – 4,100.00
M = 4,200.00 - 4,300.00
F = 10 ,300.00 - 10 ,600.00
M = 9,800.00 - 9,900.00
Neutrophils
(%)
44 – 75 42 – 74 F = 44.00 - 45.00
M = 42.00 - 43.00
F = 74.00 - 75.00
M = 73.00 - 74.00
Eosinophils
(%)
1 – 8 1 – 8 F = 1.00
M = 1.00
F = 8.00
M = 8.00
Lymphocytes
(%)
18 – 45 18 – 45 F = 18.00
M = 18.00 - 19.00
F = 45.00 - 46.00
M = 45.0
Basophils
(%)
0 – 0 0 - 0 F = 0 - 0
M = 0 - 0
F = 0 - 0
M = 0 - 0
Monocytes
(%)
2 – 9 2 – 10 F = 2.00
M = 2.00
F = 8.00 - 9.00
M = 10.00
Platelet count
(Lakh/µL)
1.31 – 4.24 1.3 – 3.8 F = 1,23,000.0 – 1,30,000.0
M = 1,27,000.0 – 1,30,000.0
F = 4,20,000.0 – 4,30,000.0
M = 3,77,000.0 – 3,81,000.0
Table 3: Reference Intervals for the Analytes from all Centers with their 90% Confidence Intervals
Fasting glucose (mg/dL)
76 – 108 78 – 110 F = 75.00 - 76.00 M = 78.00
F = 107.00 - 109.00 M =110.00
2 hr Post
glucose (mg/dL)
71 – 136 68 – 136 F = 70.00 - 72.00
M = 67.00 - 70.00
F = 135.00 - 137.00
M = 134.00 - 137.00
Serum Urea
(mg/dL)
11 – 31 13 – 35 F = 11.00 - 12.00
M =12.00 - 13.00
F = 31.00
M =34.00 - 35.00
S. Creatinine (mg/dL)
0.6 – 0.9 0.7 – 1.2 F = 0.60 M =0.60 -0 .70
F =0.90 M = 1.20 - 1.20
S. Uric acid
(mg/dL)
2.7 – 6.5 3.5 – 8.2 F = 2.60 - 2.80
M = 3.40 - 3.50
F = 6.40 - 6.60
M = 8.20 - 8.30
Total
Cholesterol
(mg/dL)
117 – 252 115 – 254 F = 115.00 - 120.00
M =113.00 - 116.00
F = 249.00 - 256.00
M = 253.00 - 256.00
HDL
(mg/dL)
29 – 70 25 – 61 F = 28.00 - 30.00
M = 24.00 - 25.00
F = 69.00 - 70.00
M = 60.00 - 61.00
LDL
(mg/dL)
61 – 170 60 – 176 F = 59.00 - 62.00
M = 59.00 - 61.00
F =168.00 - 173.00
M = 174.00 - 177.00
Triglycerides
(mg/dL)
52 – 207 55 – 267 F = 51.00 - 53.00
M = 54.00 - 56.00
F = 203.00 - 210.00
M = 263.00 - 272.00
TC/HDL
ratio
2.3 – 6 2.6 – 7 F = 2.20 - 2.30
M = 2.50 - 2.60
F = 6.00
M =7.00
T. Bilirubin
(mg/dL)
0.3 – 1.0 0.39 – 1.2 F = 0.30
M = 0.30 -0.40
F =1.00
M = 1.20 - 1.28
T. Protein
(g/dL)
6.7 – 8.5 6.8 – 8.5 F = 6.70 - 6.80
M = 6.80 - 6.90
F = 8.50
M = 8.50 - 8.60
Albumin
(g/dL)
3.7 – 4.9 3.9 – 5.1 F = 3.70
M = 3.90
F = 4.90
M = 5.10
Globulin
(g/dL)
2.5 – 4.2 2.4 – 3.9 F = 2.40 - 2.50
M = 2.40
F = 4.10 - 4.20
M = 3.90 - 4.00
AST 12 – 37 14 – 42 F =12.00 - 13.00 F = 36.00 - 37.00
AST
(U/L)
12 – 37 14 – 42 F =12.00 - 13.00
M =14.00
F = 36.00 - 37.00
M = 42.00 - 43.00
GGTP
(U/L)
10 – 39 13 – 61 F = 10.00
M = 13.00
F = 39.00 - 40.00
M = 60.00 - 62.00

25
A Research Initiative of AHERF
24
Hematological & Biochemical Values in Indian Population
Haemoglobin in gms/dl, PCV: Packed Cell Volume in %, MCV: Mean cell volume in fl, MCHC: Mean cell Haemoglobin concentration in grms/dl, MCH: Mean Cell Hemoglobin in uug, RBC: Red blood cell count in millions/cumm, ESR: Erythrocyte sedimentation rate in mm/hr WBC : White blood cell count in cells/cumm, Platelet count: lakhs/cumm, : Fasting glucose in mgs/dl, 2 hr PG: 2 hour post glucose (75gms) in mgs/dl, TC: Total cholesterol in mgs/dl, HDL cholesterol: High density lipoprotein Cholesterol in mgs/dl, LDL cholesterol: Low density lipoprotein Cholesterol in mgs/dl, triglycerides in mgs/dl, TC/HDL: Total cholesterol/HDL ratio. Serum Urea: Serum Urea in mgs/dl, S.Creatinine: Serum creatinine in mgs/dl S.Uric acid: Serum uric acid in mgs/dl, S.Calcium: Serum calcium in mgs/dl. T.Protein : total protein in gms/dl, Albumin and globulin in gms/dl, SGOT and GGTP in IU/l
Gender Based PartitioningThe reference intervals were different between males and females. Statistical differences between the means were observed for all analytes except for MCV. However the magnitude of the difference was small. Large differences were observed for the following parameters for which separate reference intervals for the two genders must be considered: Haemoglobin, PCV, ESR, serum creatinine, uric acid, HDL cholesterol, triglycerides, ALT and GGTP.
Age based PartitioningTo study the effect of age on reference interval graphs were plotted between the mean analyte value and age. Figure 48 – 52 shows the graphs for some analytes. Mean blood glucose and lipid profile (Total cholesterol, HDL cholesterol, LDL cholesterol and Triglyceride) increased with age.
Male
Female
sexn
>6051 - 6041 - 5031 - 4021 - 30Upto 20
Age Grouped
0.50000
0.00000
-0.50000
-1.00000
Mea
n
0.50000
0.00000
-0.50000
-1.00000
Mea
n
Zscore: platelet count
Zscore(WBC)
Zscore(Hb)
Figure 48: Mean Haemoglobin, White blood cell count and Platelet count at Different Age Groups
ela
meF
ela
M
sexn
>6051 - 6041 - 5031 - 4021 - 30Upto 20
Age Grouped
0.40000
0.20000
0.00000
-0.20000
-0.40000M
ean
0.40000
0.20000
0.00000
-0.20000
-0.40000
Mea
n
Zscore: 2 hr postglucose
Zscore: fastglucose
Figure 49: Mean for Lipid profile at Different Age Groups
e l aM
sexn
>6051 - 6041 - 5031 - 4021 - 30Upto 20
Age Grouped
0.50000
0.00000
-0.50000
-1.00000
Mea
n
0.50000
0.00000
-0.50000
-1.00000
Mea
n
Zscore(Triglycerides)
Zscore: TotalCholesterol
Zscore: HDL chol
Zscore: LDL
Figure 50: Mean Glucose with Age
Female

25
A Research Initiative of AHERF
24
Hematological & Biochemical Values in Indian Population
Haemoglobin in gms/dl, PCV: Packed Cell Volume in %, MCV: Mean cell volume in fl, MCHC: Mean cell Haemoglobin concentration in grms/dl, MCH: Mean Cell Hemoglobin in uug, RBC: Red blood cell count in millions/cumm, ESR: Erythrocyte sedimentation rate in mm/hr WBC : White blood cell count in cells/cumm, Platelet count: lakhs/cumm, : Fasting glucose in mgs/dl, 2 hr PG: 2 hour post glucose (75gms) in mgs/dl, TC: Total cholesterol in mgs/dl, HDL cholesterol: High density lipoprotein Cholesterol in mgs/dl, LDL cholesterol: Low density lipoprotein Cholesterol in mgs/dl, triglycerides in mgs/dl, TC/HDL: Total cholesterol/HDL ratio. Serum Urea: Serum Urea in mgs/dl, S.Creatinine: Serum creatinine in mgs/dl S.Uric acid: Serum uric acid in mgs/dl, S.Calcium: Serum calcium in mgs/dl. T.Protein : total protein in gms/dl, Albumin and globulin in gms/dl, SGOT and GGTP in IU/l
Gender Based PartitioningThe reference intervals were different between males and females. Statistical differences between the means were observed for all analytes except for MCV. However the magnitude of the difference was small. Large differences were observed for the following parameters for which separate reference intervals for the two genders must be considered: Haemoglobin, PCV, ESR, serum creatinine, uric acid, HDL cholesterol, triglycerides, ALT and GGTP.
Age based PartitioningTo study the effect of age on reference interval graphs were plotted between the mean analyte value and age. Figure 48 – 52 shows the graphs for some analytes. Mean blood glucose and lipid profile (Total cholesterol, HDL cholesterol, LDL cholesterol and Triglyceride) increased with age.
Male
Female
sexn
>6051 - 6041 - 5031 - 4021 - 30Upto 20
Age Grouped
0.50000
0.00000
-0.50000
-1.00000
Mea
n
0.50000
0.00000
-0.50000
-1.00000
Mea
n
Zscore: platelet count
Zscore(WBC)
Zscore(Hb)
Figure 48: Mean Haemoglobin, White blood cell count and Platelet count at Different Age Groups
ela
meF
ela
M
sexn
>6051 - 6041 - 5031 - 4021 - 30Upto 20
Age Grouped
0.40000
0.20000
0.00000
-0.20000
-0.40000
Mea
n
0.40000
0.20000
0.00000
-0.20000
-0.40000
Mea
n
Zscore: 2 hr postglucose
Zscore: fastglucose
Figure 49: Mean for Lipid profile at Different Age Groups
e l aM
sexn
>6051 - 6041 - 5031 - 4021 - 30Upto 20
Age Grouped
0.50000
0.00000
-0.50000
-1.00000
Mea
n
0.50000
0.00000
-0.50000
-1.00000
Mea
n
Zscore(Triglycerides)
Zscore: TotalCholesterol
Zscore: HDL chol
Zscore: LDL
Figure 50: Mean Glucose with Age
Female

27
A Research Initiative of AHERF
26
Hematological & Biochemical Values in Indian Population
Figure 51: Mean Serum Urea, Serum Creatinine And Uric Acid Vs Age
ela
meF
ela
M
sexn
>6051 - 6041 - 5031 - 4021 - 30Upto 20
Age Grouped
0.50000
0.00000
-0.50000
-1.00000
Mea
n
0.50000
0.00000
-0.50000
-1.00000
Mea
n
Zscore: SerumUric Acid
Zscore(Crea)Zscore: Blood Urea
ela
meF
ela
M
sexn
>6051 - 6041 - 5031 - 4021 - 30Upto 20
Age Grouped
1.20000
0.90000
0.60000
0.30000
0.00000
-0.30000
-0.60000
Mea
n
1.20000
0.90000
0.60000
0.30000
0.00000
-0.30000
-0.60000
Mea
n
Zscore: Alk PhosZscore(GGTP)Zscore(SGOT)Zscore(SGPT)
Figure 52: Transaminases VS. Age
Reference intervals were calculated for two age groups less than forty and forty and above.Table 4 lists the reference intervals for these 2 age groups.
Table 4: Reference Intervals for persons less than 40 and more than 40 years of age.
Female Female Male Male
Analyte Less than 40 More than 40 Less than 40 More than 40
Haemoglobin(grms/dl)
9.6 – 14.3 10 – 14.4 12.6 – 17.1 11.7 – 16.6
PCV(%)
30 – 43 30 – 43.3 37 – 51 35 – 49
MCV(fl)
70 – 96 74 – 96 78 – 97 77 – 99
MCHC(grms/dl)
30 – 35 30 – 35 31 – 36 31 – 36
ESR( mm/hr)
4 – 50 5 – 60 2 – 18 2 – 30
RBC(millions/cumm)
3.5 – 5.3 3.6 – 5.16 4.5 – 6 4 – 5.5
WBC( cells/cumm)
4200 – 10300 4000 – 10600 4200 – 9700 4200 – 9800
Neutrophils(%)
45 – 75 44 -75 42 – 73 43 – 74
Lymphocytes (%)
18 – 44 18 – 45 18 – 45 18 – 45
Eosinophils (%)
1 – 7 1 – 8 1 – 8 1 -10
Monocytes ( %)
2 – 9 2 -8 2 -10 2 – 10
Platelets(cells/cumm)
1.3 – 4.21 1.25 – 4.3 1.38 – 3.8 1.2 – 3.84
Fasting glucose 75 – 104 78 – 110 78 – 108 80 – 116
(mg/dl)

29
A Research Initiative of AHERF
28
Hematological & Biochemical Values in Indian Population
Post 2 hr glucose (mg/dl)
70 – 129 72 – 147 67 – 132 70 – 145
Serum Urea
(mg/dl)13 – 27 12 – 33 12 – 33 13 – 36
S. Creatinine
(mg/dl)0.5 – 1 0.6– 0.9 0.7 – 1.2 0.7 – 1.3
Uric acid ( mg/dl )
2.6 – 6.3 2.7 – 6.7 3.5 – 8.3 3.5 – 8.3
Total cholesterol
(mg/dl )114 – 233 130 – 269 113 – 248 124 – 263
HDL cholesterol (mg/dl )
28 – 66 31 – 75 25 – 59 26 – 65
LDL cholesterol (mg/dl)
58 – 155 69 – 182 59 – 171 64 – 180
Triglycerides
(mg/dl)
51 – 183 58 – 230 53 – 259 58 – 277
TC/HDL( mg/dl )
2.2 – 5 2.4 – 6 2.6 – 7 2.6 – 7
T. Bilirubin (mg/dl )
0.3 – 1.0 0.3 - 1.0 0.4 – 1.2 0.3 – 1.3
T. Protein(grms/dl )
6.8 – 8.5 6.7 – 8.5 6.9 – 8.6 6.7 – 8.5
Albumin ( grms/dl)
3.7 – 4.9 3.7 – 4.8 4 – 5.2 3.9 – 5
Globulin( grms/dl )
2.5 – 4.2 2.4 – 4.2 2.4 – 3.9 2.4 – 4
SGOT
(IU/L)12 – 35 12 – 37 14 – 45 13 – 42
GGTP (IU/L)
10 – 38 10 – 42 13 – 62 12 – 62
Calcium 0 – 10 0 – 10 0 – 10 0 - 10
Figure 53: Regional Profile of Persons from the Chennai Center
841, 20%
1031, 25%
2017, 49%
239, 6%
NESWest Bengal
Tamilnadu
Others
Analysis between the two age groups showed high er reference intervals for ESR, fasting blood glucose, two hour post (75grms) blood glucose, total cholesterol, HDL cholesterol, LDL cholesterol and triglycerides in the above 40 years age group. Lower haemoglobin and platelet count were observed in groups of age over 40 years.
Center based partitioningTo identify any regional differences reference intervals were identified for the centers separately. While the persons included at each center was largely reflective of the local population at the centers Ahmedabad, Chennai, Hyderabad andNew Delhi center included a fair proportion of persons from West Bengal and Assam. Figure 53 illustrates the proportion of persons from different states
NES: North Eastern States of India and Bangladesh
Table 5 – 9 shows the derived reference intervals for four centers, the value in red and those value in bracket are the currently used reference values.

31
A Research Initiative of AHERF
30
Hematological & Biochemical Values in Indian Population
Table 5: Reference Interval for Haematological Parameters and the Existing Reference Values in Red
Hemoglobin M (gm/dL)
11.9-16.6 (11.3-15.7)
12.4-17 (13 - 18)
13-17.2 (13 - 18)
11.5-16.8 (13 - 18)
Hemoglobin F (gm/dL)
9.9 - 14.2 (11.3-15.7)
10.4 – 14.6 (11 – 16)
10.3 – 14.8 (11 – 16)
9.4 – 14 (11.5 – 16.5)
PCV M 37- 49 37 – 49 39 – 52 35 – 49 (%) (39.8 – 52.2) (39-54) (39-54) (40 – 54)
PCV F 32 – 44 31 – 42 31 – 45 30 – 43 (%) (39.8 – 52.2) (34 – 48) (34 – 48) (37 – 47)
MCV M 79 – 96 77 – 96 78 – 97 77 -97 (fl) (80.3 – 103.4) (75 – 95) (75 – 95) (75 – 95)
MCV F 72 – 96 77 – 96 70 – 95 72 -97 (fl) (80.3 – 103.4) (75 – 95) (75 – 95) (75 – 95)
(%) (31.8 – 36.6) (31 – 36) (31 – 36)
MCHC M 31 – 35 33 – 36 31 – 36 32 – 35
(32 – 36)
MCHC F 30 – 35 32 – 35 31 – 36 29- 35 (%) (31.8 – 36.6) (31 – 36) (31 – 36) (32 – 36)
MCH M 26 – 33 25 – 33 26 – 33 25 – 33 (pg) (26 – 34.4) (26 – 32) (26 – 32) (26 – 32)
MCH F 23 – 32 25 – 33 23 – 32 24 – 32 (pg) (26 – 34.4) (26 – 32) (26 – 32) (26 – 32)
RBC M 4.07 – 5.9 Not-Available 4 – 6 3.9 – 6 (Millions/µL) (3.6 – 5.3) (4.2 – 6.5) (4.2 – 6.5) (4.5 – 6.5)
RBC F 3.73 – 5.23 Not-Available 4 – 6 3.5 – 5.1 (Millions/µL) (3.6 – 5.3) (3.7 – 5.6) (3.7 – 5.6) (3.8 – 5.8)
ESR M 2 – 40 1 – 15 2 – 16 2 – 30 (mm/hour) (NA) ( 0 – 20) ( 0 – 20) ( 0 – 15)
ESR F 3 – 56 2 – 40 4 – 40 5 – 63 (mm/hour) (NA) ( 0 – 30) ( 0 – 30) ( 0 – 20)
WBC 3900 - 9200 4200 – 9700 4200 – 9500 4200 – 10,400 (Cells/µL) (2600 – 8800) (4000 – 11000) (4000 – 11000) (4000 – 11000)
Neutrophils 45 – 74 % 46 – 78% 44 – 72% 41 – 74% (%) (39-69) (45-75) (45-75) (40-75)
Ahmedabad Delhi Hyderabad Chennai
Lymphocytes 20 – 46% 15 – 45% 20 – 44% 18 – 47%
Table 6: Reference Interval for blood glucose and Lipid profile
M: Male, F: Female, Fast Glu: Fasting glucose in mgs/dl, 2 hr PG: 2 hour post glucose (75gms) in mgs/dl, TC: Total cholesM: Male, F: Female, Hemoglobin in gms/dl, PCV: Packed Cell Volume in %, MCV: Mean cell volume in fl, MCHC: Mean cell Hemoglobin concentration ing/dl, MCH: Mean Cell Hemoglobin in uug, RBC: Red blood cell count in millions/cumm, ESR: Erythrocyte sedimentation rate in mm/hr
WBC: White blood cell count in cells/cumm, Platelet count: lakhs/cumm, M:male, F: female
The Chennai Center had a lower platelet count, haemoglobin and higher ESR and eosinophil count compared to the other centers.
Reference interval for blood glucose and lipid profileTable 7 shows the reference interval for these parameters. At most centers no difference between the 2 genders were observed for fasting glucose, 2 hour post glucose (75gms) values, total cholesterol and LDL cholesterol. However triglycerides and HDL cholesterol were different for males and females.
(%)
Eosinophils 1 – 6% 1 – 7% 1 -8% 1 – 10% (%) (NA) (1 – 6) (1 – 6) (1 – 6) Monocytes 2 – 8% 1 – 10% 3 – 10% 2 – 9% (%) (NA) ( 1- 10) ( 1 – 10) (2 – 10)
Basophils 0 – 0 % 0 – 0% 0 – 0% 0 -0 % (%) (NA) ( 0 – 1) ( 0 – 1) ( 0 – 1)
Platelet count M 1.5 – 3.6 1.3 – 3.65 1.5 – 3.8 1.15 – 3.92 (Lakhs/ µL) (1.34 – 3.77) (1.4 – 4.4) (1.4 – 4.4) (1.5 – 4.5)
Platelet count F 1.44 – 3.97 1.01 – 3.86 1.6 – 4.4 1.2 – 4.10 (Lakhs/ µL) (1.34 – 3.77) (1.4 – 4.4) (1.4 – 4.4) (1.5 – 4.5)
(18-48) (20 – 45) (20 – 45) (20 – 45)
Fast Glu M (mg/dL)
82 – 110 76 – 108 77 – 110
Fast Glu F (mg/dL)
Same 74 – 102 Same Same
2 Hr PG M (mg/dL)
70 – 130 85 - 126
Ahmedabad Delhi Hyderabad Chennai
79 – 110
66 - 14565 - 133
2 Hr PG F Same 58 - 133 Same 85 – 130

33
A Research Initiative of AHERF
32
Hematological & Biochemical Values in Indian Population
Ld/gm(
TC M (mg/dL)
127 – 265 (<200)
116 – 252 (<200)
113 – 248 (<200)
118 – 256 (<200)
TC F
(mg/dL)
115 – 251
(<200)
Same
(<200)
Same
(<200)
Same
(<200)
HDL
Cholesterol M
31 – 69
(>55)
26 – 59
( 40 – 60)
23 – 50
( 40 – 60)
31 – 65
(>40)
HDL
Cholesterol –F
(mg/dL)
31 – 77
(>65)
30 – 68
( 40 – 60)
26 – 57
( 40 – 60)
34 – 70
(>40)
LDL
Cholesterol –M
(mg/dL)
65 – 198
(<130)
63 – 177
(100 – 129)
61 -175
(100 – 129)
60 – 168
(<130)
LDL
Cholesterol –F
(mg/dL)
61 – 179
(<130)
56 – 163
(100 – 129)
Same
(100 – 129)
Same
(<130)
TgL- M
(mg/dL)
66 – 274
(<200)
56 – 266
(<150)
54 – 260
(<150)
54 – 270
(<150)
TgL –F (mg/dL)
48 – 200 (<200)
53 – 196 (<150)
51 – 200 (<150)
53 – 217 (<150)
TC/HDL –M ratio
2.5 – 6.3
TC/HDL –F
ratio
2.2 – 5.8
M: Male, F: Female, Fast Glu: Fasting glucose in mgs/dl, 2 hr PG: 2 hour post glucose (75gms) in mgs/dl, TC: Total cholesterol in mgs/dl, HDL cholesterol: High density lipoprotein in mgs/dl, LDL cholesterol: Low density lipoprotein in mgs/dl, TgL: triglycerides in mgs/dl , TC/HDL: Total cholesterol / HDL ratio
Between Centers, Ahmedabad had higher total cholesterol, HDL cholesterol and LDL cholesterol levels while Hyderabad Center had higher 2-hour post glucose (75gms) levels. As the cholesterol levels increase with age and Ahmedabad Center had an older population, subgroup analysis was done age – wise for the lipid parameters. Table # 7 shows Age wise breaking for total cholesterol between the four centers. For the same age group Ahmedabad and Chennai center had higher
2.6 – 6.5 3 – 8 2.4 -5.9
2.2 – 5.4 3 – 6 2.3 - 5.3 Ahmedabad Delhi Hyderabad Chennai
Bld Urea M 12 – 36 13 – 38 10 – 32 16 – 34 (mg/dL) (10 – 50) (10 – 50) (15 – 39) (15 – 40)
Bld Urea F 7 – 35 11 – 34 10 – 32 16 – 31 (mg/dL) (10 – 50) (10 – 50) (15 – 39) (15 – 40)
S. Creatinine M 0.8 – 1.4 0.7 – 1.3 0.6 - 1.3 0.7 – 1.2 (mg/dL) (0.5 – 1.5) (0.5 – 1.3) (0.8 – 1.3) (0.5 – 1.2)
S. Creatinine F 0.7 – 1.1 0.5 – 1.0 0.5 – 1.0 0.6 - 0.9 (mg/dL) (0.5 – 1.5) (0.5 – 1.3) (0.6 – 1.0) (0.5 – 1.2)
S. Uric acid M 3.7 – 8.7 4.1 – 8.5 3.7 – 8.0 3.3 – 8.1 (mg/dL) (3.4 – 7.0) (3.0 – 7.6) (3.5 – 7.2) (3.0 – 7.2)
cholesterol levels but not very different from the two other centers. Similar break up was done for HDL cholesterol, LDL cholesterol and Triglycerides (data not shown).
Table 7: Age wise breaking for total cholesterol
Female Male
Age Centre 0.5 - 80.0 percentile 0.5 - 80.0 percentile Ahmedabd ------ 120.56 - 232.53 Chennai 113.00 - 227.00 116.00 - 240.00 Delhi 110.41 - 191.85 107.03 - 221.99
21 - 30
Hyderabad 102.47 - 212.08 108.00 - 236.00 Ahmedabd 108.68 - 232.09 126.92 - 263.66 Chennai 110.92 - 239.49 117.03 - 252.24 Delhi 107.32 - 226.56 115.33 - 247.07
31 - 40
Hyderabad 117.38 - 230.15 120.00 - 252.00 Ahmedabd 122.07 - 260.60 133.50 - 271.55 Chennai 121.36 - 259.24 119.51 - 256.14 Delhi 126.32 - 242.17 120.84 - 254.77
41 - 50
Hyderabad 116.75 - 257.16 119.62 - 255.89 Ahmedabd 141.41 - 254.37 133.56 - 256.44 Chennai 128.65 - 275.35 122.34 - 265.81 Delhi 131.69 - 262.48 121.86 - 258.93
51 - 60
Hyderabad 123.78 - 277.22 121.77 - 250.64 Ahmedabd ------ 87.10 - 290.37 Chennai 134.93 - 274.23 114.98 - 270.93 Delhi ----- -------
>60
Hyderabad ----- -----
Table 8: Reference Interval for Serum Urea , Serum Creatinine, Serum Uric Acid, Serum Calcium

35
A Research Initiative of AHERF
34
Hematological & Biochemical Values in Indian Population
M: male, F: female, Bld Urea: Serum Urea in mgs/dl, S.Creatinine: Serum creatinine in mgs/dl, S.Uric acid: Serum uric acid in mgs/dl, S.Calcium: Serum calcium in mgs/dl.
Reference Interval for tests in Liver Function testsTable lists the reference interval for liver function tests. Gender based partitioning showed significant differences between male and female for SGPT and GGTP. Differences between the 2 genders were observed in some centers for total bilirubin and serum albumin.
Table 9: Reference Interval for Liver Function tests.
iannehC dabaredyH ihleD dabademhA
T. Bilirubin M (mg/dl) 0.2 – 1.1
(Upto 1.2)
0.3 – 1.5
(0.2 – 1.0)
0.3 – 1.4
(< 1.0)
0.5 – 1.2
(0.5 – 1.0)
T. Bilirubin F ( mg/dl) Same
(Upto 1.2)
0.3 – 1.2
(0.2 – 1.0)
0.2 – 0.8
(< 1.0)
0.5 – 1
(0.5 – 1.0)
Alk Phos ( Iu/l) 52 – 121
M (40 -129)
F(35-104)
52 – 126
(39-117)
55 – 124
(50 – 136)
118 – 324
(75 – 275)
T. Protein ( g/dl) 6.6 – 8.4
M(6.6 – 8.0)
F(6.6 – 8.0)
7.1 – 9
(6.6 – 8.7)
6.9 – 8.5
(6.4 – 8.2)
6.8 – 8.2
(6.0 – 8.0)
Albumin M ( g/dl) 4 – 5
(3.4 – 4.8)
4.2 – 5.4
(3.5 – 5 )
3.9 – 4.8
(3.4– 5 )
4.1 – 4.9
(3.5 – 5 )
Albumin F ( g/dl) Same
(3.4 – 4.8)
Same
(3.5 – 5 )
3.4 – 4.6
(3.4 – 5 )
3.9 – 4.8
(3.5 – 5 )
Globulin (g/dl) 2.2 – 3.7 2.5 - 4.1 2.7 – 4.2 2.4 - 3.8
S. Uric acid F 2.7 – 6.6 2.4 – 6.6 2.1 - 5.9 2.8 – 6.4 (mg/dL) (2.4 – 5.7) (2.6 – 6.8) (2.6 – 6.0) (2.6 – 6.0)
S. Calcium M 8.5 – 10.4 8 – 10 8.7 – 10 Not Available (mg/dL) (8.4 – 10.2) (8.4 – 10.2) (8.5 – 10.1) (8.4 – 10.2)
(mg/dL) (8.4 – 10.2) (8.4 – 10.2) (8.5 – 10.1)S. Calcium F 8.5 – 10.4 8 – 10 8.47 – 9.9 Not Available
(8.4 – 10.2)
Alkaline phosphatase was different at Chennai due to difference in methodology. ALT was higher at the Hyderabad center. Total protein, albumin and ALT were higher at the Delhi center.
In summary, center-based analysis revealed differences between centers for the following parameters Ahmedabad center: Higher total cholesterol, LDL cholesterol and HDL cholesterol and uric acid.Chennai center: Higher ESR, eosinophil count and lower haemoglobin and platelet count. Hyderabad center: Higher 2 hour post glucose, ALT and GGTPNew Delhi center: Higher total proteins, albumin and ALT.
Number of persons with values above or below currently used reference Intervals.
Our study revealed more than 20% of the persons considered normal by history and physical examination had values outside the current reference intervals used at their respective centers for the following analytes: Haemoglobin, packed cell volume, ESR, fasting glucose, total cholesterol, HDL cholesterol, triglycerides, total bilirubin and serum uric acid. Of these ESR, total cholesterol, HDL cholesterol and serum uric acid were out of range for more than 40% of the persons screened. Table 10 shows the proportion of persons whose values were out of range from the currently used reference range. Currently desired limits as per the recommendation of NCEP ATP guidelines are used while reporting reference range for lipid profile. In our study a large proportion of persons had lipids above the current recommended values.
AST ( Iu/l ) M(Upto – 38)
F (Upto – 32)
12 – 41 (5.0 – 40)
13 – 39 (15 – 37)
14 – 43 (5.0 – 40)
ALT- M ( Iu/l)
(Upto – 41)
13 – 74
(5.0 – 40)
26 – 77
(30 – 65)
12 – 69
(5.0 – 35)
ALT - F ( Iu/l)
(Upto – 31)
9 – 39
(5.0 – 40)
24 – 49
(30– 65)
11 – 42
(5.0 – 35)
GGTP -M ( Iu/l)
(Upto 38)
13 – 60
(7 – 32)
19 -66
(5 - 55)
12 – 50
(10 – 50)
GGTP -F ( Iu/l)
(Upto 32)
10 – 39
(10 – 50)
15 – 43
(15 – 85)
11 – 36
(10-50)
11 – 38
11 – 63
10 – 35
11 – 65
7 – 33

37
A Research Initiative of AHERF
36
Hematological & Biochemical Values in Indian Population
Table 10: Proportion of Persons with Values outside the currently used Reference Range
Discussion The concept of reference values was introduced way back in 1969 by Saris and Graesbeck with an aim to identify those patients whose laboratory value may indicate illness and assist the clinicians make meaningful decisions. The 95% reference interval established from healthy individuals was used as the reference value for most biochemical and haematological parameters. Since then several international laboratories have adopted 95% reference interval following the recommendation of IFCC and NCCLS for identifying the reference value for their laboratory parameters. The next two decades saw several prospective studies such as Framingham heart study etc emerged showing association of various
Male7%6%
11%15%
2%4%NA9%7%
12%10%
1%00
14%4%00
1%12%28%49%63%36%
6%22%
9%7%
22%4%9%
35%36%
00
Ahmedabad Chennai Hyderabad New Delhi Female Male Female Male Female Male Female
8%12%
6%12%
1%11%NA
11%9%
11%13%
1%12%
5%3%1%1%5%
21%30%64%18%
5%9%6%9%6%8%4%8%6%00
32% 17% 11% 5%46% 21% 12% 5%12% 10% 12% 10%19% 12% 20% 10%
3% 3% 3% 1%63% 24% 16% 6%
9% 22% 2% 7%5% 3% 4% 2%4% 4% 3% 4%
18% 21% 10% 14%8% 9% 4% 3%1% 1% 00 00
11% 14% 3% 1%16% 21% 13% 22%
6% 5% 7% 7%1% 1% 28% 15%00 1% 18% 14%
7% 42% 10% 10%30% 30% 21% 24%12% 21% 47% 74%22% 23% 63% 62%23% 36% 17% 31%14% 26% 18% 15%
4% 13% 4% 16%11% 12% 00 3%
5% 6% 10% 9%00 1% 2% 1%
2% 1% 14% 5%6% 11% 15% 13%
13% 36% 31% 20%5% 9% 3% 15%
00 00
Center Sex
HB 18% 17%PCV 74% 15%MCV 23% 10%MCH 24% 11%MCHC 26% 10%ESR 60% 31%RBC 5% 00WBC 8% 8%Neutrophil 8% 6%Eosinophil 4% 8%Lymphocyte 6% 4%Monocyte 1% 00Platelet count 8% 6%Fast Sugar 7% 35%PP Sugar 2% 2%Serum Urea 2% 1%Creatinine 3% 1%Uric acid 19% 26%Total Cholestl. 29% 43%HDL 81% 79%LDL 24% 42%Triglycerides 5% 20%Ratio TC/ HDL 15% 35%Bilirubin 44% 32%Alk. Phos. 10% 4%T. Protein 10% 10%Albumin 5% 17%Globulin 00 1%AST 5% 8%ALT 10% 25%GGTP 13% 29%Calcium 00 00 . .
biochemical parameters to clinical events. The pharmaceutical industries growth and availability of several new drugs that effectively reduce clinical events have resulted in moving from reference values to decision limits. Now guidelines by various associations such as National Cholesterol Eradication Program, American Diabetes Association, and Joint National Commission are used to arrive at recommended values and decision limits. Recommended values for biochemical parameters: Fasting blood glucose, 2 hour (75 grms) post glucose Blood glucose, total Cholesterol, HDL Cholesterol, LDL cholesterol, triglycerides has been revised in the last decade as our understanding of risk factors and opportunity and options for their modifications are available. Therefore using 95% reference interval for these parameters is no longer useful and creates confusion between the laboratory physicians and clinicians.
Better understanding of diseases and their pathophysiology has resulted in recommended values for optimal functioning. A person needs hemoglobin of 12 gm/dl for optimal functioning and uric acid of more than 6mg/dl can result in crystallization and gout flares. Knowledge such as these has also resulted in recommended values making 95% reference interval measure irrelevant for the clinician.
One can hence question the relevance of using 95% reference interval in 2008 16-18. However reference interval remains a useful means to arrive at reference value for parameters such as serum protein, transaminases, alkaline phosphatase, GGTP, platelet count, serum creatinine and serum urea. For parameters like Blood glucose, total cholesterol, decision limits are used based on studies from non-indian population, distribution studies such as these provide useful background information. As more healthy individuals now undergo routine health check ups, it is important to know the distribution of the laboratory parameters to make meaningful clinical decisions. The cohort characteristics are dynamic and change with time, warranting periodic evaluation and re- evaluation. Hence the reference interval remains a useful tool.
Bias in our studyUnder ideal circumstances the reference interval is measured in healthy individuals, usually from the community and the population identified for the study should reflect the population the laboratory caters to. Wide disparities in socio-economic, cultural, religion and ethnic origin pose a challenge in identifying an ideal study population reflective of the population the lab caters to.
Ours is a hospital-based study and included patients who voluntarily took the health check up. Hence selection bias indeed exists. However due to corporate tie-ups and pre-employment check up, a fair proportion of this group were patients with no known medical illness. Also the population screened reflects the population our hospital laboratory caters to, making this study viable and useful. Medical centers at different regions of the country were an added advantage, enabling assessment between regions as well.
Several practical problems surface in identifying and defining normal individuals. There is no universal consensus on what constitutes a healthy individual. Strict adherence to the WHO classification of health as “A state of complete physical, mental and social wellbeing and not merely the absence of diseases or infirmity” is neither practical nor reflective of the general population as some element of somatic, functional and social pathology is present in probably everyone. We hence used the guidance from IFCC and NCCLS and adhered to strict selection criteria attempting to identify individuals in the healthy state. As this study is aimed at identifying reference interval for biochemical and haematological parameters, normally was identified by detailed history and physical examination.

39
A Research Initiative of AHERF
38
Hematological & Biochemical Values in Indian Population
Being a retrospective study strict adherence to pre-analyte handing was not done. However in view of the instructions
given, all patients reported after overnight fasting and were fasting for 10- 12 hours. Sample handling is generally
standardized. With regards to analyte testing, differences in methodology were observed for serum albumin, plasma
glucose and alkaline phosphatase between centers and hence reference intervals have been reported separately as well.
Our Study Results
Reference intervals identified by our study was very different from the currently used reference range. Haemoglobin was
less for the males and more so for the females. About 30% of the persons screened had values outside currently used
reference intervals. Nutritional deficiency and worm infestations being the usual causes of anemia one can assume the
population at large remain iron deficient. This needs to be further addressed especially as this population is more
reflective of the middle and upper socio-economic class. B-thalessemia trait is also not uncommon in the north eastern
states and may be contributing to the low hemoglobin observed at the Chennai center.
The low platelet count came in as a surprise. This findings has very important clinical implications as persons with
platelet counts of 1,10,000 - 1,30,000 are subject to several investigations. The reason for low platelets could range from,
inherent nature of Indians to vitamin B12 deficiency to nutritional deficiencies. Detailed studies are warranted to address
this observed finding. The erythrocyte sedimentation rate which is an indirect marker for inflammation was much higher
in our study group. Because of the selection bias, low haemoglobin values and that the majority of the persons were in
the 30 – 50 age group, it makes interpretation of this finding difficult.
For blood glucose and lipid profile our reference intervals were far different from current recommended values. This is
understandable as currently recommended range is the desired limit rather than true reference intervals. A large
proportion (approx 40%) (Table 10) of our study population considered normal by history and physical have higher than
recommended values. The currently used recommended values are adapted from experts panel decision arrived at upon
analysis of cardiovascular event associated prospective studies performed on the Caucasians largely. Indian data is
lacking. As the proportion of persons with above recommended values is high and prospective studies among Indians is
currently lacking, one cannot make definitive guidelines or recommendations at this juncture. Large prospective
cardiovascular event associated studies are urgently needed.
Serum uric acid was much higher among males with all centers reporting upper reference interval of 8 mgs/dl or more.
This may reflect the higher prevalence of metabolic syndrome in the population. Diet rich in purines as observed in
animal proteins increases serum uric acid. Interestingly about half of the population were vegetarians.
Alanine amino tranferase (ALT) and GGTP were higher among men. While persons taking more than 2 drinks per week
were excluded, it is possible that the actual intake may not have been disclosed. Hence alcoholism may be a reason.
However AST was not significantly higher. Nonalcoholic steatohepatitis (NASH) is not uncommon. A large proportion of this population had fatty liver by ultrasound (approx. 30%). Therefore NASH may account for some of this observed increase in ALT. Gender based partitioningLarge differences were observed for the following parameters for which separate reference intervals for the two genders must be considered: Hemoglobin, PCV, ESR, serum creatinine, uric acid, HDL, triglycerides, ALT and GGTP. Currently gender based partitioning is not routinely employed for triglycerides, ALT and GGTP.
Age based partitioningAnalysis between the two age groups showed higher reference intervals for ESR, fasting blood glucose, two-hour post (75 grms) blood glucose, total cholesterol, HDL cholesterol, LDL cholesterol and triglycerides in the above 40 years age group. As currently desired limits are used for blood glucose and cholesterol, partitioning by age is a mute point. However for ESR age based partitioning ought to be considered. This will help prevent unnecessary investigations. Community based studies identifying normal ESR for different age groups is required to make definitive recommendations.
Center based partitioningRegional study revealed few interesting findings most likely associated with environmental factors such as diet. Chennai center had higher ESR, Eosinophil count and lower haemoglobin and platelet count, while higher total cholesterol, LDL cholesterol, HDL cholesterol and uric acid were observed at AhmedabadDelhi center had higher total proteins, albumin and ALT while higher 2 hour post (75 grms) blood glucose, ALT and GGTP were observed in the Hyderabad center.
ConclusionThe reference interval established by our study differed from the currently used reference values. The 2.5% lower reference limit was lower for haemoglobin, mean cell volume, platelet count and 2 hour post (75 grms) blood glucose. The 97.5% upper reference interval was higher for erythrocyte sedimentation rate, fasting glucose, total cholesterol, low density lipoprotein, triglycerides, total cholesterol /HDL ratio, serum uric acid, total bilirubin, alkaline phosphatase, SGPT and GGTP.Gender based partitioning is required for haemoglobin, packed cell volume, ESR, high density lipoprotein (HDL), triglycerides, serum creatinine, serum uric acid, ALT and GGTP. Age based reference intervals for ESR need to be considered.
Abbreviations Used
• NHANES - National Health And Nutrition Examination Survey • RCPA -Royal College of Pathologist of Australia
• ALT - Alanine Amino Transferase • NCCLS - National Committee for Clinical Laboratory Standards
• SQAS - Safety and Quality Systems • SSP-Statistical Software Package

40
Hematological & Biochemical Values in Indian Population
A Research Initiative of the Apollo Hospital Educational and Research Foundation (AHERF)
Hematological & Biochemical Valuesin Indian Population
D e f i n i n g R e f e r e n c e I n t e r v a l s
Governing Board Members
Dr. Prathap C. ReddyPresident – Apollo Hospitals Educational and Research Foundation, Chennai President
Mrs. Shobana KamineniVice-President – Apollo Hospitals Educational and Research Foundation, Hyderabad Vice-President
Prof. Nirmal Kumar GangulyFormer Director GeneralIndian Council of Medical Research, New Delhi Member Dr. Mohan D. NairConsultant to Health Care Industry MemberChennai
Mr. A. Ranga RaoChairman – Central Ethics CommitteeApollo Hospitals Group, Hyderabad Member Mrs. Preetha ReddyManaging DirectorApollo Hospitals, Chennai Member
Prof. Ranjit Roy ChaudhuryChairman – Task Force for ResearchApollo Hospitals Educational and Research Foundation, New Delhi Member Dr.Anupam SibalGroup Medical DirectorApollo Hospitals Group, New Delhi Member
Prof. M.S. SwaminathanChairman – M. S. Swaminathan Research Foundation, Chennai Member
Ms. Jayanthi SwaminathanClinical Project ManagerApollo Hospitals Educational and Research Foundation, Chennai Secretary

Scientific Advisory Committee, Apollo Hospitals Educational and Research Foundation
Prof. Ranjit Roy Chaudhury Chairman, Task Force for Research, Apollo Hospitals Educational and Research Foundation, (Chairman) New Delhi
Dr. Ajay Kumar Senior Consultant, Gastroenterology, Indraprastha Apollo Hospitals, New Delhi
Dr. Anupam Sibal Group Medical Director, Apollo Hospitals Group, New Delhi
Dr. Bela Shah Senior Deputy Director General, Indian Council of Medical Research, New Delhi
Dr. Hari Prasad Chief Executive Officer, Apollo Health City, Hyderabad
Dr. K. Ganapathy Head, Apollo Telemedicine Network Foundation, Chennai
Dr. K. K. Talwar Director, Postgraduate Institute of Medical Education and Research, Chandigarh
Dr. K. Srinath Reddy President, Public Health Foundation of India, New Delhi
Dr. K. T. Shenoy Professor and Head, Department of Gastroenterology, Sree Gokulam Medical College and Research Foundation, Trivandrum
Dr. M. D. Nair Consultant to Pharmaceutical Industry, Chennai
Dr. N. K. Arora Executive Director, International Clinical Epidemiological Network, New Delhi
Dr. N. K. Ganguly Former Director General, Indian Council of Medical Research, New Delhi
Dr. Partha Majumdar Professor and Head, Human Genetics Unit, Indian Statistical Institute, Kolkata
Dr. Rajni Bhise Former Head, Carcinogenesis Division, Cancer Research Institute, Mumbai
Dr. Sangeetha Sharma Professor, Department of Psycho Neuro Pharmacology, Institute of Human Behaviour and Allied Sciences, New Delhi
Dr. S. K. Agarwal Academic Advisor, Indraprastha Apollo Hospitals, New Delhi
Dr. Satish K. Gupta Staff Scientist, National Institute of Immunology, New Delhi
Dr. Satyabhama Director of Medical Services, Apollo Hospitals, Chennai
Mr. S. S. Narayanan Member, Institutional Ethics Committee, Chennai
Dr. Vinod Kumar Bhargava Senior Consultant, Internal Medicine, Apollo Health City, Hyderabad
Dr. V. P. Kamboj Former Director, Central Drug Research Institute, Lucknow
Dr. V. S. Chauhan Director, International Centre for Genetic Engineering and Biotechnology, New Delhi
Prof. V. S. Mathur Chairman, Institutional Ethics Committee, Indraprastha Apollo Hospitals, New Delhi

Acknowledgements
Apollo Hospital Annexe, Basement, Indraprastha Apollo Hospitals, Sarita Vihar, Delhi - Mathura Road, New Delhi - 110 076, IndiaTel. : 26925858 Extn. : 5018 Direct: 26925825 Fax : 41677024
Apollo Hospitals Educational and Research Foundation (AHERF) dedicates this first evidence based retrospective basic retrospective research study report to Dr Prathap C. Reddy, Founder Chairman of the Apollo Hospitals Group on the special occasion of the 25th Anniversary of Apollo Hospitals Group.
AHERF acknowledges the current and former members of the Governing Board and the Scientific Advisory Committee for their continuous advice and guidance in development and periodic review of the study proposals. Our special thanks to Ms.Shobana Kamineni - Vice Chairman AHERF and Mr. Sridhar, Chief Operating Officer of Apollo Pharmacy for sponsoring the prestigious national level study.
AHERF respects Prof. Ranjit Roy Chaudhury - Chairman - Apollo Task Force for Research AHERF for his leadership and encouragement for successful completion of the first study of its kind.
AHERF acknowledges and admires Dr. Udhaya Balasubramaniam for taking captaincy as Principal Investigator & continuous support and Ms. Jayanthi Swaminathan for constant guidance throughout the study duration.
AHERF acknowledges the efforts taken by Dr. Deepak Raut for developing the initial protocol for the study. Our exceptional thanks to Dr. Srilekha Sairam, who took the entire responsibility for reviewing and amending the protocol, database development, report writing, interaction with statisticians and finalizing the manuscript for publication.
AHERF recognizes the input and ideas given by Apollo clinicians of Ahmedabad, Chennai, Hyderabad and New Delhi in finalizing the protocol and review of the report for publication.
A special mention and acknowledgement to the chairman and members of Central Ethics Committee of Apollo Hospitals Group for review and approval for initiation of the study.
AHERF takes this opportunity to thank Dr. Suhashini, HOD Biochemistry, Apollo Hyderabad for extending her continuous support in review of analysed statistical laboratory parameters and review of the report and continuous contribution.
AHERF acknowledges the chief of Biochemistry and Hematology at Apollo Ahmedabad, Chennai, Hyderabad and New Delhi for contribution and input on the review of the report for publication.
We acknowledge and recognize the enormous effort taken by Ms. Alamelu ANSI Techniques for statistical analysis and data outcome for the entire study with rigorous timelines.
Our special thanks and acknowledgement to Dr Ramakrishnan – Deputy Director, National Institute of Epidemiology and Dr. Manjula Dutta – Epidemiologist for review of the report and guidance, Last but not the least AHERF is proud of the outstanding efforts taken by all staff members and profusely thank and acknowledges for their relevant contribution in completion of this esteemed and dream project of our Chairman come true.
© A
NA
LYS
IS :
01
1 -
26
95
85
18
(09
- 2
00
8) 1
20
0


