MSU Soil Fertility Extension Clain Jones [email protected]994-6076 COVER CROPS AND SOIL HEALTH MT Farm Bureau Federation Missoula November 9, 2015 Clain Jones (994 - 6076; [email protected]) Dept . Land Resources & Environmental Sciences
Soil temperature at 2” deep much higher under fallow than cover crops (but no differences between pea and full)
Cover crops terminated on 5 July
Bozeman
Tem
pera
ture
°F
Jones, Miller, et al. unpublished
Soils were cooler under cover
crop than fallow for over a
month. Benefit?
50
59
68
77
86
95
104
Amsterdam Conrad Dutton Bozeman
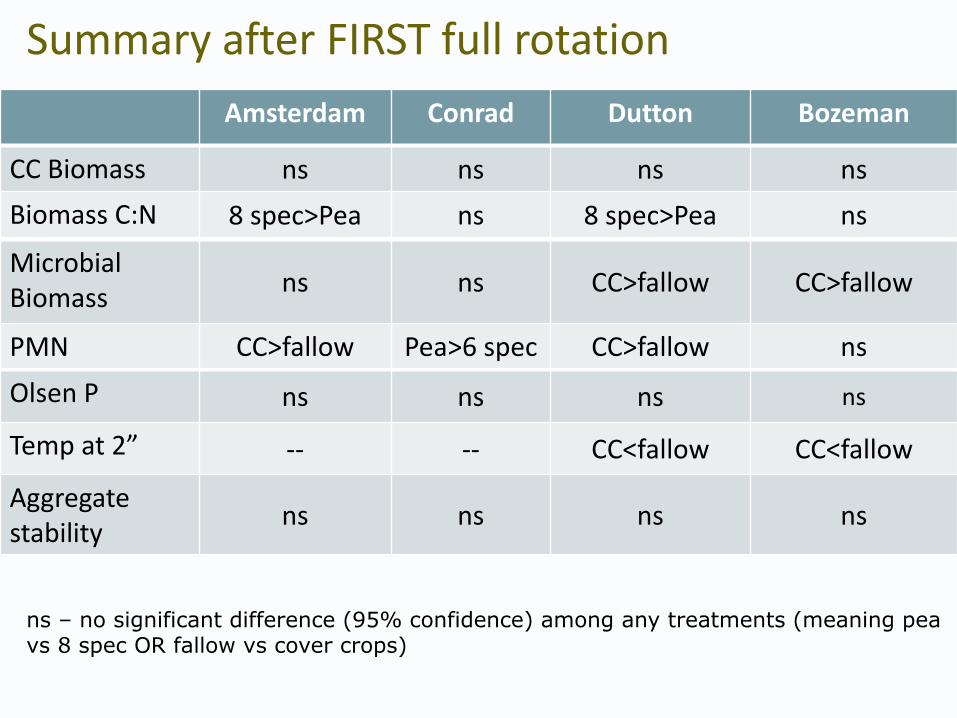
Olsen P ns ns ns ns
Temp at 2” -- -- CC<fallow CC<fallow
Aggregate stability
ns ns ns ns
Summary after FIRST full rotation
Amsterdam Conrad Dutton Bozeman
MicrobialBiomass
ns ns CC>fallow CC>fallow
PMN CC>fallow Pea>6 spec CC>fallow ns
Amsterdam Conrad Dutton Bozeman
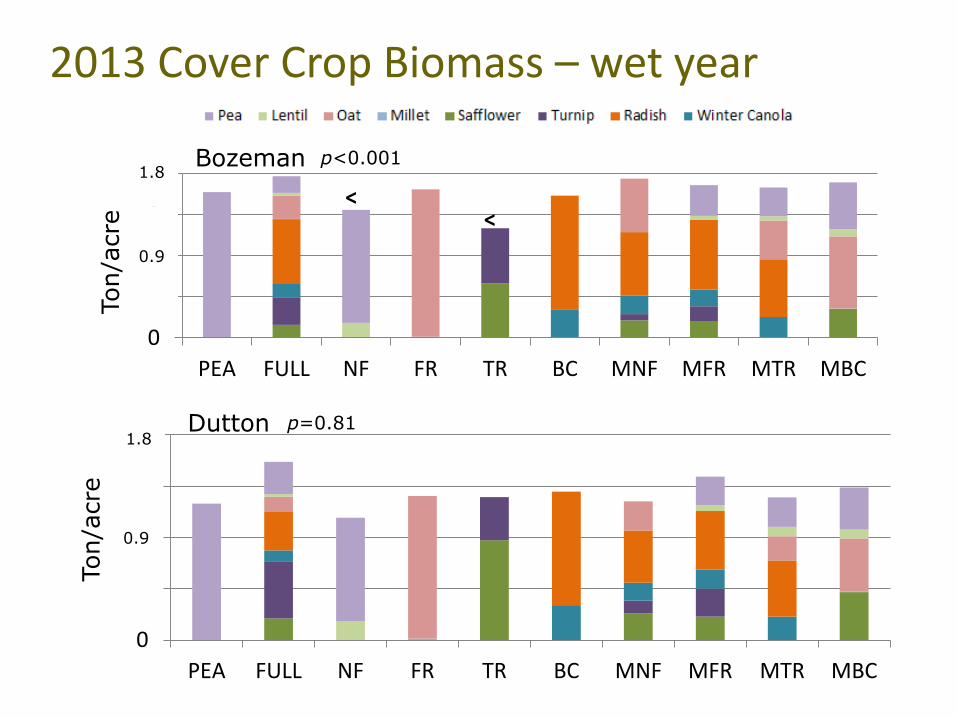
CC Biomass ns ns ns ns
Biomass C:N 8 spec>Pea ns 8 spec>Pea ns
ns – no significant difference (95% confidence) among any treatments (meaning pea vs 8 spec OR fallow vs cover crops)
Amsterdam Conrad
Olsen P ns ns
Temp at 2” CC<fallow CC<fallow
Aggregate stability ns ns
Summary after SECOND full rotation
Amsterdam Conrad
Cover crop biomass 6 spp. > 2 spp. ns
Microbial Biomass CC>fallow ns
Microbial Enzymes (5) CC>fallow ns
PMN CC>fallow ns
ns – no significant difference (95% confidence) among any treatments (meaning pea vs 8 spec OR fallow vs cover crops)
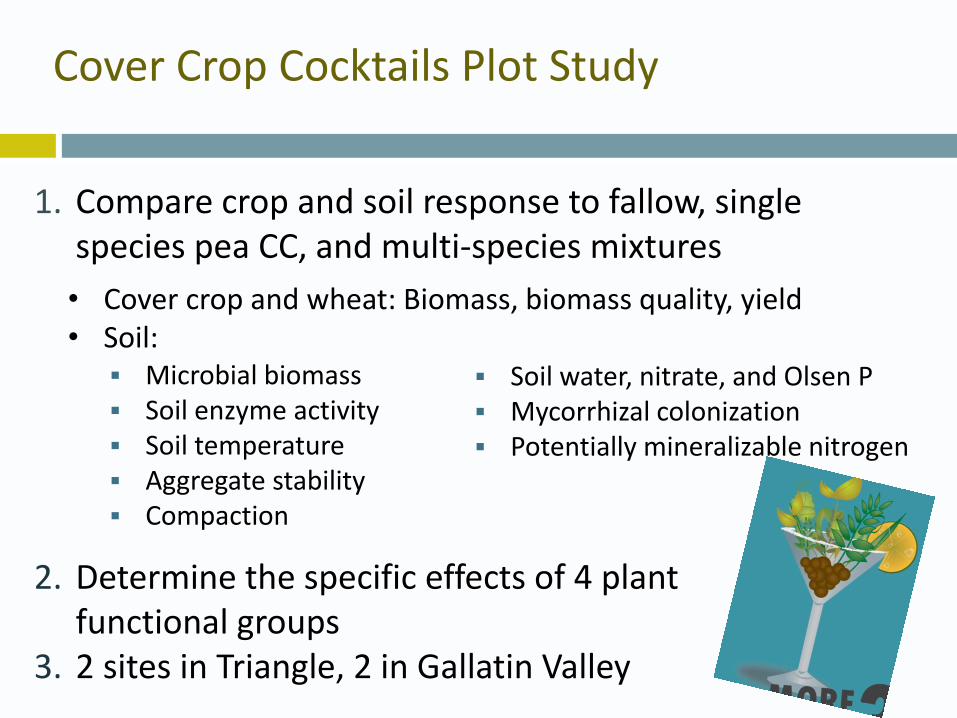
Cover Crop Cocktails Plot Study: Take home messages on yield and soil quality
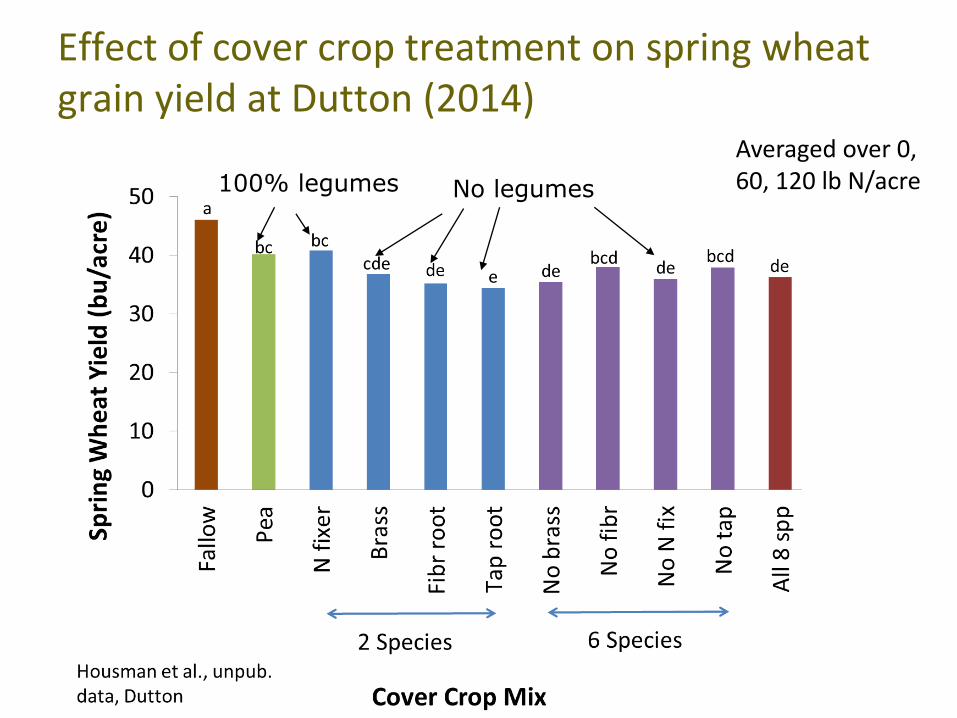
• After one cycle, spring wheat grain yields higher after pea and N fixers than most other mixes.
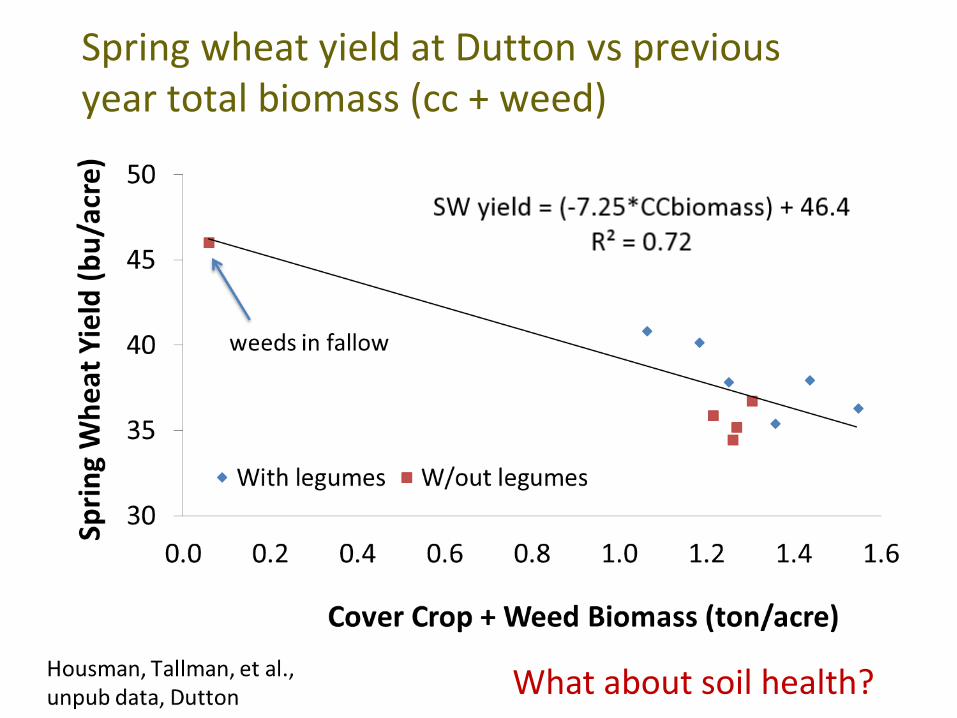
• Higher cover crop biomass correlated with lower spring wheat yield, likely b/c of more water and N use.
• Relatively few soil health differences between pea and 8-species mix after one cycle; not unexpected.
• After two cycles, no soil health differences between pea and 8-species mix, but CCs increased microbial activity.
Questions?
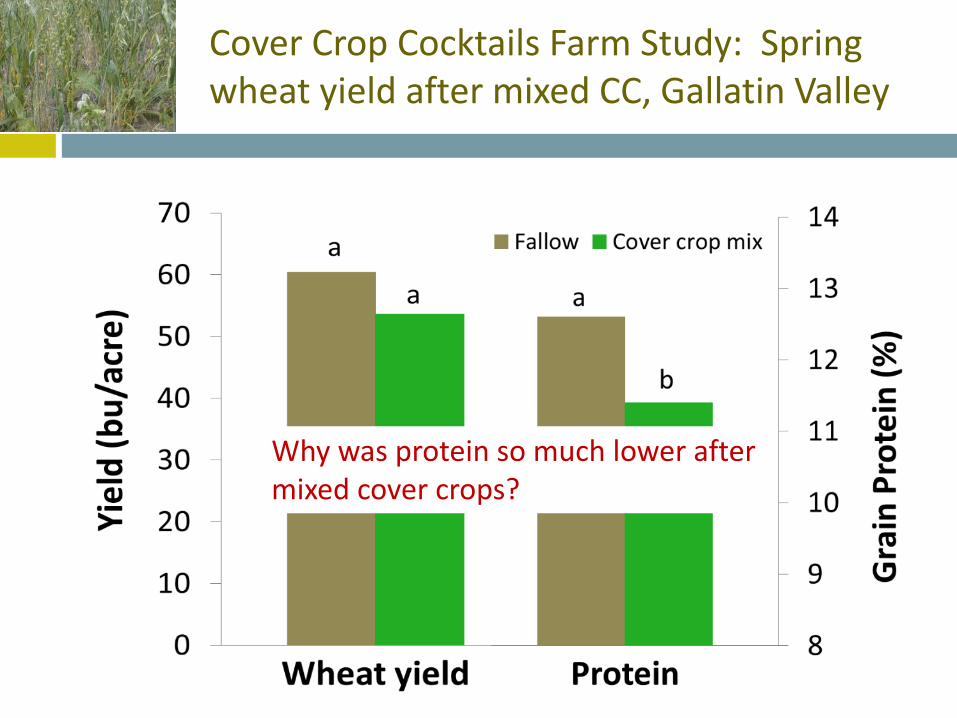
Cover Crop Cocktails Farm Study: Spring wheat yield after mixed CC, Gallatin Valley
Why was protein so much lower after mixed cover crops?
Percent legume and termination timing affects plant available N (PAN)
Willamette Valley, OregonSullivan and Andrews, 2012
Take home: Legume % less than 50 can result in low available N esp if terminated late
This study ≈ 40% legume
Cover Crop Cocktail Farm Study: 1 rotation of mixed CC reduced grain yield in 4 of 6 production years
* Signif difference with 90% probability
Yield less after mixed cover crops on farmers’ fields, likely due to late termination and high water & N use by CCrop
P. Miller unpub data
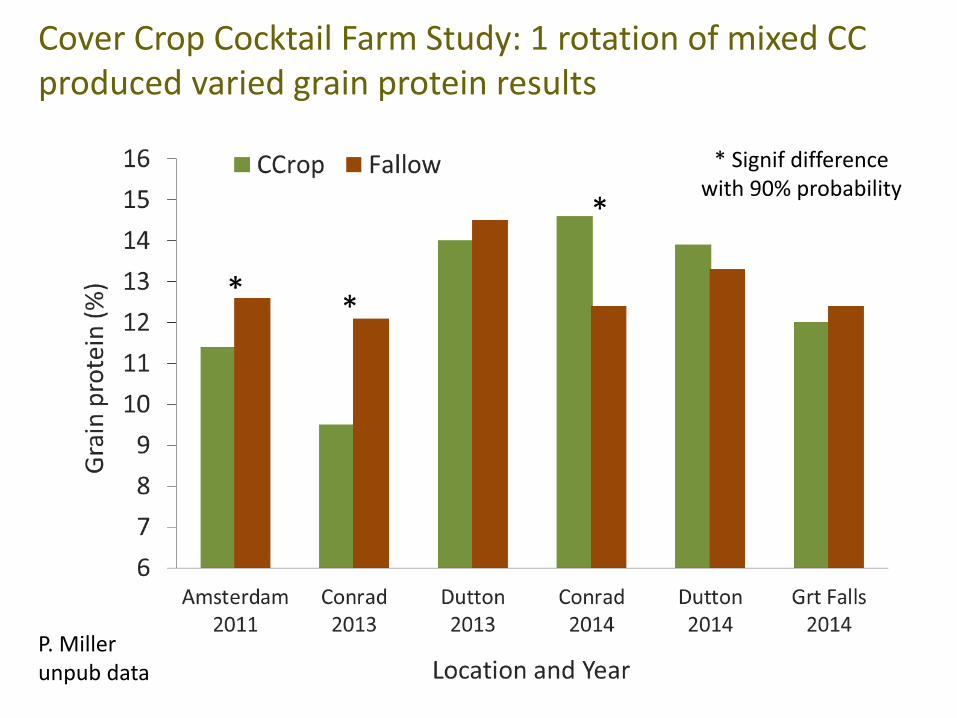
Cover Crop Cocktail Farm Study: 1 rotation of mixed CC produced varied grain protein results
* Signif difference with 90% probability
P. Miller unpub data
Cover Crop Cocktails Farm Study: Take home messages on yield and protein
• Spring wheat grain yield was lower after CC than fallow in four of six field-scale studies, and protein results were mixed.
• High water use from late termination was likely cause of yield differences.
• Low N availability from late termination & low legume % was likely cause of protein differences.
Questions or Comments?
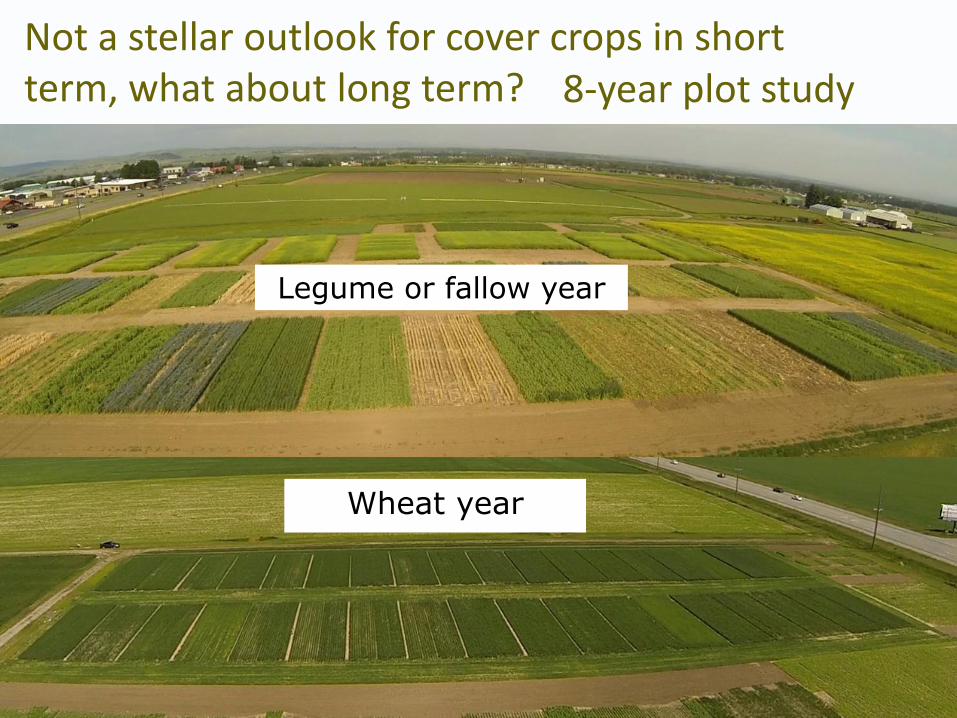
Not a stellar outlook for cover crops in short term, what about long term?
Legume or fallow year
Wheat year
8-year plot study
8-year Plot Study
• Long-term effects of no-till pea forage/legume cover crop-wheat vs. fallow-wheat
• ~16” annual precip on deep soils & ability to recharge soils
• Pea forage grown in 2003, 05, 07 and pea CC grown in 2009, terminated at full pod
• Spring or winter wheat planted in even years. 2010 was wettest of wheat years, 2012 record drought.
• 2 N rates: Full (3 lb available N/bu) and ½ N
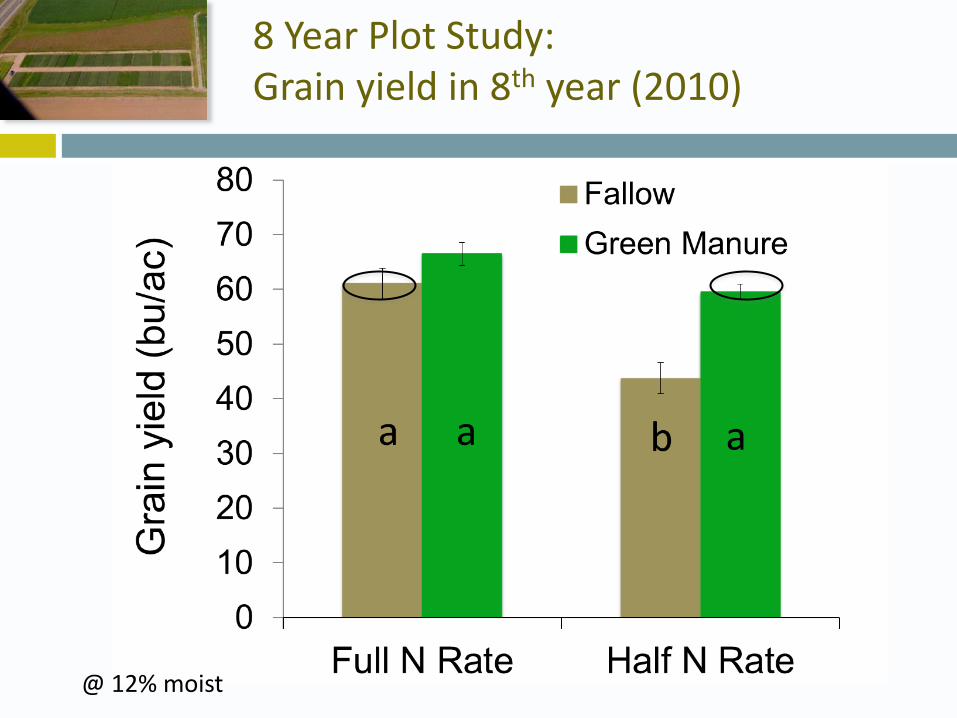
• NO differences in wheat yield following CC and following fallow in 2004, 2006, 2008, and 2012, and large benefit of CC in 2010
8 Year Plot Study: Grain yield in 8th year (2010)
@ 12% moist
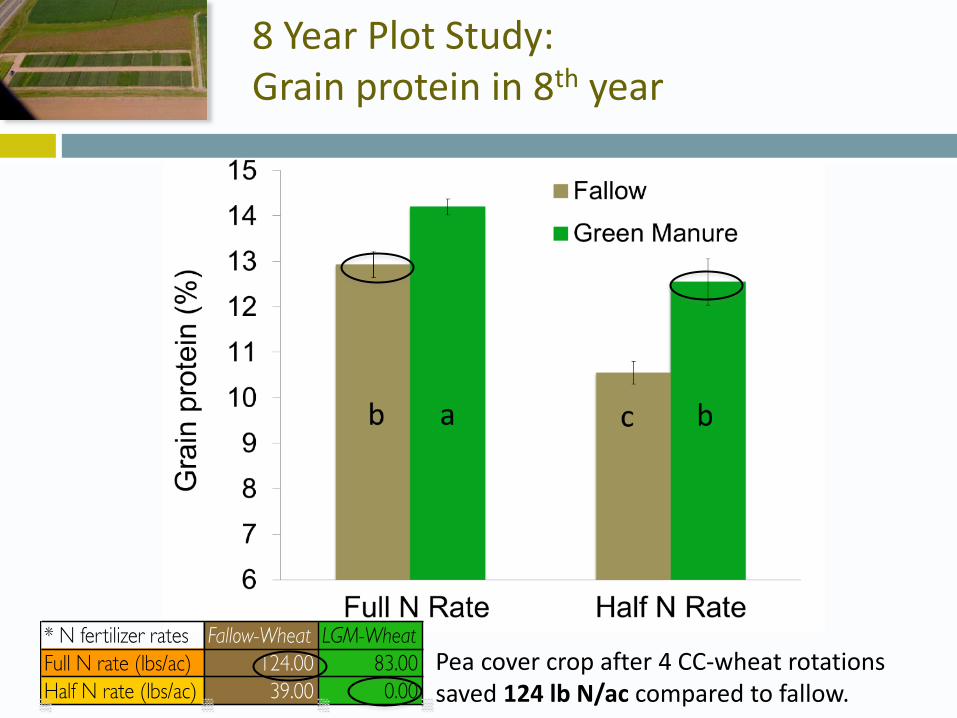
8 Year Plot Study:Grain protein in 8th year
Pea cover crop after 4 CC-wheat rotations saved 124 lb N/ac compared to fallow.
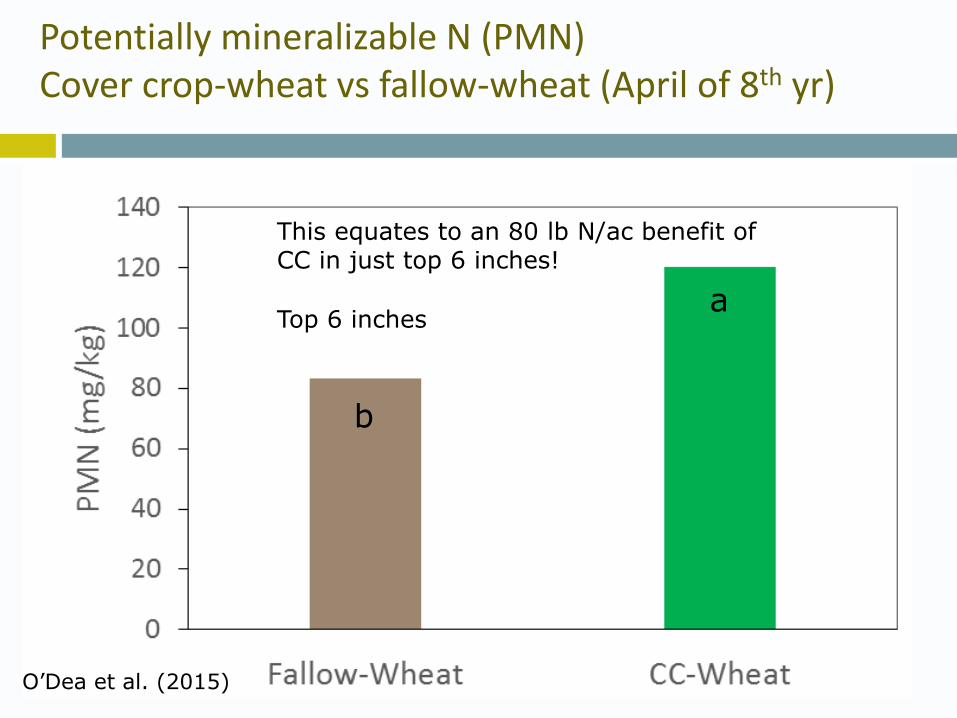
Potentially mineralizable N (PMN) Cover crop-wheat vs fallow-wheat (April of 8th yr)
b
aTop 6 inches
O’Dea et al. (2015)
This equates to an 80 lb N/ac benefit of CC in just top 6 inches!
Economics: 8-year Plot Study (2009-2012)
Miller et al., 2015
8-year Plot Study: Take home messages
• In the first 3 cycles, wheat grain yield was not higher after legume than after fallow.
• After 4 two-year cycles, wheat grain yield and protein were higher after legume CC than after fallow.
• Higher than normal precipitation in 2010 likely 1) increased release of available N from an increased organic N pool, and 2) made N limiting to growth.
• Over 100 lb N/ac was saved in 2010 following legume cover crop compared to fallow!
• Economic returns were more stable with cover crop (less dependent on N rate)
Questions?
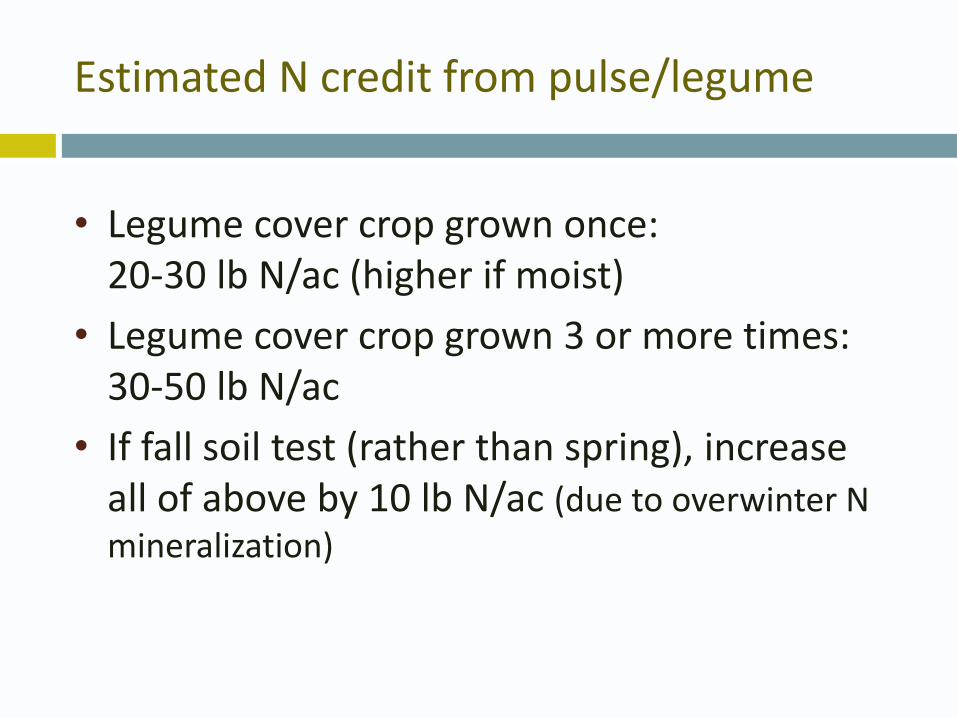
N credit from pulse/legumes
• N Credit = The amount of fertilizer N to back off from a standard recommendation (e.g, lb N/bu of yield goal) when previous crop is a legume, based on spring soil sampling.
• Adjust yield goal – will be lower after legumes than fallow due to water use, but higher than after small grain
• Legume cover crop grown 3 or more times: 30-50 lb N/ac
• If fall soil test (rather than spring), increase all of above by 10 lb N/ac (due to overwinter N mineralization)
Example N rate calculation (based on Big Sandy study results)
FallowGrain pulse grown 1x
Legume cover crop grown 1x
WW yield goal (bu/ac) 45 35 45
Spring soil N (lb/ac) 80 55 65
Total soil N recommended (bu/ac x 2.6 lb/bu)
45 x 2.6 = 117 35 x 2.6 = 91 45 x 2.6 = 117
N credit (lb/ac) 0 10 25
Fertilizer N (lb/ac) 117-80-0=47 91-55-10=26 117-65-25=27
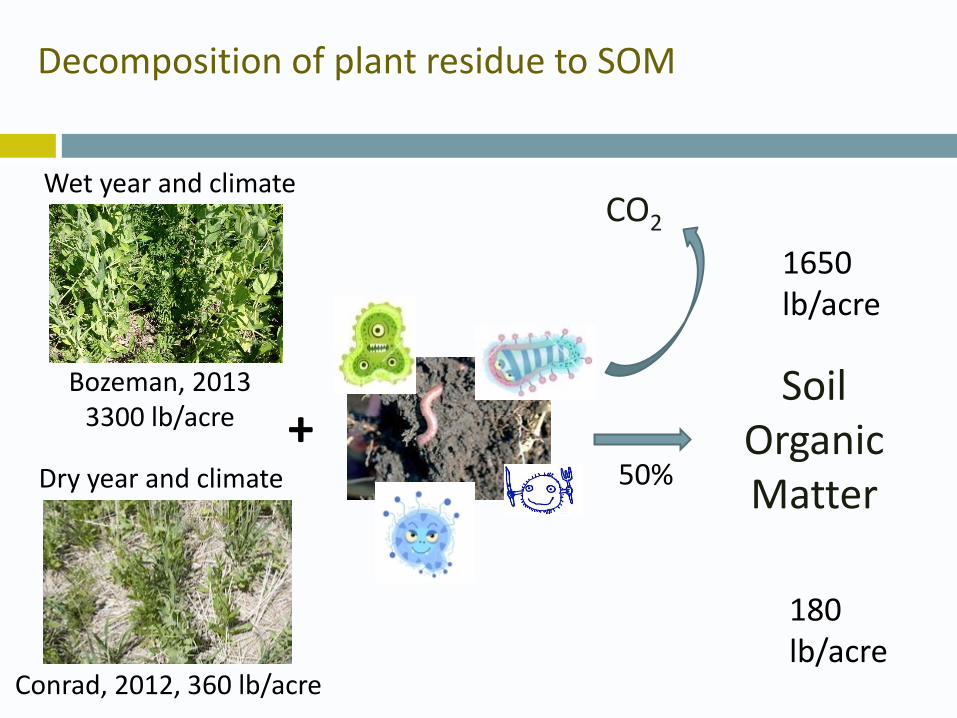
SOM input = a function of biomass input
Fisher et al., 2007, Australia irrigated systems
• Residue decomposition rate varies with climate, tillage, soil type, etc.
• Potential SOM input depends on biomass produced regardless of soil and site conditions
Decomposition of plant residue to SOM
+Soil
Organic Matter
CO2
Wet year and climate
Dry year and climate
Bozeman, 20133300 lb/acre
Conrad, 2012, 360 lb/acre
50%
1650 lb/acre
180 lb/acre
SOM addition to soil
2% SOM in top 6” 40,000 lb SOM/acre
+
Wet year and climate
1650 lb SOM/acre
Dry year and climate
180 lb SOM/acre
165040,000
= 0.04 2.08% SOM
18040,000
= 0.0045 2.01% SOM
After 3 cycles = 2.24%
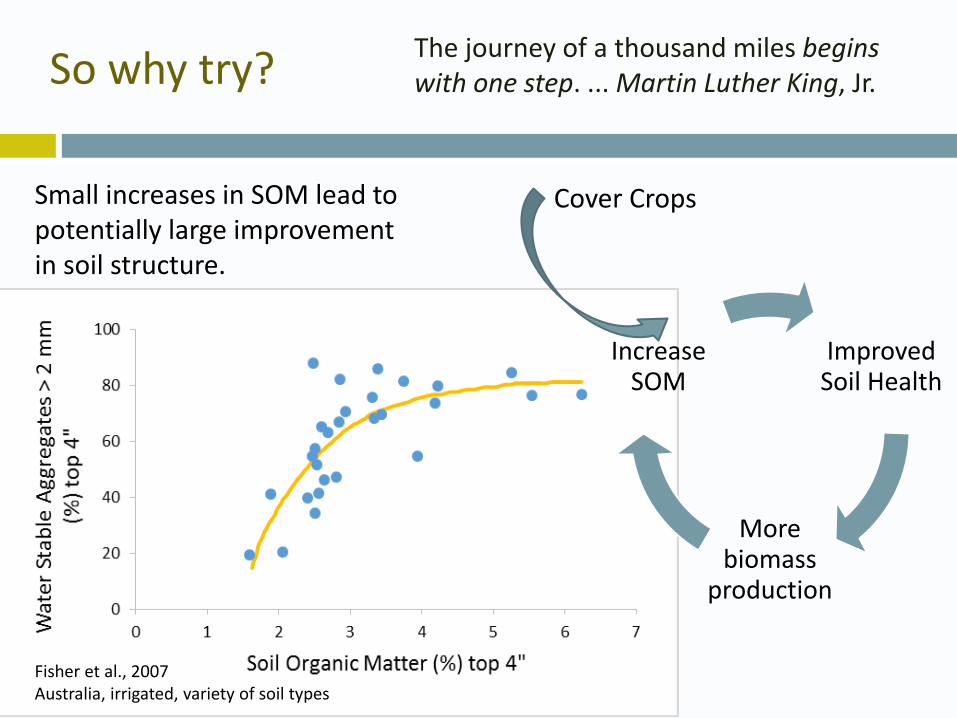
So why try?
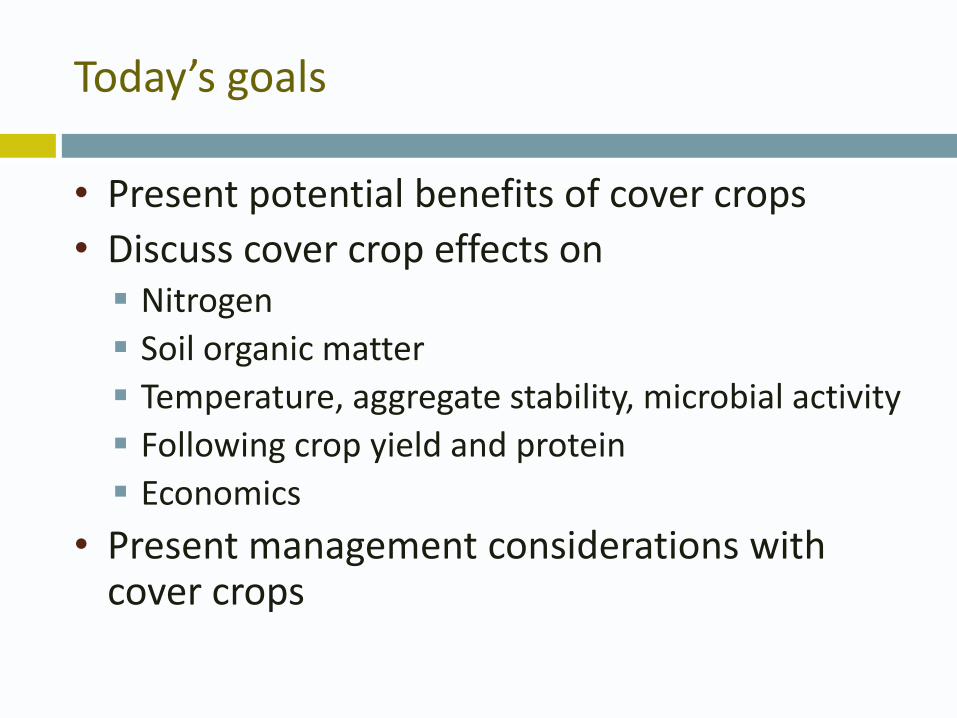
Improved Soil Health
More biomass
production
Increase SOM
The journey of a thousand miles begins with one step. ... Martin Luther King, Jr.
Small increases in SOM lead to potentially large improvement in soil structure.
Fisher et al., 2007Australia, irrigated, variety of soil types
Cover Crops
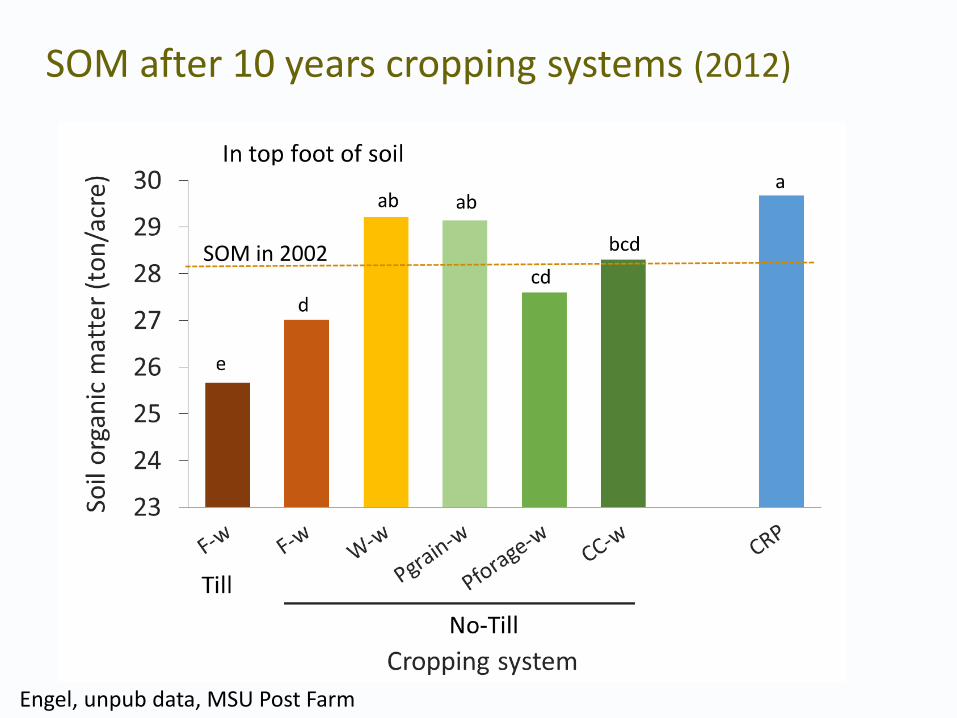
SOM after 10 years cropping systems (2012)
Engel, unpub data, MSU Post Farm
SOM in 2002
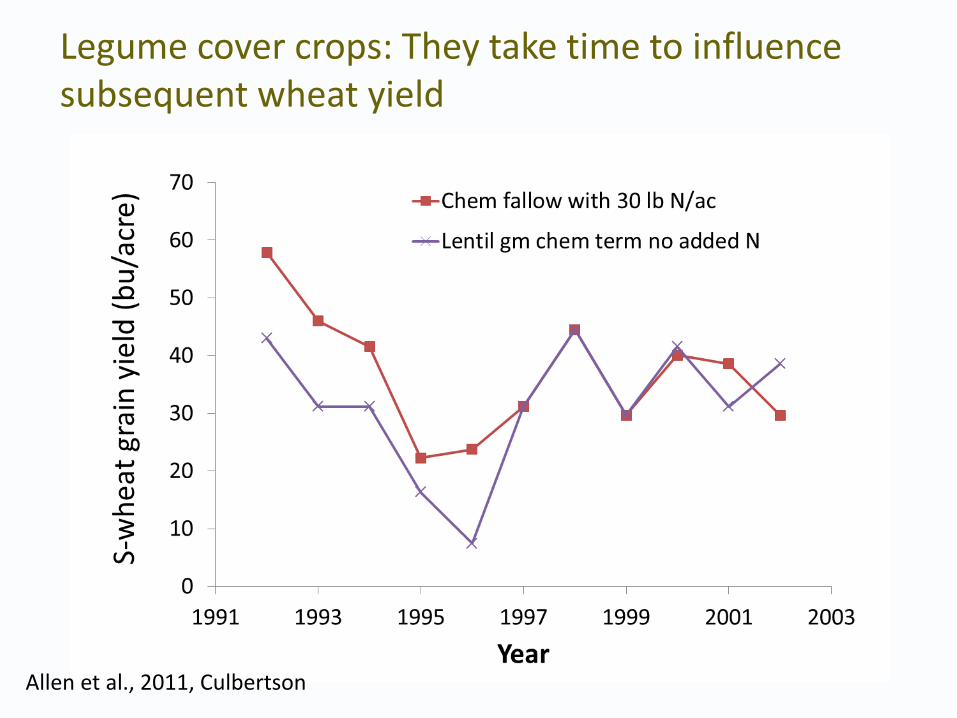
Legume cover crops: They take time to influence subsequent wheat yield
Allen et al., 2011, Culbertson
Pulse/legume rotations benefit protein before yields
Allen et al., 2011, Culbertson
Questions?
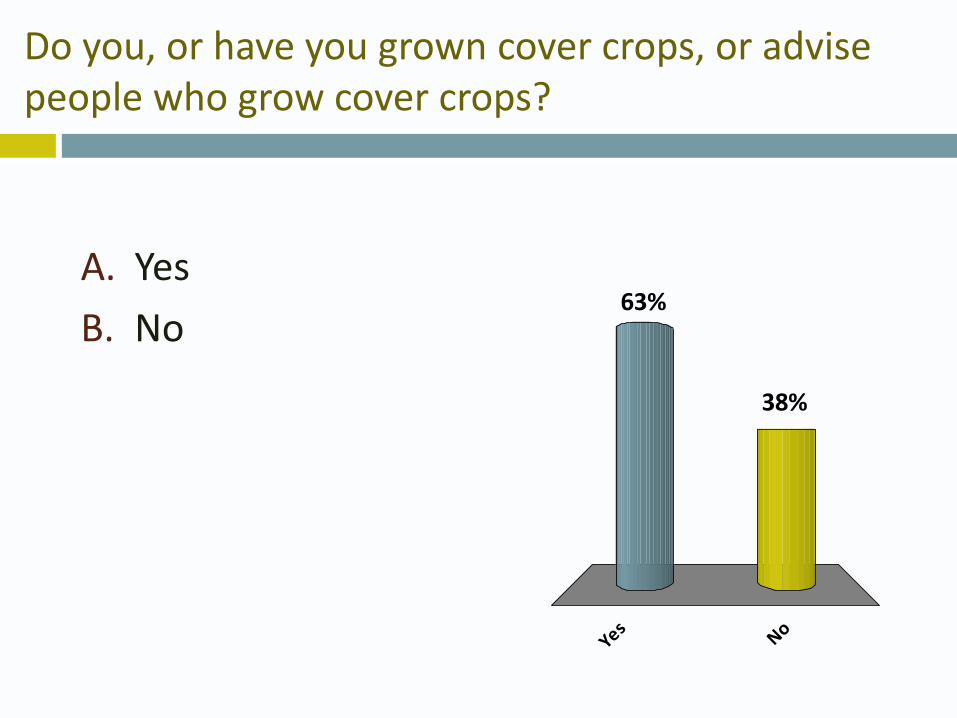
Do you, or would you, graze cover crops?
A. Yes
B. No
YesNo
14%
86%
• Grazing may provide more immediate economic return and increase the rate of change in soil health. Currently under study at MSU-Northern.
• NRCS provides incentives for growing cover crops
Economic options
Conclusions
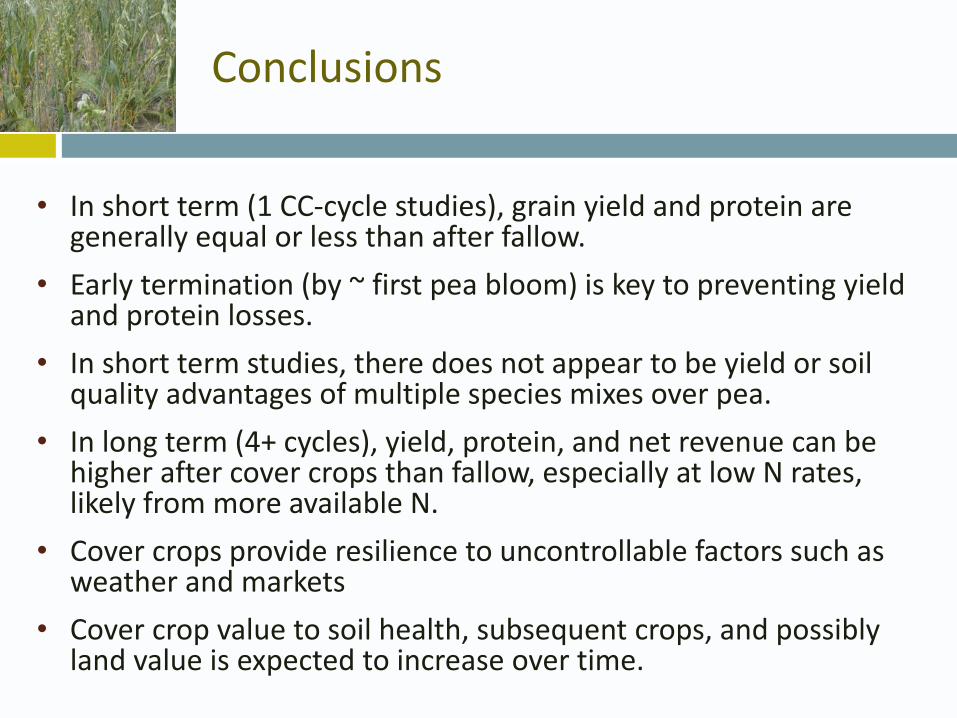
• In short term (1 CC-cycle studies), grain yield and protein are generally equal or less than after fallow.
• Early termination (by ~ first pea bloom) is key to preventing yield and protein losses.
• In short term studies, there does not appear to be yield or soil quality advantages of multiple species mixes over pea.
• In long term (4+ cycles), yield, protein, and net revenue can be higher after cover crops than fallow, especially at low N rates, likely from more available N.
• Cover crops provide resilience to uncontrollable factors such as weather and markets
• Cover crop value to soil health, subsequent crops, and possibly land value is expected to increase over time.
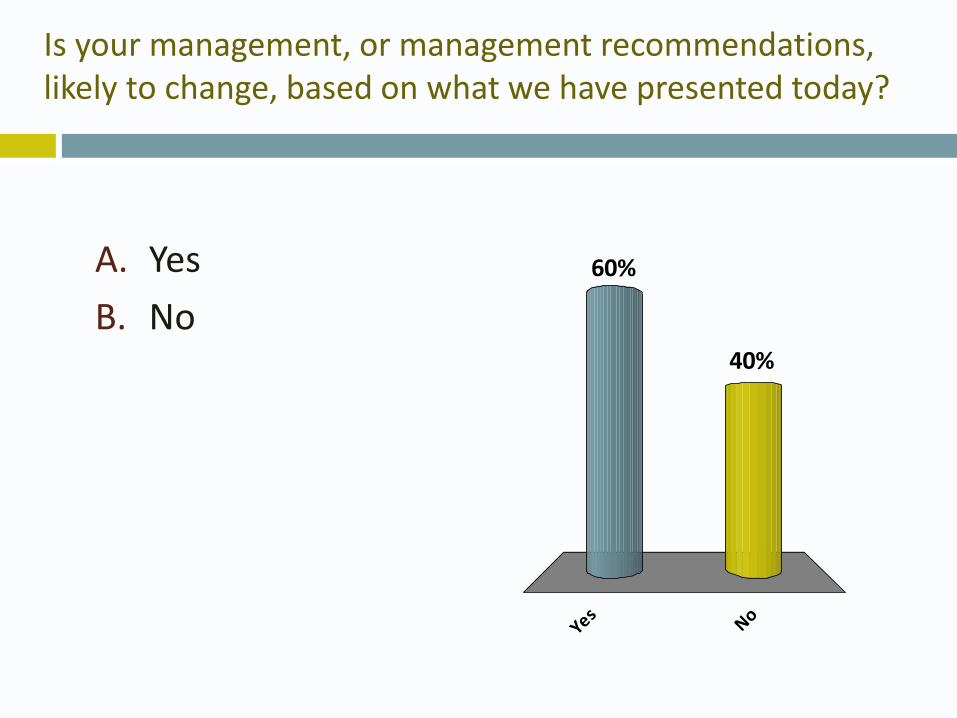
Is your management, or management recommendations, likely to change, based on what we have presented today?
A. Yes
B. No
YesNo
40%
60%
Acknowledgments
• USDA – AFRI• USDA – WSARE• NRCS – CIG• Montana Fertilizer Advisory Committee• Montana Wheat and Barley Committee• Numerous landowners• Ann McCauley• Jeff Holmes• Anton Bekkerman• Mac Burgess
QUESTIONS?
For a pdf version of this presentation and additional information on cover crops and soil fertility, see http://landresources.montana.edu/soilfertility