Page 1/25 Geospatial Analysis of Wetland Land Use/Land Cover Dynamics On Lake Abaya-Chamo, Southern Rift-Valley of Ethiopia. Tariku Zekarias ( [email protected]) Arba Minch University https://orcid.org/0000-0003-4468-6924 Vanum Govindu Arba Minch University Yechale Kebede Arba Minch University Abren Gelaw Arba Minch University Research Keywords: land use/land cover, dynamics, magnitude, multispectral, Lake Abaya-Chamo wetland. Posted Date: August 31st, 2021 DOI: https://doi.org/10.21203/rs.3.rs-407287/v2 License: This work is licensed under a Creative Commons Attribution 4.0 International License. Read Full License
Transcript
Page 1/25
Geospatial Analysis of Wetland Land Use/LandCover Dynamics On Lake Abaya-Chamo, SouthernRift-Valley of Ethiopia.Tariku Zekarias ( [email protected] )
Arba Minch University https://orcid.org/0000-0003-4468-6924Vanum Govindu
Arba Minch UniversityYechale Kebede
Arba Minch UniversityAbren Gelaw
Arba Minch University
Research
Keywords: land use/land cover, dynamics, magnitude, multispectral, Lake Abaya-Chamo wetland.
Posted Date: August 31st, 2021
DOI: https://doi.org/10.21203/rs.3.rs-407287/v2
License: This work is licensed under a Creative Commons Attribution 4.0 International License. Read Full License
AbstractBackground: Wetlands worldwide and in Ethiopia have long been subject to severe degradation due toanthropogenic factors. This study was aimed at analyzing the impact of land use/cover dynamics onLake Abaya-Chamo wetland in 1990 – 2019. Data were acquired via Landsat TM of 1990, ETM+ of 2000,and OLI of 2010 and 2019 images plus using interview. Supervised classi�cations (via ERDAS14 andArcGIS10.5) were applied to detect land use/cover classes. Change matrix model and Kappa coe�cientswere used for analysis of the land use/cover dynamics in the lake-wetland.
Result: It was found that forest; water, shrub land, agricultural land, settlement and swamp area were themain land use/cover classes. Wetland/swamp area has continuously declined throughout 1990 – 2000,2000 – 2010 and 2010 – 2019 where its magnitude of shrinkage in the respective periods was 11.4 %(700 ha), 16 % (867 ha) and 31.3 % (1,424 ha). While ‘settlement’ and ‘water body’ of the lake-wetlandincreased at progressively increasing magnitudes of changes in three periods within 1990 – 2019, ‘shrubland’ and ‘swamp’ declined at progressively increasing magnitudes of loss in the same periods Siltation,rapid population growth-led expansion of settlement and irrigation-based farming were the main driversof the land use/cover dynamics and degradation of the lake-wetland.
Conclusion: Thus, consistent mapping and integrated actions should be taken to curb the threats on thesustainability of the lake-wetland in Southern Ethiopia. To curb the impact of LULC dynamics onwetlands, the government should: formulate clear policy, institutional and legal framework on themanagement of wetlands.
BackgroundLand Use/Land Cover (LULC) changes affect aquatic and inland ecosystems including wetlands acrossthe globe. Technically, the concept of ‘land use’ is different from that of ‘land cover’. ‘Land use’ is thepurpose for which land is exploited by people; whereas, ‘land cover’ is the biophysical or inherent state ofland above the lithosphere (Lambin et al., 2003). On the other hand, a ‘wetland,’ roughly upon the RamsarConvention, is a natural or manmade swamp, ‘fen or peatland’ … having soft, spongy soil/land saturatedwith draining or stagnant, fresh, brackish or salty water including marine with a depth (at low tide) of lessthan 6 meter (RCS, 2016). Inland (natural) wetlands are endowed with diverse species of �ora usuallydominated by dense growth of annual and perennial grasses, and herbaceous plants (in some cases,mixed with trees of variable densities) as well as with various species of fauna and microorganisms(Schuyt, 2005). Inland wetlands, being formed often on �at to plain landscapes, depressions (surroundedby uplands), banks and deltas of rivers (Ballanti et al., 2017), along margins of lakes, and whereclayey/sticky soils are dominant, have vital economic and environmental values (Clarkson et al., 2014;CBD, 2015). Well managed inland wetlands provide myriads of bene�ts (services) with an estimatedvalue of about US$ 44,000 per/ha/year (TEEB, 2013).
Page 3/25
Wetland ecosystems provide numerous services, which range from provisioning (�sh, rice production,animal fodder and fossil fuels) through supportive (e.g. habitat, breeding ground of birds and cropfarming) and regulatory (carbon sink, climate control and regulate hydrological cycle) to cultural (e.g.recreation and aesthetic) services (MEA, 2005; Dise, 2009; Erwin, 2009; Davidson, 2014; Clarkson et al.,2014; CBD, 2015). Huge proportion of the wetlands (marine and inland) in the world undergoes completeand/or partial degradation or loss in response to the impact of natural and human factors (Schuyt, 2005;Zedler and Kercher, 2005). Climate change, sea-level rise, sediment load into wetlands, volcanism,earthquake and drought are among the main natural causes of degradation of wetlands (Morris et al.,2002; Parry et al., 2007; Ballanti et al., 2017; Galatowitsch, 2018). But the world experienced loss of about50% (Clarkson et al., 2014) to 64% (CBD, 2015) of the total wetlands due to largely anthropogenic factors-induced LULC dynamics, underlain by rapid population growth (CBD, 2015). Expansion of farming, urbanbuilt-up area and infrastructures, air and water pollution, runoff-induced increasing fertilizers,eutrophication, invasive exotic plant species, diversion of wetland tributaries, construction of dams andirrigation canals, and intensive exploitation of resources are among the major manmade driving forces ofLULC changes and degradation/loss of wetlands worldwide (Zedler and Kercher, 2005; UNEP, 2012; CBD,2015; Giweta and Worku, 2018; Galatowitsch, 2018).
Studies reveal that most of the riverine and lacustrine wetlands of Ethiopia have been critically threateneddue to the impact of LULC changes (Feoli and Zerihun, 2000; Giweta and Worku, 2018). Numerousstudies were made about various issues of wetlands in different parts of Ethiopia. Investigations aboutthe threats and opportunities (Zinabu, 2002; Teklu and Kassahun, 2017) and hydrogeochemical andwater level changes (Alemayehu et al., 2006) of Rift-Valley lake-wetlands, sustainable management(Wood and Dixon, 2002) and wetland ecosystem dynamics (Legesse, 2007) in Illubabor Zone, status ofnatural lakes of Ethiopia (Tenalem, 2009), water level and siltation problem of Abaya lake (Schütt et al.,2002), ecology and wetland vegetation composition (Unbushe, 2013) and limnological changes (Tefferaet al., 2017) of lake Abaya-Chamo wetland, ecosystem services of Tana lake-wetland in NorthwesternEthiopia (Wondie, 2018), and reversing wetland degradation in Ethiopia (Giweta and Worku, 2018) wereamong the main wetland-related studies in Ethiopia. Most of these studies were conducted not via GISand remote sensing-based geospatial analyses of the dynamics of the wetlands in the respective areas ofEthiopia overtime largely due to the views and thematic-area interests of the studies. It is ambiguous tounderstand the accurate spatiotemporal magnitudes of LULC (e.g. forest, water, swamp) changes(gains/losses) of wetlands from results of studies made without the application of GIS and remotesensing (satellite images) techniques (Lillesand et al., 2004; Ballanti et al., 2017).
Several studies have been conducted about the causes of LULC dynamics and degradation of wetlandsin Ethiopia (Wood and Dixon, 2002; Tenalem, 2009; Simane et al., 2013; Teklu and Kassahun, 2017;Wondie, 2018; Giweta and Worku, 2018). Persistently high population growth led conversion of wetlandsto croplands (Simane et al., 2013) and urban (built-up) areas, open access to and overuse of common(natural) resources (use of wetland trees for timber and fuel, intensive and ine�cient water use forirrigation and overgrazing) (Tenalem, 2009; Teklu and Kassahun, 2017), lack of regulations about useand abuse of resources, absence of service costs (i.e. the free riders/tragedy of the commons’ scenario),
Page 4/25
draining wetlands, dam construction, intensi�cation of farming, infrastructure expansion and diversion ofwater �owing to wetlands (Zinabu, 2002; Wood and Dixon, 2002; Wondie, 2018), poor catchmentmanagement, sedimentation, eutrophication and pollution by chemical farm-inputs (Giweta and Worku,2018) were among the major drivers of LULC dynamics and wetland degradation in different parts ofEthiopia. But all the causes (shown above) cannot be equally signi�cant in inducing LULC changes andthreatening wetlands everywhere as the drivers and their impacts vary in space and time depending onvariations in circumstances across the different speci�c areas of the country (Giweta and Worku, 2018).
GIS and satellite image-based studies about the dynamics and threats of wetlands in Ethiopia werelimited. Dynamics of Dawa Chefa Wetland in North central part (Hussien, 2014), characterizing wetlandsand their dynamics in Central Highlands (Dubeau, 2016), and the impact of LULC change on thelandscape of Abaya-Chamo basin (Wolde-Yohannes et al., 2018) were among the few GIS and remotesensing-based studies made in Ethiopia in the recent past. Studies made through integrated applicationof different data acquisitions (GIS and satellite images, ground survey and interview) techniques foraddressing the dynamics and threats of wetlands were rare in and around lake Abaya-Chamo wetland(Southern Rift-Valley of Ethiopia) where this study is conducted. Remote sensing-based mapping andanalyses of the dynamics of biophysical status of wetland (upon multispectral Landsat images) is usefulto develop bases for detecting and monitoring changes (degradation) of the wetland, and to respond forits restoration (Baker et al., 2007; Klemas, 2011; Ballanti et al., 2017). This is so because, GIS and remotesensing techniques, by providing synoptic coverage and repeatability of spatial information, enable to getaccurate results about wetland dynamics and are more cost-effective for monitoring the changesovertime (Ballanti et al., 2017). This study was aimed to: (1) quantify the magnitude and rate of LULCdynamics of Lake Abaya-Chamo wetland within 1990–2019; (2) explain the trends of LULC changes inthree decades; (3) analyze the driving forces and impacts of the LULC dynamics on the sustenance of thelake-wetland.
Materials And Methods
Study AreaAbaya-Chamo lake-wetland is located in 5°43'19''N - 6°38'51''N latitude and 37°21'55''E - 38°15’05''Elongitude (Figure 1). In Figure 1, the large Northeastern water body is Abaya Lake and the smallerSouthwestern one is Chamo lake. The area of Abaya-Chamo lake-wetland is 242,615 ha (Figure 1). Abayaand Chamo lakes, being Rift-Valley lakes in Southern Ethiopia, lie on a graven (depression) created byfaulting due to divergent movement along the boundary of the Africa plate (westward) and the Somaliplate (eastward). The Western part of the lake-wetland is largely plain, where some dome-shape andconical volcanic hills, and elevated spurs are observed.
Climatically, Abaya-Chamo wetland, based on data of 1987 – 2018 Mean annual temperature, was about24 0C; and, the mean monthly temperature of the area is the highest in march (26 0C) and the lowest inJuly (230C), November (23.1 0C) and December (23.1 0C) (NMA, 2019). The wetland receives a somewhat
Page 5/25
low rainfall amount where the mean total annual (1982 - 2018) was 870.9 mm. The study area has tworainfall seasons: that is, spring (March, April and May) with total rainfall of 362.9 mm is the main rainyseason. In spring, rainfall, averaged for 37 years (1982 - 2018), is the highest in April (153.7 mm). Autumn(September, October and November) with total rainfall amount of 265.6 mm is the second rainy seasonwhere it peaks in October (115 mm) (NMA, 2019).
Abaya-Chamo lake-wetland provides multiple ecological and economic bene�ts to people in thesurrounding area. The wetland vegetation, being a vital nesting site and feeding source for hundreds ofbirds and hippopotamus, supports wildlife and serves as a spawning-area for crocodiles (Unbushe,2013). Rich bird fauna, sport �shing for Tilapia, Nile Perch and Tiger Fish, the ‘Azo-gebeya’/‘CrocodileMarket’ (where crocs are not exchanged rather crowds of crocs are visited), the ‘Forty-Springs’ (fromwhich name of ‘Arba-Minch’ Town was coined) provide special attraction to tourists. CrocodileRanching/Farming is important income source via tourism and the export of skin of crocs (Legesse,2007). The lakes also harbor large population of common hippopotamus (Hippopotamus amphibius)and several rare bird species including migratory ones.
Lake Abaya-Chamo wetland revealed rapid change in land uses/land covers due to fast populationgrowth-induced expansion of cultivated land and settlement at the cost forest and shrubland (Bekele,2001). Crop farming and livestock rearing are important activities in the area surrounding the lakes.Extensive area to the West of Abaya lake was cleared in the 1960s and 1970s for expansion of large-scale farms for producing cotton, banana and other crops (Gelaw, 2019). State farms like Bilate, Arba-Minch and Sile (recently given for private investors) are examples of intensive farming in the plain areaadjacent to the lakes.
Agroforestry is the main activity in the alluvial plain of the western shores of the lakes, where it ispracticed using rain-fed and irrigation. Fruits (e.g. banana, mango, avocado, papaya, tomato,), cereals(e.g. maize), vegetables (e.g. cabbage, pepper), tuber and root crops (casava, onion, carrot) and cotton arecultivated on the fertile soils adjacent to the wetland (Gelaw, 2007; Gelaw, 2019). Wetlands, forest,woodland and bush-lands have changed to settlement and cropland (Kebede, 2012). These wetlandspresent a rich biodiversity in western shores of the lake Abaya-Chamo wetland even if it has beenextremely impacted by anthropogenic pressure.
Research Design This study, being viewed via the pragmatic lens, was conducted based on the mixed-methods approach.That is, data acquisition and analyses were carried out using a mixture of methods from both thequantitative and qualitative approaches (Creswell, 2009), were used for statistical based inferences aboutthe LULC dynamics and the degradation of Lake Abaya-Chamo wetland. Methods of the qualitativeapproaches such as interview and observation were used to check, con�rm and strengthen the �ndings ofthe quantitative approach. The concurrent embedded model was used to mix the quantitative and
Page 6/25
qualitative approaches (Creswell, 2009). Cross-sectional survey design was used to acquire and analyzedata using both the methods of quantitative and qualitative approaches simultaneously (in parallel).
Acquisition and Processing of Satellite Imageries
Satellite data of Landsat TM of 1990, ETM of 2000, and OLI of 2010 and 2019 of Lake Abaya-Chamowetland, having spatial resolution of 30 m were downloaded from the website(https://earthexplorer.usgs.gov/) of the US Geological Survey (USGS) (Table 1). Satellite data is the basicsource of information which can be used for mapping and change detection in different land use/landcover categories of an area over the period of time. Landsat images captured during January andFebruary were preferred since these dates enable to acquire satellite images free of the impact of cloudcover and to avoid the effect of seasonal variation on the classi�cation of LULC classes. Ancillary datawere also utilized during analysis. All data (images) were projected to the Universal Transverse Mercator(UTM) projection system, zone 37N and datum of World Geodetic System-84 (WGS84) to ensureconsistency between datasets during analyses.
Table 1. Sensor Type, Resolution, Acquisition Date and Source of Satellite Images used for the Study
Sensor Type Resolution Path/Row Acquisition Date Source
Landsat-5 TM 30 m 169/56, 169/55 Jan 12, 1990 http://earthexplore.usgs.gov
Landsat-7 ETM+ 30 m 169/56, 169/55 Jan 27, 2000 http://earthexplore.usgs.gov
Landsat-8 OLI 30 m 169/56, 169/55 Mar 05, 2010 http://earthexplore.usgs.gov
Landsat-8 OLI 30 m 169/56, 169/55 Mar 10, 2019 http://earthexplore.usgs.gov
Source: Own Summary, 2020
The imageries were checked against any defects such as striping. All image scenes were subjected toimage processing using ENVI software (version 5.3), and each was clipped using the base-map of lakeAbaya-Chamo wetland. Geometric and radiometric corrections were made for the images of the fourperiods (Table 1). The two scenes (i.e. the one that fall within path 169 and row 56, and the other that fallin path 169 and row 55) of each data set were mosaicked using linear contrast stretching and histogramequalization technique to create a single image covering the whole study area for each period.
Image Classi�cation
Landsat TM of 1990, ETM+ of 2000, and OLI of 2010 and 2019 were also classi�ed using supervisedclassi�cation (maximum likelihood technique) separately to identify LULC classes of the study area. Thismethod assumes the normal distribution of DN values, allowing the function to determine the probabilityof a pixel belonging to a speci�c feature class and assign each pixel to the highest probability class(Lillesand et al., 2004). The classi�cations were repeated numerous times by adding more training sitesso as to come up with satisfactory results. Supervised classi�cation was chosen to compare the outputs
Page 7/25
with results of the unsupervised classi�cation; this was particularly vital for this study because itidenti�es and locates LULC types, which are known priori through a combination of interpretation ofaerial photography, survey analysis and �eldwork.
In the accuracy assessment, confusion matrices and Kappa coe�cient of agreement were calculated foreach classi�cation map. Estimation of Kappa coe�cients yields statistics, which are measures ofagreement or accuracy between the remote sensing–derived classi�cation map and reference data (asshown by the major diagonal) and the chance agreement, which is indicated by the row and columntotals (referred to as marginal) (Jensen, 2009). The classi�cation results were compared with the groundtruth (data) to con�rm accuracy of the classi�cation process. It is a way of assuring how many groundtruth pixels were classi�ed correctly, and how much errors were propagated during data acquisition,analysis and conversion (Edwards et al., 1998).
Accuracy Assessment
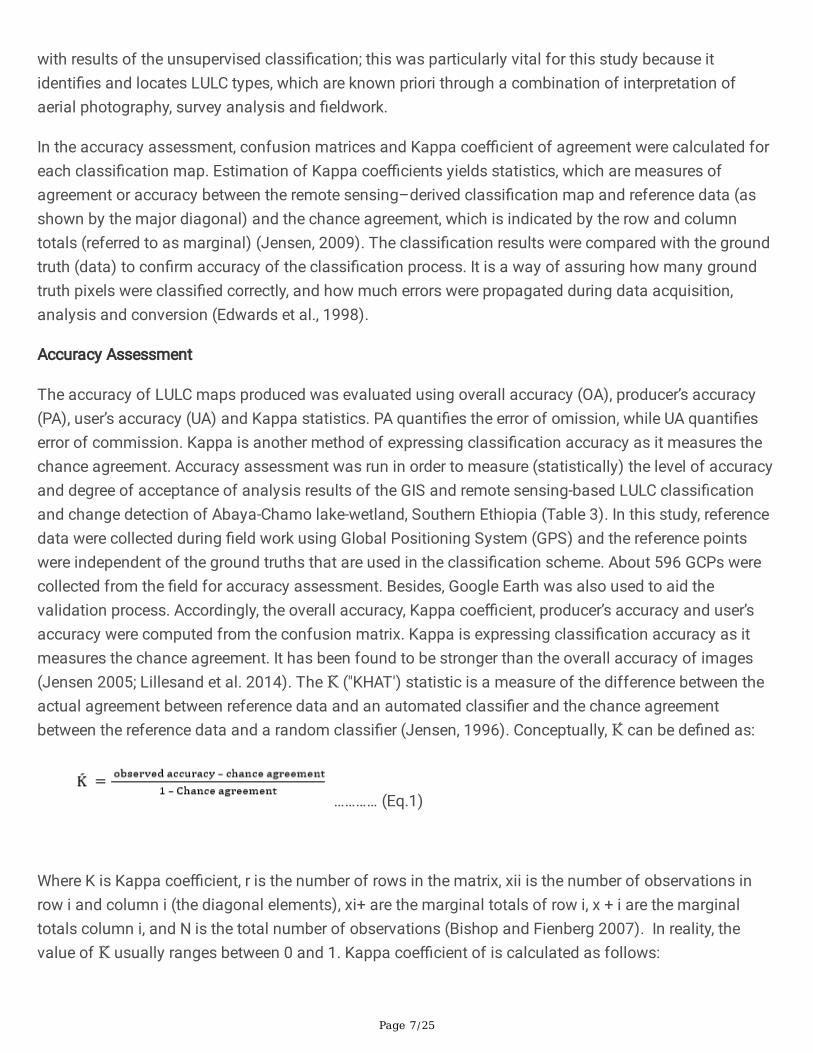
The accuracy of LULC maps produced was evaluated using overall accuracy (OA), producer’s accuracy(PA), user’s accuracy (UA) and Kappa statistics. PA quanti�es the error of omission, while UA quanti�eserror of commission. Kappa is another method of expressing classi�cation accuracy as it measures thechance agreement. Accuracy assessment was run in order to measure (statistically) the level of accuracyand degree of acceptance of analysis results of the GIS and remote sensing-based LULC classi�cationand change detection of Abaya-Chamo lake-wetland, Southern Ethiopia (Table 3). In this study, referencedata were collected during �eld work using Global Positioning System (GPS) and the reference pointswere independent of the ground truths that are used in the classi�cation scheme. About 596 GCPs werecollected from the �eld for accuracy assessment. Besides, Google Earth was also used to aid thevalidation process. Accordingly, the overall accuracy, Kappa coe�cient, producer’s accuracy and user’saccuracy were computed from the confusion matrix. Kappa is expressing classi�cation accuracy as itmeasures the chance agreement. It has been found to be stronger than the overall accuracy of images(Jensen 2005; Lillesand et al. 2014). The K ("KHAT') statistic is a measure of the difference between theactual agreement between reference data and an automated classi�er and the chance agreementbetween the reference data and a random classi�er (Jensen, 1996). Conceptually, K can be de�ned as:
………… (Eq.1)
Where K is Kappa coe�cient, r is the number of rows in the matrix, xii is the number of observations inrow i and column i (the diagonal elements), xi+ are the marginal totals of row i, x + i are the marginaltotals column i, and N is the total number of observations (Bishop and Fienberg 2007). In reality, thevalue of K usually ranges between 0 and 1. Kappa coe�cient of is calculated as follows:
Page 8/25
…………… (Eq.2)
Where: 𝑁 is the total number of observations in the entire error matrix, 𝑘 is the total number of classes orcategories, 𝑥𝑖𝑖 refers to the number of observations correctly classi�ed for a particular category, and 𝑥𝑖+
and 𝑥+𝑖 refer to the marginal totals for row i and column i associated with the category. Assessing theoverall levels of accuracy of the supervised classi�cation for the years 1990, 2000, 2010, and 2019 wasfound as 88.9, 90.21, 91.20 and 97.92% respectively by adopting confusion matrix technique and 0.887,089, 0.884 and 0.968 of kappa index value (Table3).
Collection of Field Data
Reference data were collected for training and validation of each LULC type of Abaya-Chamo lakewetland for each satellite image in each period. Geographic locations of ground truth LULC classes, usedto calibrate the classification procedure, were identified using high spatial resolution imagery made freelyavailable through Google Earth Pro. About 596 reference samples were derived from the LULC of the lake-wetland in 2019 and via the support of Spot map of 2019. Reference data for 2019 were collected directlyfrom the �eld between September 2018 to February 2019 using handheld GPS. About 100, 100, 100, 100,96 and 100 GCP samples were collected for 1990, 2000, 2010 and 2019, respectively, which were used foraccuracy assessment.
Veri�cation of the mapped lake-wetland was done through �eld visits, comparison with features onGoogle Earth and the DEM, and the use of prior knowledge of features present in the study area. Theground-truth points were randomly chosen. Ground-truthiness of the mapped features was necessary forthe veri�cation and accuracy assessment of the features.
Change detection
To analyze the patterns of LULC change, post classi�cation comparison approach was performed. Tistechnique provides the detailed “from-to” information and minimizes the possible effects of atmosphericvariations and sensor differences (Lu et, al. 2004). Therefore, Landsat imageries of the three referenceyears were �rst independently classi�ed. Now, the classi�ed imageries were compared and changestatistics were computed by comparing image values of one data set with the corresponding values ofthe second data set. The comparison values were summarized and presented in terms of area change inhectares, percentages and rate of change. The extent of area change (total change) for each LULC classwas obtained by subtracting the area of initial year (oldest date) from the value of recent date (�nal year)of the study period.
Arc Map GIS 10.5 raster calculator was used to perform the change detection analysis. Change detectionanalysis was applied on results of the supervised classi�cation about the six LULC classes of Abaya-Chamo lake-wetland for periods 1990 -2000, 2000 -2010, 2010 - 2019 and 1990 - 2019. The magnitude ofarea change of each LULC class in each period was calculated as follow:
Page 9/25
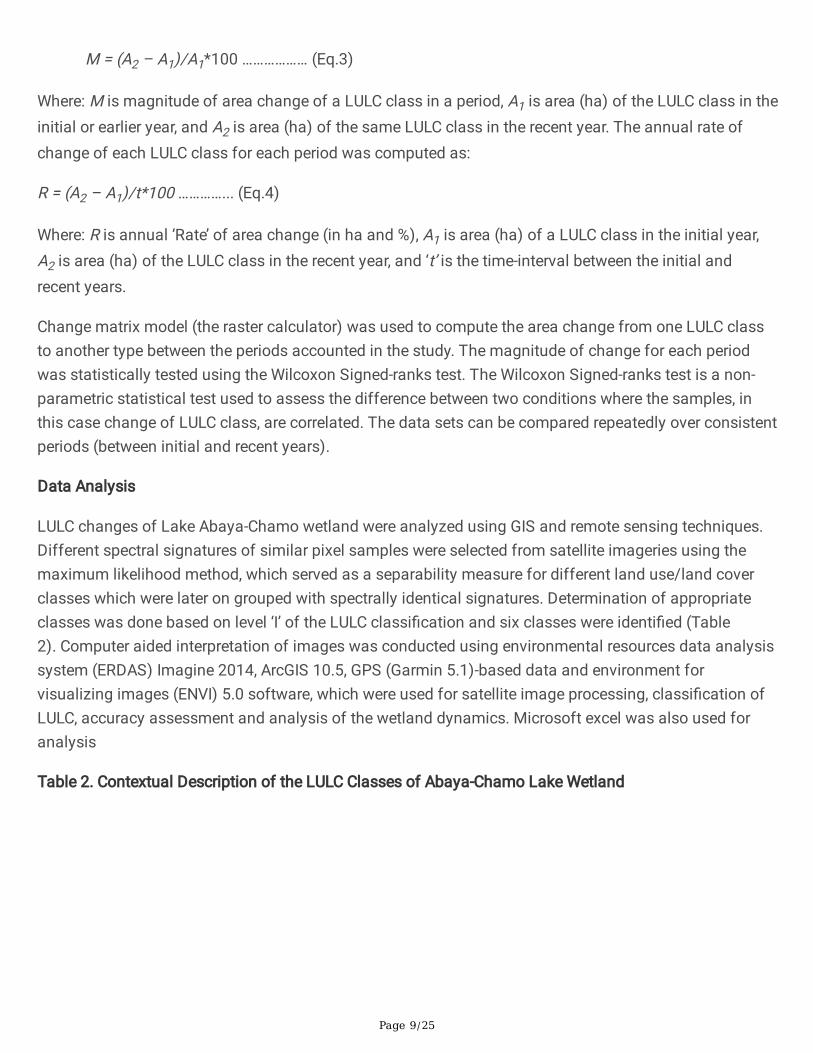
M = (A2 – A1)/A1*100 ……………… (Eq.3)
Where: M is magnitude of area change of a LULC class in a period, A1 is area (ha) of the LULC class in theinitial or earlier year, and A2 is area (ha) of the same LULC class in the recent year. The annual rate ofchange of each LULC class for each period was computed as:
R = (A2 – A1)/t*100 …………... (Eq.4)
Where: R is annual ‘Rate’ of area change (in ha and %), A1 is area (ha) of a LULC class in the initial year,A2 is area (ha) of the LULC class in the recent year, and ‘t’ is the time-interval between the initial andrecent years.
Change matrix model (the raster calculator) was used to compute the area change from one LULC classto another type between the periods accounted in the study. The magnitude of change for each periodwas statistically tested using the Wilcoxon Signed-ranks test. The Wilcoxon Signed-ranks test is a non-parametric statistical test used to assess the difference between two conditions where the samples, inthis case change of LULC class, are correlated. The data sets can be compared repeatedly over consistentperiods (between initial and recent years).
Data Analysis
LULC changes of Lake Abaya-Chamo wetland were analyzed using GIS and remote sensing techniques.Different spectral signatures of similar pixel samples were selected from satellite imageries using themaximum likelihood method, which served as a separability measure for different land use/land coverclasses which were later on grouped with spectrally identical signatures. Determination of appropriateclasses was done based on level ‘I’ of the LULC classi�cation and six classes were identi�ed (Table2). Computer aided interpretation of images was conducted using environmental resources data analysissystem (ERDAS) Imagine 2014, ArcGIS 10.5, GPS (Garmin 5.1)-based data and environment forvisualizing images (ENVI) 5.0 software, which were used for satellite image processing, classi�cation ofLULC, accuracy assessment and analysis of the wetland dynamics. Microsoft excel was also used foranalysis
Table 2. Contextual Description of the LULC Classes of Abaya-Chamo Lake Wetland
Page 10/25
LULC type Description/De�nition
Agriculture
Farmland used for growing cereals, tuber and root crops, agroforestry practice andhorticulture including currently uncultivated (arable) land and fallowed plots.
Shrubland
Area covered with more of short, hard woody stem trees (bushes), limited herbaceousplants (shrubs) and isolated trees which often are mixed with undergrowth of grasses.
Forest
Area of dense, tall trees having interlocked canopies, including woodland and riverineforests
Swamp/
wetland
Is spongy, soft, wet/marshy land saturated with water, adjacent to Abaya and Chamolakes, and on the banks of tributary-rivers (of the lakes) having permanent and seasonalgrasses.
Waterbody
Area with temporary and permanent water cover which includes lakes, intermittentponds and other areas with shallow water cover.
Settlement
Consists of homesteads of rural villages and buildings of urban areas (with commercialand residential purposes), camps, warehouses, roads and other infrastructures
Results And DiscussionAccuracy Assessment
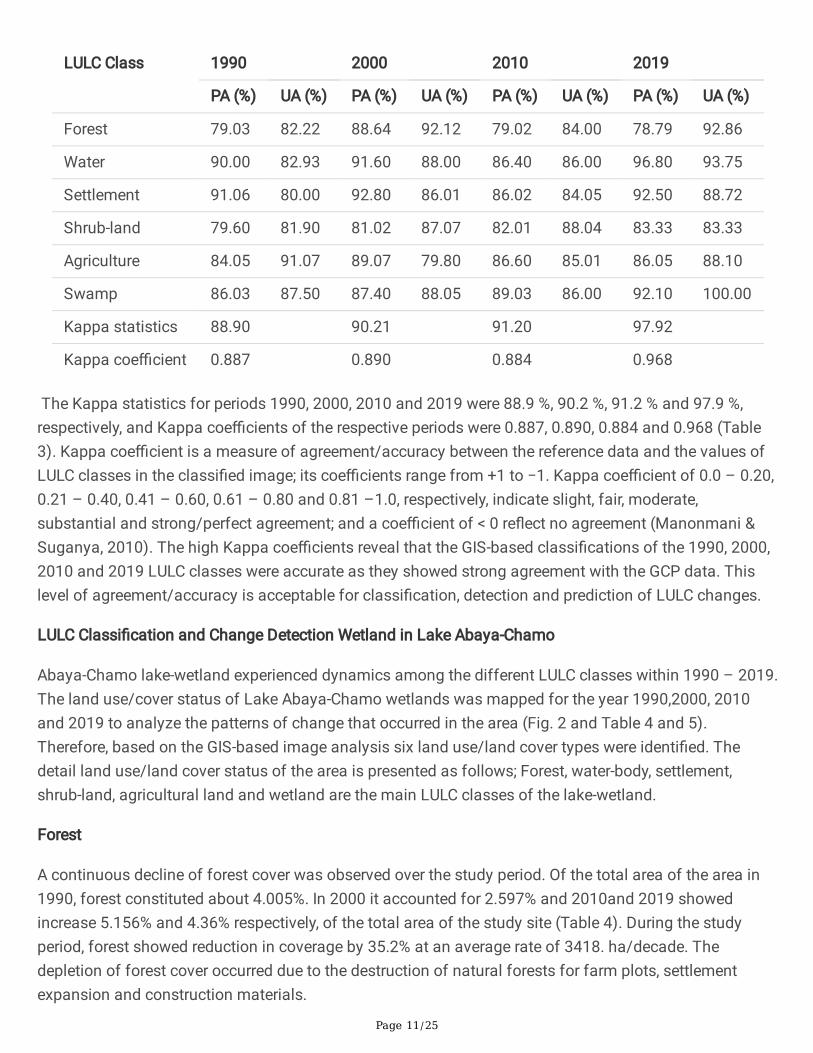
Accuracy levels of all the six LULC classes upon values of both the Producer’s Accuracy (PA) and User’sAccuracy (UA) were approximately 80 % and above except the PA of ‘forest’ for the period 1990 (79.03 %),2010 (79.02 % and 2019 (78.79 %) (Table 3). The low accuracy level of forest in the three periods understudy could be perhaps due to proximity in the spectral/re�ectance value of ‘forest’ to that of‘agroforestry’ (agriculture) of mango trees, which creates ambiguity during image classi�cation. Anyway,results of the PA and UA indicate that all the classi�ed LULC classes of 1990, 2000, 2010 and 2019satisfy the recommended accuracy level (above 80 %); that is, there are strong agreements between theclassi�ed LULC classes and the GCP data.
Table 3. Producer’s Accuracy (PA) and User’s Accuracy (UA) of LULC Maps of 1990, 2000, 2010 and 2019
Page 11/25
LULC Class 1990 2000 2010 2019
PA (%) UA (%) PA (%) UA (%) PA (%) UA (%) PA (%) UA (%)
The Kappa statistics for periods 1990, 2000, 2010 and 2019 were 88.9 %, 90.2 %, 91.2 % and 97.9 %,respectively, and Kappa coe�cients of the respective periods were 0.887, 0.890, 0.884 and 0.968 (Table3). Kappa coe�cient is a measure of agreement/accuracy between the reference data and the values ofLULC classes in the classi�ed image; its coe�cients range from +1 to −1. Kappa coe�cient of 0.0 – 0.20,0.21 – 0.40, 0.41 – 0.60, 0.61 – 0.80 and 0.81 –1.0, respectively, indicate slight, fair, moderate,substantial and strong/perfect agreement; and a coe�cient of < 0 re�ect no agreement (Manonmani &Suganya, 2010). The high Kappa coe�cients reveal that the GIS-based classi�cations of the 1990, 2000,2010 and 2019 LULC classes were accurate as they showed strong agreement with the GCP data. Thislevel of agreement/accuracy is acceptable for classi�cation, detection and prediction of LULC changes.
LULC Classi�cation and Change Detection Wetland in Lake Abaya-Chamo
Abaya-Chamo lake-wetland experienced dynamics among the different LULC classes within 1990 – 2019.The land use/cover status of Lake Abaya-Chamo wetlands was mapped for the year 1990,2000, 2010and 2019 to analyze the patterns of change that occurred in the area (Fig. 2 and Table 4 and 5).Therefore, based on the GIS-based image analysis six land use/land cover types were identi�ed. Thedetail land use/land cover status of the area is presented as follows; Forest, water-body, settlement,shrub-land, agricultural land and wetland are the main LULC classes of the lake-wetland.
Forest
A continuous decline of forest cover was observed over the study period. Of the total area of the area in1990, forest constituted about 4.005%. In 2000 it accounted for 2.597% and 2010and 2019 showedincrease 5.156% and 4.36% respectively, of the total area of the study site (Table 4). During the studyperiod, forest showed reduction in coverage by 35.2% at an average rate of 3418. ha/decade. Thedepletion of forest cover occurred due to the destruction of natural forests for farm plots, settlementexpansion and construction materials.
Page 12/25
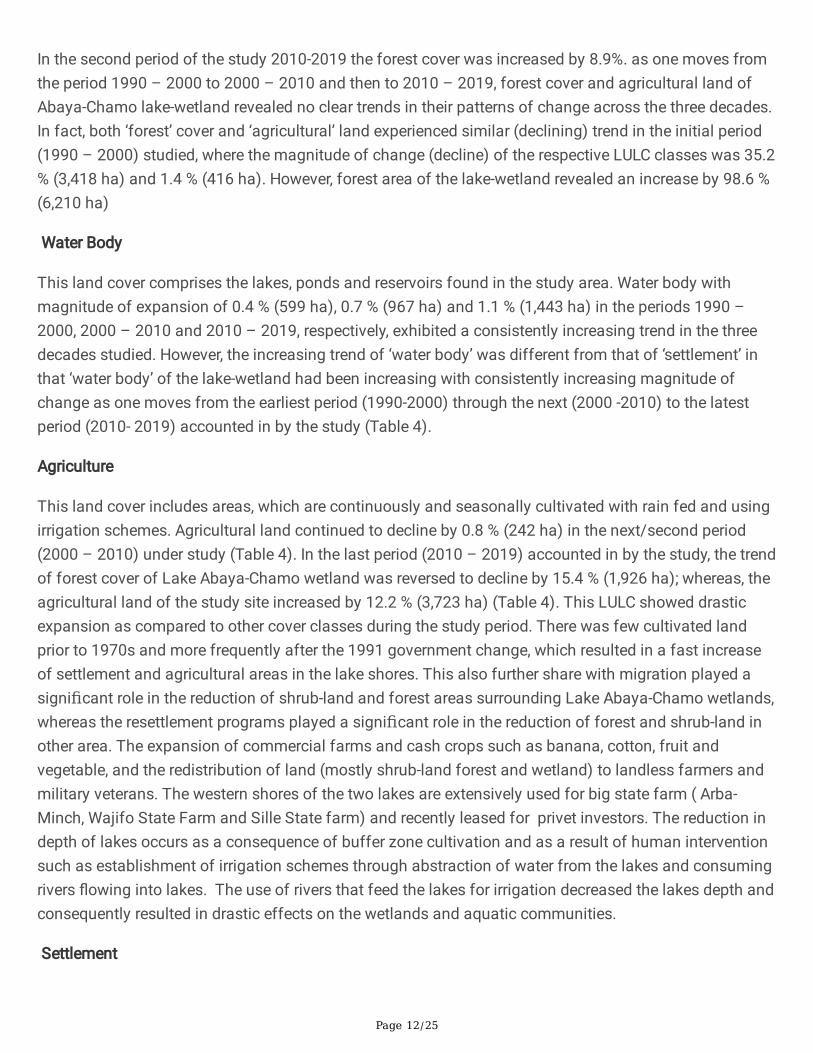
In the second period of the study 2010-2019 the forest cover was increased by 8.9%. as one moves fromthe period 1990 – 2000 to 2000 – 2010 and then to 2010 – 2019, forest cover and agricultural land ofAbaya-Chamo lake-wetland revealed no clear trends in their patterns of change across the three decades.In fact, both ‘forest’ cover and ‘agricultural’ land experienced similar (declining) trend in the initial period(1990 – 2000) studied, where the magnitude of change (decline) of the respective LULC classes was 35.2% (3,418 ha) and 1.4 % (416 ha). However, forest area of the lake-wetland revealed an increase by 98.6 %(6,210 ha)
Water Body
This land cover comprises the lakes, ponds and reservoirs found in the study area. Water body withmagnitude of expansion of 0.4 % (599 ha), 0.7 % (967 ha) and 1.1 % (1,443 ha) in the periods 1990 –2000, 2000 – 2010 and 2010 – 2019, respectively, exhibited a consistently increasing trend in the threedecades studied. However, the increasing trend of ‘water body’ was different from that of ‘settlement’ inthat ‘water body’ of the lake-wetland had been increasing with consistently increasing magnitude ofchange as one moves from the earliest period (1990-2000) through the next (2000 -2010) to the latestperiod (2010- 2019) accounted in by the study (Table 4).
Agriculture
This land cover includes areas, which are continuously and seasonally cultivated with rain fed and usingirrigation schemes. Agricultural land continued to decline by 0.8 % (242 ha) in the next/second period(2000 – 2010) under study (Table 4). In the last period (2010 – 2019) accounted in by the study, the trendof forest cover of Lake Abaya-Chamo wetland was reversed to decline by 15.4 % (1,926 ha); whereas, theagricultural land of the study site increased by 12.2 % (3,723 ha) (Table 4). This LULC showed drasticexpansion as compared to other cover classes during the study period. There was few cultivated landprior to 1970s and more frequently after the 1991 government change, which resulted in a fast increaseof settlement and agricultural areas in the lake shores. This also further share with migration played asignificant role in the reduction of shrub-land and forest areas surrounding Lake Abaya-Chamo wetlands,whereas the resettlement programs played a significant role in the reduction of forest and shrub-land inother area. The expansion of commercial farms and cash crops such as banana, cotton, fruit andvegetable, and the redistribution of land (mostly shrub-land forest and wetland) to landless farmers andmilitary veterans. The western shores of the two lakes are extensively used for big state farm ( Arba-Minch, Wajifo State Farm and Sille State farm) and recently leased for privet investors. The reduction indepth of lakes occurs as a consequence of buffer zone cultivation and as a result of human interventionsuch as establishment of irrigation schemes through abstraction of water from the lakes and consumingrivers �owing into lakes. The use of rivers that feed the lakes for irrigation decreased the lakes depth andconsequently resulted in drastic effects on the wetlands and aquatic communities.
Settlement
Page 13/25
As is illustrated in Table 4, settlement area in the Western coast of Abaya-Chamo lake-wetland revealed acontinuously increasing trend in the three periods accounted in by the study, that is, where it hasexpanded by 47.1 % (5,147 ha), 27.2 % (4,373 ha) and 55.3 % (11,298 ha) in the periods 1990 – 2000,2000 – 2010 and 2010 – 2019, respectively. Population density of the lakes basin is 167 persons perkm2, which is three times the average for the country.
Table 4. Area Change (ha) between LULC Classes of Lake Abaya-Chamo Wetland 1990- 2019
This land cover contains short; grazing lands, tress, grass and bushes, which have an opened cover. Shrub-land area revealed consistently declining trends in the three periods within 1990 – 2019. Forinstance, ‘shrubland’ cover with magnitude of change of 2.4 % (1,212 ha), 21.1 % (10,441 ha) and 33.6 %(13,114 ha) in the period 1990 – 2000, 2000 – 2010 and 2010 – 2019, respectively, exhibited continuousdecline in three decades.
Wetlands
This land cover includes areas seasonally or permanently wet or �ooded and also have swampyvegetation cover (often short and tall grass, and hydrophytes vegetation at the buffer of the lakes).Wetland/swamp area has continuously declined throughout 1990 – 2000, 2000 – 2010 and 2010 – 2019where its magnitude of shrinkage in the respective periods was 11.4 % (700 ha), 16 % (867 ha) and 31.3% (1,424 ha) (Table 4). Conversion to water body and cropland (cash crop farming) contributed to thecontinuous decline of ‘swamp’ area (Zekarias et al., 2021). In fact, Ethiopia has experienced a nearly lossof Harromaya lake and its swamp area due to LULC dynamics and the use of the lake’s tributaries forirrigation farming (Giweta and Worku, 2018).
Page 14/25
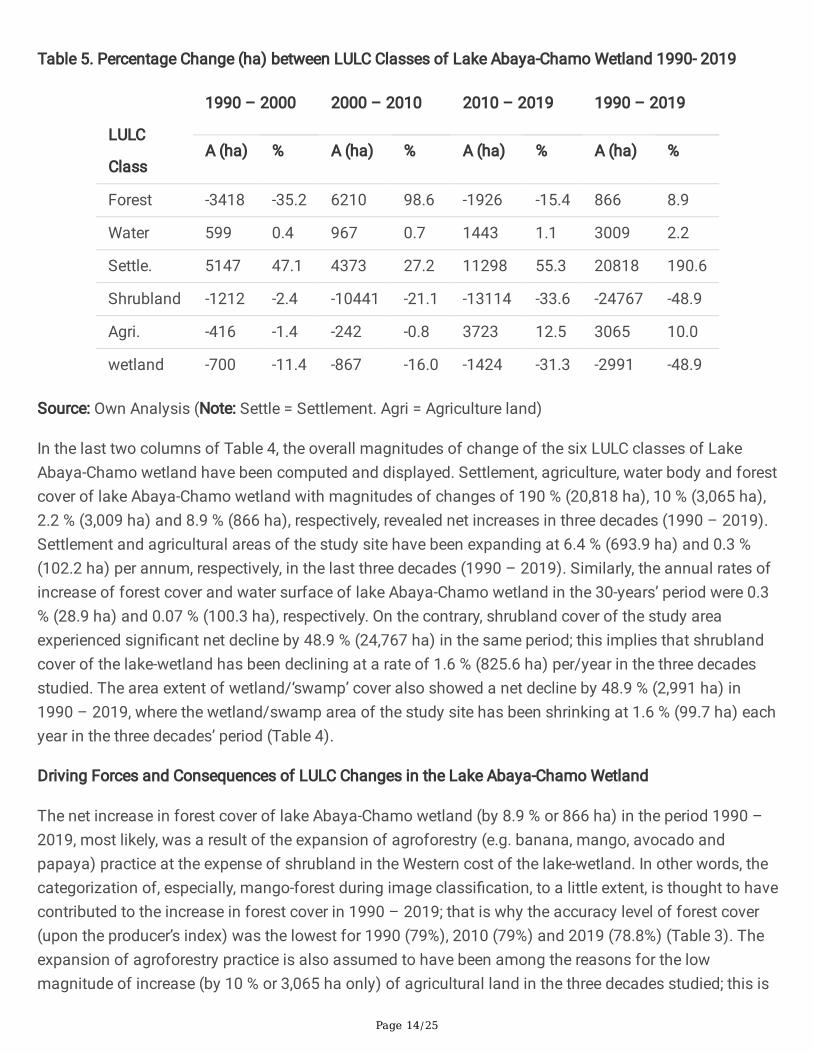
Table 5. Percentage Change (ha) between LULC Classes of Lake Abaya-Chamo Wetland 1990- 2019
In the last two columns of Table 4, the overall magnitudes of change of the six LULC classes of LakeAbaya-Chamo wetland have been computed and displayed. Settlement, agriculture, water body and forestcover of lake Abaya-Chamo wetland with magnitudes of changes of 190 % (20,818 ha), 10 % (3,065 ha),2.2 % (3,009 ha) and 8.9 % (866 ha), respectively, revealed net increases in three decades (1990 – 2019).Settlement and agricultural areas of the study site have been expanding at 6.4 % (693.9 ha) and 0.3 %(102.2 ha) per annum, respectively, in the last three decades (1990 – 2019). Similarly, the annual rates ofincrease of forest cover and water surface of lake Abaya-Chamo wetland in the 30-years’ period were 0.3% (28.9 ha) and 0.07 % (100.3 ha), respectively. On the contrary, shrubland cover of the study areaexperienced signi�cant net decline by 48.9 % (24,767 ha) in the same period; this implies that shrublandcover of the lake-wetland has been declining at a rate of 1.6 % (825.6 ha) per/year in the three decadesstudied. The area extent of wetland/‘swamp’ cover also showed a net decline by 48.9 % (2,991 ha) in1990 – 2019, where the wetland/swamp area of the study site has been shrinking at 1.6 % (99.7 ha) eachyear in the three decades’ period (Table 4).
Driving Forces and Consequences of LULC Changes in the Lake Abaya-Chamo Wetland
The net increase in forest cover of lake Abaya-Chamo wetland (by 8.9 % or 866 ha) in the period 1990 –2019, most likely, was a result of the expansion of agroforestry (e.g. banana, mango, avocado andpapaya) practice at the expense of shrubland in the Western cost of the lake-wetland. In other words, thecategorization of, especially, mango-forest during image classi�cation, to a little extent, is thought to havecontributed to the increase in forest cover in 1990 – 2019; that is why the accuracy level of forest cover(upon the producer’s index) was the lowest for 1990 (79%), 2010 (79%) and 2019 (78.8%) (Table 3). Theexpansion of agroforestry practice is also assumed to have been among the reasons for the lowmagnitude of increase (by 10 % or 3,065 ha only) of agricultural land in the three decades studied; this is
Page 15/25
so because, smallholder farmers in the Western coast of the lake-wetland were indicated to have beenreplacing the maize-dominated cereal croplands with banana and mango-dominated agroforestry (Gelaw,2007); that is why (despite the increasing human population in Abaya-Chamo depression/basin)agricultural land of the study site had exhibited decreasing trend by 1.4 % (416 ha) in 1990 – 2000 andby 0.8 % (242 ha) in 2000 – 2010 (Table 4). In fact, the lateral expansion of Abaya and Chamo lakes’water was also the other driving force for the decline of agricultural land; the siltation-led expansion ofthe lake water, according to a priest (age 58) having farmland in Lante Kebele (administrative unit)(Western cost of lake Abaya), has invaded signi�cant share of his farmland and the landholdings of othersmallholder farmers who have farm-plots proximate to the lake.
Population growth-induced expansion of settlement (by 190 % or 20,818 ha) in the study area (in 1990 -2019) has also contributed for the signi�cant decline in shrubland cover (Table 3). An informant (age 47)also added that migrants played signi�cant role in the reduction of shrubland area surrounding Abayaand Chamo lakes. Result of the GIS-based change detection revealed that ‘shrubland’ of the study sitehas been declining at progressively increasing magnitudes of changes in 1990 – 2019; that is, where itsmagnitude of decline was small (2.4 % or 1,212 ha) in 1990 – 2000, medium (21.1 % or 10,441 ha) in2000 – 2010 and the largest (33.6 % or 13,114 ha) in the latest period (2010 – 2019) studied (Table 3).This happened largely due to increasing conversion of ‘shrubland’ to cropland (since the turn of the 21st
C) by local farmers and small-scale investors who began extensive use of the salty-water of Abaya andChamo lakes for irrigation-based cash crop production (e.g. banana, mango, papaya, tomato, cabbage,onion,) in the Western coast and adjacent areas of the lake-wetland, according an expert (age 54) inNatural Resource Management and own �eld observation.
The high annual rate of expansion of settlement (by 6.4 % or 693.9 ha) in 1990 – 2019 was aconsequence of various factors such as rural to rural migration (in-migration) to the plain Western coastsof the wetland, natural increase-induced expansion of rural villages, and development and expansion ofinfrastructures (Arba-Minch University, Arba-Minch Airport Terminal, modern irrigation structures, concreteand asphalted roads, and the Arba-Minch Crocodile Ranch) surrounding the lake-wetland. Expansion ofurban centers like Birbir (Mirab-Abaya) town and Arba-Minch city was also a vital cause for the high rateof settlement expansion in the study site, which was underlain by natural increase and rural to urbanmigration-led rapid population growth (Zekarias et al., 2021). Studies also revealed that the degradationof forest, woodland and shrubland covers in the Western coast of the Abaya-Chamo depression wascaused by fast population growth-led expansion of settlement and agriculture, which was rooted by highmagnitude of in-migration from Gamo-highlands and Wolaiyta areas since the 1960s (Gelaw,2019; Zekarias et al., 2021). Abaya-Chamo wetland ecosystem is under considerable stress due tounsustainable resource exploitation, inadequate and inappropriate management, degradation of thelakes’ catchment and the rising demand for water, �sh and farm products.
‘Swamp’ area of the lake-wetland, like shrubland cover, has been decreasing at progressively increasingmagnitudes of changes in the four decades’ period (1990 – 2019); that is, where the magnitude of declineof the swamp cover was smaller (11.4 % or 700 ha) in the initial period (1990 -2000), moderate (16 % or
Page 16/25
867 ha) in 2000 – 2010 and the largest (31.3 % or 1,424 ha) in the latest period (2010 – 2019) accountedin by the study (Table 3). This is mainly a result of the progressively increasing sediment load into Abayaand Chamo lakes (Schütt et al., 2002). Meaning, land degradation in the Western Escarpment of theSouthern Rift-Valley of Ethiopia [due to exploitation of fuel-wood and construction materials, overgrazing,over-browsing, and conversion of forest and woodland to cropland and settlement (Kebede, 2012; Assefaand Bork, 2016; Gelaw, 2019)] has resulted in increasing siltation in the �oors of Abaya and Chamo lakes;the increasing siltation, in turn, led to the decline depth of the lakes (Schütt et al., 2002), and thedisplacement and lateral expansion of the lakes’ water, and the subsequent shrinkage of the ‘swamp’ area(Zekarias et al., 2021) of the lake-wetland by 48.9 % (2,991 ha) within 1990 – 2019 (Table 3). That is, theprogressively increasing siltation-led expansion of ‘water’ body was the main cause of decline of the‘swamp’ area of Abaya-Chamo lake-wetland; this is so because, the progressively increasing magnitudeof increasing trend of ‘water’ body had been accompanied by progressively increasing magnitude ofdecline trend of ‘swamp’ area in the three decades’ period as these LULC classes are con�guratedinherently adjacent to each other (Table 3 and Figure 2). Analysis results of the NDVI and NDWI alsocon�rm the contradicting trends of ‘wet/swamp’ area and ‘water’ cover of the lake-wetland (Table 5 andFigure 3). Anyway, siltation problem of Abaya and Chamo lakes is the main cause of swamp area loss, aconsequence of LULC dynamics and a vital degradation indicator of the lake-wetland.
Population increase-led expansion of settlement (infrastructures), agroforestry practice and droughtmight have been the other driving forces of the decline of ‘swamp’ area, especially, in 1990 – 2000 sincethe magnitude of decline of ‘swamp’ area had exceeded the magnitude of expansion of ‘water’ body by101 ha in the same period (Table 3). Overgrazing and intensive livestock grazing induced compaction ofthe spongy soil/land might also have a slight contribution to the shrinkage of the ‘swamp’ area of LakeAbaya-Chamo wetland. Generally, studies indicate that farm expansion, sedimentation, eutrophication,pollution by chemical farm-inputs, open access and overuse of resources, diverting water for irrigation,poor catchment management, etc., were among the major drivers of LULC dynamics and wetlanddegradation in different parts of Ethiopia (Tenalem, 2009; Simane et al., 2013; Teklu and Kassahun, 2017;Giweta and Worku, 2018).
ConclusionLake Abaya-Chamo wetland is getting threatened overtime due to largely anthropogenic factors-inducedLULC dynamics in the period 1990–2019. Settlement, agriculture, water body and forest cover of the lake-wetland showed net increases in three decades. Whereas, shrubland and ‘swamp’ area experiencedsigni�cant net decline (by almost half of each) in 30 years. While settlement and water body increased atprogressively increasing magnitudes of changes in three decades, shrubland and swamp cover declinedat progressively increasing magnitudes of loss in the same periods. Increasing agroforestry practice bysmallholder farmers and small-scale investors overtime contributed to the net increase in forest cover,and for the huge magnitude of shrinkage of shrubland (by 48.9 %) in lake Abaya-Chamo wetland. Declineof shrubland and natural forest was also driven by settlement and farm expansion. Generally, the LULCdynamics led to depletion of natural forest and shrubland in the coasts and uplands of the lake-basin,
Page 17/25
increasing runoff erosion and sediment load into plus pollution of the lake-wetland, invasion of the lakesby a strange plant water hyacinth(‘emboch’), siltation-led displacement of the lakes’ water, area shrinkageand loss of biodiversity of the swamp, and to the overall degradation of lake Abaya-Chamo -wetland andits ecological services in the Southern Rift-Valley of Ethiopia.
To curb the impact of LULC dynamics on wetlands, the government should: (i) formulate clear policy,institutional and legal framework on the management of wetlands; (ii) revise the investment policy andenforcement of impact assessment; (iii) enforce ‘user tax’ (on users of land, water) and/or ‘pollutioncharge’ (on polluters of land, water) on investors in agriculture and other sectors in risky areas, adjacentto wetlands; (iv) reforest and afforest the uplands surrounding wetlands; and (v) revise the policy on theallocation of land uses.
AbbreviationsETB: The Ethiopian Birr
FGD: Focus group discussion
HHH: Household head
TLU: Total Livestock Unite
SPSS: Statistical Package for the Social science
NDVI: Normalized Differences Vegetation Index
NDWI: Normalized Difference of Water Index
DeclarationsConsent for publication
All authors have read the manuscript carefully and agreed to submit for publication.
Ethics Declarations
Competing interests
All authors con�rmed that there is no ethical con�ict.
Ethics approval
An effort was made to conduct the research in an ethical manner. A research area permission letter wasobtained from the concerned institutions and the participants’ consent was asked before commencingthe interviews, discussions and taking photographs.
Page 18/25
Funding
The �rst author acknowledges Arba Minch University for �nancial support of this study.
Availability Data
The data used to support the �ndings of this study are available from the corresponding author uponrequest.
Author information
A�liations
Tariku Zekarias: Department of Geography and Environmental Studies, Arba Minch University, PO Box 21,Arba Minch, Ethiopia, phone : +251-913682300; Email: [email protected]
Vanum Govindu: Department of Geography and Environmental Studies, Arba Minch University, POBox.21,Arba Minch,Ethiopia, phone: +251-985414821, [email protected]
Yechale Kebede: Department of Geography and Environmental Studies, Arba Minch University, PO Box 21,Arba Minch, Ethiopia, phone: +251911390405 E-mail: [email protected]
Abren Gelaw: Department of Geography and Environmental Studies, Arba Minch University, P.O.Box 21,Arba Minch, Ethiopia, phone +251913623251 E-mail [email protected]
Authors Contributions
TZ has made a substantial contribution to the conception and designing of the study, data collection,data analysis, interpretation of the results, and prepared the manuscript. VG, YK and AG have contributedto planning the study, supervising the study, editing, commenting, and suggesting ideas in the manuscriptpreparation process. Finally, all authors read and approved the �nal manuscript for publication.
Corresponding author
Correspondence to Mr. Tariku Zekarias.
Acknowledgements:
The authors wish to thank assistants of data collection for this study. We would also like to thank thereviewers of this article for their critical observations and everyone who contributed to the improvementof the paper. Finally, we gratefully acknowledge the �nancial support of the Arba Minch University.
References
Page 19/25
1. Alemayehu T, Ayenew T, Kebede S (2006) Hydrogeochemical and Lake Level Changes in theEthiopian Rift. Journal 316:290–300
2. Assefa E, Bork HR (2016) Dynamics and Driving Forces of Agricultural Landscapes in SouthernEthiopia: a Case Study of Chencha and Arba Minch Areas. Journal of Land Use Science 11(3):278–293. http://dx.doi.org/10.1080/1747423X.2014.940613
3. Baker C, Lawrence RL, Montagne C, Patten D (2007) Detection of Wetland Ecosystem Using LandsatImagery and Change Vector Analysis. Wetlands 27(3):610–619
4. Ballanti L, Byrd KB, Woo I, Ellings C (2017) Remote Sensing for Wetland Mapping and HistoricalChange Detection at Nisqually River Delta. Sustainability, 9 (1919): 1–32.
5. Bekele S (2001) Investigation of Water Resources Aimed at Multi-purpose Development with LimitedData Situation: The Case of Abaya-Chamo Basin, Ethiopia. Ph.D. Thesis, Dresden: Dresden Universityof Technology, Germany
�. Bishop YM, Fienberg SE (2007) Discrete multivariate analysis theory and practice. MIT Press,Cambridge
7. CBD (Convention on Biological Diversity) (2015) Wetlands and Ecosystem Services: CBD Press Brief.World Wetlands Day. Ramsar Convention on Wetlands and Secretariat of CBD, Gland, Switzerland.www.cbd.int
9. Creswell JW (2009) Research Design: Quantitative, Qualitative and Mixed Method Approaches. ThirdEdition, Los Angles: the SAGE Publications Ltd., USA
11. Davidson NC (2014) How Much Wetland Has the World Lost? Long-term and Recent Trends in GlobalWetland Area. Marine Freshwater Research 65:934–941
12. Dise NB (2009) Peatland Response to Global Change. Science 326:810–811
13. Dubeau P (2016) Mapping and Characterizing Wetlands and Wetland Dynamics in the Highlands ofEthiopia Using Random Forest Classi�cation. MSc Thesis Report. Ottawa: Carleton University,Ontario (Canada)
14. Elias E, Seifu W, Tesfaye B, Girmay W (2019) Impact of Land Use/Cover Changes on Lake Ecosystemof Ethiopia Central Rift Valley. Cogent Food Agriculture 5(1):1–19
15. Edwards TC, Moisen GG, Cutler DR (1998) Assessing map accuracy in a remotely sensed, ecoregion-scale cover map. Remote Sens Environ 63:73–83
1�. Erwin KL (2009) Wetlands and Global Climate Change: The Role of Wetland Restoration in aChanging World. Wetland Ecol Management 17(1):71–84
17. Feoli E, Zerihun W (2000) Fuzzy Set Analysis of the Ethiopian Rift Valley Vegetation in Relation toAnthropogenic In�uences. Plant Ecol 147:219–225
Page 20/25
1�. Galatowitsch SM (2018) Natural and Anthropogenic Drivers of Wetland Changes. In: Finlayson, C.M.,Milton G.R., Prentice R.C., and Davidson, N.C. (eds). The Wetland Book (Pp. 359–367), SpringerNature, Switzerland http://www.link.springer.com
19. Gelaw A (2007) Land Use Change and GIS-Based Land Suitability Analysis in Southern Rift Valley ofEthiopia: The Case of Lante Alluvial Fan. M.A Thesis, Addis Ababa: Addis Ababa University, Ethiopia
20. Gelaw A (2019) Analysis of the Values and Impacts of Ecosystem Services Dynamics, and Valuationof Selected Provisioning Services in Hare River Catchment, Southern Ethiopia. A PhD Dissertation,Addis Ababa: Addis Ababa University, Ethiopia
21. Giweta M, Worku Y (2018) ). Reversing the Degradation of Ethiopian Wetlands: Is It UnachievablePhrase or a Call to Effective Action?. International Jour of Env’t Sciences Natural Sciences14(5):136–146
22. Govender M, Chetty K, Bulcock H (2007) A review of hyperspectral remote sensing and its applicationin vegetation and water resource studies. Water Sa 33 (2)
23. Hussien KA (2014) Assessment of Spatiotemporal Changes of Wetlands Using GIS and RSTechniques in Dawa Chefa Area in the Northern Central Ethiopian Highlands. MSc Thesis Report,Mekelle: Mekelle University, Ethiopia
24. Jensen JR, Introductory Digital I Processing (1996) A Remote Sensing Perspective, 2nd ed.; PrenticeHall:Saddle River, NJ, USA,; ISBN 978-0131453616
25. Jensen JR (2005) Digital change detection. Introductory digital image processing, A remote sensingperspective. Pearson Prentice Hall, New York, pp 467–494
2�. Kebede Y (2012) Land Use/Cover Dynamics, Environmental Degradation and Management Practicesin Hare River Catchment, Abaya-Chamo Basin, Ethiopia, Using Geo-Spatial Technology; A Ph.DThesis, Andhra: Department of Env’tal Sciences (Andhra University), India
27. Klemas V (2011) Remote Sensing of Wetlands: Case Studies Comparing Practical Techniques. JCoastal Research 27:418–427
2�. Lambin EF, Geist HJ, Erika L (2003) Dynamics of Land Use and Land Cover Change in TropicalRegions. Annu Rev Environ Resour 28:205–214
29. Legesse T (2007) Dynamics of Wetland Ecosystems: A Study on Hydrologic Dynamics of theWetlands of Ilu-Abba Bora Highlands, Southwest Ethiopia. Master Thesis, Brussels: University ofBrussels, Switzerland
30. Lillesand MT, Kiefer WR, Dupman WJ (2004) Remote Sensing and Image Interpretation. 5th Edition.John Wiley and Sons Inc., New York, USA
31. Lillesand T, Kiefer RW, Chipman J (2014) Remote sensing and image interpretation. Wiley, New York
32. Manonmani R, Suganya GMD (2010) Remote Sensing and GIS Application in Change DetectionStudy in Urban Zone Using Multitemporal Satellite. Int J Geomat Geosci 1:60–65
33. McFeeters SK (1996) The Use of Normalized Difference Water Index in the Delineation of Open WaterFeatures. Int J Remote Sens 17:1425–1432
Page 21/25
34. MEA (Millennium Ecosystem Assessment) (2005) Ecosystems and Human Well-being: Wetlands andWater Synthesis. World Resources Institute, USA, Washington, DC. Website: http://www.maweb.org
3�. NMA (National Meteorological Agency) (2019) Climate (Temperature and Rainfall) Data Recordswithin 1982–2018. A Report by the Meteorological Station at Arba Minch University (Abaya-ChamoBasin). Addis Ababa: the NMA (Ethiopia)
37. Parry ML, Canziani OF, Palutikof JP, van der Linden PJ, Hanson C (2007) Climate Change: Impacts,Adaptation and Vulnerability. Contribution of Working Group II to the Fourth Assessment Report ofthe IPCC. Cambridge University Press: UK, Cambridge
3�. RCS (Ramsar Convention Secretariat) (2016) An Introduction to the Convention on Wetlands. FifthEdition. Gland: RCS, Switzerland
39. Simane B, Benjamin FZ, Mutlu O (2013) Agroecosystem Analysis of the Choke MountainWatersheds. Ethiopia Sustainability 5(2):592–616
40. Schütt B, Förch G, Bekele S, Thiemann S (2002) Modern Water Level and Sediment AccumulationChanges of Lake Abaya, Southern Ethiopia: A Case Study from the Northern Lake Area. DresdenUniversity of Technology, Germany, Research Report
41. Schuyt KD (2005) Economic Consequences of Wetland Degradation for Local Population in Africa.Ecol Econ 53:177–190
42. TEEB (The Economics of Ecosystems and Biodiversity) (2013) The Economics of Ecosystems andBiodiversity for Water and Wetlands. Institute for European Environmental Policy (IEEP), London
43. Teffera FE, Lemmens P, Deriemaecker A, Brendonck L, Dondeyne S, Deckers J, Bauer H, Gamo FW, DeMeester LA (2017) Call to Action: Strong Long-term Limnological Changes in the Two LargestEthiopian Rift Valley Lakes, Abaya-Chamo. Inland Waters 7:129–137
44. Teklu G, Kassahun M (2017) Threats and Opportunities to Major Rift Valley Lakes Wetlands ofEthiopia. Agri Res Tech Open Access J 9(1):555–571
45. Tenalem A (2009) Natural Lakes of Ethiopia. Research Report. Addis Ababa University Press,Ethiopia, Addis Ababa
4�. Unbushe DG (2013) Wetland Vegetation Composition and Ecology of Abaya and Chamo in Southernand Fincha-Chomen and Dabus in Western Ethiopia. A PhD. Thesis, Addis Ababa University, AddisAbaba
47. Uncha A (2014) Indigenous Soil Management Techniques and the Impact of Modern AgriculturalTechnologies in Gamo Highlands, Southern Ethiopia. Ph. D Dissertation, Pretoria: University of SouthAfrica
4�. UNEP (United Nations Environment Program) (2012) Global Environmental Outlook. Environment forthe Future We Want. UNEP, Kenya, Nairobi
Page 22/25
49. Wolde-Yohannes A, Cotter M, Kelboro G, Dessalegn W (2018) Land Use and Land Cover Changes andtheir Effects on the Landscape of Abaya-Chamo Basin, Southern Ethiopia. Land 7(1):22–33
50. Wondie A (2018) Ecological Conditions and Ecosystem Services of Wetlands in the Lake Tana Area,Ethiopia. Ecohydrology Hydrobiology 18(2):231–244
51. Wood A, Dixon A (2002) Sustainable Wetland Management in Illubabor Zone: Research ReportSummary. The University of Hudders�eld, UK, Hudders�eld
52. Zedler JB, Kercher S (2005) Wetland Resources: Status, Trends, Ecosystem Services andRestorability. Annu Rev Environ Resour 30:39–74
53. Zinabu G (2002) The Ethiopian Rift Valley Lakes: Major Threats and Strategies for Conservation. In:Tudorancea C, Taylor WD (eds) Ethiopian Rift Valley Lakes. Backhuys Publishers, Netherlands,Leiden, pp 259–271
Figures
Page 23/25
Figure 1
Lake Abaya-Chamo Wetland and Its Surrounding Areas (Source: Own Design via ArcGIS, 2021)
Page 24/25
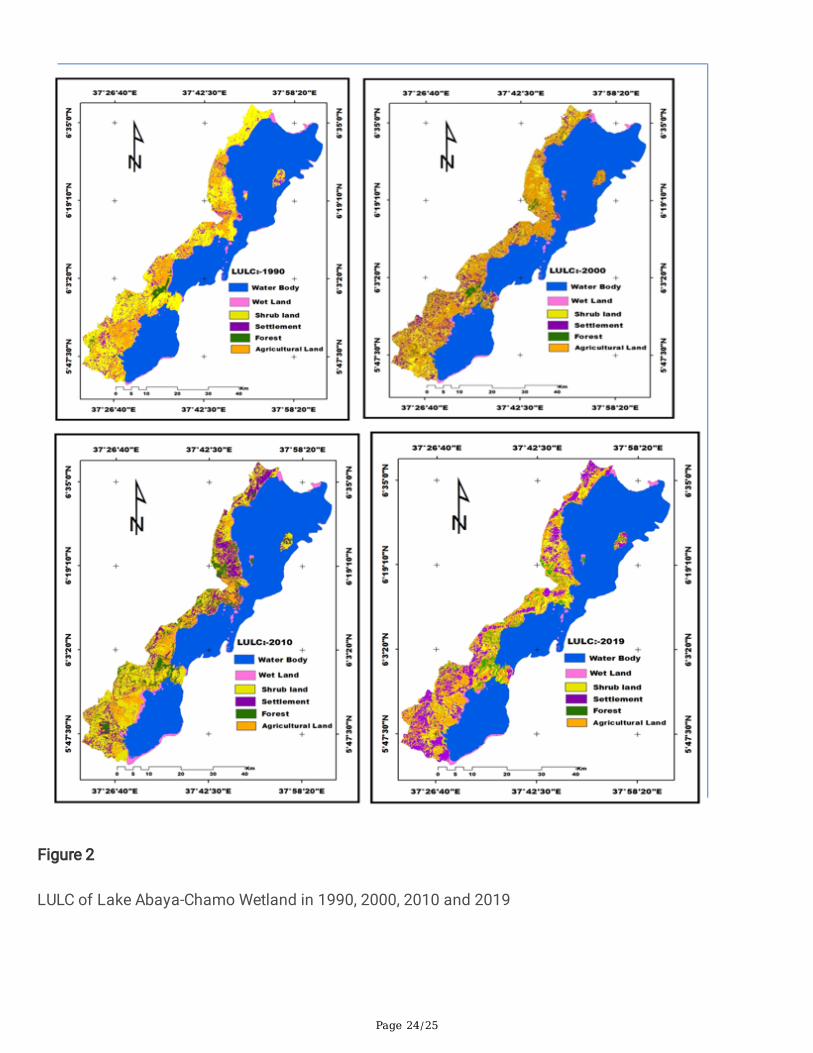
Figure 2
LULC of Lake Abaya-Chamo Wetland in 1990, 2000, 2010 and 2019
Page 25/25
Figure 3
Analysis results of the NDVI and NDWI also con�rm the contradicting trends of ‘wet/swamp’ area and‘water’ cover of the lake-wetland