Final Report Laboratory‐Scale Investigation of a Method for Enhancing the Effectiveness of Oil Dispersants in Destabilizing Water in Oil Emulsions Prepared by Joel S. Hayworth, Gerald John, Prabhakar Clement, and Vanisree Mulabagal Department of Civil Engineering Auburn University Prepared for Bureau of Safety and Environmental Enforcement U. S. Department of Interior Prepared under Contract E12PC00008 (Previously M11PC00038) January 11, 2013 This study was funded by the Bureau of Safety and Environmental Enforcement, U.S. Department of Interior, Washington, D.C., under Contract Number M11PC00038.
Transcript
Final Report
Laboratory‐Scale Investigation of a Method for Enhancing the Effectiveness of Oil Dispersants in
Destabilizing Water in Oil Emulsions
Prepared by
Joel S. Hayworth, Gerald John, Prabhakar Clement, and Vanisree Mulabagal
Department of Civil Engineering
Auburn University
Prepared for
Bureau of Safety and Environmental Enforcement
U. S. Department of Interior
Prepared under
Contract E12PC00008 (Previously M11PC00038)
January 11, 2013
This study was funded by the Bureau of Safety and Environmental Enforcement, U.S.
Department of Interior, Washington, D.C., under Contract Number M11PC00038.
i
Disclaimer
This report has been reviewed by the Bureau of Safety and Environmental Enforcement (BSEE)
and approved for publication. Approval does not signify that the contents necessarily reflect
the views and policies of the Service, nor does mention of the trade names or commercial
products constitute endorsement or recommendation for use.
ii
Acknowledgements
The authors gratefully acknowledge the funding support for this work provided by the Bureau
of Safety and Environmental Enforcement (BSEE). We also appreciate the insight and assistance
provided by Ms. Lori Medley (BSEE Oil Spill Response Research Coordinator); the assistance in
acquiring surrogate MC252 oil provided by OHMSETT’s Alan Guarino; and Auburn University’s
Dr. Clifford Lang for his help with obtaining emulsion photomicrographs. The laboratory
facilities used in this study were funded, in part, by the National Science Foundation (NSF).
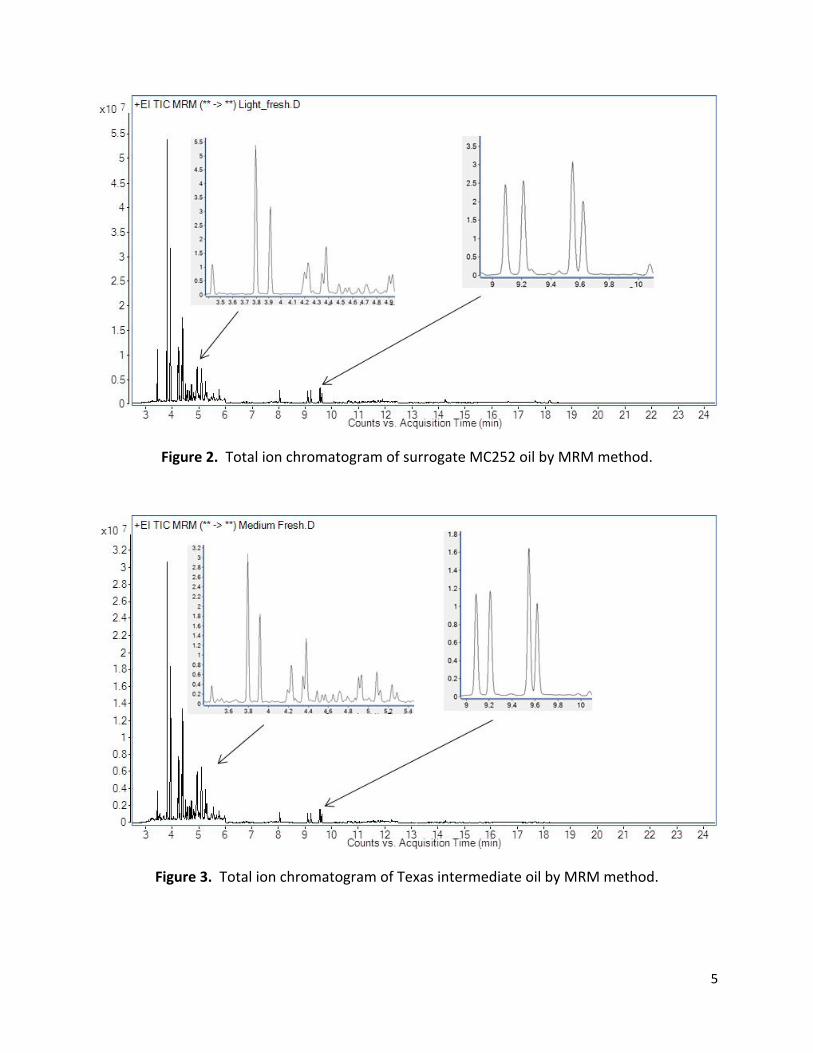
Figure 2. Total ion chromatogram of surrogate MC252 oil by MRM method.
Figure 3. Total ion chromatogram of Texas intermediate oil by MRM method.
6
Figure 4. Total ion chromatogram of MC252 emulsified oil by MRM method.
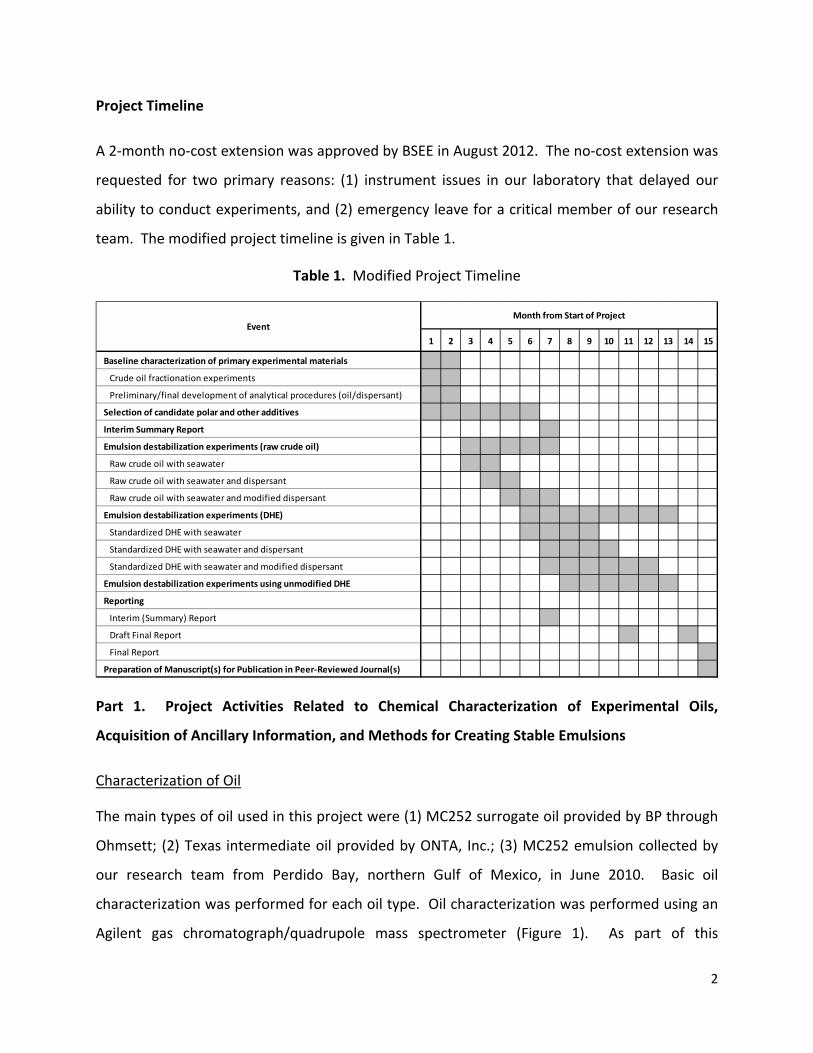
Oil Weathering Experiments
Experiments were performed to create weathered oil samples for assessment of weathering
and emulsion formation methodology, using the Texas intermediate oil. Texas intermediate oil
was used for these experiments because there were no limitations on the available volume of
this oil for the project (as opposed to the limited supply of MC252 surrogate oil and MC252
emulsion). The purpose of the weathering experiments was to simulate the major weathering
phenomena of evaporation, dissolution, and photo‐oxidation over a relatively short time
interval (approximately 25 days); examine the change in polycyclic aromatic hydrocarbon (PAH)
concentration in weathered samples over this time period; and validate our method for
establishing a chemical baseline for comparison with performance data from de‐emulsification
experiments. Three weathering scenarios were examined: (1) evaporation, dissolution, and
photo‐oxidation of raw crude oil under natural conditions; (2) evaporation and photo‐oxidation
of raw crude oil within a fume hood exposed to broad‐spectrum ultraviolet (UV) light; and (3)
evaporation, dissolution, and photo‐oxidation of raw crude oil (within fume hood exposed to
broad‐spectrum UV light) during the formation of W/O emulsions.
7
Oil Evaporation and Photo‐Oxidation under Natural Conditions. Experiments to create
weathered oil under natural conditions were conducted by placing ~250 mL of Texas
intermediate oil into un‐covered, 1 L glass beaker and placing outdoors in an area of indirect
sunlight. No attempt was made to protect this container from normal weather effects (rainfall);
hence, over the course of the experiment approximately 50 mL of water collected within the
container. Each day over the course of the experiment, samples were collected and archived
for chemical analysis. Samples were collected using disposable glass pipets (4 mL). To collect a
sample, the tip of the pipet was placed within the oil phase (overlying aqueous phase
accumulated through rainfall), and approximately 2 mL was extracted into the pipet. The
sample was transferred into a 4 mL amber glass vial with Teflon‐lined screw caps. Samples
were stored in a laboratory freezer at 4 °C until analyzed.
Oil Evaporation and Photo‐Oxidation within Fume Hood. Experiments to create weathered oil
by evaporation under fume hood and exposure to broad‐spectrum UV light (photo‐oxidation)
were conducted by placing ~250 mL of Texas intermediate oil into an un‐covered shallow glass
evaporation container and placing it in a fume hood equipped with a broad‐spectrum UV light
source. This container was not exposed to moisture and therefore no aqueous phase was
present for oil dissolution. Sample collection, sample frequency, and sample archiving was
performed in the same manner as described for the natural conditions experiments.
Oil Evaporation, Dissolution, and Photo‐Oxidation during Emulsion Formation. Experiments to
create weathered oil emulsions were conducted by placing ~250 mL of Texas intermediate oil
into an un‐covered shallow glass evaporation container with approximately 500 mL of
deionized water. This was placing in a fume hood equipped with a broad‐spectrum UV light
source. Digital mixers (Caframo Ltd., Ontario, Canada) were used to create the emulsion.
Mixing occurred at the interface between the aqueous and oil phase, and was set at a constant
rate determined by trial and error to be the most effective at creating an emulsion (~78 rpm).
Sample collection, sample frequency, and sample archiving was performed in the same manner
as described for the natural conditions experiments.
8
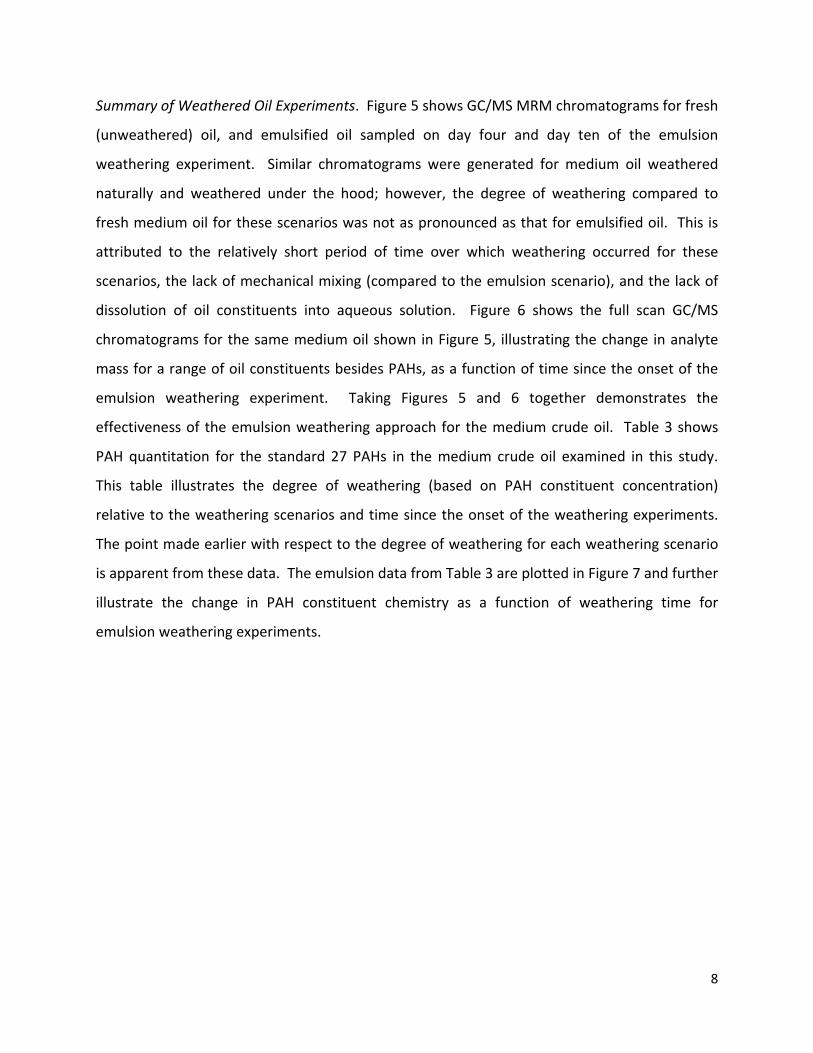
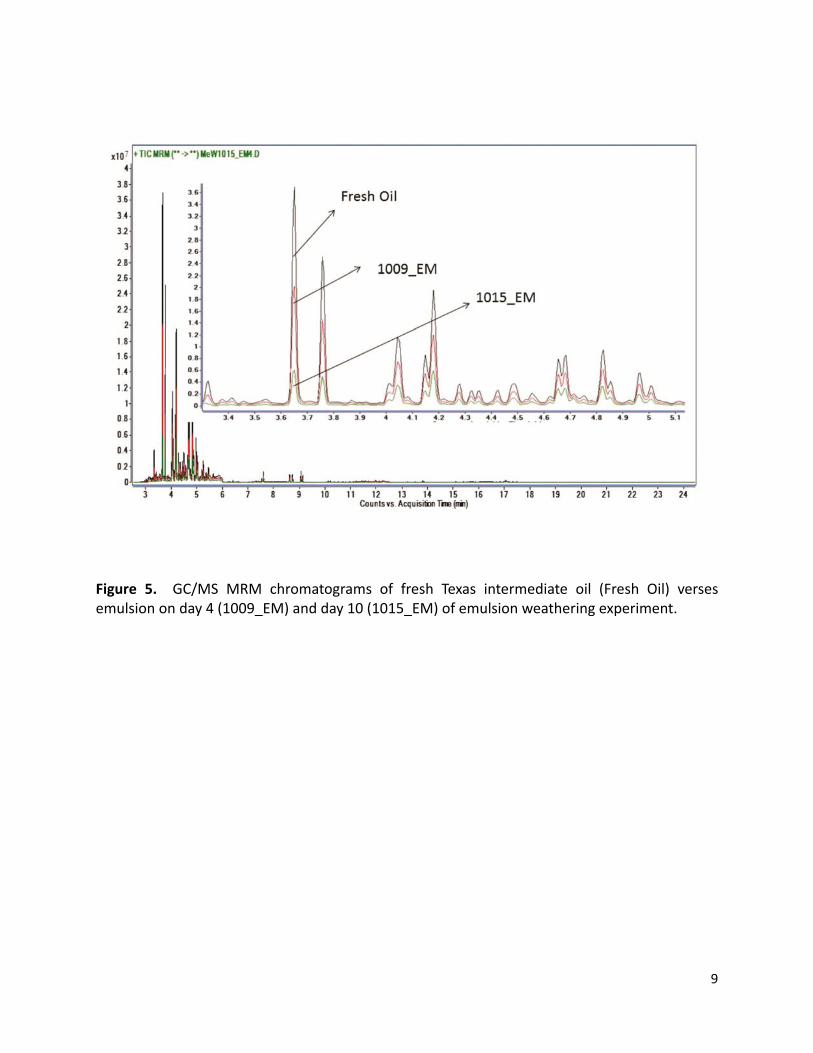
Summary of Weathered Oil Experiments. Figure 5 shows GC/MS MRM chromatograms for fresh
(unweathered) oil, and emulsified oil sampled on day four and day ten of the emulsion
weathering experiment. Similar chromatograms were generated for medium oil weathered
naturally and weathered under the hood; however, the degree of weathering compared to
fresh medium oil for these scenarios was not as pronounced as that for emulsified oil. This is
attributed to the relatively short period of time over which weathering occurred for these
scenarios, the lack of mechanical mixing (compared to the emulsion scenario), and the lack of
dissolution of oil constituents into aqueous solution. Figure 6 shows the full scan GC/MS
chromatograms for the same medium oil shown in Figure 5, illustrating the change in analyte
mass for a range of oil constituents besides PAHs, as a function of time since the onset of the
emulsion weathering experiment. Taking Figures 5 and 6 together demonstrates the
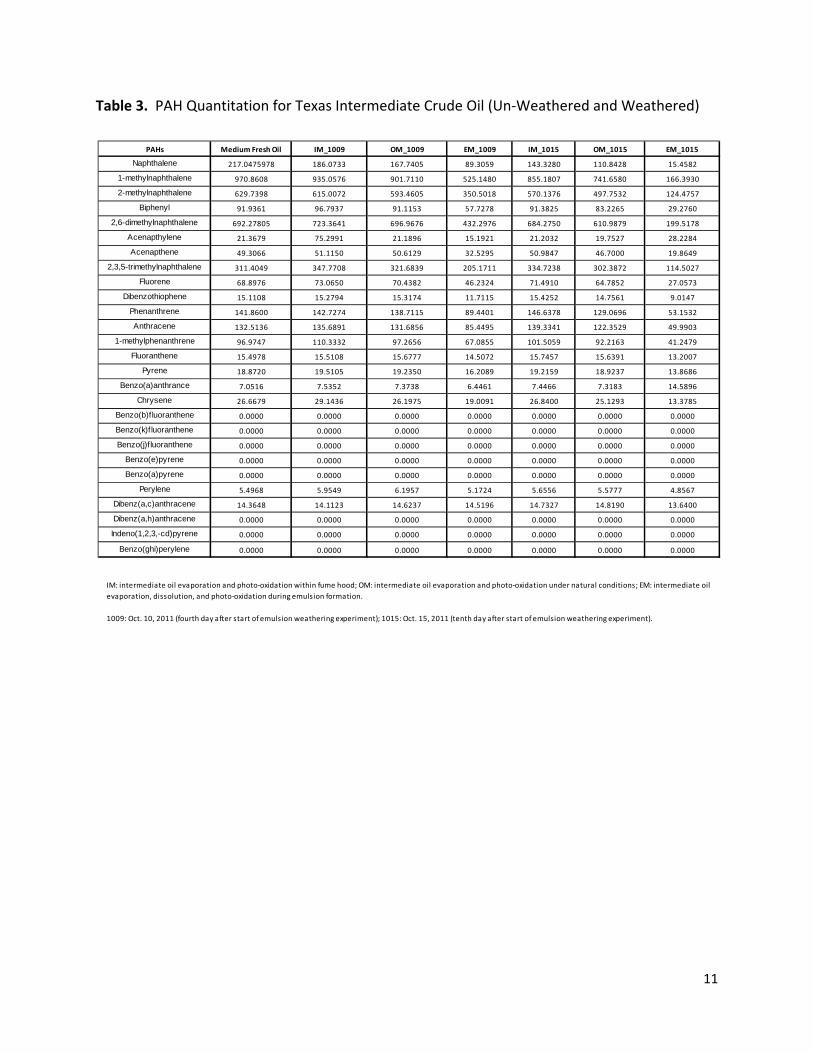
effectiveness of the emulsion weathering approach for the medium crude oil. Table 3 shows
PAH quantitation for the standard 27 PAHs in the medium crude oil examined in this study.
This table illustrates the degree of weathering (based on PAH constituent concentration)
relative to the weathering scenarios and time since the onset of the weathering experiments.
The point made earlier with respect to the degree of weathering for each weathering scenario
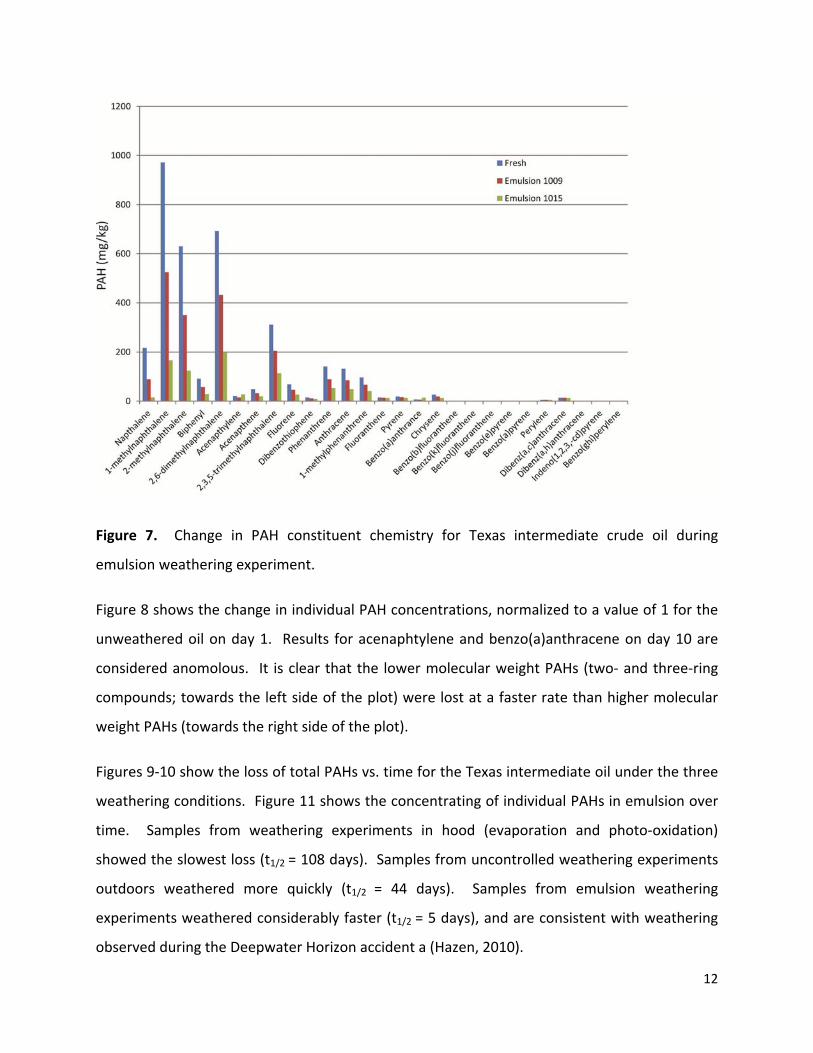
is apparent from these data. The emulsion data from Table 3 are plotted in Figure 7 and further
illustrate the change in PAH constituent chemistry as a function of weathering time for
emulsion weathering experiments.
9
Figure 5. GC/MS MRM chromatograms of fresh Texas intermediate oil (Fresh Oil) verses emulsion on day 4 (1009_EM) and day 10 (1015_EM) of emulsion weathering experiment.
10
Figure 6. Full‐scan GC/MS chromatograms for fresh Texas intermediate oil (Fresh Oil) verses emulsion on day 4 (1009_EM) and day 10 (1015_EM) of emulsion weathering experiment.
11
Table 3. PAH Quantitation for Texas Intermediate Crude Oil (Un‐Weathered and Weathered)
PAHs Medium Fresh Oil IM_1009 OM_1009 EM_1009 IM_1015 OM_1015 EM_1015
IM: intermediate oil evaporation and photo‐oxidation within fume hood; OM: intermediate oil evaporation and photo‐oxidation under natural conditions; EM: intermediate oil evaporation, dissolution, and photo‐oxidation during emulsion formation.
1009: Oct. 10, 2011 (fourth day after start of emulsion weathering experiment); 1015: Oct. 15, 2011 (tenth day after start of emulsion weathering experiment).
12
Figure 7. Change in PAH constituent chemistry for Texas intermediate crude oil during
emulsion weathering experiment.
Figure 8 shows the change in individual PAH concentrations, normalized to a value of 1 for the
unweathered oil on day 1. Results for acenaphtylene and benzo(a)anthracene on day 10 are
considered anomolous. It is clear that the lower molecular weight PAHs (two‐ and three‐ring
compounds; towards the left side of the plot) were lost at a faster rate than higher molecular
weight PAHs (towards the right side of the plot).
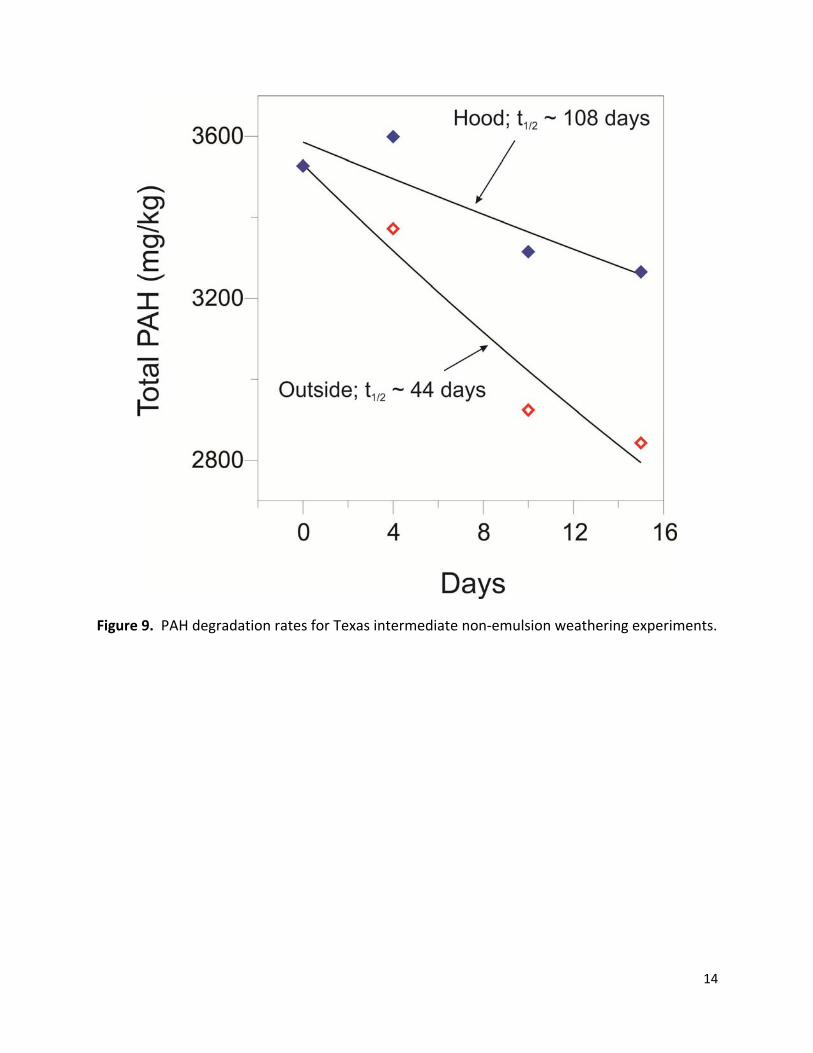
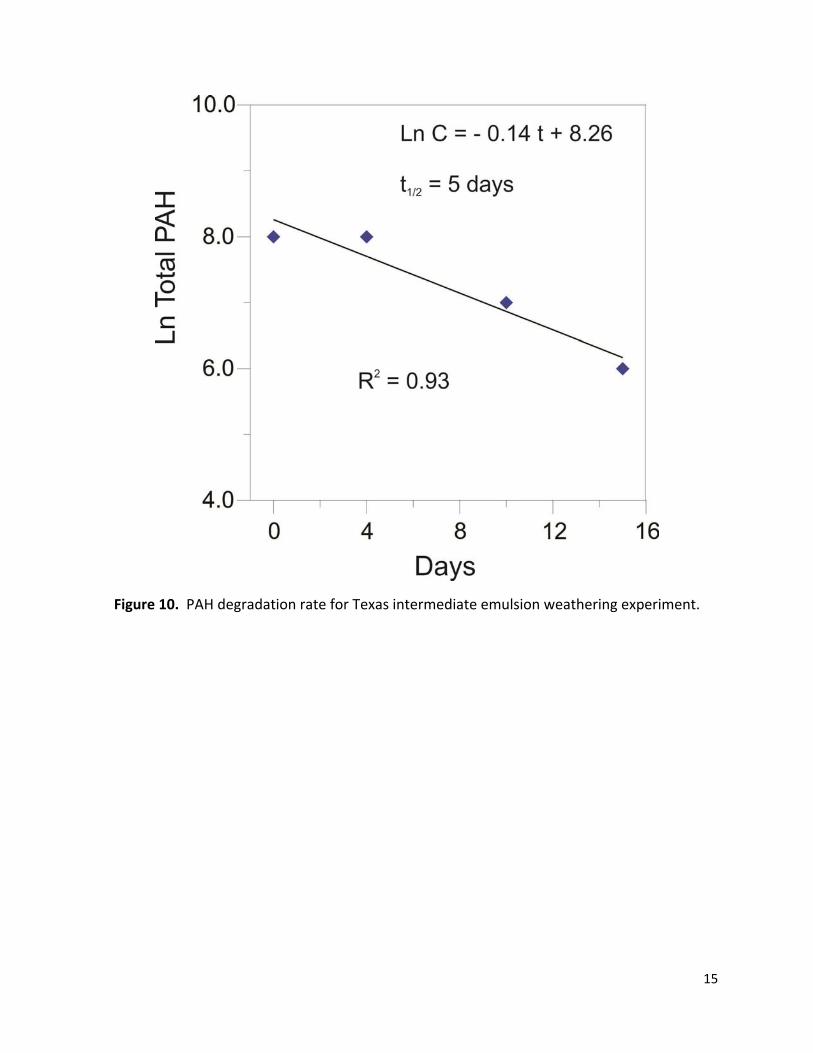
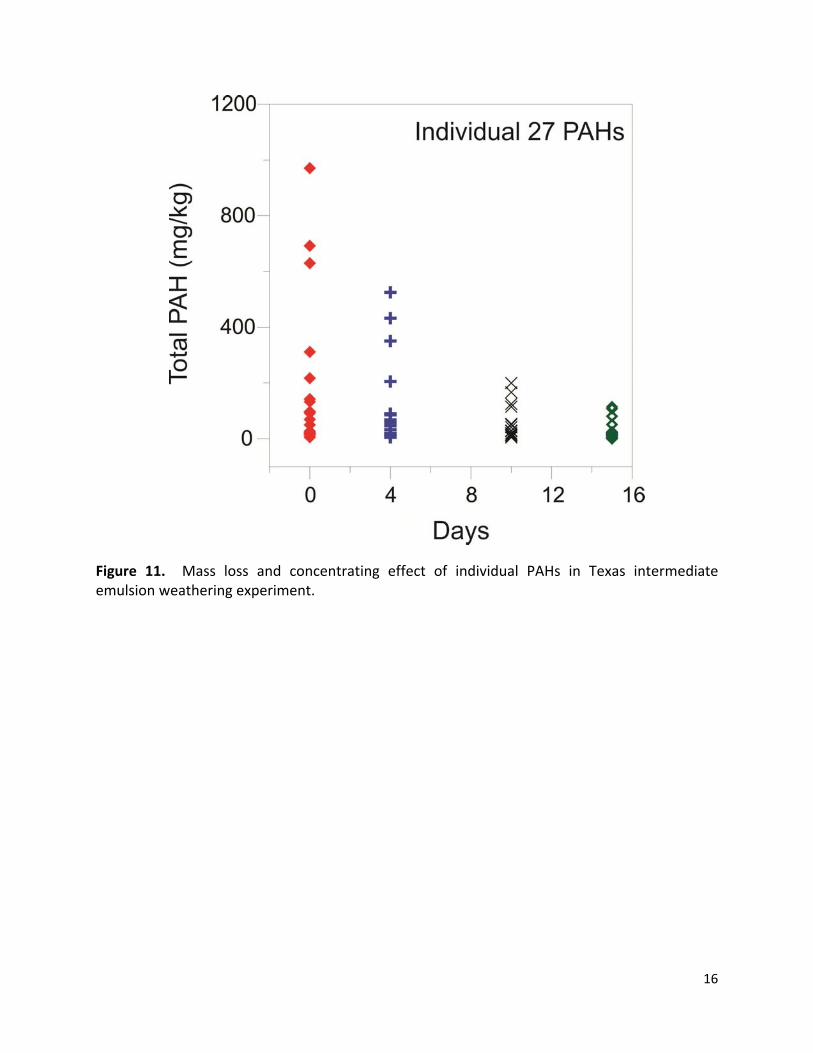
Figures 9‐10 show the loss of total PAHs vs. time for the Texas intermediate oil under the three
weathering conditions. Figure 11 shows the concentrating of individual PAHs in emulsion over
time. Samples from weathering experiments in hood (evaporation and photo‐oxidation)
showed the slowest loss (t1/2 = 108 days). Samples from uncontrolled weathering experiments
outdoors weathered more quickly (t1/2 = 44 days). Samples from emulsion weathering
experiments weathered considerably faster (t1/2 = 5 days), and are consistent with weathering
observed during the Deepwater Horizon accident a (Hazen, 2010).
13
Figure 8. Results of Texas intermediate emulsion weathering, normalized by individual PAHs in
Clarified Macodo Prospect surrogate oil extracted following homogenization and centrifugation
Calrified Macodo Prospect surrogate oil emulsion extracted following homogenization and centrifugation
Clarified Macodo Prospect surrogate oil/Corexit 9500 extracted following homogenization and centrifugation
Clarified Macodo Prospect surrogate oil/Corexit 9500 emulsion extracted following homogenization and centrifugation
27
Figure 18. Concentration of PAHs in surrogate MC252 raw crude oil, surrogate MC252 clarified oil, and surrogate MC252 clarified emulsion phases (without Corexit 9500).
Figure 19. Concentration of PAHs in surrogate MC252 raw crude oil, surrogate MC252 clarified oil, and surrogate MC252 clarified emulsion phases (with Corexit 9500).
28
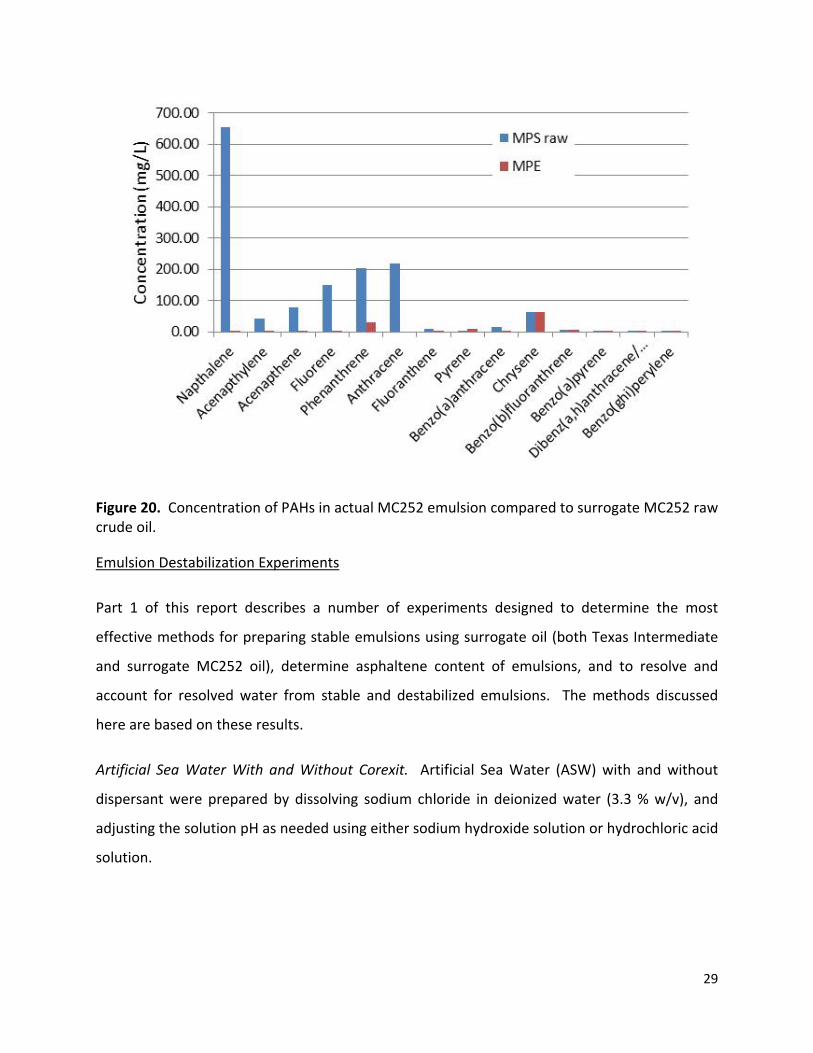
Actual MC252 emulsions were chemically characterized (considering the 16 EPA priority
pollutant PAHs) using the analytical approach described above. Results are shown in Table 6
and Figure 20 compared to surrogate MC252 raw crude oil. These results show that for a
number of target PAHs, a considerable amount of chemical weathering occurred between the
time of emulsion formation and the time of collection on Alabama beaches in June 2010.
Notable exceptions to this include chrysene, pyrene, benzo(b)fluoranthrene, benzo(a)pyrene,
dibenz(a,h)anthracene/indeno(1,2,3,‐cd)pyrene, and benzo(ghi)perylene. Several of these
more recalcitrant compounds exhibit a concentrating effect (when concentration is determined
on a per oil mass basis).
Table 6. PAH Concentration in Actual MC252 Emulsion Compared to Surrogate MC252 Raw Crude Oil
Analyte MPS raw SD MPE SD
Napthalene 654.82 0.01 1.9 0.1
Acenapthylene 43.46 0.62 1.14 0.03
Acenapthene 76.96 20.08 3.37 0.04
Fluorene 148.30 0.91 1.66 0.02
Phenanthrene 203.45 0.26 31 1
Anthracene 219.45 0.89 0 0
Fluoranthene 10.46 0.70 4.7 0.3
Pyrene 4.16 0.23 8.2 0.3
Benzo(a)anthracene 16.62 0.24 0.77 0.02
Chrysene 63.42 0.84 64 3
Benzo(b)fluoranthrene 7.35 0.01 7.7 0.3
Benzo(a)pyrene 0.79 0.02 3.63 0.02
Dibenz(a ,h)anthracene/Indeno(1,2,3,‐cd)pyrene
0.14 0.05 1.39 0.02
Benzo(ghi )perylene 0.99 0.01 3.82 0.03
Units:SD:
MPS raw:MPE:
mg/kg oil phase
Raw Macondo Prospect surrogate oilActual Macondo Prospect emulsion
Standard deviation of multiple analyses
29
Figure 20. Concentration of PAHs in actual MC252 emulsion compared to surrogate MC252 raw crude oil.
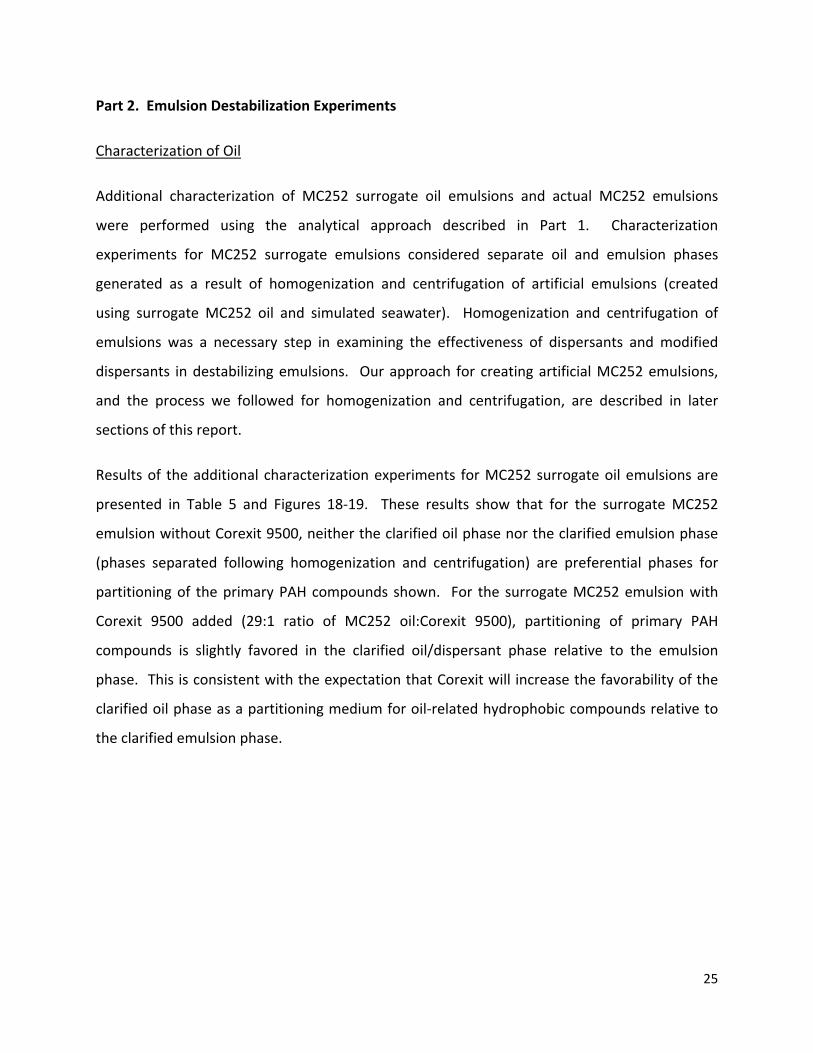
Emulsion Destabilization Experiments
Part 1 of this report describes a number of experiments designed to determine the most
effective methods for preparing stable emulsions using surrogate oil (both Texas Intermediate
and surrogate MC252 oil), determine asphaltene content of emulsions, and to resolve and
account for resolved water from stable and destabilized emulsions. The methods discussed
here are based on these results.
Artificial Sea Water With and Without Corexit. Artificial Sea Water (ASW) with and without
dispersant were prepared by dissolving sodium chloride in deionized water (3.3 % w/v), and
adjusting the solution pH as needed using either sodium hydroxide solution or hydrochloric acid
solution.
30
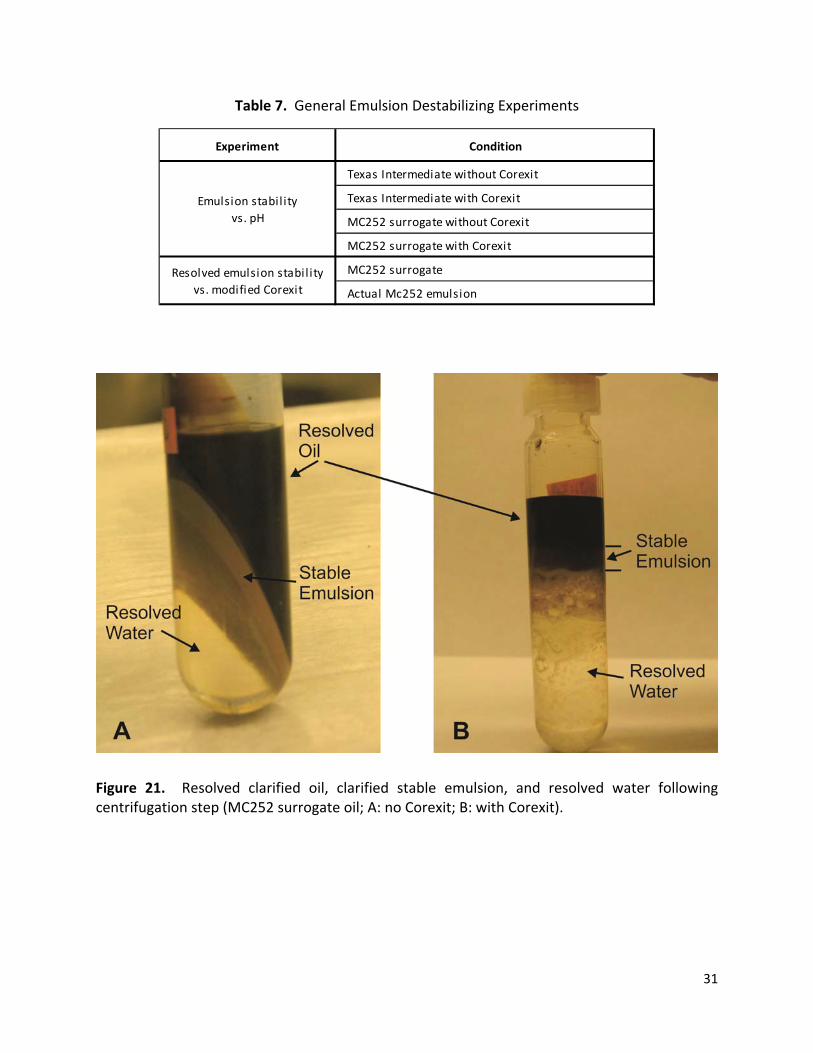
Artificial Emulsion Stability With and Without Corexit. The experiments performed to examine
destabilizing W/O emulsions can be generally categorized as shown in Table 7. For the
experiments considering emulsion stability as a function of ASW pH, two oil types were
considered (Texas Intermediate and MC252 surrogate). For both oil types, artificial W/O
emulsions without Corexit were prepared by adding 4 ml of pH adjusted ASW to 4 mL of oil (1:1
ASW:oil) and homogenizing at 20,000 rpm for 3 minutes. The emulsion was then transferred to
a 10 mL centrifuge tube and allowed to stand for 12 hours. The contents were then centrifuged
at 15,000 rpm for 60 minutes. After centrifugation, three distinct layers were formed: an upper
layer comprised of clarified oil resolved from the W/O emulsion, an intermediate layer
comprising the clarified, stable W/O emulsion, and a lower layer comprised of water resolved
from the W/O emulsion (Figure 21). The clarified oil and clarified stable emulsion using MC252
surrogate oil at ASW pH 8 (average seawater) without Corexit were used to generate the
chemical characterization results presented in Table 5.
For both types of oil, artificial W/O emulsions with Corexit were prepared similar to that
described above, with the exception that Corexit was added to the oil phase (oil:Corexit 29:1)
prior to the homogenization step. The clarified oil and clarified stable emulsion using MC252
surrogate oil at ASW pH 8 with Corexit were also used to generate the chemical
characterization results presented in Table 5.
For both oil types with and without Corexit, the amount of water resolved following the
centrifugation step was used to determine the effect of ASW pH on emulsion stability.
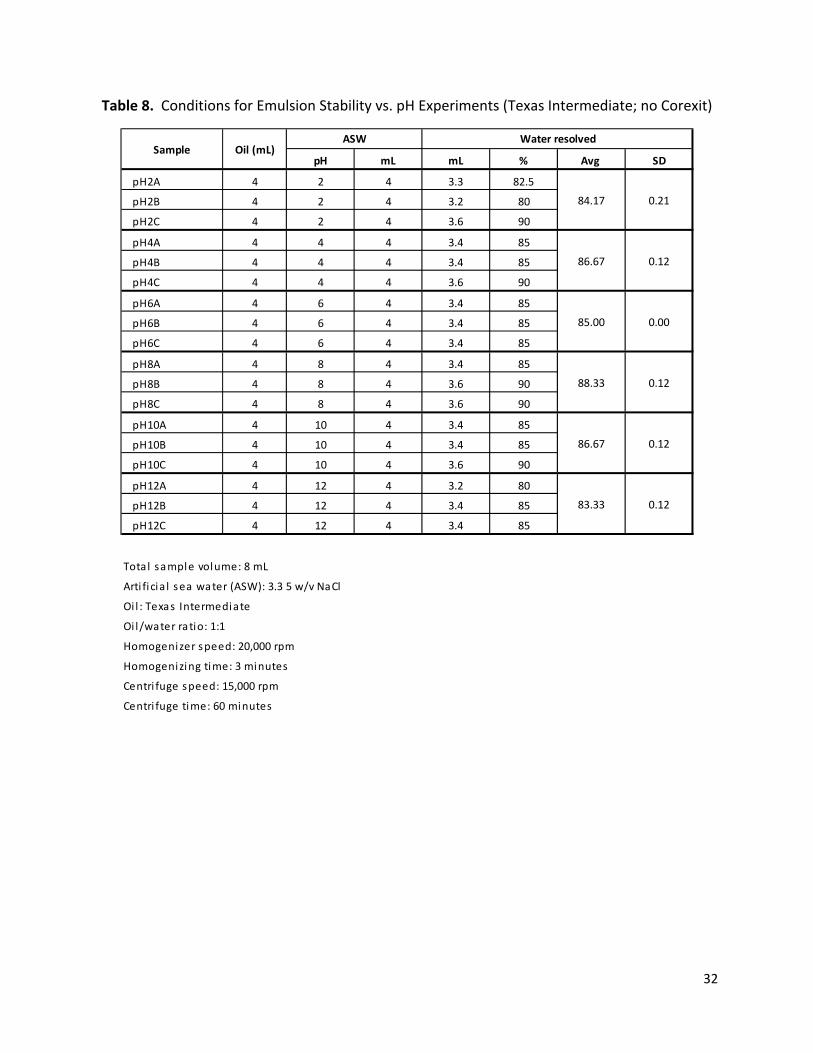
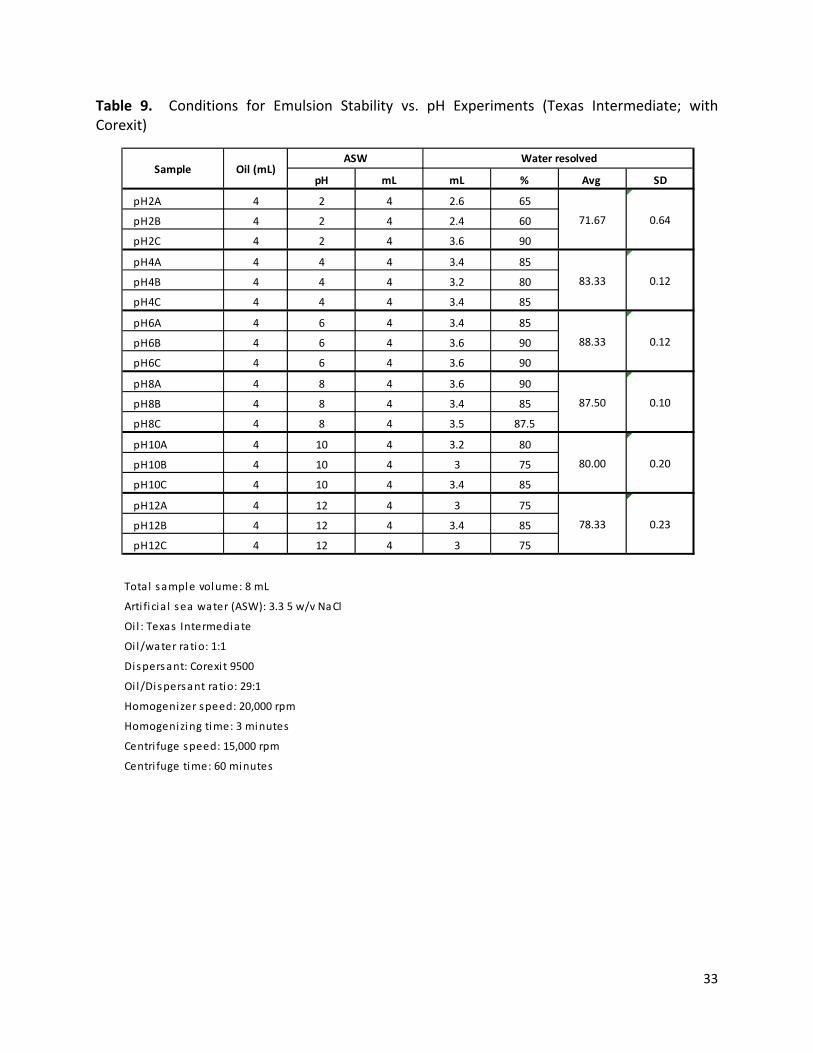
Experimental conditions for emulsion stability verse pH using Texas Intermediate oil without
Corexit are shown in Table 8. Similarly, experimental conditions for emulsion stability verses pH
using Texas Intermediate oil with Corexit are shown in Table 9.
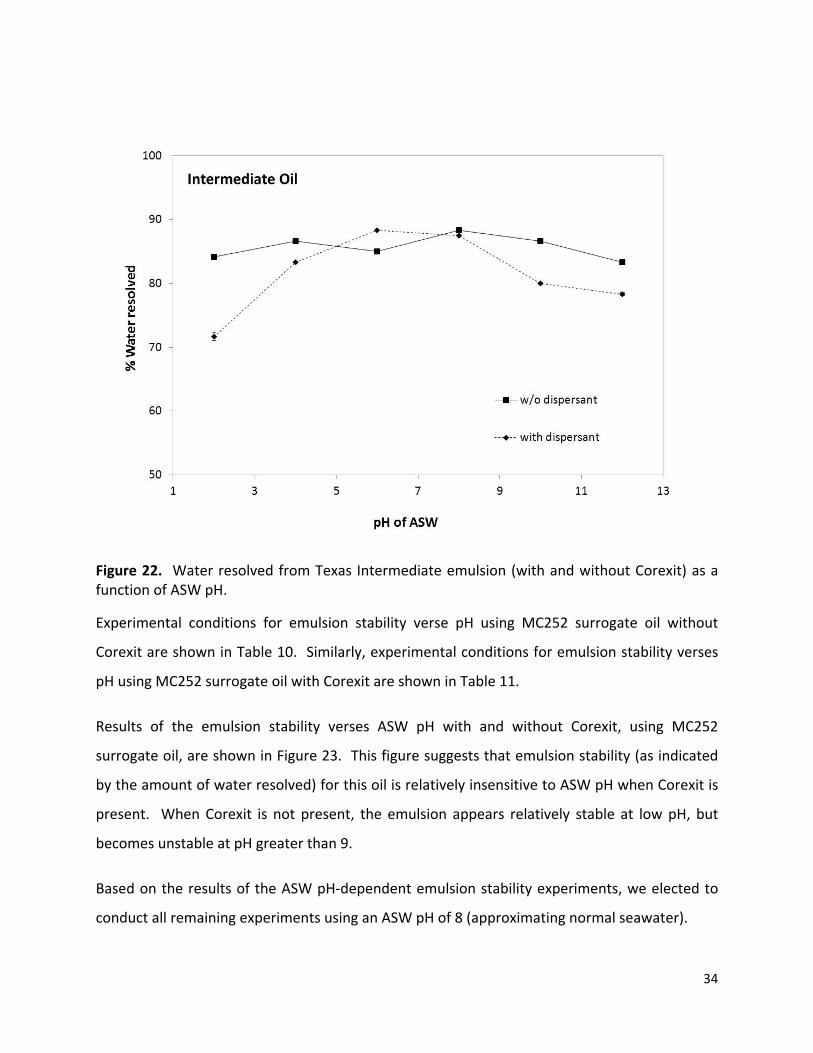
Results of the emulsion stability verses ASW pH with and without Corexit, using Texas
Intermediate oil, are shown in Figure 22. This figure suggests that emulsion stability (as
indicated by the amount of water resolved) for this oil is relatively insensitive to ASW pH within
the range reasonably expected for seawater. At low and high ASW pH, the presence of Corexit
appears to stabilize the emulsion (compared to no Corexit).
31
Table 7. General Emulsion Destabilizing Experiments
Figure 21. Resolved clarified oil, clarified stable emulsion, and resolved water following centrifugation step (MC252 surrogate oil; A: no Corexit; B: with Corexit).
Experiment Condition
Texas Intermediate without Corexit
Texas Intermediate with Corexit
MC252 surrogate without Corexit
MC252 surrogate with Corexit
MC252 surrogate
Actual Mc252 emulsion
Emulsion stabilityvs. pH
Resolved emulsion stabilityvs. modified Corexit
32
Table 8. Conditions for Emulsion Stability vs. pH Experiments (Texas Intermediate; no Corexit)
pH mL mL % Avg SD
pH2A 4 2 4 3.3 82.5
pH2B 4 2 4 3.2 80
pH2C 4 2 4 3.6 90
pH4A 4 4 4 3.4 85
pH4B 4 4 4 3.4 85
pH4C 4 4 4 3.6 90
pH6A 4 6 4 3.4 85
pH6B 4 6 4 3.4 85
pH6C 4 6 4 3.4 85
pH8A 4 8 4 3.4 85
pH8B 4 8 4 3.6 90
pH8C 4 8 4 3.6 90
pH10A 4 10 4 3.4 85
pH10B 4 10 4 3.4 85
pH10C 4 10 4 3.6 90
pH12A 4 12 4 3.2 80
pH12B 4 12 4 3.4 85
pH12C 4 12 4 3.4 85
Centri fuge speed: 15,000 rpm
Centri fuge time: 60 minutes
Arti fi cia l sea water (ASW): 3.3 5 w/v NaCl
Oi l : Texas Intermediate
Oi l/water ratio: 1:1
Homogenizer speed: 20,000 rpm
Homogenizing time: 3 minutes
Tota l sample volume: 8 mL
ASW Water resolvedSample Oil (mL)
84.17 0.21
83.33
0.12
0.00
0.12
0.12
0.12
86.67
85.00
88.33
86.67
33
Table 9. Conditions for Emulsion Stability vs. pH Experiments (Texas Intermediate; with Corexit)
pH mL mL % Avg SD
pH2A 4 2 4 2.6 65
pH2B 4 2 4 2.4 60
pH2C 4 2 4 3.6 90
pH4A 4 4 4 3.4 85
pH4B 4 4 4 3.2 80
pH4C 4 4 4 3.4 85
pH6A 4 6 4 3.4 85
pH6B 4 6 4 3.6 90
pH6C 4 6 4 3.6 90
pH8A 4 8 4 3.6 90
pH8B 4 8 4 3.4 85
pH8C 4 8 4 3.5 87.5
pH10A 4 10 4 3.2 80
pH10B 4 10 4 3 75
pH10C 4 10 4 3.4 85
pH12A 4 12 4 3 75
pH12B 4 12 4 3.4 85
pH12C 4 12 4 3 75
Oi l/Dispersant ratio: 29:1
Homogenizer speed: 20,000 rpm
Homogenizing time: 3 minutes
Centri fuge speed: 15,000 rpm
Centri fuge time: 60 minutes
Tota l sample volume: 8 mL
Arti fi cia l sea water (ASW): 3.3 5 w/v NaCl
Oi l : Texas Intermediate
Oi l /water ratio: 1:1
Dispersant: Corexi t 9500
Sample Oil (mL)ASW Water resolved
71.67 0.64
80.00 0.20
78.33 0.23
83.33 0.12
88.33 0.12
87.50 0.10
34
Figure 22. Water resolved from Texas Intermediate emulsion (with and without Corexit) as a function of ASW pH.
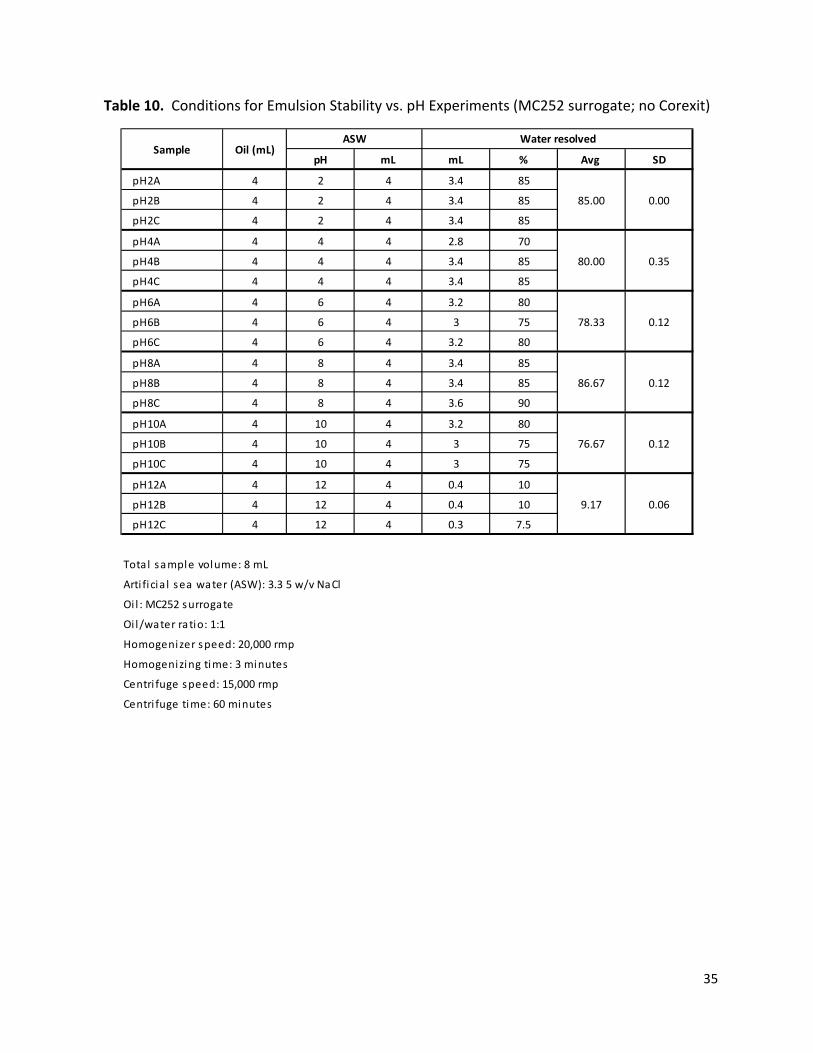
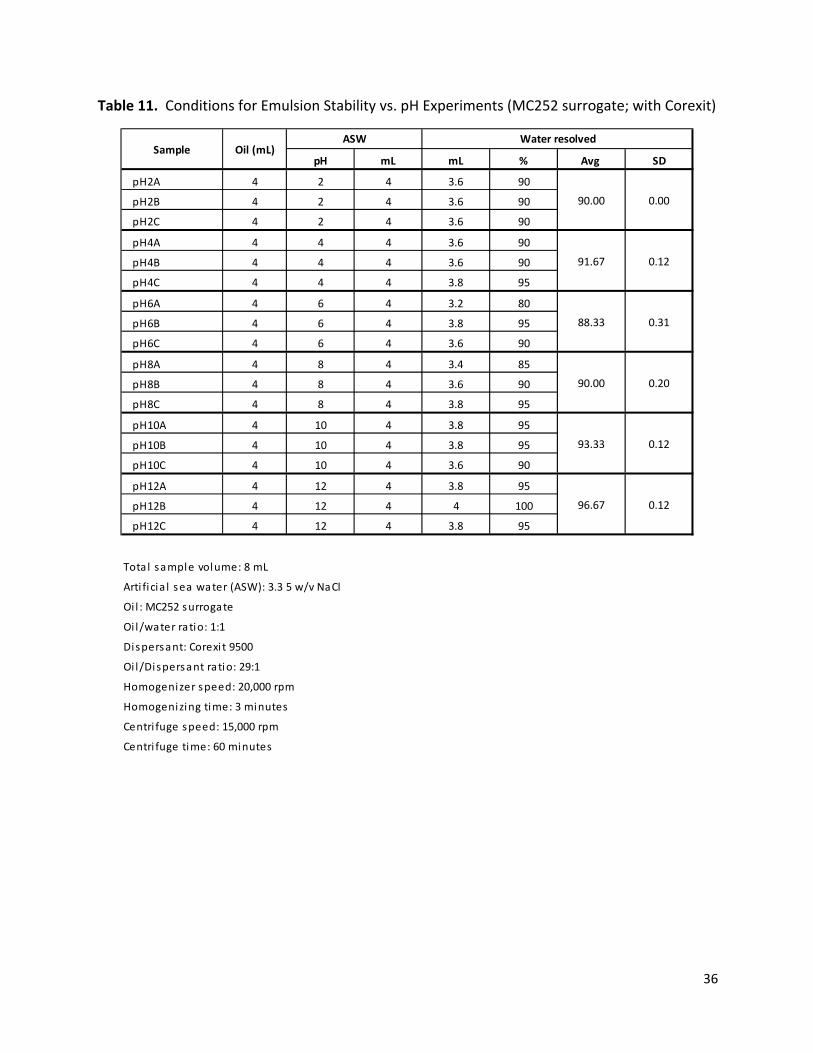
Experimental conditions for emulsion stability verse pH using MC252 surrogate oil without
Corexit are shown in Table 10. Similarly, experimental conditions for emulsion stability verses
pH using MC252 surrogate oil with Corexit are shown in Table 11.
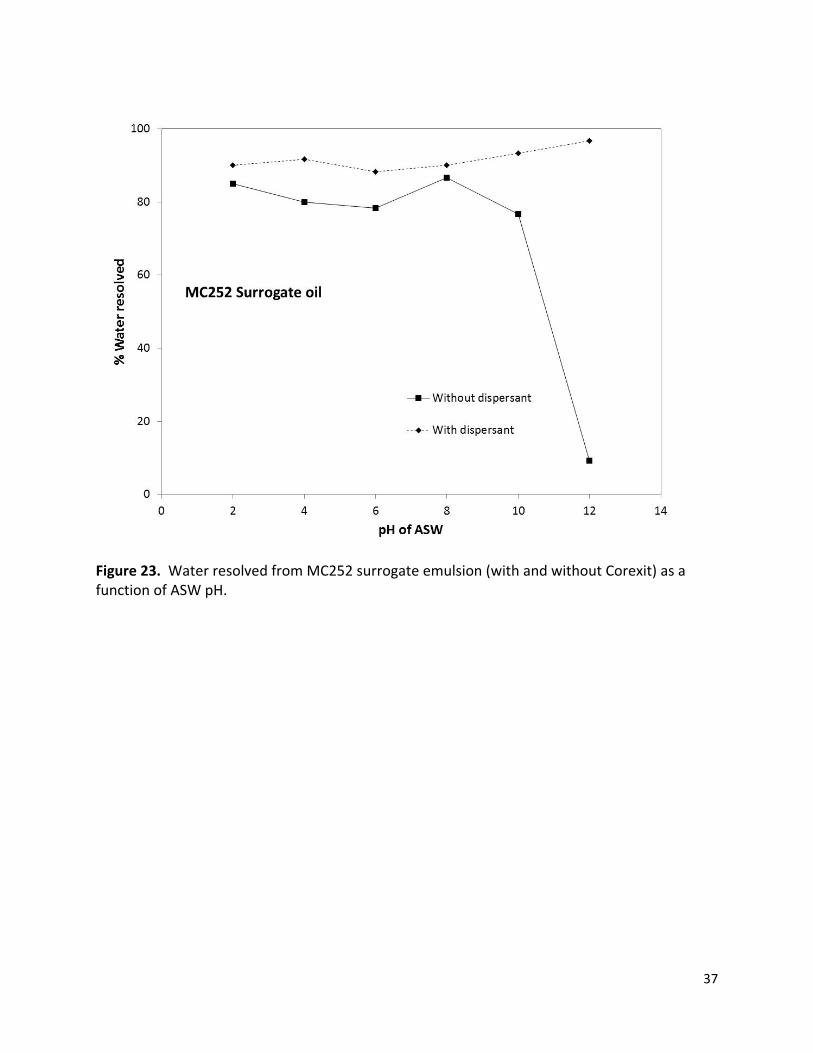
Results of the emulsion stability verses ASW pH with and without Corexit, using MC252
surrogate oil, are shown in Figure 23. This figure suggests that emulsion stability (as indicated
by the amount of water resolved) for this oil is relatively insensitive to ASW pH when Corexit is
present. When Corexit is not present, the emulsion appears relatively stable at low pH, but
becomes unstable at pH greater than 9.
Based on the results of the ASW pH‐dependent emulsion stability experiments, we elected to
conduct all remaining experiments using an ASW pH of 8 (approximating normal seawater).
35
Table 10. Conditions for Emulsion Stability vs. pH Experiments (MC252 surrogate; no Corexit)
pH mL mL % Avg SD
pH2A 4 2 4 3.4 85
pH2B 4 2 4 3.4 85
pH2C 4 2 4 3.4 85
pH4A 4 4 4 2.8 70
pH4B 4 4 4 3.4 85
pH4C 4 4 4 3.4 85
pH6A 4 6 4 3.2 80
pH6B 4 6 4 3 75
pH6C 4 6 4 3.2 80
pH8A 4 8 4 3.4 85
pH8B 4 8 4 3.4 85
pH8C 4 8 4 3.6 90
pH10A 4 10 4 3.2 80
pH10B 4 10 4 3 75
pH10C 4 10 4 3 75
pH12A 4 12 4 0.4 10
pH12B 4 12 4 0.4 10
pH12C 4 12 4 0.3 7.5
Homogenizing time: 3 minutes
Centri fuge speed: 15,000 rmp
Centri fuge time: 60 minutes
Tota l sample volume: 8 mL
Arti fi cia l sea water (ASW): 3.3 5 w/v NaCl
Oi l : MC252 surrogate
Oi l/water ratio: 1:1
Homogenizer speed: 20,000 rmp
85.00 0.00
76.67 0.12
9.17 0.06
80.00 0.35
78.33 0.12
86.67 0.12
Sample Oil (mL)ASW Water resolved
36
Table 11. Conditions for Emulsion Stability vs. pH Experiments (MC252 surrogate; with Corexit)
pH mL mL % Avg SD
pH2A 4 2 4 3.6 90
pH2B 4 2 4 3.6 90
pH2C 4 2 4 3.6 90
pH4A 4 4 4 3.6 90
pH4B 4 4 4 3.6 90
pH4C 4 4 4 3.8 95
pH6A 4 6 4 3.2 80
pH6B 4 6 4 3.8 95
pH6C 4 6 4 3.6 90
pH8A 4 8 4 3.4 85
pH8B 4 8 4 3.6 90
pH8C 4 8 4 3.8 95
pH10A 4 10 4 3.8 95
pH10B 4 10 4 3.8 95
pH10C 4 10 4 3.6 90
pH12A 4 12 4 3.8 95
pH12B 4 12 4 4 100
pH12C 4 12 4 3.8 95
Oi l/Dispersant ratio: 29:1
Homogenizer speed: 20,000 rpm
Homogenizing time: 3 minutes
Centri fuge speed: 15,000 rpm
Centri fuge time: 60 minutes
Tota l sample volume: 8 mL
Arti fi cia l sea water (ASW): 3.3 5 w/v NaCl
Oi l : MC252 surrogate
Oi l/water ratio: 1:1
Dispersant: Corexi t 9500
90.00 0.00
93.33 0.12
96.67 0.12
91.67 0.12
88.33 0.31
90.00 0.20
Sample Oil (mL)ASW Water resolved
37
Figure 23. Water resolved from MC252 surrogate emulsion (with and without Corexit) as a function of ASW pH.
38
Destabilizing Artificial MC252 Surrogate Emulsions and Actual MC252 Emulsions Using Modified
Corexit.
Experiments were performed to examine the effect of two polar additives to Corexit 9500 on
the stability of MC252 surrogate emulsions and actual MC252 emulsions. Both emulsions
(MC252 surrogate and actual MC252) were prepared as previously described (for neat
emulsion/ASW, emulsion with Corexit, and emulsion with modified Corexit).
Selection of Polar Additives to Modify Corexit
Two polar additives were selected for modifying Corexit 9500: octanol and hexylamine. These
compounds were selected based on their mechanistic differences in destabilizing emulsions and
their low aquatic toxicity (Martin and Young, 2001). Octanol is a short‐chain alcohol, which acts
to break down existing intermolecular hydrogen bonds between asphaltene molecules,
replacing them with alcohol‐asphaltene hydrogen bonds (Sjöblom et al., 2003). Wasan et al.
(1979) observed a similar destabilization effect on W/O emulsions originating from a medium‐
chain alcohols. Wasan et al. (1979) studied the influence of co‐surfactants, such as n‐hexanol,
on crude oil‐aqueous surfactant systems. They found that the co‐surfactant increased the rate
of emulsion destabilization and attributed the observed higher water coalescence rates to a
reduction in interfacial rigidity. Hexylamine acts to disintegrate asphaltenes through
interaction between the nitrogen group (base) and the acid groups present in the interfacial
film. A consequence of this interaction is that the properties of the interfacial film are
modified, with this film becoming hydrophilic to stabilize the aqueous droplets (Sjöblom et al.,
1990; Sjöblom et al., 2003.
Experiments Using MC252 Surrogate Emulsions
Results of experiments considering stability of MC252 surrogate emulsions treated with Corexit
and octanol‐modified Corexit are shown in Table 12 and Figure 24. Results of experiments
considering stability of MC252 surrogate emulsions treated with Corexit and hexylamine‐
modified Corexit are shown in Table 13 and Figure 25. These results indicate that both octanol
and hexylamine do not appreciably increase the destabilizing effects of Corexit in MC252
39
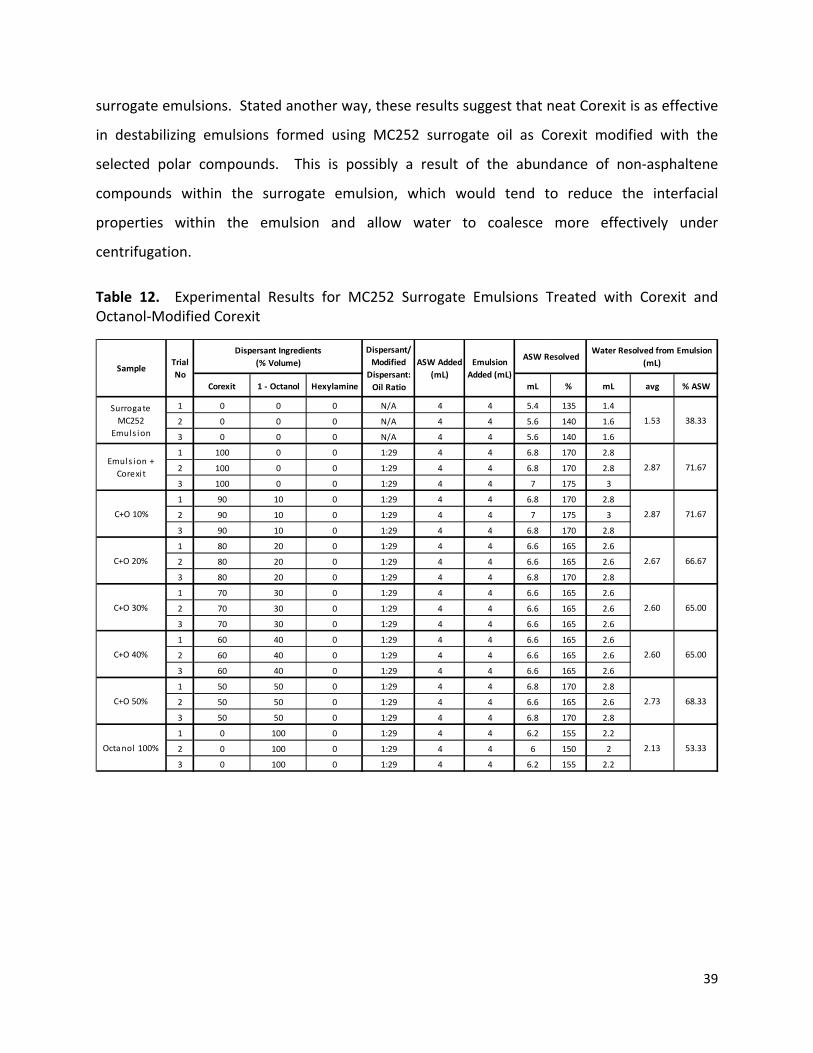
surrogate emulsions. Stated another way, these results suggest that neat Corexit is as effective
in destabilizing emulsions formed using MC252 surrogate oil as Corexit modified with the
selected polar compounds. This is possibly a result of the abundance of non‐asphaltene
compounds within the surrogate emulsion, which would tend to reduce the interfacial
properties within the emulsion and allow water to coalesce more effectively under
centrifugation.
Table 12. Experimental Results for MC252 Surrogate Emulsions Treated with Corexit and Octanol‐Modified Corexit
Corexit 1 ‐ Octanol Hexylamine mL % mL avg % ASW
1 0 0 0 N/A 4 4 5.4 135 1.4
2 0 0 0 N/A 4 4 5.6 140 1.6
3 0 0 0 N/A 4 4 5.6 140 1.6
1 100 0 0 1:29 4 4 6.8 170 2.8
2 100 0 0 1:29 4 4 6.8 170 2.8
3 100 0 0 1:29 4 4 7 175 3
1 90 10 0 1:29 4 4 6.8 170 2.8
2 90 10 0 1:29 4 4 7 175 3
3 90 10 0 1:29 4 4 6.8 170 2.8
1 80 20 0 1:29 4 4 6.6 165 2.6
2 80 20 0 1:29 4 4 6.6 165 2.6
3 80 20 0 1:29 4 4 6.8 170 2.8
1 70 30 0 1:29 4 4 6.6 165 2.6
2 70 30 0 1:29 4 4 6.6 165 2.6
3 70 30 0 1:29 4 4 6.6 165 2.6
1 60 40 0 1:29 4 4 6.6 165 2.6
2 60 40 0 1:29 4 4 6.6 165 2.6
3 60 40 0 1:29 4 4 6.6 165 2.6
1 50 50 0 1:29 4 4 6.8 170 2.8
2 50 50 0 1:29 4 4 6.6 165 2.6
3 50 50 0 1:29 4 4 6.8 170 2.8
1 0 100 0 1:29 4 4 6.2 155 2.2
2 0 100 0 1:29 4 4 6 150 2
3 0 100 0 1:29 4 4 6.2 155 2.2
Water Resolved from Emulsion (mL)
38.33
71.67
71.67
66.67
65.00
65.00
68.33
53.33
C+O 40% 2.60
C+O 50% 2.73
Octanol 100% 2.13
C+O 10% 2.87
C+O 20% 2.67
C+O 30% 2.60
ASW Resolved
Surrogate MC252
Emuls ion1.53
Emuls ion +Corexi t
2.87
SampleTrialNo
Dispersant Ingredients(% Volume)
Dispersant/Modified Dispersant:Oil Ratio
ASW Added (mL)
Emulsion Added (mL)
40
Figure 24. Average percent water resolved above ASW volume for MC252 surrogate emulsion (neat, treated with Corexit, treated with octanol‐modified Corexit).
41
Table 13. Experimental Results for MC252 Surrogate Emulsions Treated with Corexit and Hexylamine‐Modified Corexit
Corexit 1 ‐ Octanol Hexylamine mL % mL avg % ASW
1 0 0 0 N/A 4 4 5.4 135 1.4
2 0 0 0 N/A 4 4 5.6 140 1.6
3 0 0 0 N/A 4 4 5.6 140 1.6
1 100 0 0 1:29 4 4 6.8 170 2.8
2 100 0 0 1:29 4 4 6.8 170 2.8
3 100 0 0 1:29 4 4 7 175 3
1 90 10 0 1:29 4 4 6.6 165 2.6
2 90 10 0 1:29 4 4 6.8 170 2.8
3 90 10 0 1:29 4 4 6.8 170 2.8
1 80 20 0 1:29 4 4 6.8 170 2.8
2 80 20 0 1:29 4 4 7 175 3
3 80 20 0 1:29 4 4 6.8 170 2.8
1 70 30 0 1:29 4 4 7 175 3
2 70 30 0 1:29 4 4 6.8 170 2.8
3 70 30 0 1:29 4 4 7 175 3
1 60 40 0 1:29 4 4 6.8 170 2.8
2 60 40 0 1:29 4 4 6.8 170 2.8
3 60 40 0 1:29 4 4 6.8 170 2.8
1 50 50 0 1:29 4 4 7 175 3
2 50 50 0 1:29 4 4 7.2 180 3.2
3 50 50 0 1:29 4 4 7 175 3
1 0 100 0 1:29 4 4 7 175 3
2 0 100 0 1:29 4 4 7.2 180 3.2
3 0 100 0 1:29 4 4 7 175 3
Emulsion Added (mL)
ASW ResolvedWater Resolved from Emulsion
(mL)SampleTrialNo
Dispersant Ingredients(% Volume)
Dispersant/Modified Dispersant:Oil Ratio
ASW Added (mL)
68.33
71.67
73.33
70.00
38.33
71.67
Surrogate MC252
Emuls ion1.53
Emuls ion +Corexi t
2.87
76.67
76.67
Hexylamine 100%
3.07
C+H 10% 2.73
C+H 20% 2.87
C+H 30% 2.93
C+H 40% 2.80
C+H 50% 3.07
42
Figure 25. Average percent water resolved above ASW volume for MC252 surrogate emulsion (neat, treated with Corexit, and treated with hexylamine‐modified Corexit).
43
Experiments Using Actual MC252 Emulsions
The actual MC252 emulsion collected along Alabama’s beaches in June 2010 are highly viscous,
and contain foreign particles (predominantly sand). This required a pre‐treatment step prior to
their use in these experiments. As pre‐treatment, actual MC252 emulsion samples were placed
in a sonicator bath at 40°C for 60 minutes to reduce viscosity and allow the majority of foreign
particles to settle and be removed.
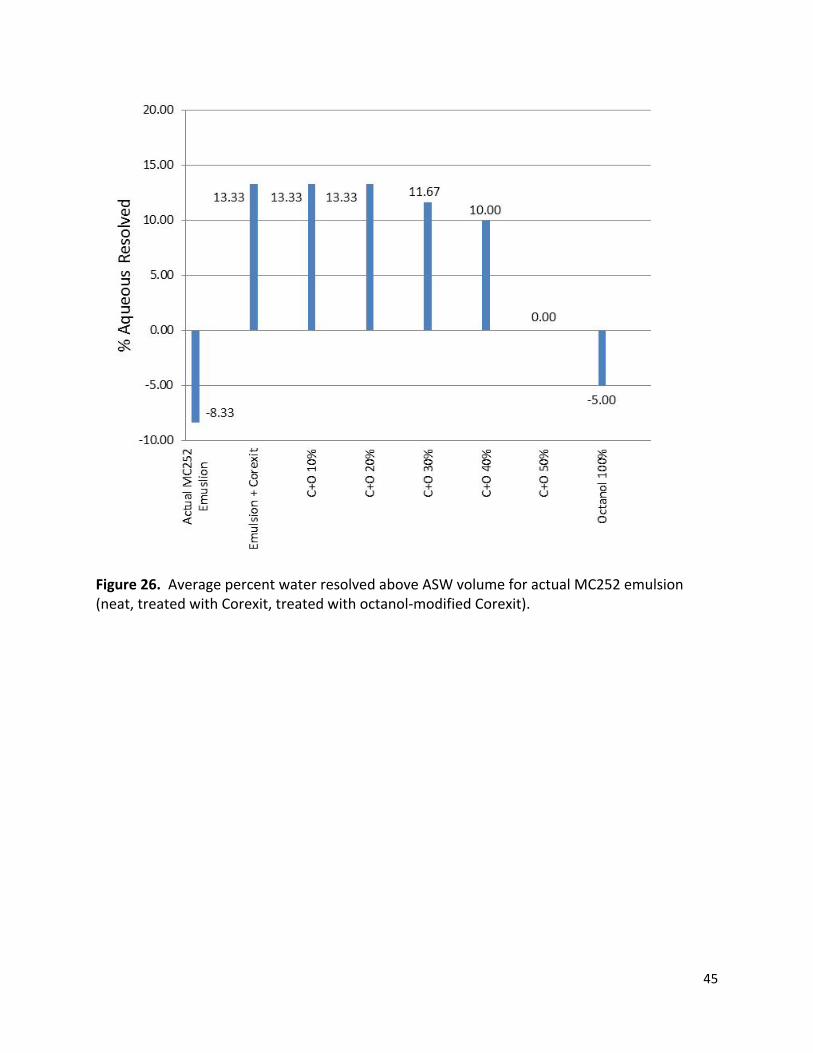
Results of experiments considering stability of actual MC252 emulsions treated with Corexit
and octanol‐modified Corexit are shown in Table 14 and Figures 26. Results of experiments
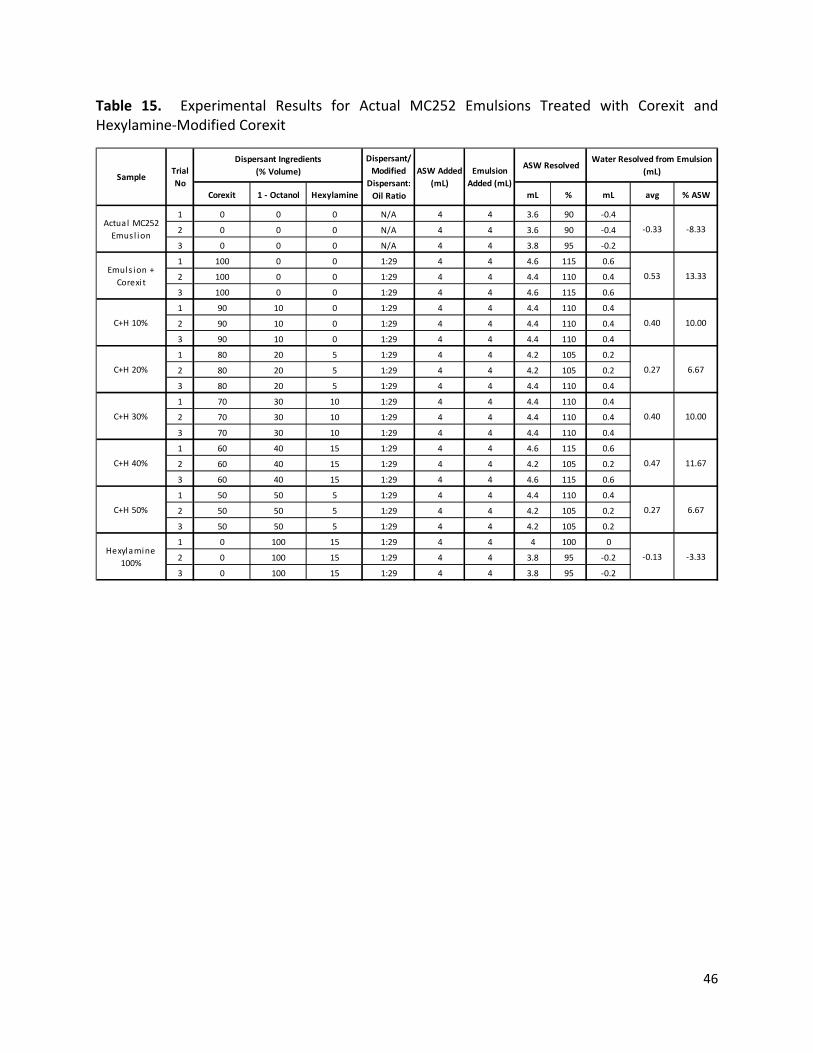
considering stability of actual MC252 emulsions treated with Corexit and hexylamine‐modified
Corexit are shown in Table 15 and Figure 27. These results indicate that at volume fractions
less than approximately 50%, both octanol and hexylamine do not appreciably increase the
destabilizing effects of Corexit in actual MC252 emulsions. At volume fractions greater than
50%, these results indicate that both Corexit additives tend to increase the inclusion of water
within the emulsion.
Our observations of the physical properties of the actual MC252 emulsion as the volume
fraction of both Corexit additives increases indicate that the emulsion becomes less viscous,
even though the amount of water resolved from the emulsion under centrifugation is
considerably reduced. An indication of the reason for this apparent stability can be found when
viewing photomicrographs of the clarified actual MC252 emulsion and the aqueous solution
resolved from this emulsion under centrifugation. Figure 28 shows the clarified actual MC252
emulsion and the aqueous solution resolved from this emulsion under centrifugation (no
Corexit or modified Corexit present). Figure 29 shows the same emulsion and water fractions
following addition of 100% volume fraction of Corexit. These images demonstrate the effects
of the presence of Corexit: aqueous droplets within the emulsion phase are smaller and more
evenly distributed within the Corexit‐treated emulsion relative to the neat emulsion.
Additionally, more oil is present in the aqueous solution resolved from the Corexit‐treated
44
Table 14. Experimental Results for Actual MC252 Emulsions Treated with Corexit and Octanol‐Modified Corexit
Corexit 1 ‐ Octanol Hexylamine mL % mL avg % ASW
1 0 0 0 N/A 4 4 3.6 90 ‐0.4
2 0 0 0 N/A 4 4 3.6 90 ‐0.4
3 0 0 0 N/A 4 4 3.8 95 ‐0.2
1 100 0 0 1:29 4 4 4.6 115 0.6
2 100 0 0 1:29 4 4 4.4 110 0.4
3 100 0 0 1:29 4 4 4.6 115 0.6
1 90 10 0 1:29 4 4 4.4 110 0.4
2 90 10 0 1:29 4 4 4.6 115 0.6
3 90 10 0 1:29 4 4 4.6 115 0.6
1 80 20 0 1:29 4 4 4.4 110 0.4
2 80 20 0 1:29 4 4 4.6 115 0.6
3 80 20 0 1:29 4 4 4.6 115 0.6
1 70 30 0 1:29 4 4 4.4 110 0.4
2 70 30 0 1:29 4 4 4.6 115 0.6
3 70 30 0 1:29 4 4 4.4 110 0.4
1 60 40 0 1:29 4 4 4.2 105 0.2
2 60 40 0 1:29 4 4 4.4 110 0.4
3 60 40 0 1:29 4 4 4.6 115 0.6
1 50 50 0 1:29 4 4 4.2 105 0.2
2 50 50 0 1:29 4 4 4 100 0
3 50 50 0 1:29 4 4 3.8 95 ‐0.2
1 0 100 0 1:29 4 4 3.6 90 ‐0.4
2 0 100 0 1:29 4 4 4 100 0
3 0 100 0 1:29 4 4 3.8 95 ‐0.2
C+O 10% 0.53 13.33
C+O 20% 0.53 13.33
C+O 30% 0.47 11.67
C+O 40% 0.40 10.00
Emuls ion + Corexi t
0.53 13.33
SampleTrialNo
Dispersant Ingredients(% Volume)
Dispersant/Modified Dispersant:Oil Ratio
ASW Added (mL)
Emulsion Added (mL)
ASW Resolved
Actual MC252Emusl ion
‐0.33 ‐8.33
Water Resolved from Emulsion (mL)
C+O 50% 0.00 0.00
Octanol 100% ‐0.20 ‐5.00
45
Figure 26. Average percent water resolved above ASW volume for actual MC252 emulsion (neat, treated with Corexit, treated with octanol‐modified Corexit).
46
Table 15. Experimental Results for Actual MC252 Emulsions Treated with Corexit and Hexylamine‐Modified Corexit
Corexit 1 ‐ Octanol Hexylamine mL % mL avg % ASW
1 0 0 0 N/A 4 4 3.6 90 ‐0.4
2 0 0 0 N/A 4 4 3.6 90 ‐0.4
3 0 0 0 N/A 4 4 3.8 95 ‐0.2
1 100 0 0 1:29 4 4 4.6 115 0.6
2 100 0 0 1:29 4 4 4.4 110 0.4
3 100 0 0 1:29 4 4 4.6 115 0.6
1 90 10 0 1:29 4 4 4.4 110 0.4
2 90 10 0 1:29 4 4 4.4 110 0.4
3 90 10 0 1:29 4 4 4.4 110 0.4
1 80 20 5 1:29 4 4 4.2 105 0.2
2 80 20 5 1:29 4 4 4.2 105 0.2
3 80 20 5 1:29 4 4 4.4 110 0.4
1 70 30 10 1:29 4 4 4.4 110 0.4
2 70 30 10 1:29 4 4 4.4 110 0.4
3 70 30 10 1:29 4 4 4.4 110 0.4
1 60 40 15 1:29 4 4 4.6 115 0.6
2 60 40 15 1:29 4 4 4.2 105 0.2
3 60 40 15 1:29 4 4 4.6 115 0.6
1 50 50 5 1:29 4 4 4.4 110 0.4
2 50 50 5 1:29 4 4 4.2 105 0.2
3 50 50 5 1:29 4 4 4.2 105 0.2
1 0 100 15 1:29 4 4 4 100 0
2 0 100 15 1:29 4 4 3.8 95 ‐0.2
3 0 100 15 1:29 4 4 3.8 95 ‐0.2
ASW Added (mL)
Emulsion Added (mL)
ASW ResolvedWater Resolved from Emulsion
(mL)
0.40 10.00
Actual MC252Emusl ion
‐0.33 ‐8.33
Emuls ion + Corexi t
0.53 13.33
SampleTrialNo
Dispersant Ingredients(% Volume)
Dispersant/Modified Dispersant:Oil Ratio
C+H 20%
C+H 10%
0.27 6.67
C+H 30% 0.40 10.00
Hexylamine 100%
‐0.13 ‐3.33
C+H 40% 0.47 11.67
C+H 50% 0.27 6.67
47
Figure 27. Average percent water resolved above ASW volume for actual MC252 emulsion (neat, treated with Corexit, treated with hexylamine‐modified Corexit).
48
Figure 28. Clarified actual MC252 emulsion (A) and the aqueous solution resolved from this emulsion (B) under centrifugation (no Corexit or modified Corexit present).
49
Figure 29. Clarified actual MC252 emulsion (A) and the aqueous solution resolved from this emulsion (B) under centrifugation (100% volume fraction Corexit).
50
emulsion than in the aqueous solution resolved from the neat emulsion. This physical behavior
is a consequence of both the reduced interfacial tension between oil and aqueous solution
within the emulsion (allowing for enhanced coalescence and removal of aqueous solution from
the emulsion during centrifugation), and the increase in apparent aqueous solubility of oil.
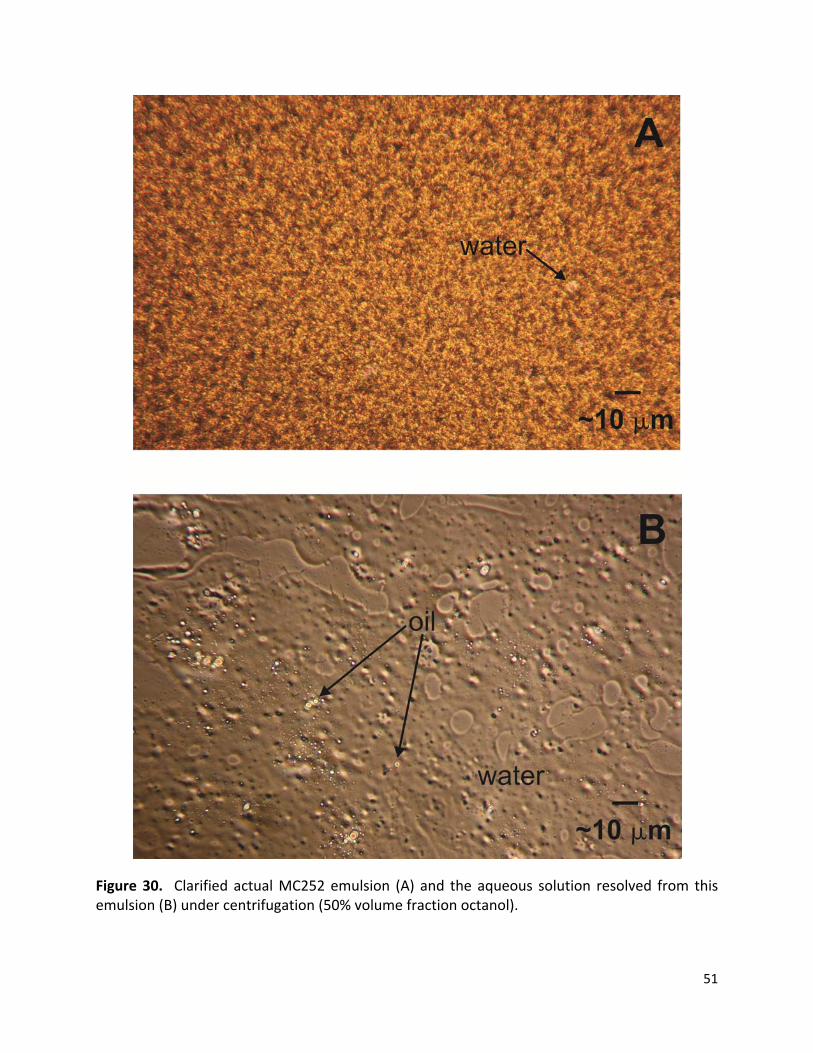
Figure 30 shows the same emulsion and water fractions following addition of 50% volume
Corexit and 50% volume octanol. Similar photomicrographs using 50% volume hexylamine
were obtained. Under these conditions, the aqueous solution droplets within the emulsion are
much smaller than those in the neat emulsion and in the emulsion where only Corexit was
added. Further, oil appears as a more distinct separate phase in the resolved aqueous solution
compared to the Corexit‐only condition (Figure 29). Note from Figures 26 and 27 that at
octanol or hexylamine volume fractions greater than approximately 50%, the amount of
aqueous solution resolved from the emulsion decreases (and a fraction of added ASW is
actually retained in the emulsion as the octanol or hexylamine volume fraction increases). With
these considerations, Figure 30 suggests that the presence of octanol and hexylamine above
approximately 50% volume results in the formation of a microemulsion, which although
accommodating more water, is destabilized with respect to viscosity (significantly reduced) and
the increased presence of separate phase oil in the aqueous phase. This transition to a
microemulsion is beneficial because of the enhanced ability for physicochemical weathering
and biological degradation to take place relative to stable W/O emulsions.
51
Figure 30. Clarified actual MC252 emulsion (A) and the aqueous solution resolved from this emulsion (B) under centrifugation (50% volume fraction octanol).
52
Conclusions
Our initial hypothesis was that the emulsion destabilizing properties of commercially‐available
oil dispersants can be enhanced by modifying the composition and fraction of polar
constituents in the oil phase of W/O emulsions and increasing the pH of the emulsion aqueous
phase. The results presented here suggest that emulsion stability is relatively insensitive to
emulsion aqueous phase pH. Additionally, our results indicate that emulsion instability is
appreciably enhanced as a consequence of treatment with Corexit modified with the polar
additives octanol and hexylamine. Further, for octanol‐modified or hexylamine‐modified
Corexit at 50% volume or greater octanol or hexylamine, the instability of the emulsion (with
respect to reduced viscosity and enhanced weathering potential) appears to increase. Our
current interpretation of this result is that changes at the oil‐water interface favorable to the
creation of a microemulsion are driving this phenomenon.
Our observations indicate that microemulsion formation reduces emulsion viscosity while
increasing the ability of the emulsion to retain aqueous solution. Thus, although the ability to
resolve water from emulsions treated with octanol‐ or hexylamine‐modified Corexit (at 50%
volume or greater octanol or hexylamine) under centrifugation is reduced, the transformation
to a microemulsion and the decrease in apparent emulsion viscosity results a destabilized
emulsion more amenable to physicochemical weathering and biological degradation (Lessard
and DeMarco, 2000). Moreover, our experience working with actual MC252 emulsions have
demonstrated that, as a result of their substantial viscosity, they are extremely difficult to
recover by any means other than manually. This is true even for MC252 emulsions treated with
Corexit. However, our results suggest that when Corexit is modified with octanol or hexylamine
(at volume fractions approximately 40%‐50%), the formation of a microemulsion reduces the
viscosity of the emulsion to a degree that it may be recoverable by means other than manually
(for example, oil skimmers and vacuum collection systems).
We are continuing our investigation into the behavior of W/O emulsions treated with modified
commercially‐available dispersants. Future studies will include experiments to examine the
transition to microemulsion and the resulting decrease in emulsion viscosity, using actual
53
MC252 emulsions and focusing on octanol as the dispersant modifier. We will also continue
our examination of other polar additives as possible dispersant modifiers. Our goal is to
examine the practicality of this approach for favorably changing emulsion properties under
real‐world conditions.
References
Djuve J, Yang X, Fjellanger IJ, Sjöblom J, Pelizzetti E. Chemical destabilization of crude oil based