120

Cover F ron t I ns ide Page 1
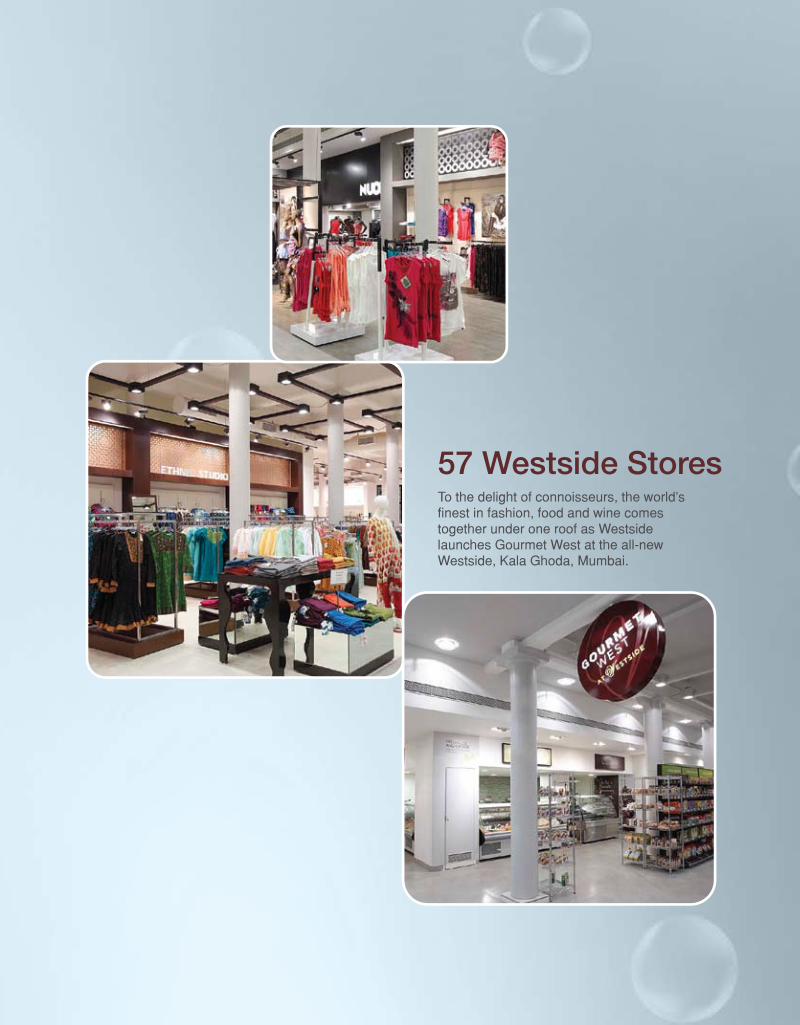
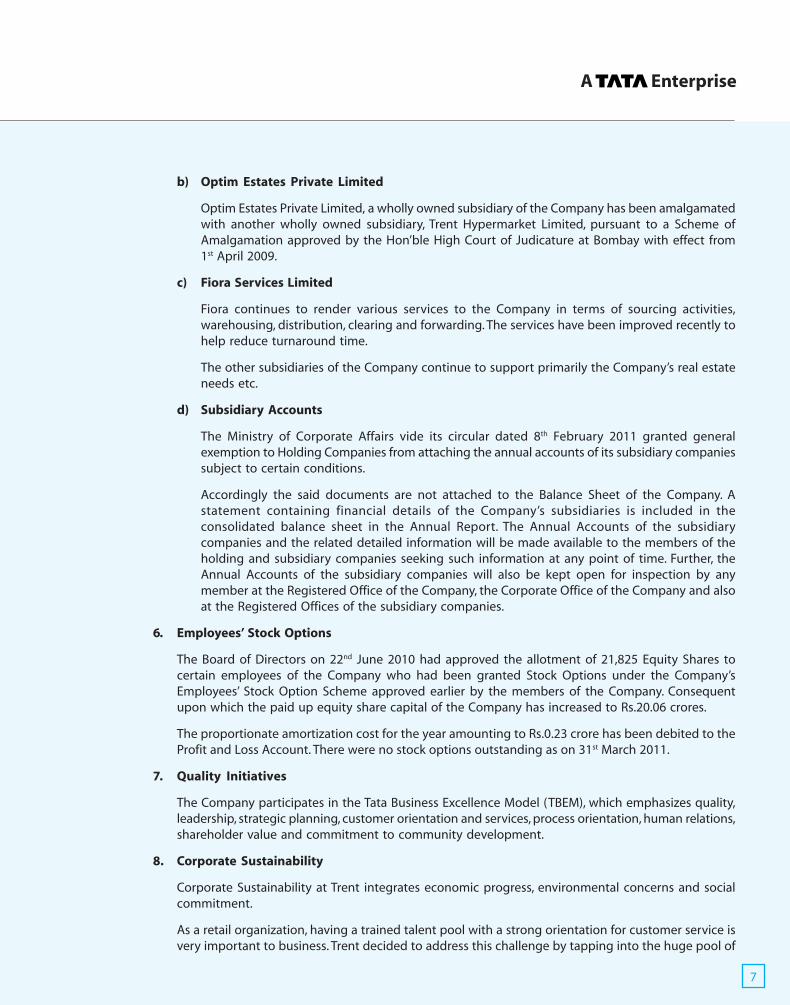
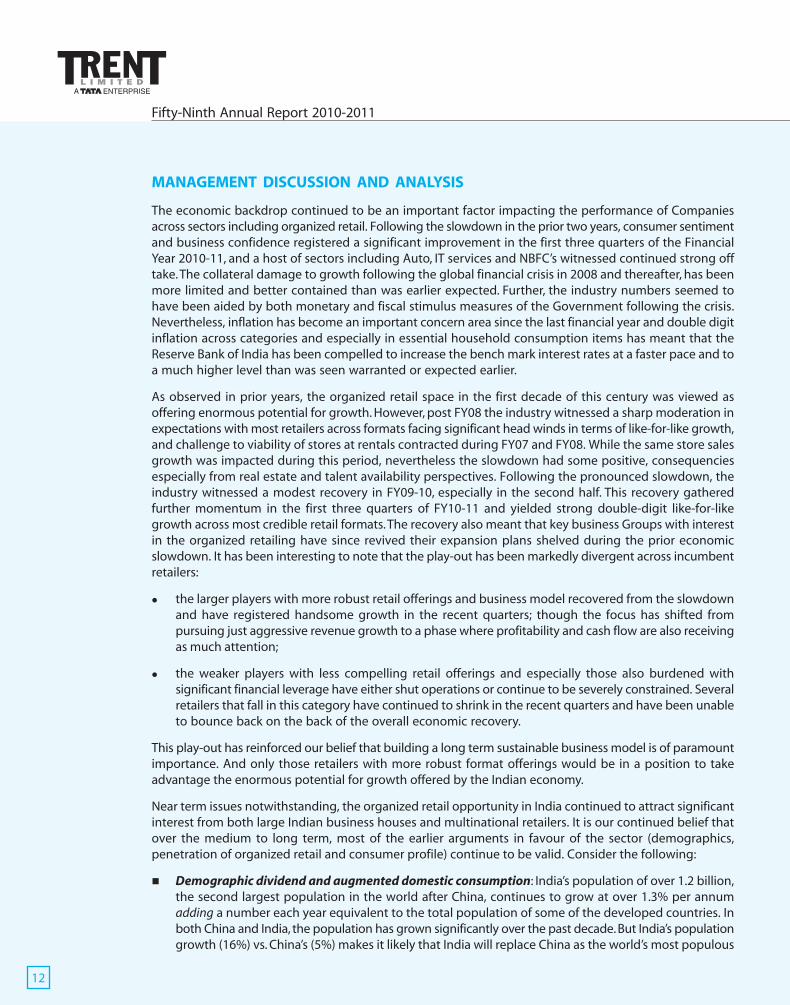
57 Westside Stores
11 Star Bazaar StoresStar Bazaar customers all over the country enjoy the advantage of great quality products at unbeatable prices with the added advantage of Tesco private labels.
To the delight of connoisseurs, the world's finest in fashion, food and wine comes together under one roof as Westsidelaunches Gourmet West at the all-newWestside, Kala Ghoda, Mumbai.

Cover F ron t I ns ide Page 1
57 Westside Stores
11 Star Bazaar StoresStar Bazaar customers all over the country enjoy the advantage of great quality products at unbeatable prices with the added advantage of Tesco private labels.
To the delight of connoisseurs, the world's finest in fashion, food and wine comes together under one roof as Westsidelaunches Gourmet West at the all-newWestside, Kala Ghoda, Mumbai.

Page 2 Page 3
26 Landmark StoresArdent fans of Landmark rejoice as new toys hit the shelves along with whole new gaming and sportswear sections.
ZaraThe joint venture with Zara introduces the country to the iconic fashion brand from Spain.

Page 2 Page 3
26 Landmark StoresArdent fans of Landmark rejoice as new toys hit the shelves along with whole new gaming and sportswear sections.
ZaraThe joint venture with Zara introduces the country to the iconic fashion brand from Spain.

Page 4
4 Fashion Yatra Stores

1
A Enterprise
CK
ContentsBoard of Directors ............................................................................................................................................................. 3
Financial Statistics .............................................................................................................................................................. 4
Directors’ Report ................................................................................................................................................................ 5
Management Discussion and Analysis ...................................................................................................................... 12
Corporate Governance Report ..................................................................................................................................... 28
Auditors’ Report ................................................................................................................................................................. 45
Balance Sheet ..................................................................................................................................................................... 48
Profit and Loss Account .................................................................................................................................................. 49
Schedules forming part of the Profit and Loss Account .................................................................................... 50
Schedules forming part of the Balance Sheet ....................................................................................................... 53
Notes on the Balance Sheet & Profit and Loss Account .................................................................................... 65
Balance Sheet Abstract and Company’s General Business Profile .................................................................. 78
Cash Flow Statement ....................................................................................................................................................... 79
Statement under Section 212 of the Companies Act, 1956 ............................................................................ 80
Consolidated Financial Statements
Auditors’ Report ................................................................................................................................................................. 81
Balance Sheet ..................................................................................................................................................................... 84
Profit and Loss Account .................................................................................................................................................. 85
Schedules forming part of the Profit and Loss Account .................................................................................... 86
Schedules forming part of the Balance Sheet ....................................................................................................... 89
Notes on the Balance Sheet & Profit and Loss Account .................................................................................... 98
Cash Flow Statement ....................................................................................................................................................... 105
Summarised Financial Statement of Subsidiaries .................................................................................................. 106
BOOK CLOSURE DATESWEDNESDAY, 20TH JULY 2011 — FRIDAY, 22ND JULY 2011
Annual General Meeting : 5th August 2011
Time : 3.00 p.m.
Venue : Walchand Hirachand Hall,4th Floor,Indian Merchants’ Chamber (IMC),IMC Building,IMC Marg, Churchgate,Mumbai – 400 020.

2
Fifty-Ninth Annual Report 2010-2011
CK
Financial Highlights Rs. in crores
0
50
100
150
200
250
300
350
20112010200920082007
104.70
143.53137.31
260.14
330.19
Gross Fixed Assets
0
100
200
300
400
500
600
700
20112010200920082007
443.80
499.31 496.37
542.60
673.95
Turnover (Sales)
0
2
4
6
8
10
12
14
16
18
20
22
24
20112010200920082007
20.66
17.92
13.70
20.5321.46
EPS - Basic (Rs. per share)
0
5
10
15
20
25
30
35
40
45
50
20112010200920082007
32.41 32.86
26.76
40.22
43.03
Profit After Taxes

3
A Enterprise
CK
Chairman EmeritusS. N. Tata
Board of DirectorsF. K. Kavarana (Chairman)N. N. Tata (Vice Chairman) ( w.e.f. 19th August 2010 )
A. D. CooperK. N. SuntookZ. S. DubashB. Bhat ( w.e.f. 27th September 2010 )
S. Susman ( w.e.f. 11th May 2011 )
Company SecretaryM. M. Surti
Registered OfficeBombay House,24, Homi Mody Street,Mumbai - 400 001Tel:022-6665 8282,Fax:022-2204 2081E-mail: [email protected] us: www.mywestside.com
Registrar and Transfer AgentsTSR Darashaw Limited6-10, Haji Moosa Patrawala Industrial Estate,20, Dr. E. Moses Road, Mahalaxmi, Mumbai - 400 011Tel: 022-6656 8484Fax: 022-6656 8494E-mail: [email protected]
SolicitorsAZB and Partners
AuditorsM/s. N. M. Raiji & Co.,Chartered Accountants
BankersCitibank N.A.ICICI Bank LimitedHDFC Bank Limited

4
Fifty-Ninth Annual Report 2010-2011
CK
TREN
T LI
MIT
ED
Fin
anci
al S
tati
stic
s(R
up
ees
in l
akh
s)
CA
PIT
AL
AC
CO
UN
TS
RE
VE
NU
E A
CC
OU
NT
S
Ca
pit
al
Re
serv
es
Bo
rro
w-
Ne
tIn
ve
st-
Gro
ssE
xp
en
-D
ep
re-
Pro
fit
Pro
fit
Div
ide
nd
Div
ide
nd
Ear
nin
gs
Yea
ra
nd
ing
sB
lock
men
tsR
ev
en
ue
dit
ure
ciat
ion
Be
fore
Aft
erin
clu
din
gP
erP
erS
urp
lus
Taxe
sTa
xes
Div
. Ta
xE
qu
ity
Sh
are
Sh
are
Ba
sic-
%R
up
ee
s
20
01
-02
1,3
11
.78
17
,61
3.7
03
0.2
13
,47
1.3
71
2,5
84
.40
9,0
60
.04
7,7
17
.96
23
8.3
01
,10
3.7
81
,02
2.0
06
55
.89
50
7.7
9
20
02
-03
1,3
11
.78
18
,48
8.9
22
8.6
54
,01
1.2
81
1,2
82
.14
12
,00
9.8
51
0,5
30
.14
27
4.7
51
,20
4.9
61
,68
9.1
48
13
.92
55
12
.88
20
03
-04
1,3
11
.78
19
,39
4.9
42
7.8
95
,11
3.2
81
1,0
45
.05
16
,63
9.3
31
4,2
85
.52
30
6.0
22
,04
7.7
91
,71
9.9
48
13
.92
55
13
.11
20
04
-05
1,3
11
.78
20
,40
1.5
62
5.8
86
,24
8.8
41
1,3
13
.03
24
,60
9.7
02
1,6
99
.52
45
4.1
82
,45
6.0
01
,90
5.9
28
99
.30
60
14
.11
20
05
-06
1,4
42
.78
25
,51
7.2
16
,57
2.3
87
,19
5.7
82
3,2
96
.62
35
,75
9.0
03
1,5
29
.78
80
0.0
53
,42
9.1
72
,43
7.8
31
,06
9.3
46
51
7.1
9
20
06
-07
1,5
76
.07
37
,17
2.8
76
,56
7.0
48
,50
2.2
33
0,8
21
.59
47
,24
1.5
34
2,3
51
.81
79
0.9
34
,09
8.7
93
,24
0.8
91
,29
0.7
57
02
0.6
6
20
07
-08
1,9
53
.29
58
,63
0.4
76
,56
0.6
31
2,5
28
.52
46
,93
3.7
55
4,6
42
.94
50
,02
5.2
08
85
.36
3,7
32
.38
3,2
86
.40
1,5
24
.89
70
17
.92
20
08
-09
1,9
53
.29
58
,72
3.4
41
6,5
55
.48
10
,86
8.6
93
9,5
85
.16
54
,65
9.7
95
0,9
08
.85
92
3.3
42
,82
7.6
02
,67
5.5
51
,25
6.5
15
51
3.7
0
20
09
-10
2,7
03
.51
61
,34
7.0
02
5,0
52
.06
22
,34
4.5
23
9,5
17
.59
60
,99
9.8
35
5,9
67
.33
1,1
85
.09
4,9
85
.00
4,0
22
.03
1,5
18
.58
65
20
.53
20
10
-11
3,5
95
.97
10
4,5
99
.39
27
,50
0.0
02
9,1
74
.76
42
,49
6.8
77
6,8
14
.14
69
,13
3.5
71
,36
2.6
56
,03
3.9
24
,30
3.7
11
,75
1.3
87
52
1.4
6

5
A Enterprise
CK
TO THE MEMBERS OFTRENT LIMITED
The Directors present their Fifty Ninth Annual Report together with the Audited Statement of Accountsfor the year ended 31st March 2011.
1. Financial Results 2010-2011 2009-2010
Rs. Crores Rs. Crores
Total Income 768.14 610.00
Profit before tax 60.34 49.85
Less: Provision for taxation 17.31 9.63
Profit after tax 43.03 40.22
Add: Balance brought forward from previous year 37.27 20.54
Balance transferred on Amalgamation - 0.72
Balance available for Appropriations 80.30 61.48
Appropriations
Proposed Dividend on:
Equity Shares 15.04 13.02
Preference Shares 0.01 0.0001
Dividend Paid on Equity Shares 0.01 -
Tax on dividend 2.45 2.16
Transfer to Debenture Redemption Reserve 5.00 5.00
Transfer to General Reserve 5.00 4.03
Balance carried forward 52.79 37.27
80.30 61.48
Income for the year at Rs.768.14 crores increased by 26% from the previous year’s Rs.610.00 crores,while profit after tax for the year at Rs.43.03 crores increased by 7% from the previous year’sRs.40.22 crores.
2. Right Issue of Cumulative Compulsorily Convertible Preference Shares
The Company had issued Cumulative Compulsorily Convertible Preference Shares (CCPS) on a Rightbasis to the Members of the Company, comprising of 44,51,414 CCPS Series A and 44,51,414 CCPSSeries B aggregating to Rs.489.66 crores. Each CCPS of face value of Rs.10 has been issued at apremium of Rs.540 each.
DIRECTORS’ REPORT

6
Fifty-Ninth Annual Report 2010-2011
CK
One CCPS Series A will be compulsorily and automatically converted into One fully paid-up EquityShare of Rs.10 each on 1st September 2011 and One CCPS Series B will be compulsorily andautomatically converted into One fully paid-up Equity Share of Rs.10 each on 1st September 2012.Both the CCPS Series A and B are traded on the Bombay Stock Exchange Limited and the NationalStock Exchange of India Limited.
3. Dividend
The Board of Directors recommend payment of dividends, subject to the approval by the Members atthe Annual General Meeting:
(i) 0.1% Redeemable Preference Shares
The Board of Directors recommend the payment of a Dividend @ 0.1% for the year ended31st March 2011 on the 70,000 Redeemable Preference Shares of Rs.1000 each allotted on26th March 2010.
(ii) 0.1% Cumulative Compulsorily Convertible Preference Shares(CCPS) Series A
The Board of Directors recommend the payment of a Dividend @ 0.1% per annum on CCPS Series Aof Rs.10 each, from the date of allotment i.e. 28th August 2010 and upto the date on which theCCPS Series A are compulsorily and automatically converted into fully paid equity shares ofRs.10 each i.e. on 1st September 2011.
(iii) Equity Shares
The Board of Directors recommend the payment of a Dividend @ 75 % i.e. Rs.7.50 per equity shareon 2,00,56,877 Equity Shares of Rs.10 each for the year ended 31st March 2011 (previous year @65% i.e. Rs.6.50 per share on 2,00,35,052 Equity Shares of Rs.10 each). This represents a pay-outratio of 41% of the profit after tax.
4. Management Discussion and Analysis
A separate section on Management Discussion and Analysis (MD&A) is included in the Annual Reportas required in Clause 49 of the Listing Agreement with the Bombay Stock Exchange Limited and theNational Stock Exchange of India Limited. The MD&A includes discussion on the following matterswithin the limits set by the company’s competitive position: industry prospects and developments,opportunities and risks, the performance of key retail formats and the material operating subsidiaries,outlook for the business, risks and concerns, internal control systems & their adequacy and discussionon financial performance.
5. Subsidiaries
a) Key operating subsidiaries
Details on the performance of the two key operating subsidiaries of the Company viz., TrentHypermarket Limited (Star Bazaar - Hypermarket business) and Landmark Limited (books, music,gaming and gifts business) is included in the MD&A.
7
A Enterprise
CK
b) Optim Estates Private Limited
Optim Estates Private Limited, a wholly owned subsidiary of the Company has been amalgamatedwith another wholly owned subsidiary, Trent Hypermarket Limited, pursuant to a Scheme ofAmalgamation approved by the Hon’ble High Court of Judicature at Bombay with effect from1st April 2009.
c) Fiora Services Limited
Fiora continues to render various services to the Company in terms of sourcing activities,warehousing, distribution, clearing and forwarding. The services have been improved recently tohelp reduce turnaround time.
The other subsidiaries of the Company continue to support primarily the Company’s real estateneeds etc.
d) Subsidiary Accounts
The Ministry of Corporate Affairs vide its circular dated 8th February 2011 granted generalexemption to Holding Companies from attaching the annual accounts of its subsidiary companiessubject to certain conditions.
Accordingly the said documents are not attached to the Balance Sheet of the Company. Astatement containing financial details of the Company’s subsidiaries is included in theconsolidated balance sheet in the Annual Report. The Annual Accounts of the subsidiarycompanies and the related detailed information will be made available to the members of theholding and subsidiary companies seeking such information at any point of time. Further, theAnnual Accounts of the subsidiary companies will also be kept open for inspection by anymember at the Registered Office of the Company, the Corporate Office of the Company and alsoat the Registered Offices of the subsidiary companies.
6. Employees’ Stock Options
The Board of Directors on 22nd June 2010 had approved the allotment of 21,825 Equity Shares tocertain employees of the Company who had been granted Stock Options under the Company’sEmployees’ Stock Option Scheme approved earlier by the members of the Company. Consequentupon which the paid up equity share capital of the Company has increased to Rs.20.06 crores.
The proportionate amortization cost for the year amounting to Rs.0.23 crore has been debited to theProfit and Loss Account. There were no stock options outstanding as on 31st March 2011.
7. Quality Initiatives
The Company participates in the Tata Business Excellence Model (TBEM), which emphasizes quality,leadership, strategic planning, customer orientation and services, process orientation, human relations,shareholder value and commitment to community development.
8. Corporate Sustainability
Corporate Sustainability at Trent integrates economic progress, environmental concerns and socialcommitment.
As a retail organization, having a trained talent pool with a strong orientation for customer service isvery important to business. Trent decided to address this challenge by tapping into the huge pool of

8
Fifty-Ninth Annual Report 2010-2011
CK
talent available from the underprivileged sections of society. This initiative called Saksham (Sanskritfor capable) was pioneered, that aims to enhance the employability skills and provide gainfulemployment to these sections of society. In 2010-11, this initiative has yielded 395 employableaspirants out of which, 361 have gained employment so far.
This programme supports our affirmative action policy that encourages and recognizes equalemployment opportunity to underprivileged sections of society.
We understand our responsibility as a good corporate citizen to help strengthen the communities inwhich we live and work. We encourage our employees to become involved in the communities bylending their voluntary support by conducting knowledge sharing sessions to the Sakshamprogramme. These programmes enrich the quality of life and opportunities for all.
As every year a special fund is created from the sale of Diyas and Stars from our stores during Diwaliand Christmas respectively. This year 27 projects that were aligned with our areas of concern-”Child : Education and Nutrition” of NGOs across our stores are being supported.
9. Corporate Governance
A separate section on Corporate Governance is included in the Annual Report along with thecertificate from the Company’s Auditors confirming compliance with conditions on CorporateGovernance as stipulated in Clause 49 of the Listing Agreements with the Bombay Stock ExchangeLimited and the National Stock Exchange of India Limited.
10. Green Initiatives
The Ministry of Corporate Affairs has recently permitted Companies to send notices/documentsincluding Annual Reports to Members by email. All Members are sincerely requested to register theiremail addresses with their respective depository participants in case of shares held electronicallyand with the Share Transfer Registrars viz., TSR Darashaw Limited in case the shares held physically.This is an opportunity for the Members to extend their role as responsible citizens and contributetowards a Green Environment.
11. Directors’ Responsibility Statement
Pursuant to Section 217(2AA) of the Companies Act, 1956, the Directors, based on the representationsreceived from the Operating Management, confirm that:
i. in the preparation of the annual accounts, the applicable accounting standards have beenfollowed and that there are no material departures;
ii. they have, in the selection of accounting policies, consulted the Statutory Auditors, and haveapplied them consistently, and made judgments and estimates that are reasonable and prudentso as to give a true and fair view of the state of affairs of the Company at the end of the financialyear and of the profit of the Company for that period;
iii. they have taken proper and sufficient care, to the best of their knowledge and ability, for themaintenance of adequate accounting records in accordance with the provisions of the CompaniesAct, 1956, for safeguarding the assets of the Company and for preventing and detecting fraudand other irregularities;
iv. they have prepared the annual accounts on a going concern basis.

9
A Enterprise
CK
12. Directors
Mr. N. N. Tata resigned as the Managing Director of the Company consequent upon his appointment asthe Managing Director of another Tata company. The Board considering his vast experience in the retailbusiness appointed Mr.Tata as an Additional Director and designated him Vice Chairman of the Companywith effect from 19th August 2010. He holds office upto the date of the forthcoming Annual GeneralMeeting and the Company has received a notice from a member intending to propose the candidatureof Mr.Tata as a Director of the Company.
The Board on 27th September 2010 had appointed Mr. B. Bhat as an Additional Director of the Company.He holds office upto the date of the forthcoming Annual General Meeting and the Company hasreceived a notice from a member intending to propose the candidature of Mr. Bhat as a Director of theCompany.
The Board on 11th May 2011 had appointed Mr. S. Susman as an Additional Director of the Company. Heholds office upto the date of the forthcoming Annual General Meeting and the Company has receiveda notice from a member intending to propose the candidature of Mr. Susman as a Director of theCompany.
In accordance with the provisions of the Companies Act, 1956 and the Articles of Association of theCompany, Mr. A. D. Cooper is liable to retire by rotation and is eligible for re-appointment.
Brief particulars of the above Directors are annexed to the Notice of the Annual General Meeting inaccordance with the Listing Agreement entered with the Stock Exchanges.
The Board of Directors has appointed Mr. P. N. Auld, Chief Executive Officer as a ‘Manager’ of theCompany pursuant to the provisions of the Companies Act, 1956, for a period of three years w.e.f.1st May 2011. Members approval is sought for his appointment and the payment of remunerationwhich may be in excess of the limits prescribed under the Companies Act, 1956, as mentioned inItem No.11 of the Notice of the Annual General Meeting. The appointment and remuneration is alsosubject to the approval of the Central Government.
13. Auditors
The Auditors, M/s. N. M. Raiji & Co., Chartered Accountants, retire and are eligible for reappointment.It is proposed to reappoint the Auditors to hold office up to the conclusion of the Annual GeneralMeeting for the year ending 31st March 2012.
14. Statutory Information
A. Fixed Deposits
During the year under review, the Company has not accepted any fixed deposit from the public.As on 31st March 2011 there were no deposits which were unclaimed and due for repayment.
B. Particulars of employees
The particulars of employees as required to be disclosed in accordance with the provisions ofSection 217(2A) of the Companies Act, 1956, and the Companies (Particulars of Employees)Rules, 1975, as amended, are annexed to the Directors’ Report. However, as per the provisions ofSection 219 (1)(b)(IV) of the Companies Act, 1956, the Report and the Accounts are being sent to

10
Fifty-Ninth Annual Report 2010-2011
CK
Operation and Other ExpensesRs. 24,877.50
(32.51%)
Repairs andMaintenanceRs. 2,682.06
(3.50%) DepreciationRs. 1,362.65
(1.78%) Shareholders
Rs. 1,506.91(1.97%)
MaterialsRs. 33,231.22
(43.42%)
GovernmentRs. 4,821.80
(6.30%)
ReservesRs. 2,552.33
(3.34%)
Distribution of Revenue 2010-2011 (Rs. in Lakhs)
EmployeesRs. 5,495.67
(7.18%)
all members of the Company excluding the aforesaid information. The aforesaid information isalso available for inspection at the Registered Office of the Company. Any member interested inobtaining such particulars may write to the Company Secretary.
C. Conservation of Energy, Technology and Foreign Exchange
The information required under Section 217 (1)(e) of the Companies Act, 1956, is not applicable tothe Company.
However the Company consciously makes all efforts to conserve energy across all its operations.Foreign Exchange earnings and outgo are stated on page 70 in the notes to the Balance Sheet andProfit and Loss Account. The Company earned Rs.13.10 crores in foreign currency from retail salesthrough International credit cards.
15. Acknowledgements
The Board wishes to place on record their sincere appreciation for the continued support which theCompany has received from its customers, suppliers, shareholders, promoters, bankers, group companiesand above all, its employees.
On behalf of the Board of Directors
F. K. KavaranaMumbai, 25th May 2011 Chairman

11
A Enterprise
CK
ANNEXURE TO DIRECTORS’ REPORTDisclosure pursuant to the provisions of Securities and Exchange Board of India (Employee Stock OptionScheme) Guidelines, 1999
Sl No Particulars ESOS 2009
a) Options granted 21,825 equity shares of Rs.10/- eachb) Pricing Formula Rs.10/- per share at face value as approved by shareholdersc) Options vested 21,825d) Options exercised 21,825e) Total number of shares arising as a result of
exercise of option 21,825f) Options lapsed (as at 31st March 2011) Nilg) Variation of terms of options There has been no variations in terms of optionsh) Money realised by exercise of options Rs. 2,18,250/-i) Total number of options in force
(as at 31st March 2011) Nilj) Employee wise details of options granted to
i) Senior Management Personnel; N N Tata - Managing Director - 10000 OptionsP K Anand - V.P Operations - 1250 OptionsP Venkatesalu - C F O - 1250 Options
ii) Any other employee who receives a grantin any one year of option amounting to5% or more of option granted during theyear; None
iii) Identified employees who were grantedoption during any year equal to orexceeding 1% of the issued capital(excluding outstanding warrants andconversions) of the Company at the timeof grant. None
k) Diluted Earnings Per Share (EPS) pursuant toissue of shares on exercise of optioncalculated in accordance with AccountingStandard (AS) 20 ‘Earnings Per Share’ Diluted EPS: Rs. 19.60
l) i) Method of calculation of employee The Company has calculated the employee compensationcompensation cost cost using the intrinsic value method of accounting to
account for options issued. The stock based compensationcost as per the intrinsic value method for the year ending31st March 2011 is Rs. 22.68 lakhs.
ii) Difference between the employeecompensation cost so computed at (i)above and the employee compensationcost that shall have been recognized if ithad used the fair value of the Options
iii) The impact of this difference on profits Had the fair value method been used, in respect of stockand on EPS of the company options granted, Profit after tax would have been higher
by Rs.0.68 lakhs and the basic and diluted earnings pershare would have been higher by Re.Nil & Re.Nil respectively.
m) Weighted average execrcise price andweighted average fair value NA
n) Fair value of Options based on Black Scholesmethodology 487.59Assumptions
Risk-free rate 4.69%Expected life 1.125Expected volatility 58.79%Expected dividends Rs. 5.50 per share
Closing market price of share on date ofoption grant Rs. 502.30
Expected dividends - are as per last year dividend declared.
Had the fair value method been used the employeecompensation cost would have been lower by Rs. 0.68 lakhs.
Fifty-Ninth Annual Report 2010-2011
12
MANAGEMENT DISCUSSION AND ANALYSIS
The economic backdrop continued to be an important factor impacting the performance of Companiesacross sectors including organized retail. Following the slowdown in the prior two years, consumer sentimentand business confidence registered a significant improvement in the first three quarters of the FinancialYear 2010-11, and a host of sectors including Auto, IT services and NBFC’s witnessed continued strong offtake. The collateral damage to growth following the global financial crisis in 2008 and thereafter, has beenmore limited and better contained than was earlier expected. Further, the industry numbers seemed tohave been aided by both monetary and fiscal stimulus measures of the Government following the crisis.Nevertheless, inflation has become an important concern area since the last financial year and double digitinflation across categories and especially in essential household consumption items has meant that theReserve Bank of India has been compelled to increase the bench mark interest rates at a faster pace and toa much higher level than was seen warranted or expected earlier.
As observed in prior years, the organized retail space in the first decade of this century was viewed asoffering enormous potential for growth. However, post FY08 the industry witnessed a sharp moderation inexpectations with most retailers across formats facing significant head winds in terms of like-for-like growth,and challenge to viability of stores at rentals contracted during FY07 and FY08. While the same store salesgrowth was impacted during this period, nevertheless the slowdown had some positive, consequenciesespecially from real estate and talent availability perspectives. Following the pronounced slowdown, theindustry witnessed a modest recovery in FY09-10, especially in the second half. This recovery gatheredfurther momentum in the first three quarters of FY10-11 and yielded strong double-digit like-for-likegrowth across most credible retail formats. The recovery also meant that key business Groups with interestin the organized retailing have since revived their expansion plans shelved during the prior economicslowdown. It has been interesting to note that the play-out has been markedly divergent across incumbentretailers:
� the larger players with more robust retail offerings and business model recovered from the slowdownand have registered handsome growth in the recent quarters; though the focus has shifted frompursuing just aggressive revenue growth to a phase where profitability and cash flow are also receivingas much attention;
� the weaker players with less compelling retail offerings and especially those also burdened withsignificant financial leverage have either shut operations or continue to be severely constrained. Severalretailers that fall in this category have continued to shrink in the recent quarters and have been unableto bounce back on the back of the overall economic recovery.
This play-out has reinforced our belief that building a long term sustainable business model is of paramountimportance. And only those retailers with more robust format offerings would be in a position to takeadvantage the enormous potential for growth offered by the Indian economy.
Near term issues notwithstanding, the organized retail opportunity in India continued to attract significantinterest from both large Indian business houses and multinational retailers. It is our continued belief thatover the medium to long term, most of the earlier arguments in favour of the sector (demographics,penetration of organized retail and consumer profile) continue to be valid. Consider the following:
� Demographic dividend and augmented domestic consumption: India’s population of over 1.2 billion,the second largest population in the world after China, continues to grow at over 1.3% per annumadding a number each year equivalent to the total population of some of the developed countries. Inboth China and India, the population has grown significantly over the past decade. But India’s populationgrowth (16%) vs. China’s (5%) makes it likely that India will replace China as the world’s most populous

A Enterprise
13
country in the next 15 years. India benefits from a large youth population that is being increasingly wellabsorbed into the workforce.
Of this, India’s urban population is estimated to be in the region of 300 million people. Urban populationrepresents the highest potential from an organized retail perspective and is concentrated largely in thetop 180 cities, with the remaining population in about 5,000 urban centers. Urban consumption hasbeen repeatedly cited as the primary growth driver across sectors, and in many respects the followingunderlying trends seem to confirm this hypothesis:
1. A more evolved consumption basket vis-à-vis the non-urban population, with higher proportion ofspend towards housing, travel, apparel and medical needs;
2. Higher & growing proportion of people in middle and upper income classes as illustrated in thefollowing chart;
3. Superior and improving performance of the urban population in terms of ‘quality of life’ measuresincluding infant mortality, birth rate and death rate.
Growing Middle & Upper Classes% of Households and Annual Income
2000 2010 2020
40k & Lower 40k to 100 k 100k to 200 k 200k & Higher
71%
19%
5% 12%
14%
21%
23%
5%
25%
25%
49%31%
1,600
1,400
1,200
1,000
800
600
400
200
0India
2000 2010 2020
China USA
Population in million
Source: UN Population Division
Source: NCAER

Fifty-Ninth Annual Report 2010-2011
14
The play-out of the above trends has largely been aided by the services and industrial sectors, whichhave led the underlying GDP growth over the past decade. These trends look set to continue, andshould also continue to aid increase in consumption levels over the medium term.
Further, empirical evidence from other countries like China and Brazil indicates that discretionaryhousehold spending tends to significantly take-off when per-capita income increases beyond certainthresholds. Observers note that per-capita income of US$3000 is one such possible threshold –incidentally China crossed this level in the early 2000s and India is estimated to have crossed this levelin purchasing power parity terms last year.
� Economic growth: Economic growth in India has registered a robust recovery post FY08-09 with theactual outcome in FY10-11 estimated to be marginally better than earlier expectations and significantlypositive vis-à-vis the developed countries. The GDP growth in India continues to be significantly positive,and has averaged at 8.5% p.a. in the period since 2004 and compares very favorably vis-à-vis the FY92to FY03 average of 5.4% p.a. India is one of the fastest growing economies in the world and thenominal private final consumption expenditure is expected to increase by about four times to over US$3.5 trillion in 2020 from the current level. Demographics are expected to be a significant factorimpacting growth over the next decade and consequently facilitating increased penetration of organizedretailing.
Trends in GDP growth % (YoY)
FY-12FY-10FY-08FY-06FY-04FY-02FY-00FY-98FY-96FY-94FY-92
1.4%
5.4%5.7% 6.4%
7.3%8.0%
4.3%
6.7%6.0%
4.4%
5.8%
3.8%
8.5%
7.5%
9.5%9.7%
9.0%
6.7%
8.0%8.6%9.0%
Source: CSO/ EAC Economic Review
� Growing organized retail penetration footprint: The penetration level currently is estimated to be inthe region of 6.5% and is the lowest amongst even emerging market economies of any consequentialsize. The trend in the last decade points to continued increase in the share of organized retail and isexpected to accelerate further in the coming years given the following drivers:
� Growing middle class with greater disposable income; with a large number of young peoplebecoming a part of the work force each year;
� Availability driven adoption – with both incumbent Indian retailers and foreign retailers (subject toFDI regulations in multi-brand retail) executing/ planning substantial store rollouts across the country;
� Greater financial inclusion and easy availability of credit as the banking sector expands andconsciously targets financing of consumption spending.

A Enterprise
15
Estimated Organized Retail Penetration %
� Rapidly changing consumer profile and aspirational consumption: The demographics coupled withless than 10% of the work force being directly employed by the organized sector seems to contributeto a constant shift upwards in the reference point of the average consumer – in terms merchandizeaspired for and value sought. Further, the following factors/ trends are seen contributing to growth inspending overall, and particularly for organized retail over the medium term:
— Changing family level organization/ role definitions and exposure
� More nuclear families
� Increase in the number of working women
� Kids being more informed and demanding
— Increasing exposure to and influence of cosmopolitan media; consequent adoption of Westernvalues and markedly higher brand consciousness.
— Easier availability of jobs (especially Outsourcing & IT related); BFSI & related employment is expectedto increase to over 12 million in the coming decade from about 3 million currently.
— Increased availability of credit/ social acceptance of consumption aided by borrowings; it is estimatedthat about 13% of the people in urban cities are currently making monthly payments for loans.
Organized retail’s structural challenges:
There are nevertheless a few structural challenges to the growth of organized retail in India as discussed inbrief below:
� Real estate availability: There has been much written about over supply of retail mall space, but theground level situation for retailers is quite to the contrary. The issue is of non-availability of retail spaceespecially for larger formats in terms of:
� desirable location
� acceptable scheme and access
� sustainable economics
TotalRetail USD
Billion
4417
862
15 85
45 55
64 36
70 30
80 20
94 6
250
232
2049
472
Traditional Channel Modern Channel
INDIA
CHINA
INDONESIA
BRAZIL
MALAYASIA
US
Source: IBEF/ Analyst reports
Fifty-Ninth Annual Report 2010-2011
16
Also, retail developments in retailer friendly locations are difficult to come by given the relativeattractiveness of alternate use developments say residential apartments.
� Regulations & taxation: The regulatory framework at the ground level is complex and is a seriousstumbling block to growth in many respects. For instance:
� most of the operational compliance requirements for organized retail are a State subject andconsequently there is no uniformity. The applicable regulations like APMC in various States forinstance prevent dis-intermediation whereby the retailer could consider sourcing directly from thefarmer for instance and pass on the benefit of lower sourcing cost to customers.
� current state of indirect tax regulations seriously challenges the economics of many retail formats– given the applicability for instance of VAT, Service Tax on rentals and excise on branded garments(introduced in the recent budget) coupled with no setoffs.
� Supply chain infrastructure and logistics: The logistics industry is itself in a nascent development phasein India and is ill-equipped to support especially sourcing and movement of a very large number ofSKU’s efficiently. This backdrop has meant that the retailers have had to tackle this activity in-house andhave borne the down-side of related dis-economies.
The above structural challenges notwithstanding, we firmly believe the longer term opportunity in theorganized retail space in India continues to be sizeable and attractive.
Organized retail industry in FY10-11
In our view, during the financial year under review the key factors that impacted the performance ofthe organized retail industry in India were:
— the near term consumption triggers
— supply chain issues and cost pressures (including taxes)
— the state of the retail real estate market and
— the intensity of micro market competition
With varying degrees of impact the retailers in India have witnessed during the Financial Year2010-2011:
a) Improved consumer confidence and consequently better off take especially during the first threequarters; the fourth quarter and thereafter consumer spending is possibly getting impacted by alower level of discretionary household budget given the pronounced inflation witnessed in essentialcategories coupled with sharply higher borrowing costs.
b) Significant operating cost pressures including in respect of merchandise inputs (yarn prices forinstance registered over 30% increase on a year on year basis), wages, electricity and commonarea maintenance.
c) The imposition of 10% excise duty on branded garments and the consequent disruption of supplychain given both the protests seeking withdrawal of the charge and the operational complianceformalities for branded apparel manufacturers.
d) The expected increase in rentals involved in taking up of additional real estate for expansion especiallyin the backdrop of most key participants in the organized retail industry having revived their respectiveexpansion plans and this coupled with a limited pipeline of acceptable retail real estate developments.The limited pipeline of developments is in turn explained for the most part by:

A Enterprise
17
— attractiveness of alternate developments like residential apartments;
— the operational difficulties in managing retail malls/shopping centres; and
— importantly the significant liquidity squeeze faced by the real estate sector given the RBI policy.
e) Higher intensity of competition in certain micro market due to pronounced clustering of retailerpresence with similar offerings.
These macro observations have applied, though with varying emphasis to the predominantretailing formats (Westside, Landmark & Star Bazaar through respective subsidiaries) managed by theCompany. In aggregate the Company registered encouraging growth, with consolidated income fromoperations increasing from Rs 1,120 crores in FY09-10 to Rs 1592 crores in FY10-11, an increase ofover 42%.
OPERATIONS – WESTSIDE
The Westside stores, the predominantly private label fashion apparel format, continues to be the mainstayof the retailing business of the company. This format over the years has been rolled out across the countryand currently covers over 33 cities.
In the year under review, eleven new stores were opened – Mangalore (City Centre Mall), Kanpur (Z SquareMall), Chandigarh (Tricity Mall), Chennai (Express Avenue Mall), Bangalore (Innovation Mall), Delhi (AmbienceMall), Aurangabad (Prozone Mall), Coimbatore (Brookefields Mall), Jabalpur (Samdariya Mall), Hubli (MaxMall) and Goa (Caculo Mall).
In the first quarter of the current financial year three further stores have been opened in Bhopal (DB Mall),Mumbai (Infinity Mall – Malad) and Varanasi (Dhanushree Complex), taking the total number of operationalWestside stores to 57.
10-1109-1008-0907-0806-07
609
Total Operating Income (Rs. Crs.)
Cumulative stores (Rs. Crs.)
718
850
1,120
1,592
107
35
51
70
88
Consolidated income from operations (Rs Crores)

Fifty-Ninth Annual Report 2010-2011
18
Number of Westside Stores
During FY10-11, as can be observed from the above chart the Company recorded eleven new storeopenings – being the highest in any year since the inception of this format. In many respects, this wasfacilitated by the pipeline of acceptable retail real estate at more reasonable rates and contracted mostlyduring the economic slowdown. The conviction of the Board and the management on the attractiveness ofthe Westside format as a business model was one of the primary reasons to continue expansion of thechain during the earlier slowdown, when several peers had otherwise scaled down their roll-out plans.Further, during the year under review, the like-for-like sales growth of Westside stores was encouraging,especially in the first three quarters.
As in the previous years, we continue to take the following approaches in operating and expanding thisformat:
� Private label vs branded merchandize: We continue to emphasize the role of private label merchandizeand Westside is ranked in the top quartile in terms of proportion of private label merchandize to overall
10-1109-1008-0907-0806-0705-0604-0503-0402-0301-0200-0199-00
3
3 1
46
8
New stores Cumulative stores
13
21
2528
36
43
54
15
2 25
64 3
8 7
11
2
-10
-5
0
5
10
15
20
25
FY011FY010FY09FY08FY07FY06FY05FY04FY03FY02FY01
Westside Stores – Like for Like Sales Growth

A Enterprise
19
revenues. We believe higher private label content facilitates not only realization of better margins butalso affords other benefits like control over the merchandize design and quality – which should allowfor a better competitive position in the medium term. At the same time, the intent is to make theoffering complete and collectively more attractive through the inclusion of select brands that accountfor upto 15% of the overall merchandize range on offer.
� Size of Westside stores: We vary the size of planned Westside stores based on various factors includingthe immediate micro-market, mall vs standalone presence and leasehold economics. However, empiricalevidence seems to suggest a size not exceeding twenty thousand square feet selling area is preferable(unless the location on offer was seen to be highly attractive and as an exception), since lifestyledepartment stores much larger in area face viability issues and consequently limit the geographies thatcan be viewed as markets. At the same time, the attempt is to ensure that there is a credible range onoffer for the stores to be attractive destinations for shopping.
Further, during the period under review, we have continued to emphasize improving the efficiency of oursupply chain to effectively replenish our store network and significantly improve merchandize availabilitylevels in stores. While we seek to exercise restraint on costs, we have consciously chosen to invest in areaslike significantly refurbishing the look and feel of certain stores in the portfolio, (on lines of he Army NavyWestside store in South Mumbai) a more robust operations organization and a warehouse managementsystem. We believe incurring of these additional costs on the above initiatives is warranted especially froma long term business model sustainability perspective, and we expect to realize tangible benefits over themedium term.
In the period under review, there have been cost pressures across line items including:
— sharply higher merchandize input costs given the rally in commodity prices;
— increase in wage bill (with minimum wage levels witnessing sharp increase in several States); alsofueled by improved hiring sentiment across industries;
— higher energy costs in States like Maharashtra and escalating Common Area Maintenance charges inselect malls; and
— increase in tax costs (service tax on rentals, higher VAT in most States and the 10% excise on brandedgarments).
These pronounced cost pressures across several line items and the significant inflation levels in variouscategories in the recent quarters is increasingly a cause for concern.
Source: CSO, RBI
0
2
4
6
8
10
12
14
FY011FY010FY09FY08FY07FY06FY05FY04FY03FY02FY01FY00
Inflation Trend (CPI – YoY %)

Fifty-Ninth Annual Report 2010-2011
20
In summary, despite various challenges, including the earlier economic slowdown and the recent costpressures, Westside as a format continues to be profitable and as stated previously, the intent is to furtherscale up presence by opening as many new stores in the near to medium term, subject to availability ofacceptable retail locations and estimated viability of economics at the store level.
OPERATIONS – STAR BAZAAR
Star Bazaar, the discount hypermarket format, has continued to receive augmented commitment of resourcesin the period of review, and there are now eleven operational stores three in Mumbai (Andheri, Dahisar &Thane), three in Bangalore, and one each in Ahmedabad, Aurangabad, Surat, Pune and Chennai]. Each StarBazaar is modeled to be a one stop shop offering a wide range of products including fresh foods – fruits,vegetables & non vegetarian products, dairy, home care, health and beauty products, apparel, home décor,gifts and household items. During the year under review, the like-for-like sales growth of Star Bazaar storescontinued to be strong at 20%.
Consistent with the commentary in last year’s report, the company continues to view food andgrocery (F&G) retailing as a substantial opportunity, which is worthy of being seriously pursued in themedium term. F&G remains one of the largest categories and is estimated at around 60% of consumerspending.
Share of spend and organized retail penetration
16.9% Others
3.4% Furniture4.0% Health & Wellness
6.4% Electronics
9.9% Apparel
59.4% Food & Grocery 1%
23%
4%11%
12%
10%
Share Penetration
Nevertheless, given the significantly lower gross margins on F&G vis-à-vis other merchandize (and thereforeformats), the need to evolve a economically viable business model is viewed to be critical. The performanceof the Star Bazaar business over the last two years continues to be encouraging and has aided the pursuit ofthe stated expansion plans with greater conviction. Nevertheless, this business continues to incur operationallosses, especially on account of the under absorption of shared services and corporate costs. Also, we believethis trend would continue until the business reaches a critical mass over the next few years.
The Star Bazaar business was transferred to Trent Hypermarket Limited, a wholly owned subsidiary, as part ofthe portfolio reorganization exercise with effect from 1st August 2008. The independent status post thetransfer, has continued to enable sharper management focus, and various alternatives for profitably scalingup operations are being pursued.

A Enterprise
21
Star Bazaar Hypermarkets
Trent Hypermarket Limited has a franchise and a wholesale supply arrangement with Tesco Plc of U.K. andits wholly owned subsidiary [Tesco Hindustan Wholesaling Pvt Limited (THWPL)] in India respectively, inrespect of the Star Bazaar business. The exclusive franchise agreement allows the Star Bazaar businessaccess to Tesco’s extensive retail expertise and technical capability including world class IT systems, processesand best practices in functions like marketing, stock management, retail information systems, supply-chaininfrastructure and front-end services to drive the growth of hypermarket business. Under the wholesalesupply arrangement, Star Bazaar also sources merchandise from Tesco’s wholesale cash-and-carry businessin India, benefiting from Tesco’s sourcing capability and supply chain expertise. Given concerted effortsfrom both teams, a significant share of merchandise retailed across Star Bazaar stores is now being sourcedby THWPL.
Consistent with the commentary in previous reports, the plan and key initiatives in respect of theStar Bazaar format include:
� The intention to scale up the number of stores in the country to about 50 over the medium term. Thepace of roll-out is hindered primarily on account of slower than expected pace of delivery of signedproperties by developers and we see this to be a continuing challenge even going forward.
� Large box format – as with the existing store portfolio, the intent in the medium term is to continue tofocus on rollout of Star Bazaar stores with a footprint in the region of fifty thousand square feet,especially given the need to contain per square foot rentals. Further, as a conscious strategy additionalsquare footage has been secured in select locations in order to facilitate sub-lease to adjacent retailofferings and improve realization.
� Local sourcing and consumer catchment – establishing robust regional sourcing arrangements is seento be inevitable in-order to service a chain of large hypermarkets in a profitable manner. Also, primarilyfrom a traffic and consumer behavior perspective, we do not see ‘outside city limits’ stores beingsustainable and hence the intent is to continue to focus on the immediate hinterland of a proposedstore and the catchment it affords.
10-1109-1008-0907-0806-07
46
Total Operating Income (Rs. Crores)
Cumulative stores
65
156
290
520
11
1
34
7

Fifty-Ninth Annual Report 2010-2011
22
� Emphasis in Star Bazaar to be on Food as well as Non-Food merchandize – this from a gross margin aswell as from range availability perspective for the customer. However, we are yet to witness anymaterial shift in mix towards non-food merchandize.
� Own label offerings – over time as the branding of the stores get entrenched, emphasis would be onincreasing the contribution of ‘own label’ offerings across categories. This emphasis is also consistentwith the estimated share of private label merchandize seen in the case of entrenched internationalretailers.
As observed earlier, though the Star Bazaar business is still a mid-sized operation, the results have broadlybeen in line with expectations and mostly encouraging – with existing stores reporting strong same storesales growth especially in the last two years. We see increasing visibility of scaling up this operation into aconsequential and eventually profitable business over the next few years, aided by the strategies beingpursued and the expertise accessed from Tesco through the franchise and wholesale supply arrangements.However, in the interim this business continues to warrant significant investment of capital and is expectedto take a few more years before the shared services & central costs get covered by the contributiongenerated from stores.
OPERATIONS – LANDMARK
Landmark stores – the books plus music, toys and furnishing format – are managed by a subsidiary of thecompany, Landmark Limited. As of date, there are 26 operational stores across the country including airportand hotel stores. FY10-11 again proved to be a difficult year for Landmark from an operating perspective.
Landmark recorded a 15% growth in total income to Rs 262 crores (Rs 227 crores in FY09-10) during theperiod under review, and the profit before tax was Rs 1.07 crores (loss Rs 1.61 crores in FY09) primarily dueto the underperformance of select stores, muted same store sales growth, one time charges relating torationalization/ shifting of certain stores and significantly, part monetization of a freehold property. Like inthe previous year, in-store initiatives to generate additional income like for promotional display, coffee shopfees etc. pursued by Landmark helped offset the cost pressures in part.
The following is brief discussion of the principle factors contributing to the reported performance:
� Decline of the music category wherein digital downloads have for the most part become the norm,including through mobile phone platforms;
� Under performance of select mature stores vis-à-vis expectations; the key contributing factors includethe opening of a competing mall location in the relevant Chennai micro-market, internal supply chainchallenges given legacy IT systems and timely merchandize availability issues at the store level;
� Under performance of select large box new stores, as these stores are taking longer to reach break-even sales volumes; key contributing factors include slow ramp-up of immediate mall occupancy,operational mall maintenance and timely merchandize availability issues;
� Costs incurred on the rationalization of store area in one of the Bangalore stores;
� On the other hand encouraging off-take of certain new categories of focus like gaming, sportsmerchandise and select tech-accessories; also, the part monetization of a freehold property significantlyassisted reported performance.
Key observations and intent on approach in respect of the Landmark format:
� As a retailer of books, Landmark has maintained its leadership (in value terms) and continues to offerthe largest collection of books in the country with over 100,000 titles in each of the larger stores;
A Enterprise
23
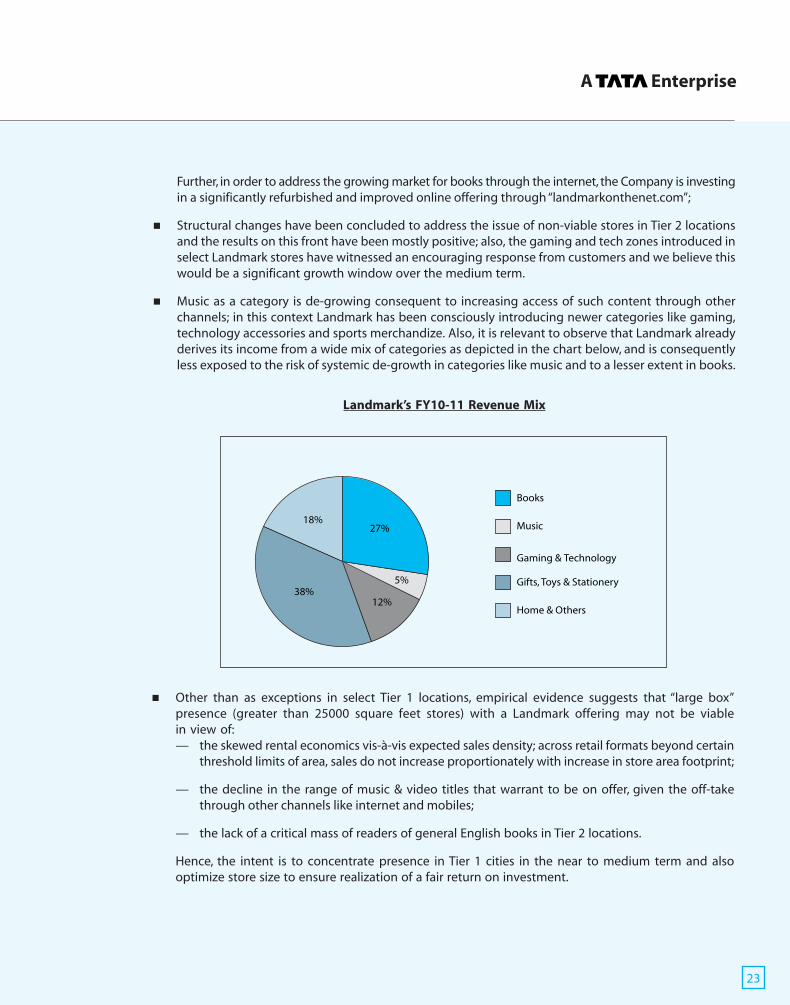
Further, in order to address the growing market for books through the internet, the Company is investingin a significantly refurbished and improved online offering through “landmarkonthenet.com”;
� Structural changes have been concluded to address the issue of non-viable stores in Tier 2 locationsand the results on this front have been mostly positive; also, the gaming and tech zones introduced inselect Landmark stores have witnessed an encouraging response from customers and we believe thiswould be a significant growth window over the medium term.
� Music as a category is de-growing consequent to increasing access of such content through otherchannels; in this context Landmark has been consciously introducing newer categories like gaming,technology accessories and sports merchandize. Also, it is relevant to observe that Landmark alreadyderives its income from a wide mix of categories as depicted in the chart below, and is consequentlyless exposed to the risk of systemic de-growth in categories like music and to a lesser extent in books.
Landmark’s FY10-11 Revenue Mix
� Other than as exceptions in select Tier 1 locations, empirical evidence suggests that “large box”presence (greater than 25000 square feet stores) with a Landmark offering may not be viablein view of:— the skewed rental economics vis-à-vis expected sales density; across retail formats beyond certain
threshold limits of area, sales do not increase proportionately with increase in store area footprint;
— the decline in the range of music & video titles that warrant to be on offer, given the off-takethrough other channels like internet and mobiles;
— the lack of a critical mass of readers of general English books in Tier 2 locations.
Hence, the intent is to concentrate presence in Tier 1 cities in the near to medium term and alsooptimize store size to ensure realization of a fair return on investment.
Home & Others
Gifts, Toys & Stationery
Gaming & Technology
Music
Books
27%
5%
12%38%
18%

Fifty-Ninth Annual Report 2010-2011
24
Overall, we believe the Landmark format would prove to be sustainable over the medium term with stepsbeing taken to:
- grow existing & select new categories with significant growth headroom;
- optimize store sizing, merchandize range and look & feel;
- improve timely availability at the store level of relevant merchandize;
- build an adequate supply chain infrastructure and a more robust & scalable technology platform.
OTHER FORMATS, JOINT VENTURE AND TREASURY:
� Sisley: The Company currently operates eight small format stores under the Sisley banner, as a franchiseeof Benetton in India. While the performance of these stores in the period under review continued tobe negative, consequent to the efforts taken by the management to shift/ or otherwise negotiatebetter rental arrangements, as also better off-take for the merchandize vis-à-vis the correspondingprior period, the performance at the store level has witnessed an improvement. Nevertheless, theformat is yet to turn profitable. The current franchise agreement with Benetton expires towards theend of FY11-12 and the Company is exploring various options regarding the way-forward.
� Fashion Yatra: The Company currently operates three stores in Mumbai (in Kalyan), Nanded and Sangliunder this banner. There have been significant learnings especially with respect to customer preferencesin these markets. However, the results to date have been mixed and the format is not yet profitable atthis time. The intent is to continue to incubate this model in the near term and in the interim formulatea longer term strategy. This approach is seen to be warranted, as we believe that this space could affordsignificant headroom for growth once the format is settled.
� Zara: The Company has a Joint Venture (JV) with the Inditex group of Spain with a shareholding of 51%(Inditex):49% (Trent). During FY09-10 the Company had invested Rs 31.75crores in the JV, and the firstthree stores have since opened - two in Delhi & one in Mumbai. The customer response has been veryencouraging and the JV entity (Inditex Trent Retail India Private Limited) recorded revenues ofRs 147 crores in FY10-11. The plans are to open more Zara stores in India over the next three to fouryears in the major metro cities.
� Treasury: The Company’s treasury income improved over last year on account of favourable marketconditions coupled with a prudent treasury policy. From an investment perspective, the increase ininterest rates prompted by higher inflation, led to better returns for the company’s investments in debtinstruments particularly FMPs and bank CDs. The temporary parking of proceeds from the rights issuecompleted during the period under review, mostly in mutual funds & CDs, prior to their deployment inoperations, also in part explains the increase in treasury income. Out of the total proceedsof Rs.490 crores of the issue, Rs.168 crores, have already been utilized towards the objects of the issue.
OVERALL FINANCIAL RESULTS
On a standalone basis the Company has reported overall total income of Rs 768 crores (Rs 610 crores inFY10) for the period under review and Profit Before Tax of Rs 60.34 crores (Rs 49.8 crores in FY10).Exceptional items for the year represent provision for diminution in the value of Company’s investments inthe shares of a Joint Venture of the company (Trexa ADMC Private Limited) to the extent of Rs 2 crores andprovision for certain disputed claims for expenses of Rs 0.84 crores. All items have been accounted, includingthe redemption premium on debentures issued, in a manner consistent with the applicable accountingpolicy of the Company and the Companies Act.

A Enterprise
25
On a consolidated basis the Company has reported total income of Rs 1,629 crores (Rs 1,138 crores inFY10) for the period under review and Profit Before Tax of Rs 7.01crores (Rs 9.1crores in FY10). Theoperations of Westside, the Zara JV and treasury contributed positively to the results while Star Bazaar andLandmark contributed negatively during the period. The consolidated results of the Company reflect thecost of incubation of the hypermarket business (now in Trent Hypermarket Ltd) and losses in LandmarkLimited. The losses incurred by the hypermarket business continued to be broadly in line with the businessplan of the Company. Further, the consolidated accounts reflect the amalgamation of Optim Estates PrivateLimited, a 100% subsidiary of the Company prior to the Court order approving the amalgamation, with TrentHypermarket Limited (THL) with effect from 1st April 2009.
A review of the performance of the principal formats has been covered in prior sections.
INTERNAL CONTROLS AND ADEQUACY
The Company has a defined system of internal controls for financial reporting of transactions and compliancewith relevant laws and regulations commensurate with its size and nature of business. The Company alsohas a well-defined process for ongoing management reporting, and periodic review of businesses usingthe Balanced Score Card process to ensure alignment with strategic objectives.
There is an active internal audit function and is carried out partly by internal resources and the balanceactivity is outsourced to CA firms. As part of the effort to evaluate the effectiveness of the internal controlsystems, the internal audit department reviews the control measures on a periodic basis and recommendsimprovements, wherever appropriate. The internal audit department is manned by qualified and experiencedpersonnel and reports directly to the Audit Committee of the Board. The Audit Committee regularly reviewsthe audit findings as well as the adequacy and effectiveness of the internal control measures. Based ontheir recommendations, the Company has implemented a number of control measures both in operationaland accounting related areas, apart from security related measures.
HUMAN RESOURCES
The Company believes that people are one of its greatest assets and training is an investment fororganizational excellence. Availability of the right kind of talent in the retail industry has been an issueconsidering the nascent nature of the industry. Although attrition continues to remain high with the frontend store level staff, it is marginal amongst corporate staff. However, the revival of expansion plans bymultiple retailers coupled with pronounced hiring appetitive has meant increased compensation pressuresat all levels.
A lot of emphasis continues to be placed on training and development of store staff and also on thedevelopment of leadership skills. Further, during the year under review, the Company has taken severalnew initiatives to ensure that the knowledge gained is institutionalized and integrated with the processes& embedded into the relevant IT systems. As of 31st March 2011 the staff strength (including corporatestaff ) was 2,755 at Westside, 39 at Sisley, 141 at Fashion Yatra, 308 at Fiora, 2,215 at Star Bazaar, 1,255 atLandmark giving an overall total of 6,713 employees.
OUTLOOK
A pronounced rate of inflation and significantly higher interest rates are likely and apparent dampeners tonear term performance. In fact, on a post tax basis the yield on bank deposits currently is lower than theinflation rate, implying negative real interest rates. Soaring commodity prices are likely to reduce discretionaryconsumer spending headroom especially as F&G prices rise (and this increase is estimated in the region of15% over the previous year). Hence the consumption triggers are not positive at this time and there islimited visibility to improvement on this front in the near term. This coupled with the escalating costs

Fifty-Ninth Annual Report 2010-2011
26
(especially wages, electricity and common area maintenance) and significant increase in tax charges (withoutinter-se setoffs) as discussed earlier imply significant challenges.
On the other hand, we are encouraged by the sustained economic growth witnessed in the recent quartersand believe the same will augur well for the organized retail industry too. The increased hiring by varioussectors and consequently improved absorption of youth into the organized workforce should serve as animportant positive consumption trigger.
Separately, the deterioration in availability of properties at acceptable rentals and valuations in the realestate space (with most participants in the organized retail reviving their growth plans) is a cause forconcern. So we view improving the quantum and quality of our pipeline of new stores across the threeformats as a challenge that we already face and are having to address. However, the property pipelinecontracted during the economic downturn and in the recent quarters should still allow the opening of anumber of new stores across the three formats in FY11-12, and broadly in line with the roll-out witnessedin FY10-11.
The prior observations on the near term consumption triggers notwithstanding, we continue to be verypositive on the underlying case for growth of organized retailing in India over the coming decade. Asobserved in the previous years, the intent going forward is to continue substantially scaling up our presenceand in doing so across the formats:
� Emphasize sustainable store level profitability and only scale up formats that are seen to be viable;
� Concentrate resources on substantially growing a few select formats (primarily Westside, Landmarkand Star Bazaar);
� Continue to be primarily “large box”;
� Selectively commit direct investments in properties, leverage our healthy relationship with developersand the partnership with the Xander fund; and
� Leverage relationship with global retailers like Tesco and Inditex to further the profitable growth ofrespective formats.
RISK AND CONCERNS
� Retail real estate availability and costs: In FY08-09 and the first half of FY09-10, several propertiescame on offer to the Company due to the slowdown in expansion plans of other retailers – this is nolonger the case at this time, and given that alternative end-uses are seen by developers as moreattractive than developing a retail offering, new property pipeline is likely to get impacted. Separately,lease rentals in many high street locations have witnessed an increase in rates in the recent months,and may continue to remain at levels that make the locations unviable for new retail operations.
� Talent availability : As observed in earlier years, the availability of relevant talent at acceptablecompensation levels continues to be an issue. And employing expatriates, with the attendant highercosts, becomes inevitable in certain areas due to paucity of talent as we attempt to scale up significantly.
� Electricity availability & costs: Electricity is one of the largest components of our costs and has increasedsignificantly in recent years, especially in States like Maharashtra. Separately, higher power deficits inselect cities has led to increased load shedding and has meant more reliance on generators, which hasadded to costs – our stores in Chennai and Gurgaon are a case in point.

A Enterprise
27
� Indirect taxation: The indirect tax regime with its multiplicity of charges and levies continues to be anissue (should be addressed at least partly if and when the proposed GST regime is implemented – buteven on that account both the rate and mechanics would still have material implications for ouroperations). The primary negatives currently are twofold: the 10% excise of branded garments whichhas also caused much upheaval in terms of the documentation & procedural formalities of compliance;secondly the service tax on rentals which has increased the already high cost of occupancy and thecontinuing litigation in various High Courts. The excise on branded garments and service tax on rentalshave come as a significant financial charge to an industry which already faces pronounced challenges.
CAUTIONARY STATEMENT
Statements in the Management Discussion and Analysis describing the Company’s objectives, projections,estimates and expectations may be ‘forward-looking statements’ within the meaning of applicable securitieslaws and regulations. Actual results could differ materially from those expressed or implied. Importantfactors that could make a difference to the Company’s operations include economic conditions affectingdemand / supply and price conditions in the markets in which the Company operates, changes in theGovernment regulations, tax laws and other statutes and other incidental factors.

Fifty-Ninth Annual Report 2010-2011
28
CORPORATE GOVERNANCE REPORT FOR THE YEAR 2010-2011(As required under Clause 49 of the Listing Agreements entered into with Stock Exchanges)
1. The Company’s philosophy on Corporate Governance
The Company’s philosophy on Corporate Governance is to observe the highest level of ethics in all itsdealings, to ensure efficient conduct of the Company and help the Company achieve its goal inmaximizing value for all its stakeholders. The Company’s philosophy is in line with the Tata group’s longstanding tradition of fair and transparent governance.
The Company has adopted the Tata Code of Conduct for its employees including the Executive Directors.In addition, the Company has adopted a Code of Conduct for its Non-Executive Directors. The Company’sCorporate Governance philosophy has been further strengthened through the Tata Business ExcellenceModel, the Tata Code of Conduct for Prevention of Insider Trading and the Whistle Blower Policy. TheCompany is in compliance with the requirements of the guidelines on Corporate Governance stipulatedunder Clause 49 of the Listing Agreements entered with the Stock Exchanges.
2. Board of Directors
As on 31st March 2011, the Company has 6 directors including a Non-Executive Chairman. Out of6 Non-Executive Directors, 3 are Independent Directors. The composition of the Board is in conformitywith Clause 49 of the Listing Agreements entered into with the Stock Exchanges. Mr. S. Susman hasjoined as a Non-Executive Independent Director on the Board of the Company with effect from11th May 2011.
None of the Directors of the Company is a Member of more than 10 Committees or a Chairman ofmore than 5 Committees across all the Companies in which he is a Director.
The names and categories of the Directors on the Board, their attendance at Board meetings and at thelast Annual General Meeting held during the year and the number of directorships and committeechairmanships / memberships held by them in other companies is given below. Chairmanship/membership of Board Committees include only Audit and Shareholders/Investors’ Grievance Committees.
Name Category No. of Board Whether No. of No. of Committee Number Numbermeetings attended Director- positions held in of Equity of CCPSattended last AGM ships in other companies shares held
during held on other held as as on2010-2011 Friday, public on 31st 31st
18th August limited March March2010 companies 2011 2011
Held Attended Chairman Member
Mr. F. K. Kavarana Non-Independent 8 8 Yes 9 2 4 Nil Nil(Chairman) Non-ExecutiveDIN: 00027689
Mr. N. N. Tata* Non-Independent 8 8 Yes 8 1 1 59,315 14,689(Vice Chairman) Non-Executive (Series A)DIN: 00024713 14,689
(Series B)
Mr.B.S.Bhesania** Independent 8 5 Yes - - - - NilDIN: 00026222 Non-Executive
Mr. A. D. Cooper Independent 8 7 Yes 4 3 Nil Nil NilDIN: 00026134 Non-Executive
Mr. K. N. Suntook Independent 8 6 Yes 2 Nil 1 360 80 (Series A)DIN: 00025818 Non-Executive 80 (Series B)
Mr. Z.S.Dubash Independent 8 6 Yes 1 Nil Nil Nil NilDIN: 00026206 Non-Executive
Mr. B. Bhat*** Non-Independent 8 1 NA 4 Nil 1 Nil NilDIN: 00148778 Non-Executive
Mr. S. Susman**** Independent NA NA NA - - - NA NADIN: 03503013 Non-Executive
* Resigned as a Managing Director with effect from 11th August 2010 and appointed as an Additional Director and Vice Chairman.** Retired as a Director with effect from 18th August 2010.*** Appointed as an Additional Director with effect from 27th September 2010.**** Appointed as an Additional Director with effect from 11th May 2011.

A Enterprise
29
Other Directorships do not include alternate Directorships, Directorships of private limited companies,Section 25 companies and of companies incorporated outside India.
The Board of Directors of the Company met 8 times during the year 2010 -2011 i.e. on 26th April 2010,28th May 2010, 14thJune 2010, 28th July 2010, 29th July 2010, 2nd September 2010, 27th October 2010and 25th January 2011.
The gap between two meetings did not exceed four months. The required information as enumeratedin Annexure IA to Clause 49 of the Listing Agreement is made available to the Board of Directors fordiscussions and consideration at Board meetings.
The Company did not have any pecuniary relationship or transactions with Non-Executive Directorsduring the year ended 31st March 2011 except for payment of sitting fees and Commission.
Code of Conduct:
The Company has adopted the Tata Code of Conduct for its Executive Directors, senior managementpersonnel and other executives of the Company. The Company has received confirmations from thesenior management personnel regarding compliance of the Code for the year ended 31st March 2011.The Company has also adopted the Code of Conduct for Non-Executive Directors of the Company. TheCompany has received confirmations from the Non-Executive Directors regarding compliance of theCode for the period ended 31st March 2011. A declaration to this effect duly signed by the CEO isannexed hereto. Both the Codes are posted on the website of the Company.
3. Audit Committee
The Audit Committee of the Company is constituted in line with the provisions of Clause 49 of theListing Agreements with the Stock Exchanges read with Section 292A of the Companies Act, 1956. TheAudit Committee comprises of 4 Directors, 3 of which are Independent, Non-Executive Directors.
During the year under review, the Audit Committee of Directors met 7 times and helddiscussions with the statutory auditors and internal auditor of the Company concerning the accounts ofthe Company, internal control systems, scope of internal audit and reports of the internal auditor,compliance with accounting standards and Listing Agreement, reviewed quarterly and annual financialstatements before they were submitted to the Board of Directors. The Audit Committee of Directorsalso reviewed the matters prescribed under Clause 49 II [D] of the Listing Agreement. At the AuditCommittee meetings, the statutory auditors of the Company were invited and their findings/observationswere also discussed.
The Audit Committee meetings are usually held at the Registered Office of the Company and areusually attended by the Chief Financial Officer and the General Manager – Finance & Accounts,representatives of the statutory auditors and representatives of the internal auditors. The CompanySecretary acts as the Secretary of the Audit Committee.
Minutes of the Audit Committee Meetings are circulated to the members of the Board, discussed andtaken note of.

Fifty-Ninth Annual Report 2010-2011
30
The composition of the Audit Committee and the details of meetings attended by the Directors aregiven below:
Name of Members Category No. of Committee Meetingsattended during the
year 2010-2011
Held Attended
Mr. A. D. Cooper, Chairman Independent Non-Executive 7 7
Mr. N. N. Tata* Non-Independent Non-Executive 7 3
Mr. B. S. Bhesania** Independent Non-Executive 7 4
Mr. K. N. Suntook Independent Non-Executive 7 6
Mr. Z. S. Dubash* Independent Non-Executive 7 1
* Appointed as members with effect from 28th September 2010.
* * Retired as a Director of the Company with effect from 18th August 2010.
Members of the Audit Committee have requisite financial, legal and management expertise.
During the year 2010-11, 7 Audit Committee meetings were held on 16th April 2010, 26th April 2010,28th May 2010, 28th July 2010, 27th October 2010(two meetings held on same day), and 25th January2011. The necessary quorum was present at all the meetings.
The Chairman of the Audit Committee, Mr. A. D. Cooper, was present at the Annual General Meetingheld on 18th August 2010. The Chairman of the Audit Committee briefs the Board members about thesignificant discussions at Audit Committee meetings.
Whistle Blower Policy
The Board of Directors on the recommendations of the Audit Committee has approved and adopteda Whistle Blower Policy that provides a formal mechanism for all employees of the Company toapproach the Ethics Counselor/Chairman of the Committee of the Company and make protectivedisclosure about the unethical behavior, actual or suspected fraud or violation of the Company’s Codeof Conduct.
4. Remuneration Committee
a) Composition and Role
The Remuneration Committee of the Company is empowered to review the remuneration andcommission payable to the Executive Directors and retirement benefits to be paid under theRetirement Benefit Guidelines adopted by the Board and to deal with matters pertaining toEmployees’ Stock Option Scheme, etc.

A Enterprise
31
The composition of the Remuneration Committee and the details of Meeting held on 28th May 2010 asattended by the Directors are given below:
Name of Members Category No. of Committee Meetingsattended during the
year 2010-2011
Held Attended
Mr. A. D. Cooper, Chairman Independent Non-Executive 1 1
Mr. B. S. Bhesania* Independent Non-Executive 1 1
Mr. F. K. Kavarana Non-Independent Non-Executive 1 1
Mr. B.Bhat ** Non-Independent Non-Executive 1 N.A.
Mr. K. N. Suntook*** Independent Non-Executive 1 N.A.
Mr. Z. S. Dubash*** Independent Non-Executive 1 N.A.
* Retired as a Director of the Company with effect from 18th August 2010.
* * Appointed as a member with effect from 14th October 2010.
*** Appointed as members with effect from 3rd May 2011.
The non-mandatory requirement of Clause 49 regarding the Remuneration Committee has beencomplied with by the Company as stated above.
b) Remuneration Policy
The remuneration of the Executive Directors is decided by the Board, based on the recommendationof the Remuneration Committee, within the ceilings fixed by the shareholders of the Company.The Company pays remuneration by way of salary, perquisites and allowances (fixed component),and commission (variable component) to its Executive Directors. Annual increments are decidedby the Remuneration Committee with the salary scale approved by the members and are effectivefrom 1st April annually. The Remuneration Committee decides on the commission payable to theExecutive Directors on determination of profits for the financial year in terms of the provisions ofthe Companies Act, 1956 (‘the Act’).
The remuneration by way of commission to the Non-Executive Directors is distributed to thembased on their attendance and contribution at the Board and certain Committee meetings, as wellas time spent on operational matters other than at the meetings. The members had at the AnnualGeneral Meeting held on 8th September 2006, approved the payment of remuneration by way ofcommission to the non-whole time Directors of the Company, of a sum not exceeding 1% perannum of the net profits of the Company, calculated in accordance with the provisions of the Act,for a period of 5 years commencing 1st April 2006. The said commission is distributed amongst thesaid Directors in accordance with the directives given by the Board. The attention of the Membersis invited to the Notice, wherein approval is sought by way of a Special Resolution for payment ofcommission to the Non-Executive Directors for a further period of five years commencing from1st April 2011.

Fifty-Ninth Annual Report 2010-2011
32
A sitting fee of Rs. 20,000/- for attendance at each meeting of the Board and Audit Committee,Rs. 10,000/- for attendance at each meeting of the Investment Committee, RemunerationCommittee & Property Committee and Rs. 6,000/- for attendance at each meeting of theShareholders’/Investors’ Grievance Committee of Directors, is being paid by the Company. Thesitting fees paid / payable to the non-whole time Directors is excluded whilst calculating theabove limits of remunerations in accordance with Section 198 of the Act.
c) Directors’ Remuneration
The Directors’ remuneration and sitting fees paid / payable in the financial year 2010-11 is givenbelow:
Non-Executive Directors
Commission for the Sitting fees for attendingName of the Directors financial year 2009-2010 Board and Committee Meetings
paid in 2010-2011 for 2010-2011[Rs.] [Rs.]
Mr. F. K. Kavarana 6,50,000 2,06,000
Mr. N.A. Soonawala* 6,00,000 N.A.
Mr. N. N. Tata** N.A. 1,50,000
Mr. B. S. Bhesania*** 6,00,000 1,96,000
Mr. A. D. Cooper 6,00,000 3,10,000
Mr. K. N. Suntook 5,50,000 2,60,000
Mr. Z. S. Dubash**** N.A. 1,70,000
Mr. B. Bhat***** N.A. 20,000
* Retired as a Director with effect from 31st March 2010.
* * Resigned as a Managing Director with effect from 11th August 2010 and appointed as anAdditional Director and Vice-Chairman.
*** Retired as a Director with effect from 18th August 2010.
**** Appointed as an Additional Director with effect from 26th April 2010.
***** Appointed as an Additional Director with effect from 27th September 2010.
Commission for the financial year 2010-2011 to the Non-Executive Directors is payable in2011-2012.
Managing Director
Name Salary Perquisites & Allowances Commission[Rs. Lakhs] [Rs. Lakhs] [Rs. Lakhs]
Mr. N. N. Tata* 32.09 105.54 75.00(for the financial
year 2009-10)
* Resigned as the Managing Director w.e.f. 11th August 2010.

A Enterprise
33
5. Investment Committee
In order to monitor and optimize returns from investments of surplus funds of the Company, the Boardof Directors had constituted an Investment Committee of Directors. The Investment Committeecomprises of 4 Directors viz. Mr. F.K. Kavarana, Mr. N. N. Tata, Mr. K.N. Suntook and Mr. Z.S. Dubash(appointed w.e.f. 28th September, 2010). Mr. F. K. Kavarana is the Chairman of the Committee.
During the year under review, the Committee met twice on 27th October 2010 and 23rd December2010 to review the investments made by the Company and its subsidiaries and to recommend to theBoard any new investments to be made by the Company.
6. Property Committee
The Board of Directors had constituted a Property Committee comprising of 2 Directorsviz. Mr. N. N. Tata and Mr. Z. S. Dubash.
During the year under review, the Committee held one meeting on 13th December 2010.
7. Shareholders’ / Investors’ Grievance Committee
For redressal of Shareholders’ and Investors’ complaints/grievances, the Board had constituted aShareholders’/Investors’ Grievance Committee.
During the year under review, one Shareholders’/Investors’ Grievance Committee meeting was held on12th August 2010.
The composition of the Shareholders’/Investors’ Grievance Committee and the details of Meetingsattended by the Directors are given below:
Name of Members Category No. of Committee Meetingsattended during the
year 2010-2011
Held Attended
Mr. F. K. Kavarana, Chairman Non-Independent Non-Executive 1 1
Mr. B. S. Bhesania* Independent Non-Executive 1 1
Mr. B. Bhat** Non-IndependentNon-Executive 1 N.A.
* Retired as a Director with effect from 18th August 2010.
* * Appointed with effect from 28th September 2010.
The Company Secretary acts as the Secretary of the Shareholders’/Investors’ Grievance Committee.
[a] Name and contact detailsof Compliance Officer : Mr. M. M. Surti,
Company Secretary
Corporate Office : Trent LimitedTrent House, 10th Floor, G- Block, Plot No. C-60,Beside Citi Bank, Bandra Kurla Complex,Bandra (East), Mumbai-400 051Tel: 022-67009000Fax: 022-67008100Email Id for correspondence: [email protected]

Fifty-Ninth Annual Report 2010-2011
34
[b] Details of complaints received from SEBI/Stock Exchanges and redressed during the year 2010-2011:
Opening Received during Resolved during Closing BalanceBalance the year the year
0 39 39 0
[c] No. of pending share transfers / requests for dematerialization of shares as on 31st March 2011 is26 (twenty six), which have subsequently been approved.
8. Subsidiary Companies
Landmark Limited and Trent Hypermarket Limited are the material non-listed Indian subsidiary companiesof the Company. Mr. A. D. Cooper, an Independent Non-Executive Director is on the Board of LandmarkLimited and Trent Hypermarket Limited.
The Audit Committee reviews the financial statements, particularly, the investments made by theCompany’s non-listed subsidiary companies. Attention of the Directors of the Company is drawn to allsignificant transactions and arrangements entered into by the subsidiary companies.
9. General Body Meetings
Location and time, where last three Annual General Meetings were held:
Annual General Date Time VenueMeeting (AGM)
56th AGM 27th August,2008 3.30 p.m. Bombay House Auditorium,Bombay House,24, Homi Mody Street,Mumbai - 400 001
57th AGM 14th August , 2009 3.30 p.m Walchand Hirachand Hall,4th Floor, Indian Merchants’ Chamber (IMC),
58th AGM 18th August, 2010 3.30 p.mIMC Building, IMC Marg, Churchgate,Mumbai- 400 020
All resolutions moved at the last Annual General Meeting were passed by a show of hands by therequisite majority of members attending the meeting.
The following are the special resolutions passed at the Annual General Meeting held in the last threeyears.
AGM Held on Special Resolution Summarypassed
27th August 2008 No N. A.
14th August 2009 Yes Alteration in the Articles of Association of theCompany under Section 31 of the CompaniesAct, 1956.
18th August 2010 Yes Change in place of keeping Registers and Records

A Enterprise
35
10. Disclosures
[a] Transactions with the related parties are disclosed on Page 72 in Note 22 of the Notes on theBalance Sheet and Profit and Loss Account in the Annual Report.
[b] A statement in summary form of transactions with related parties in the ordinary course of businesshas been periodically placed before the Audit Committee.
[c] The Company has no material individual transactions with related parties, which are not in thenormal course of business.
[d] Details of material individual transactions with related parties or others, which are not on arm’slength basis are placed before the Audit Committee together with management’s justification forthe same.
[e] There has been no instance of non-compliance by the Company on any matter related to capitalmarkets, during the last three years. No penalties or strictures have been imposed by SEBI, theStock Exchange or any statutory authority on the Company.
[f ] The Company has fulfilled the following non – mandatory requirements as prescribed in AnnexureI D of Clause 49 of the Listing Agreement with the Stock Exchanges.
(i) The Company has set up a Remuneration Committee, details of which have been given earlierin this Report.
(ii) The Company has adopted a Whistle Blower Policy and has established necessary mechanismin line with Clause 7 of Annexure I D to Listing Agreement with the Stock Exchanges, foremployees to report concerns about unethical behaviours. No person has been denied accessto the Audit Committee.
[g] The Company has followed the Accounting Standards issued by the Institute of CharteredAccountants of India and as prescribed under the Companies Act, 1956.
[h] The Company has laid down a process of assessing risk management. The scope of Audit Committeeincludes review of Company’s financial and risk management policies.
[i] The Company discloses to the Audit Committee the uses / applications of funds raised throughpreferential issue and rights issue, on a quarterly and annual basis as a part of their declaration offinancial results.
11. Means of Communication
The annual, half-yearly and quarterly results are posted by the Company on the Tata websitewww.tata.com and on the Company’s website www.mywestside.com.
These are also submitted quarterly to the Bombay Stock Exchange Limited and the National StockExchange of India Limited, in accordance with the Listing Agreement and published quarterly in leadingnewspapers like the Business Standard, Free Press Journal, Navshakti and Jame-e-Jamshed givingadequate coverage of the financial results.

Fifty-Ninth Annual Report 2010-2011
36
Whenever applicable, the Company also displays official news releases and meets the institutionalinvestors/analysts.
Management Discussion and Analysis Report forms part of the Annual Report.
12. Secretarial Audit for Reconciliation of Capital
A qualified Practicing Company Secretary carried out a secretarial audit to reconcile the total admittedcapital with NSDL and CDSL and the total issued and listed capital. The audit confirms that the totalissued / paid-up capital is in agreement with the aggregate of the total number of shares in physicalform and the total number of shares in dematerialized form (held with NSDL and CDSL).
13. General Shareholder Information
Annual General Meeting:
Date and Time 5th August 2011, at 3.00 p. m.
Venue Walchand Hirachand Hall, 4th Floor, Indian Merchants’ Chamber,IMC Building, IMC Marg, Opposite Churchgate Station,Churchgate, Mumbai – 400 020.
Date of book closure 20th July 2011 to 22nd July 2011(both days inclusive).
Listing on Stock Exchanges The Bombay Stock Exchange Limited and The National StockExchange of India Limited.
As required under Clause 49 of the Listing Agreement, particulars of Directors seeking appointment/re-appointment are appended to the Notice of the Annual General Meeting to be held on 5th August2011.
Financial Calendar : Year ending 31st March
The Company has paid annual listing fees to the Bombay Stock Exchange Limited and to the NationalStock Exchange of India Limited for the financial year 2011-2012.
Stock Code:
Stock Code BSE NSE
EQUITY 500251 TRENT EQ
CCPS A 710051 TRENT Q1
CCPS B 710052 TRENT Q2
NSE - NCDs
TRE15
TRE17

A Enterprise
37
Market Information
Market price data- Monthly high/low of the closing price and trading volumes on BSE/NSE depictingliquidity of the Company’s equity shares on the said exchanges is as under:
BSE NSE
Month No. of No. ofHigh Low Shares High Low Shares[Rs.] [Rs.] Traded [Rs.] [Rs.] Traded
April 2010 832.50 790.25 118210 830.50 792.25 170729
May 2010 826.10 786.60 76139 826.95 788.00 169787
June 2010 908.20 810.35 188708 909.60 810.55 164705
July 2010 1128.85 899.05 802555 1128.24 900.20 1236358
August 2010 1072.60 845.50 2262103 1069.65 845.15 3977486
September 2010 1166.65 1043.35 799868 1167.45 1041.85 1851359
October 2010 1055.80 979.10 392207 1055.50 982.35 774359
November 2010 1042.80 900.50 182641 1039.45 899.85 317112
December 2010 958.60 870.00 335042 963.75 867.35 880877
January 2011 945.55 849.65 155757 947.55 845.50 152963
February 2011 844.75 764.15 243773 841.90 768.00 260564
March 2011 971.65 805.80 394297 942.65 811.90 670533
(Source: The information is compiled from the data available on the BSE & NSE Websites.)
Performance of Share Price of the Company in comparison to the BSE Sensex
450
550
650
750
850
950
1050
1150
1250
Trent Share Price
16000
17000
18000
19000
20000
21000
22000
BSE-Sensex
Ap
r 10
May
10
Jun
10
Jul 1
0
Au
g 1
0
Sep
10
Oct
10
Nov
10
Dec
10
Jan
11
Feb
11
Mar
11
Tre
nt
Sh
are
Pri
ce
BS
E S
en
sex

Fifty-Ninth Annual Report 2010-2011
38
Registrar and Transfer Agents:
Members are requested to correspond with the Company’s Registrar & Transfer Agents- TSR DarashawLimited (formerly Tata Share Registry Limited) quoting their folio no./DPID Client ID no. at the followingaddresses :-
(i) For transfer lodgement, delivery and correspondence:
TSR Darashaw Limited Tel : 022-6656 8484
Unit: TRENT LIMITED Fax: 022- 6656 8494
6-10, Haji Moosa Patrawala Industrial Estate, E-mail : [email protected]
20, Dr. E Moses Road, Near Famous Studio, website : www.tsrdarashaw.com
Mahalaxmi, Mumbai – 400 011.
(ii) For the convenience of investors based in the following cities, transfer documents and letters willalso be accepted at the following branches/agencies of TSR Darashaw Limited (TSRDL):-
1. 503, Barton Centre, 5th Floor, 2. Bungalow No.1, “E” Road,84, Mahatma Gandhi Road, Northern Town, Bistupur,Bangalore - 560 001 Jamshedpur – 831 001Tel : 080-25320321 Tel : 0657-2426616Fax : 080-25580019 Fax: 0657-2426937E-mail : [email protected] E-mail : [email protected]
3. Tata Centre, 1st Floor, 4. Plot No.2/42, Sant Vihar,43, Jawaharlal Nehru Road, Ansari Road, Daryaganj,Kolkata – 700 071 New Delhi – 110 002Tel : 033-22883087 Tel : 011-23271805
Fax : 033-22883062 Fax : 011-23271802
E-mail : [email protected] E-mail : [email protected]
Agent : Shah Consultancy Services Limited,3, Sumathinath Complex, Pritam Nagar,Akhada Road, Ellis Bridge,Ahmedabad - 380 006
Telefax: 079–2657 6038
E-mail: [email protected]
Share Transfer System : Share Transfers in physical form can be lodged with TSR DarashawLimited at the above mentioned address or at its branch offices,addresses of which are available on its website.
The Transfers are normally processed within 15 days from the dateof receipt, if the documents are complete in all respects. TheDirectors of the Company or the Company Secretary are severallyempowered to approve transfers.

A Enterprise
39
Distribution of Shareholding as on 31st March 2011:
Sr. Range (Value) Holding Amount (Rs.) % to No. of % to totalNo. Capital Holders Holders
1 1 to 500 29,24,748 2,92,47,480 14.58 32,485 93.96
2 501 to 1000 10,53,771 1,05,37,710 5.25 1,571 4.54
3 1001 to 2000 4,22,149 42,21,490 2.11 305 0.88
4 2001 to 3000 1,65,706 16,57,060 0.83 66 0.19
5 3001 to 4000 1,01,049 10,10,490 0.50 28 0.08
6 4001 to 5000 56,731 5,67,310 0.28 12 0.04
7 5001 to 10000 2,02,208 20,22,080 1.01 27 0.08
8 Greater than 10000 1,51,30,515 15,13,05,150 75.44 79 0.23
TOTAL 2,00,56,877 20,05,68,770 100.00 34,573 100.00
Categories of Shareholders:
As on As on % VarianceCategory 31st March 2011 31st March 2010 11 v/s 10
Number of % to Number of % toEquity Shares Paid-up Equity Shares Paid-up
Held Capital Held Capital
Promoters 62,81,192 31.32 62,81,192 31.35 (0.03)
Mutual Funds andUnit Trust of India 38,63,373 19.26 39,53,362 19.73 (0.47)
Government Companies,Financial Institutions,Banks and InsuranceCompanies 5,62,835 2.81 44,153 0.22 2.59
Foreign InstitutionalInvestors 17,08,661 8.52 20,03,627 10.00 (1.48)
Bodies Corporate 21,58,492 10.76 16,80,870 8.39 2.37
Others 54,82,324 27.33 60,71,848 30.31 (2.98)
TOTAL 2,00,56,877 100.00 2,00,35,052 100.00
Dematerialization of shares:
The Company’s shares are compulsorily traded in dematerialized form and are available for trading onboth the Depositories in India viz., National Securities Depository Limited (NSDL) and Central DepositoryServices (India) Limited (CDSL). Equity shares representing 95.11% (Previous Year 94.60%) of theCompany’s Share Capital are dematerialized as on 31st March 2011.
The Company’s shares are regularly traded on the Bombay Stock Exchange Limited (BSE) and TheNational Stock Exchange of India Limited (NSE), in the electronic form.

Fifty-Ninth Annual Report 2010-2011
40
Action required regarding non-receipt of dividends and interest on Non-ConvertibleDebentures (NCDs):
In case of non-receipt / non-encashment of dividend warrants or interest warrants, the investors arerequested to correspond with the Company’s Registrars / the Registrar of Companies, as mentionedhereunder:
2003-04 to 2009-10 TSR Darashaw Limited Letter on plain paper.
1995-96 to 2002-03 TSR Darashaw Limited Already transferred to IEPF.
Upto 1994-95 Office of the Registrar of Claim in Form No. II of theCompanies, CGO Complex, Companies Unpaid Dividend"A" Wing, 2nd Floor, (Transfer to General RevenueNext to RBI, CBD - Belapur, Account of the CentralNew Mumbai - 400 614, Government) Rules, 1978.MaharashtraTel.: 022-2757 6802
Given below are indicative due dates for transfer of unclaimed and unpaid equity dividend to theInvestor Education and Protection Fund (IEPF) by the Company:
Financial Year Date of Declaration of Dividend Last date for claim by shareholders
2003-04 03rd September 2004 02nd September 2011
2004-05 (Interim) 27th April 2005 26th April 2012
2005-06 08th September 2006 07th September 2013
2006-07(Interim) 07th May 2007 06th May 2014
2007-08 27th August 2008 26th August 2015
2008-2009 14th August 2009 13th August 2016
2009-2010 18th August 2010 17th August 2017
No claim of the shareholders / debenture-holders shall lie against the Company or the IEPF in respectof the said amounts transferred to the IEPF. Investors who have not yet encashed their unclaimed /unpaid amounts are requested to do so at the earliest.
Other facilities of interest to shareholders holding share in physical form:
- Nomination facility: Shareholders who hold shares in single name and wish to make / change thenomination in respect of their shares as permitted under Section 109A of the Act, may submit tothe Registrar and Transfer Agents, the prescribed Form 2B.
- Bank Details: Shareholders holding Shares in Physical form are requested to notify / send thefollowing to the Company's Registrar and Transfer Agents to facilitate better services :-
(i) Any change in their address / mandate / bank details, and
(ii) Particulars of the bank account in which they wish their dividend to be credited, in case theyhave not been furnished earlier.
Shareholders are advised that respective bank details and address as furnished by them to the Companywill be printed on their dividend warrants as a measure of protection against fraudulent encashment.
In case of Shareholders holding shares in demat mode, shareholders are requested to inform theirDepository Participant about changes in their address/mandate/bank details.

A Enterprise
41
Store Locations:WESTSIDE:1. 77, Commercial Street, Near Police Station, Shivaji Nagar, Bangalore 560001; Tel: 080- 25550861/9342. Khan Lateef Khan Estate, Municipal No.5-8-62, Fateh Maidan Road, Hyderabad 500001; Tel: 040-66666000/013. G-50, Spencer Plaza, Phase II, 769, Anna Salai, Chennai 600002; Tel:044-28490573 to 28490577/284950324. 39, Hughes Road, Mumbai 400007; Tel: 022-238417295. SGS Magnum Mall, 231, Moledina Road, Pune 411001; Tel: 020-66202505/66. 15A, 34/35 Ajmal Khan Road, Karol Bagh, New Delhi 110008; Tel: 011-25729760/ 617. Block D, 22 Camac Street, Kolkata 700017; Tel: 033-22817312/138. A-15 , Alankar Cinema Building, Feroze Gandhi Marg, Lajpat Nagar, New Delhi 110024; Tel:011-29832158/599. 5&6 Landmark, Ramdas Peth, Wardha Road, Nagpur 440012; Tel: 0712-2423634/4010. Army & Navy Bldg, Ground Floor, Kala Ghoda, 148 Mahatma Gandhi Road, Mumbai 400001;
Tel: 022-66360499/6636050011. Abhijeet - V, Opp Mayor's Bungalow, Near Law Garden, Mithakhali, Ellis Bridge, Ahmedabad 380006;
Tel: 079-66610190/9712. Centrestage Mall, L-1, Sector - 18, Noida 201301; Tel: 0120-251776113. R Mall, Ground Floor, L.B.S. Marg, Mulund (W), Mumbai 400080; Tel: 022-67554281/8514. The Forum, 21 Hosur Road, Koramangla, Bangalore 560029; Tel: 080-6667012115. 17, Racecourse Road, Indore 452003; Tel: 0731-2434646/4816. Infiniti, Raheja Classic Complex, Oshiwara Andheri Link Road, Andheri (W), Mumbai 400058; Tel: 022-67021345/5117. Garuda Mall, CTS 15 Magrath Road, Opp Karnataka Police Hockey Ground, Bangalore 560025;
Tel: 080-66641230 to 6664123618. Monalisa Centrum, Off. Race Course Road, Next to INOX Multiplex, Vadodara 390007; Tel:0265-662310119. The Gariahat Mall, 13, Jamir Lane, Near Ballygunge Railway Station, Kolkata 700019; Tel: 033-24613505/0820. Pacific Mall, Plot No 1, Site IV, Sahiabad Indl Area, Sahiabad 201 010; Dist: Ghaziabad (U.P.); Tel: 0120-2778511/1721. TDI Mall, Plot No. 11, Shivaji Place, District Centre, Rajouri Garden Market, New Delhi 110027;
Tel: 011- 25110820 to 25110821 and 25110823 to 2511082622. LG - 6, DLF Grand Mall, Mehrauli Gurgaon Road, Gurgaon 122 002; Tel:0124- 2566250/5523. Citi Pulse Mall, Plot No. 21, Narain Singh Circle, Jaipur 302005; Tel: 0141-2574433/257481824. East End Mall, Wave Cinema, TC-54, Vibhuti Khand, Gomati Nagar, Lucknow 226010, U.P.;
Tel: 0522-2720990 to 2720991/ 9325. Iscon Mall, Dummas Road, Opp. Rajhans Theatre, Surat 395007; Tel: 0261-2252201/ 0726. Iscon Mega Mall, Sarkhej Gandhi Nagar Highway, Near Rajpath Club, Ahmedabad, Tel: 079-66058292/9327. Westend Mall, Plot No. 2 & 3, Opp. Forest Department Office, Near Puda Office, Ferozpur Road, Ludhiana,
Punjab; Tel: 0161-2551462/6328. Iscon Mega Mall, Village Nana Mava, Revenue Survey No.30, Paiki, T.P. Scheme No.3, O.P. No.1, Final Plot No.1,
Rajkot City, Tel: 0281-2332818 to 233282329. Mani Square Mall, Maniktala Main Road, (E.M. Bypass) Near Apollo Hospital, Kolkata 700054; Tel: 033-23201950/5130. Kakade Onecentre, S. No. 132/A-2-1, CTS No 2687B Shivaji Nagar University Road, Pune 411005;
Tel: 020-25514262/6600991531. Garuda Swagat Mall, Plot No. 78 & 79, 38 Cross Byrasandra, Jayanagar, Bangalore; Tel: 080-26647181/8532. Inorbit Mall, Sector 30 - A, Vashi, Navi Mumbai 400705; Tel: 022-27815571/7633. Ambience Mall, Ambience Island, G 26, F-114, S 205, NH - 8, Delhi-Jaipur Highway, Gurgaon 122022;
Tel: 0124-4665470 to 466547234. Haiko Mall, Level One, Central Avenue, Hiranandani Garden, Powai, Mumbai 400076; Tel: 022-67424560/63/6535. EF3 Mall, Plot No. 12, Sector 20 - A, Mathura Road, Faridabad 121001; Tel:0129-2222683/8436. City Centre Mall, Plot No. 117-133, Opp. Trimbak Road, Lawate Nagar, Untwadi Road, Nasik, Tel: 0253-2570029/3437. KMC Retail Mall, Plot No. 6-3-1112, Begumpet, Near Kirtilal Jewellers, Somajiguda Circle, Hyderabad 500082;
Tel: 040-23400421/42238. Korum Mall, Upper Ground Floor, Cadbury Compound, Mangal Pandey Road, Thane (W) 400606;
Tel: 022-2541740239. Magneto Mall, G.E. Road, N.H.-6, Labhandi, Raipur (Chattisgarh) 492001; Tel: 0771-2259111/11240. Ampa Skywalk, Junction of Nelson Manickam Road, Poonamallee High Road,Aminjikarai, Chennai 600029;
Tel: 044-23746973

Fifty-Ninth Annual Report 2010-2011
42
41. City Centre, K.S Rao Road, Hampankatta, Mangalore 575001; Tel:0824-244901642. 16/113, M. G. Road, Corner Plot of Bada Chauraha, Kanpur 208001, U.P.; Tel: 0512- 6543202 to 654320543. 28A, Industrial & Business Park, Next to HDFC Bank, Industrial Area, Phase-I, Chandigarh;
Tel: 0172-2650386 / 87; Fax:0172-265038944. Express Avenue Mall, Express Estate, No.2 Club Road, Anna Salai, Chennai 600 002; Tel: 044-28464171/7245. Innovation Mall, Gopalan Enterprises No.22, Bannergatta Road, J.P. Nagar, 3rd Phase, Bangalore 560 078;
Tel: 080-26586744 / 11 / 22/ 3346. Ambience Mall, Upper Ground, 1st & 2nd Floor, Vasant Kunj, New Delhi 110 070; Tel: 011-40870525/2947. Prozone Mall, Plot No.80, Chikalthana Industrial Area, Masanatpur, Dist. Aurangabad 431 210; Tel: 240-6618912/1348. Brooke fields Mall, 67-71, Krishnaswamy Road, Coimbatore 641 001; Tel:0422-2255224/2649. DB City Mall, Khasra 1511 & 1509 Arera Hills, Opp. MP Nagar, Bhopal 462 011; Tel: 0755-6644081/8250. Infiniti Mall, Unit No.001/101, Rajan Pada, Ijjimma Service Road, Linking Road, Malad ( West),
Mumbai 400 064; Tel: 022-6725553651. No. 508, Vishwamanava Double Road, Kuvempunagar, Mysore, Karnataka 570023; Tel: 0821-2340150/5152. Shop No.3, Indira Theatres, Canal Road, Jammu 180001; Mobile:9419143716/941918507453. Civic Centre, Samdariya Mall, JDA Scheme No.18, Subhadra Kumarai Chouhan Ward, Jabalpur 482 002;
Tel: 0761-406983054. Silver Square, Christian Basti, G. S. Road, Guwahati 781 005; Tel: 0361-2343940/4155. # 11, Eureka Colony, Opp. SBI Zonal Office, Kusugal Road, Keshwapur, Hubli 580 023 Tel:0836-226666256. Caculo Mall, Situated at Caculo Enclave, Opposite Goa Fire Service Head Quarter Near Caculo Ford Showroom,
St. Inez, Panaji 403001; Tel.: 800777957157. Ground Floor, D-57/ 3-123, Siddhigirbaug Road, Sigra, Varanasi 221010SISLEY:1. Shop No.14, Ground Floor, GVK One Mall, Road No.1, Banjara Hills, Hyderabad 500034; Tel: 040-44767750/512. Shop No.10, Ground Floor, Ambience Mall, Ambience Island, Delhi Jaipur Highway, N. H., Gurgaon 122022;
Tel: 0124-24665530/313. Shop No. G-07, Inorbit Mall, Malad (W), Mumbai 400064; Tel:022-28767679/652405704. The Forum Value Mall, Shop No.123, 1st Floor, No.62, Whitefield Main Road, Bangalore 560 0665. Unit No. F-3, Palladium Phoenix Mills Compound, 462, Senapati Bapat Marg, Lower Parel, Mumbai 400013;
Tel: 022-67493001/026. F 9, First Floor, Forum Courtyard Mall, 10/3, Lalajpatrai Sarani, Kolkata 600 020; Tel: 033-64523705 / 645011587. UG-02, Upper Ground Floor, Ambience Mall, Vasant Kunj, New Delhi 110 070; Tel: 011-40870511 / 5128. Express Avenue Mall, Opposite Melody Theatre Royapethha, Chennai 600 002 Tel: 044-28464137/389. Jallandhar Kapsons, Kapsons Fashion Private Limited, 194R, Model Town, Jalandhar 144001;
Mobile: 987746734810. Chandigarh Kapsons, Kapsons Fashion Private Limited, SCO-104-105, Sector-17C, Chandigarh;
Tel: 0172-5000706/500070911. Amritsar Kapsons, Kapsons Fashion Private Limited, 48, The Mall, Amritsar 143001; Mobile: 981580535312. Ludhiana Kapsons, AGF 1-4, Ansal Plaza, Firozpur Road, Ludhiana, Punjab 14100113 M-62, Greater Kailash 1, New Delhi 110 048; Tel: 0782029199114. G&B Fashions Private Limited; FF 32, Pacific Mall Khayala, Community Center, Najafgarh Road,
New Delhi 110 018; Tel: 011-4513680115. G&B Fashions Private Limited; A1, Hamilton House, Connaught Place, New Delhi 110 001
STAR BAZAAR:1. Iscon Mall, Near. Jodhpur Char Rasta, Opp. Bidiwala Park, Satellite Road, Ahmedabad 380015; Tel: 92272588802. Thakur Mall & Multiplex, Western Express Highway, Near Dahisar Check Naka, Mira - Bhayandar (E),
Thane 401107; Tel: 72080107083. HM Vibha Towers, Municipal No. 66/5-25, Luskar Hosur Road, Ward No. 63, Koramangala, Bangalore 560029;
Tel: 99016527764. Ampa Mall, Lower Ground Floor, Ampa Skywalk No.1, Junction of No.1, Nelson Manikam Road, 627 Poonamelle
High Road, Aminjkarai, Chennai 600 0295. Crystal Point Mall, New Link Road. Near Oil Junction, Andheri (W), Mumbai 400058 Tel: 72080107056. Thane Korum Mall, Korum Mall, Pokhran Road, No.1, Off. Eastern Express Highway, Cadbury Junction, Thane
(W), Thane 400606; Mobile:7208010709 / 9930094099

A Enterprise
43
7. 18/2, Gopalan, The Arch Mall, Mysore Road, Raja Rajeshwari Nagar, Bangalore 560098; Tel: 99459531808. Golden Heights, 1/2 , 59th Cross Road, 4th 'M' Block, Rajaji Nagar, Bangalore 560 010; Tel: 94496124849. Imperial Mall - I, Surat Dummas Road, Opposite Govardhan Haveli Temple, Surat, Adajan 395 009
Tel:966203977310. C/o. Ideal Wood Working & Engineering Co. Limited, MIDC, D-III Block, Plot No.91 Opp. Greaves Limited,
Mumbai Pune Road, Chinchwad, Pune 411 019; Tel: 720901071111. Prozone Mall, Golden Dreams, Plot No.80, MIDC, Chikalthana Industrial Area, Masanatpur
Dist. Aurangabad 431 210; Tel: 9689911585FASHION YATRA:1. Metro Junction Mall, Shop No. G B1, Upper Ground Floor, Sheel Phata Road, Netavali Village, Patripool,
Kalyan-East, Kalyan 421306; Tel :0251-2351540 to 2351543;2. 22-28, Treasure Bazaar, 1st Floor, Nanded-Latur Road, Vasami, Nanded 431606; Tel: 02462-229254 to 2292573. S.F.C.Megaa Mall, Station chouk, M.G.Road, Sangli 416416; Tel: 0233-26215324. F 17, 1st Floor, Treasure Bazar, D-9, Dhanwantri Chikitsha Yogna Kendra, Ujjain 456010 Tel: 0734-4061960
4061828LANDMARK:1. Prestige Forum, 21, Hosur Road, Koramangla, Bangalore 560029; Tel: 080-65771200 to 657712112. Apex Plaza, 3, Nungambakkam High Road, Chennai 600034; Tel: 044-64523150 to 645231653. 769, Spencer Plaza, Anna Salai, Chennai 600002; Tel: 044-64523166 to 645231814. Citi Centre, No. 10 & 11, Dr. Radhakrishnan Salai, Chennai 600004; Tel: 044-64523500 to 645235155. Ampa Skywalk, 3rd Floor, No.1, Nelson Manickam Road, Poonamalle High Road, Aminjikarai, Chennai 600 029;
Tel:044-434380806. Garuda Swagath Mall, Tilak Nagar Main Road, 4th T Block, Jayanagar, Bangalore 560 041; Tel:080-65771227/
657712437. KWC Retail Mall, Somajiguda, Begumpet, Hyderabad 500 082; Tel:040-405050008. #8-2-682/1, Road No.12, Banjara Hills, Hyderabad 500034;Tel: 040-64631566 to 646315829. Palladium, Phoenix Mills Compound, 462 Senapati Bapat Marg, Lower Parel, Mumbai 400013;
Tel: 022-64575316 to 6457533110. 619, B5 & 652 C, Infinity Mall, Oshiwara Link Road, Lokhandwala, Andheri (West), Mumbai 400 058;
Tel:2639601011. Unit F-41 & 42, Inorbit Mall, 1st Floor, Plot No.39/1, Sector 30A, Vashi, Navi Mumbai 400 705; Tel:022-6456436012. Iscon Mega Mall, Sarbhaj Gandhinagar Highway, Near Rajpath Club, Ahmedabad 380015; Tel:079-4002750013. Monalisa Centrum, Near INOX Multiplex, Race CourseCircle, Vadodara 390007; Tel:0265-664777714. Westend Mall, TC-54, Vibhutikhand, Gomati Nagar, Lucknow 226010; Tel: 0522-402555515. Grand Mall, DLF Services Limited, LG 17/18, DLF Grand Mall, Mehrouli Gurgaon Road, Gurgaon 122002;
Tel: 0124-420100016. Shop No.1, SGS Mall, 231, Moledina Road, Pune Camp, Pune 411001; Tel: 020- 4006888817. 3rd Floor, Ambience Mall, Nelson Mandela Road, Vasnat Kunj, Delhi 110070; Tel: 011-6464171918. C/o. The Residency Towers, Sir Thygaraya Road, T. Nagar, Chennai 600017; Tel: 044-6452311019. C/o. Gateway Hotel TAJ, T66, Residency Road, Bangalore 560025; Tel:080-6663520120. Taj Residency, Vipin Khand, Gomti Nagar, Lucknow 226010; Tel:0522-239213321. C/o. Ginger Hotel Old Venus Theatre, Karuvadikuppam Main Road, Pondicherry 605003;
Tel: 0413-2234246/645014122. Goa Taj Vivanta, D. B. Bandodkar Road, S. T. Inez Junction, Panaji-Goa 403001; Tel: 0832-242805823. Departure Book Shop, GMR Hyderabad International Airport Limited., Shamshabad, Ranga Reddy District,
Andhra Pradesh 501218; Tel:040-6660372224. Check-in-Domestic Departure, GMR Hyderabad International Airport Limited, Shamshabad, Ranga Reddy
District, Andhra Pradesh 50121825. 1-B Terminal, Domestic Departure, Chhatrapati Shivaji International Airport, Mumbai 400099;
Tel: 022-6685940026. Chennai One IT Park, Shop No.6 & 9, Non Processing Zone, Chennai One, Thuripakka, Chennai 600096;
Tel: 044-64523109Address for correspondence : Trent Limited
Trent House, 10th Floor, G- Block, Plot No. C-60,Beside Citi Bank, Bandra Kurla Complex,Bandra (East), Mumbai-400 051Tel: 022-67009000, Fax: 022-67008100Email Id: [email protected]

Fifty-Ninth Annual Report 2010-2011
44
CERTIFICATE
To The Members of
Trent Limited
We have examined the compliance of the conditions of Corporate Governance by Trent Limited, for theyear ended 31st March 2011, as stipulated in Clause 49 of the Listing Agreement of the said Company withthe Stock Exchanges.
The compliance of conditions of Corporate Governance is the responsibility of the Management. Ourexamination has been limited to a review of the procedures and implementations thereof, adopted by theCompany for ensuring compliance with the conditions of Corporate Governance as stipulated in the saidclause. It is neither an audit nor an expression of opinion on the financial statements of the Company.
In our opinion and to the best of our information and according to the explanations given to us and therepresentations made by the Directors and the Management, we certify that the Company has compliedwith the conditions of Corporate Governance as stipulated in Clause 49 of the above-mentioned ListingAgreement.
As required by the Guidance Note issued by the Institute of Chartered Accountants of India, we have tostate that based on the report issued by the Registrars of the Company to the Investors’ Grievance Committee,as on 31st March 2011 there were no investor grievance matters against the Company remaining unattended/ pending for more than 30 days.
We further state that such compliance is neither an assurance as to the future viability of the Company norof the efficiency or effectiveness with which the management has conducted the affairs of the Company.
For N. M. RAIJI & Co.Chartered Accountants
Y. N. THAKKARPartner
Mumbai, 25th May 2011 Membership No. 33329
DECLARATION BY THE CEO UNDER CLAUSE 49 OF THE LISTING AGREEMENT REGARDINGADHERENCE TO THE CODE OF CONDUCT
In accordance with Clause 49 sub-clause I(D), of the Listing Agreement with the Stock Exchanges, I herebyconfirm that all the Directors and the Senior Management personnel of the Company have affirmedcompliance to their respective Codes of Conduct, as applicable to them for the Financial Year ended31st March 2011.
For Trent Limited
Philip N. AuldChief Executive Officer
Mumbai, 25th May 2011

A Enterprise
45
AUDITORS’ REPORTTO THE MEMBERS OF TRENT LIMITED
1. We have audited the attached Balance Sheet of TRENT LIMITED, as at 31st March 2011, the Profit andLoss Account and also the Cash Flow Statement for the year ended on that date annexed thereto.These financial statements are the responsibility of the Company’s management. Our responsibility isto express an opinion on these financial statements based on our audit.
2. We conducted our audit in accordance with the auditing standards generally accepted in India. ThoseStandards require that we plan and perform the audit to obtain reasonable assurance about whetherthe financial statements are free of material misstatement. An audit includes examining, on a test basis,evidence supporting the amounts and disclosures in the financial statements. An audit also includesassessing the accounting principles used and significant estimates made by management, as well asevaluating the overall financial statement presentation. We believe that our audit provides a reasonablebasis for our opinion.
3. As required by the Companies (Auditor’s Report) Order, 2003 issued by the Central Government ofIndia in terms of sub-section (4A) of section 227 of the Companies Act, 1956, we enclose in theAnnexure a statement on the matters specified in paragraphs 4 and 5 of the said Order, to the extentapplicable.
4. Further to our comments in the Annexure referred to above, we report that:
(i) we have obtained all the information and explanations, which to the best of our knowledge andbelief were necessary for the purposes of our audit;
(ii) in our opinion, proper books of account as required by law have been kept by the Company so faras appears from our examination of those books;
(iii) the Balance Sheet, Profit and Loss Account and Cash Flow Statement dealt with by this report arein agreement with the books of account;
(iv) in our opinion, the Balance Sheet, Profit and Loss Account and Cash Flow Statement dealt with bythis report comply with the accounting standards referred to in sub-section (3C) of section 211 ofthe Companies Act, 1956, to the extent applicable;
(v) on the basis of written representations received from the directors, as on 31st March 2011, andtaken on record by the Board of Directors, we report that none of the directors is disqualified as on31st March 2011 from being appointed as a director in terms of clause (g) of sub-section (1) ofsection 274 of the Companies Act, 1956;
(vi) in our opinion and to the best of our information and according to the explanations given to us, thesaid accounts read together with notes thereon, give the information required by the CompaniesAct, 1956, in the manner so required and give a true and fair view in conformity with the accountingprinciples generally accepted in India:
(a) in the case of the Balance Sheet, of the state of affairs of the Company as at 31st March 2011;
(b) in the case of the Profit and Loss Account, of the profit for the year ended on that date; and
(c) in the case of the Cash Flow Statement, of the cash flows for the year ended on that date.
For N. M. RAIJI & CO.,Chartered Accountants(Registration No. 108296W)
Y.N. THAKKARPartnerMembership No. 33329
Mumbai, 25th May 2011

Fifty-Ninth Annual Report 2010-2011
46
ANNEXURE TO THE AUDITORS’ REPORT(Referred to in paragraph 3 of our report of even date)(i) (a) The Company has maintained proper records showing full particulars, including quantitative
details and situation of fixed assets.(b) As explained to us, physical verification of major items of fixed assets was conducted by the
management during the year. In our opinion, the frequency of physical verification is reasonablehaving regard to the size and operations of the Company and the nature of its assets. On thebasis of explanations received, in our opinion, the discrepancies found on physical verificationwere not significant.
(c) The Company has not disposed off substantial part of fixed assets during the year.(ii) (a) The inventories have been physically verified by the management at reasonable intervals during
the year.(b) In our opinion, the procedures of physical verification of inventories followed by the management
are reasonable and adequate in relation to the size of the Company and the nature of itsbusiness.
(c) In our opinion and according to the information and explanations given to us, the Company ismaintaining proper records of inventory. The discrepancies noticed on physical verification werenot material in relation to the operations of the Company and the same have been properlydealt with in the books of account.
(iii) (a) The Company has not granted any loans, secured or unsecured, during the year to companies,firms or other parties covered in the register maintained under section 301 of the CompaniesAct, 1956. Accordingly, sub-clause (b), (c) and (d) of paragraph 4 (iii) of the Order are notapplicable.
(b) The Company has not taken any loans, secured or unsecured, during the year from companies,firms or other parties covered in the register maintained under section 301 of the CompaniesAct, 1956. Accordingly, sub-clause (f ) and (g) of paragraph 4 (iii) of the Order are not applicable.
(iv) In our opinion and according to the information and explanations given to us, there is an adequateinternal control system commensurate with the size of the Company and the nature of its businessfor the purchase of inventory and fixed assets and for the sale of goods and services. During thecourse of our audit, we have not observed any major weaknesses in internal control system.
(v) Based on the audit procedures applied by us and according to the information and explanations givento us, there are no transactions that need to entered into the register in pursuance of section 301 ofthe Companies Act, 1956.
(vi) In our opinion and according to the information and explanations given to us, the Company has notaccepted any deposits from the public during the year. In respect of unclaimed deposits matured inearlier years that are outstanding during the year, the Company has complied with the provisions ofsections 58A, 58AA or any other relevant provisions of the Companies Act, 1956 and the Companies(Acceptance of Deposits) Rules, 1975. As informed to us, no order has been passed by Company LawBoard or National Company Law Tribunal or Reserve Bank of India or any Court or any other tribunal.
(vii) In our opinion, the Company has an internal audit system commensurate with its size and nature ofits business.
(viii) According to the information and explanations given to us, the Central Government has not prescribedthe maintenance of cost records under section 209(1)(d) of the Companies Act, 1956 for the productsof the Company.
(ix) (a) According to the records of the Company, the Company is generally regular in depositing withthe appropriate authorities undisputed statutory dues including Provident Fund, InvestorEducation and Protection Fund, Employees’ State Insurance, Income-tax, Sales-tax, Wealth-tax,Service Tax, Custom Duty, Excise Duty, cess and any other statutory dues applicable to it. Basedon our audit procedures and according to the information and explanations given to us, thereare no arrears of undisputed statutory dues which remained outstanding as at 31st March 2011for a period of more than six months from the date they became payable.
(b) According to the records made available to us and the information and explanations given bythe management, the details of the dues of sales tax / income tax / custom duty / wealth tax/

A Enterprise
47
Service Tax / excise duty / cess, which have not been deposited on account of any dispute, aregiven below :
Particulars Financial year to which the Forum where the dispute Amountmatter pertains is pending (Rs. In lakhs)
Income Tax 2005-06, 2007-08, Commissioner (Appeals) 529.842008-09 – TDS Circle
Sales Tax 1994-95, 1995-96, Deputy Commissioner 63.59 2006-07, 2008-09 (Appeals)
Luxury Tax 2002-03 Deputy Commissioner 0.86(Appeals)
(x) The Company does not have any accumulated losses at the end of the financial year and has notincurred cash losses during the financial year covered by our audit and the immediately precedingfinancial year.
(xi) The Company has not defaulted in repayment of any dues to financial institutions, banks or debentureholders during the year.
(xii) Based on our examination of the records and according to the information and explanations given tous, the Company has not granted loans and advances on the basis of security by way of pledge ofshares, debentures and other securities.
(xiii) The Company is not a chit / nidhi / mutual benefit fund / society.(xiv) Based on our examination of the records and evaluation of the related internal controls, we are of the
opinion that in respect of the investment activity of the Company, proper records have been maintainedof the transactions and contracts and timely entries have been made in those records. All theinvestments of the Company are held in its own name except as permissible under section 49 of theCompanies Act, 1956.
(xv) On the basis of the information and explanations given to us, the Company has given guarantee forvarious facilities availed by its wholly owned subsidiary from bank. The terms and conditions of theguarantee are not prejudicial to the interest of the Company.
(xvi) The Company has not obtained any term loans.(xvii) According to the information and explanations given to us and on an overall examination of the
Balance Sheet of the Company, we report that no funds raised on short-term basis have been used forlong-term investment.
(xviii) As per the information and explanations given to us, the Company has not made during the year anypreferential allotment of shares to parties and companies covered in the register maintained undersection 301 of the Companies Act, 1956.
(xix) As per the information and explanations given to us, the Company has created security or charge inrespect of debentures issued.
(xx) We have verified that the end use of the money raised by public issues is as disclosed in the notes tothe financial statements.
(xxi) During the course of our examination of the books and records of the Company, carried out inaccordance with the generally accepted auditing practices in India and according to the informationand explanations given to us, we have neither come across any instance of material fraud on or bythe Company, noticed or reported during the year, nor have we been informed of such case by themanagement.
For N. M. RAIJI & CO.,Chartered Accountants(Registration No. 108296W)
Y.N. THAKKARPartnerMembership No. 33329
Mumbai, 25th May 2011

Fifty-Ninth Annual Report 2010-2011
48
Balance Sheet as at 31st March 2011As at
31.03.2010Rupees Rupees Rupees
Schedule Page in lakhs in lakhs in lakhsSOURCES OF FUNDS :
1. SHAREHOLDERS’ FUNDS :(a) Capital A 53 3,595.97 2,703.51(b) Reserves and Surplus B 54 1,04,599.39 61,347.00
1,08,195.36 64,050.512. LOAN FUNDS : C 55
(a) Secured Loans 10,000.00 11,550.24(b) Unsecured Loans 17,500.00 13,501.82
27,500.00 25,052.063. Deferred Tax Liability (Net) - 191.82
4. TOTAL FUNDS EMPLOYED 1,35,695.36 89,294.39
APPLICATION OF FUNDS :5. FIXED ASSETS : D 56
(a) Gross Block 33,018.79 26,013.65(b) Less : Depreciation 6,627.06 5,359.42
(c) Net Block 26,391.73 20,654.23(d) Capital Work-in-Progress 2,783.03 1,690.29
29,174.76 22,344.526. INVESTMENTS E 57 to 59 42,496.87 39,517.597. DEFERRED TAX ASSET (NET) 2,056.32 -8. CURRENT ASSETS, LOANS
AND ADVANCES :(a) Inventories F 60 13,057.32 9,648.33(b) Sundry Debtors G 60 666.18 308.62(c) Cash and Bank Balances H 60 30,034.16 911.69(d) Loans and Advances J 62 46,214.00 34,235.39
89,971.66 45,104.039. Less: CURRENT LIABILITIES
AND PROVISIONS :(a) Liabilities K 63 14,127.56 11,672.61(b) Provisions L 63 13,876.69 5,999.14
28,004.25 17,671.75
10. NET CURRENT ASSETS 61,967.41 27,432.28
11. TOTAL ASSETS (NET) 1,35,695.36 89,294.39
(For Schedule ‘M’ and notes see Pages 64 to 77)As per our report attached. For and on behalf of the Board,
For N. M. RAIJI & CO., F. K. KAVARANA ChairmanChartered Accountants
N. N. TATA Vice Chairman
A. D. COOPERZUBIN DUBASH Directors
Y. N. THAKKAR M. M. SURTI BHASKAR BHATPartner Company Secretary
Mumbai, 25th May 2011
}

A Enterprise
49
Profit And Loss Account for the year ended 31st March 2011Previous
YearSchedule Page Rupees Rupees Rupees
in lakhs in lakhs in lakhsINCOME :1. INCOME FROM OPERATIONS 2 51 71,671.21 58,748.102. OTHER INCOME 3 51 5,142.93 2,251.73
3. TOTAL INCOME 76,814.14 60,999.83EXPENDITURE :4. OPERATING AND OTHER EXPENSES 1 50 68,349.28 55,362.515. DEPRECIATION 1,362.65 1,185.09
69,711.93 56,547.606. INTEREST 4 52 784.29 604.82
7. TOTAL EXPENDITURE 70,496.22 57,152.42PROFIT BEFORE TAXES ANDEXCEPTIONAL ITEM 6,317.92 3,847.418. EXCEPTIONAL INCOME/(EXPENSES) 5 52 (284.00) 1,137.59PROFIT BEFORE TAXES 6,033.92 4,985.009. PROVISION FOR TAXATION
CURRENT TAX 1,223.73 814.69(EXCESS)/SHORT TAX PROVISION FOR PRIOR YEARS (NET) 7.59 (94.04)MAT CREDIT ENTITLEMENT (808.24) (302.95)DEFERRED TAX 1,307.13 545.27
1,730.21 962.97
PROFIT FOR THE YEAR AFTER TAXES 4,303.71 4,022.0310. BALANCE BROUGHT FORWARD FROM PREVIOUS YEAR 3,726.79 2,053.6711. BALANCE TRANSFERRED ON AMALGAMATION
(refer note 26 ,Page 76) - 72.67
PROFIT AVAILABLE FOR APPROPRIATION 8,030.50 6,148.37
12. APPROPRIATIONS :(i) GENERAL RESERVE 500.00 403.00(ii) DEBENTURE REDEMPTION RESERVE 500.00 500.00(iii) DIVIDEND PAID -EQUITY SHARES 1.42 -(iv) PROPOSED DIVIDEND -EQUITY SHARES 1,504.27 1,302.28(v) PROPOSED DIVIDEND -PREFERENCE SHARES 1.23 0.01(vi) TAX ON DIVIDEND 244.46 216.29(vii) BALANCE CARRIED TO BALANCE SHEET 5,279.12 3,726.79
8,030.50 6,148.37
13. Earnings Per Share (Rs.) (Note 24, Page 76 )Basic 21.46 20.53Diluted 19.60 20.41(For Schedule ‘M’ and notes see Pages 64 to 77)
As per our report attached. For and on behalf of the Board,
For N. M. RAIJI & CO., F. K. KAVARANA ChairmanChartered Accountants
N. N. TATA Vice Chairman
A. D. COOPERZUBIN DUBASH Directors
Y. N. THAKKAR M. M. SURTI BHASKAR BHATPartner Company Secretary
Mumbai, 25th May 2011
}

Fifty-Ninth Annual Report 2010-2011
50
Schedule forming part of the Profit and Loss Account
Schedule ‘1’ (Item No. 4, page 49)OPERATING AND OTHER EXPENSES
PreviousYear
Rupees Rupees Rupeesin lakhs in lakhs in lakhs
(1) RAW MATERIALS CONSUMED 217.96 177.26
(2) PURCHASE OF FINISHED PRODUCTS 36,756.05 28,581.93
(3) PAYMENTS TO AND PROVISIONS FOR EMPLOYEES
(a) Salaries, Wages, Bonus, etc.(refer note schedule “B”,Page 54) 4,913.93 3679.80
(b) Contribution to Provident, Superannuation andGratuity Funds 298.55 209.93
(c) Workmen and Staff Welfare Expenses 283.19 233.06
5,495.67 4,122.79(4) OTHER EXPENSES
(a) Processing Charges 193.73 169.23
(b) Packing Materials Consumed 339.68 207.57
(c) Power and Fuel 2,387.79 2,190.47
(d) Repairs to Building 1,804.54 1,476.55
(e) Repairs to Machinery 285.25 214.95
(f ) Repairs Others 592.27 457.36
(g) Rent 4,000.83 3,349.73
(h) Rates and Taxes 746.50 588.06
(i) Insurance 64.48 69.78
(j) Advertisement and Sales Promotion 4,694.70 4,474.41
(k) Travelling Expenses 429.95 294.24
(l) Professional and Legal Charges 665.33 539.22
(m) Printing and Stationery 142.87 106.81
(n) Bank Charges 445.50 345.71
(o) Postage, Telegrams and Telephones 383.32 286.59
(p) General Expenses (Note 5 (i), Page 67) 3,064.54 2,289.98
(q) Retail Business Fees 4,097.04 3,393.36
(r) Sales Tax paid 3,882.65 2,841.90
(s) Directors’ Fees 13.12 11.98
(t) Commission to Non Whole-time Directors 52.86 30.00
(u) Excess of Cost over Fair Value of Current Investments - 0.02
(v) Loss on Sale of Fixed Assets Sold/Discarded (Net) - 82.91
(w) Loss on sale of Long Term Investments (Net) 10.81 142.72
28,297.76 23,563.55
(5) FREIGHT AND FORWARDING CHARGES 1,053.03 655.68
(6) CHANGES IN FINISHED PRODUCTS
Accretion to stocks deducted (3,471.19) (1,738.70)
68,349.28 55,362.51
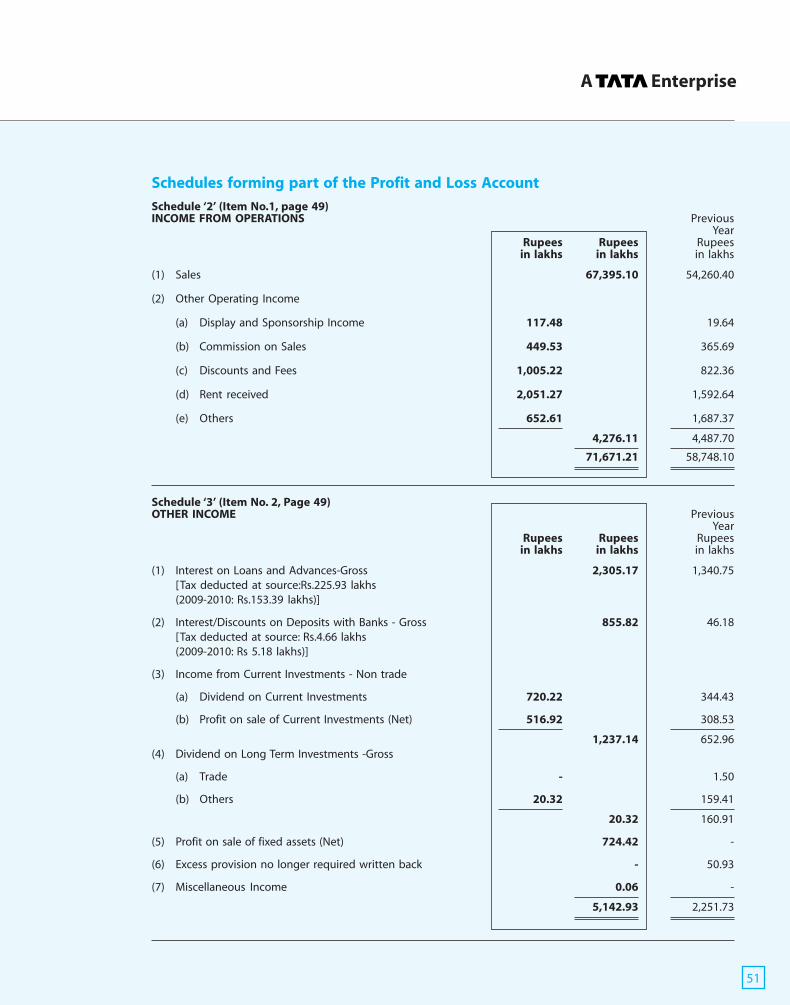
A Enterprise
51
Schedules forming part of the Profit and Loss Account
Schedule ‘2’ (Item No.1, page 49)INCOME FROM OPERATIONS Previous
YearRupees Rupees Rupees
in lakhs in lakhs in lakhs
(1) Sales 67,395.10 54,260.40
(2) Other Operating Income
(a) Display and Sponsorship Income 117.48 19.64
(b) Commission on Sales 449.53 365.69
(c) Discounts and Fees 1,005.22 822.36
(d) Rent received 2,051.27 1,592.64
(e) Others 652.61 1,687.37
4,276.11 4,487.70
71,671.21 58,748.10
Schedule ‘3’ (Item No. 2, Page 49)OTHER INCOME Previous
YearRupees Rupees Rupees
in lakhs in lakhs in lakhs
(1) Interest on Loans and Advances-Gross 2,305.17 1,340.75[Tax deducted at source:Rs.225.93 lakhs(2009-2010: Rs.153.39 lakhs)]
(2) Interest/Discounts on Deposits with Banks - Gross 855.82 46.18[Tax deducted at source: Rs.4.66 lakhs(2009-2010: Rs 5.18 lakhs)]
(3) Income from Current Investments - Non trade
(a) Dividend on Current Investments 720.22 344.43
(b) Profit on sale of Current Investments (Net) 516.92 308.53
1,237.14 652.96(4) Dividend on Long Term Investments -Gross
(a) Trade - 1.50
(b) Others 20.32 159.41
20.32 160.91
(5) Profit on sale of fixed assets (Net) 724.42 -
(6) Excess provision no longer required written back - 50.93
(7) Miscellaneous Income 0.06 -
5,142.93 2,251.73

Fifty-Ninth Annual Report 2010-2011
52
Schedule forming part of the Profit and Loss Account
Schedule ‘4’ ( Item No. 6, Page 49)INTEREST EXPENSE Previous
YearRupees Rupees Rupees
in lakhs in lakhs in lakhs
(a) Debentures 597.57 131.00
(b) Fixed Loans 167.40 473.81
(c) Others 19.32 0.01
784.29 604.82
Schedule ‘5’ ( Item No. 8, Page 49)EXEPTIONAL INCOME/(EXPENSES) Previous
YearRupees Rupees Rupees
in lakhs in lakhs in lakhs
INCOME
Profit on Sale of Minority stake insubsidiary Landmark Limited - 1,137.59
- 1,137.59
EXPENSES
(a) Provision for contingency for disputed expenses 84.00 -
(b) Provision for Diminution in value of Investments inJoint Venture Trexa ADMC Private Limited 200.00 -
284.00 -
Net Income/(Expense) (284.00) 1,137.59

A Enterprise
53
Schedule ‘A’(Item No. 1(a), Page 48)CAPITAL
As at As at31.03.2011 31.3.2010
Rupees Rupees Rupeesin lakhs in lakhs in lakhs
AUTHORISED :3,20,00,000 Equity Shares of Rs.10/- each 3,200.00 2,400.00(2009-2010 : 2,40,00,000 Equity Shares of Rs.10/- each)50,00,000 Unclassified Shares of Rs.10/- each 500.00 500.00(2009-2010 : 50,00,000 Unclassified Shares of Rs.10/- each)70,000 Preference Shares of Rs 1000/- each 700.00 700.00(2009-2010 : 70,000 Preference shares of Rs.1000/-each)1,20,00,000 Cumulative Convertible Preference shares ofRs.10/-each. 1,200.00 -(2009-2010 : Nil)
5,600.00 3,600.00
ISSUED, SUBSCRIBED AND PAID UP :2,00,56,877 Equity Shares of Rs. 10/- each fully paid-up 2,005.69 2,003.51[2009-2010 : 2,00,35,052 Equity Shares of Rs. 10/- eachfully paid-up]70,000 0.1% Cumulative Redeemable Preference Shares of 700.00 700.00Rs.1000/-each, fully paid up[2009-2010 : 70,000 0.1% Cumulative Redeemable PreferenceShares of Rs. 1,000/- each, fully paid-up]44,51,414 Cumulative Compulsorily Convertible Preference SharesSeries A of Rs.10/- each fully paid up (2009-10: Nil) 445.14 -44,51,414 Cumulative Compulsorily Convertible Preference SharesSeries B of Rs.10/- each fully paid up (2009-10: Nil) 445.14 -
3,595.97 2,703.51
Notes :1. Of the above -
(a) 1,08,81,021 Equity Shares were allotted as fully paid Bonus Shares by capitalisation of Share Premium andReserves.
(b) 1,12,616 Equity Shares were allotted as fully paid pursuant to Schemes of Amalgamation without paymentbeing received in cash.
(c) 70,000 Cumulative Redeemable Preference Shares were allotted as fully paid pursuant to Scheme ofAmalgamation without payment being received in cash.
2. During the current year, the Company has issued 44,51,414 0. 1% Cumulative Compulsorily Convertible PreferenceShares (CCPS) Series A of Rs 10/- @550 each and 44,51,414 0.1% Cumulative Compulsorily Convertible PreferenceShares (CCPS) Series B of Rs 10/- @550 each to the Equity Shareholders on Right basis in the ratio of 4 CCPS(2series A and 2 Series B) for every 9 Equity Shares held. Each CCPS of Series A is Convertible into 1 Equity Share ofRs 10 each at premium of Rs 540 automaticaly on 1st September 2011 and each CCPS of Series B is Convertibleinto 1 Equity Share of Rs 10 each at a premium of Rs 540 automatically on 1st September 2012 .Until conversion,CCPS of both series will be eligible for a dividend of 0.1% p.a on their face value.
3 The term of the 0.1% Cumulative Redeemable Preference Shares is of 20 years from 26th March 2010, being thedate of allotment, with an option to the Company to redeem the Preference Shares at any time after 36 monthsfrom the date of allotment. The Board of Directors at their meeting held on 26th April 2010 have fixed 1st June2013 as the date of redemption of the Preference Shares.
4 During the year 2009-10, the Company had granted 21,825 stock options under the Employee Stock OptionScheme. During the current year 21,825 Equity Shares of Rs 10/- each were issued at par pursuant to StockOptions exercised. No stock Options are outstanding as on 31st March, 2011.
Schedule forming part of the Balance Sheet
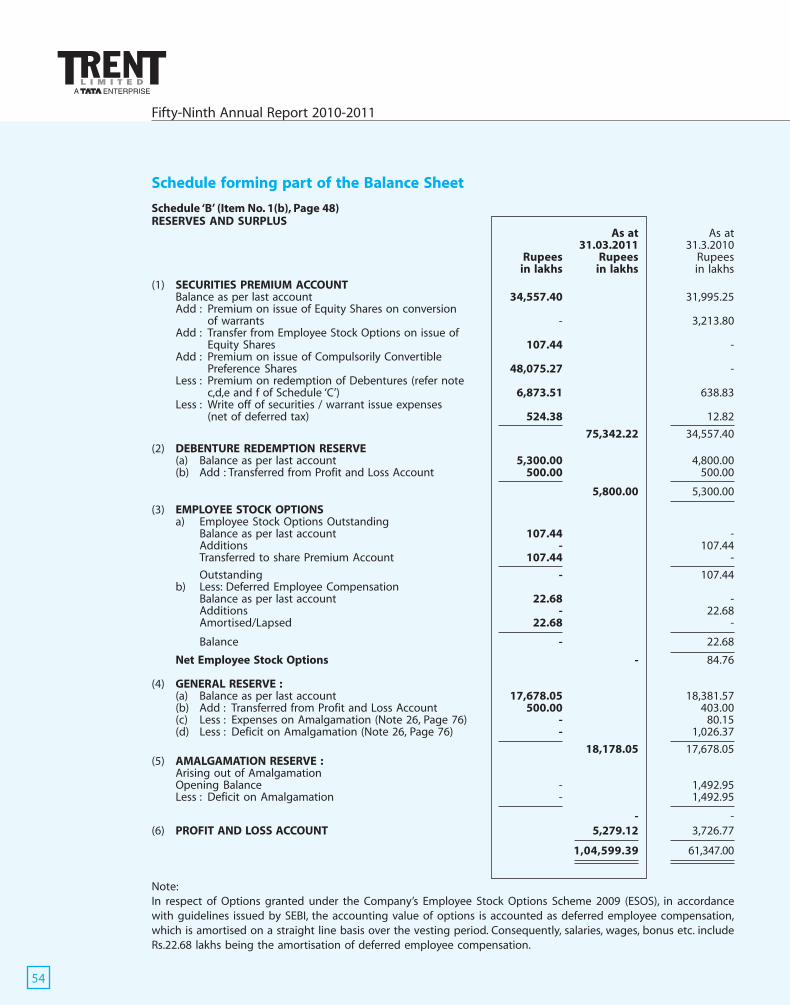
Fifty-Ninth Annual Report 2010-2011
54
Schedule forming part of the Balance Sheet
Schedule ‘B’ (Item No. 1(b), Page 48)RESERVES AND SURPLUS
As at As at31.03.2011 31.3.2010
Rupees Rupees Rupeesin lakhs in lakhs in lakhs
(1) SECURITIES PREMIUM ACCOUNTBalance as per last account 34,557.40 31,995.25Add : Premium on issue of Equity Shares on conversion
of warrants - 3,213.80Add : Transfer from Employee Stock Options on issue of
Equity Shares 107.44 -Add : Premium on issue of Compulsorily Convertible
Preference Shares 48,075.27 -Less : Premium on redemption of Debentures (refer note
c,d,e and f of Schedule ‘C’) 6,873.51 638.83Less : Write off of securities / warrant issue expenses
(net of deferred tax) 524.38 12.82
75,342.22 34,557.40(2) DEBENTURE REDEMPTION RESERVE
(a) Balance as per last account 5,300.00 4,800.00(b) Add : Transferred from Profit and Loss Account 500.00 500.00
5,800.00 5,300.00
(3) EMPLOYEE STOCK OPTIONSa) Employee Stock Options Outstanding
Balance as per last account 107.44 -Additions - 107.44Transferred to share Premium Account 107.44 -
Outstanding - 107.44b) Less: Deferred Employee Compensation
Balance as per last account 22.68 -Additions - 22.68Amortised/Lapsed 22.68 -
Balance - 22.68
Net Employee Stock Options - 84.76
(4) GENERAL RESERVE :(a) Balance as per last account 17,678.05 18,381.57(b) Add : Transferred from Profit and Loss Account 500.00 403.00(c) Less : Expenses on Amalgamation (Note 26, Page 76) - 80.15(d) Less : Deficit on Amalgamation (Note 26, Page 76) - 1,026.37
18,178.05 17,678.05(5) AMALGAMATION RESERVE :
Arising out of AmalgamationOpening Balance - 1,492.95Less : Deficit on Amalgamation - 1,492.95
- -(6) PROFIT AND LOSS ACCOUNT 5,279.12 3,726.77
1,04,599.39 61,347.00
Note:In respect of Options granted under the Company’s Employee Stock Options Scheme 2009 (ESOS), in accordancewith guidelines issued by SEBI, the accounting value of options is accounted as deferred employee compensation,which is amortised on a straight line basis over the vesting period. Consequently, salaries, wages, bonus etc. includeRs.22.68 lakhs being the amortisation of deferred employee compensation.

A Enterprise
55
Schedules forming part of the Balance Sheet
Schedule ‘C’ (Item No. 2, Page 48)LOAN FUNDS
As at As at31.03.2011 31.3.2010
Rupees Rupeesin lakhs in lakhs
(1) SECURED LOANS :Non Convertible Debentures (note “a”) - 6,550.24Non Convertible Debentures- April 10 Series-I (Note ‘d’) 10,000.00 -Non Convertible Debentures-Series-II (note “b”) - 5,000.00
10,000.00 11,550.24
(2) UNSECURED LOANS :Sales Tax loan from Government of Maharashtra - 1.82Non Convertible Debentures-Oct-09-Series I (note “c”) 5,000.00 5,000.00Non Convertible Debentures-April 10 Series 2 (note “e”) 5,000.00 -Non Convertible Debentures - June 10 Series 1 (note “f”) 4,500.00 -Non Convertible Debentures - June 10 Series 2 (note “f”) 3,000.00 -Commercial Paper - 5,000.00Inter Corporate Deposits - 3,500.00
17,500.00 13,501.82
27,500.00 25,052.06
(a) During the year 2005-2006 the Company has issued 13,10,047 Partly Convertible Debentures of Rs. 900/- each.Ofthe above, Convertible Debenture of the face value of Rs. 400/- has been converted into one Equity Share of Rs.10/- each at a premium of Rs. 390/- per share on the date of allotment. The Non Convertible Debenture of facevalue of Rs. 500/- are redeemed at a premium of Rs. 98/- each on 7th July 2010.The Premium payable onredemption of Debentures amounting to Rs 1283.85 lakhs has been provided and debited to Securities PremiumAccount during 2005-2006.
(b) During the current year , the Company has redeemed 500 Redeemable Non Convertible Debentures - Series II ofRs. 10 each issued during 2008-09, together with a premium of Rs 2.63 lakhs each. The Premium payable onredemption of these Debentures has been fully provided and is debited to Securities Premium Account net ofdeferred tax.
(c) During the year 2009-10, the Company has issued 500 Redeemable Non Convertible Debentures of Rs. 10 lakhseach on private placement basis.These Debentures are free of interest and are redeemable at a premium ofRs.1.94 lakhs each on 21st October 2011.The Premium payable on redemption of these Debentures has beenfully provided and is debited to Securities Premium Account net of deferred tax during 2009-10.
(d) During the current year, the Company issued 1,000 Redeemable Non Convertible Debentures of Rs. 10 lakhseach on private placement basis.These Debentures are free of interest and are redeemable at a premium ofRs.6.11 lakhs each on 14th April 2015 .The Premium payable on redemption of these Debentures has been fullyprovided and is debited to Securities Premium Account net of deferred tax. These Debentures are secured byway of charge on immovable property of the company in favour of Debenture Trustees as stipulated in theDebenture Trust Deed and 1.25 times asset cover will be maintained by the company on continuous basis.
(e) During the current year, the Company issued 500 Redeemable Non Convertible Debentures April 10 Series 2 ofRs. 10 lakhs each on private placement basis.These Debentures are at 5% p.a of interest and are redeemable ata premium of Rs.2.89 lakhs each on 27th April 2015.The Premium payable on redemption of these Debentureshas been fully provided and is debited to Securities Premium Account net of deferred tax.
(f ) During the current year, the Company issued 450 Redeemable Non Convertible Debentures June 2010 Series 1of Rs 10 lakhs each and 300 Redemable Non Convertible Debentures June 2010 Series 2 of Rs. 10 lakhs each onprivate placement basis.Series I Debentures will carry an interest of 9.75% p.a and are redeemable at a par on30th June 2017 and series 2 Debentures are free of Interest and will be redeemed at Premium of Rs 9.13 Lakhson 30th june 2017 .The Premium payable on redemption of Series 2 Debentures has been fully provided and isdebited to Securities Premium Account net of deferred tax.
(g) Of the above secured loans amount payable within one year Rs. Nil (2009-10 : Rs.11,550.24 Lakhs)(h) Of the above unsecured loans, amount repayable within a year Rs.5,000.00 Lakhs (2009-2010 : Rs. 8,501.82 Lakhs).

Fifty-Ninth Annual Report 2010-2011
56
Schedule ‘D’(Item No.5, Page 48)FIXED ASSETS
ASSETS GROSS BLOCK (AT COST) DEPRECIATION NET BLOCK
As at Additions/ Deductions/ As at As at Deductions/ For the As at As at
1.4.2010 Adjustments Adjustments 31.03.2011 1.4.2010 Adjustments year 31.03.2011 31.03.2011
Rupees Rupees Rupees Rupees Rupees Rupees Rupees Rupees Rupees
in lakhs in lakhs in lakhs in lakhs in lakhs in lakhs in lakhs in lakhs in lakhs
Freehold Land 405.47 - - 405.47 - - - - 405.47
(405.47) ( - ) ( - ) (405.47) ( - ) ( - ) ( - ) ( - ) (405.47)
Leasehold Land 5,449.53 - - 5,449.53 66.17 - 72.10 138.27 5,311.26
( - ) (5,449.53) ( - ) (5,449.53) ( - ) ( - ) (66.17) (66.17) (5,383.36)
Buildings 7,436.48 4,728.22 104.58 12,060.12 1,154.11 73.05 326.46 1,407.52 10,652.60
(3,283.75) (4,173.22) (20.49) (7,436.48) (904.09) (4.32) (254.34) (1,154.11) (6,282.37)
Plant and Machinery 4,616.74 857.64 28.63 5,445.75 1,225.72 10.45 229.03 1,444.30 4,001.45
(3,373.09) (1,283.08) (39.44) (4,616.74) (1,046.01) (13.62) (193.33) (1,225.72) (3,391.02)
Furniture, Fixtures,
Office and Other
Equipment 8,002.24 1,589.88 43.45 9,548.67 2,853.55 8.47 726.27 3,571.35 5,977.32
(6,561.49) (1,528.15) (87.40) (8,002.24) (2,235.91) (43.80) (661.42) (2,853.55) (5,148.69)
Vehicles 55.12 - 6.62 48.50 13.47 3.04 5.04 15.47 33.03
(59.74) (18.86) (23.48) (55.12) (17.13) (8.70) (5.05) (13.47) (41.65)
Intangible Assets 48.07 12.68 - 60.75 46.40 - 3.75 50.15 10.60
(47.29) (0.78) ( - ) (48.07) (41.62) ( - ) (4.78) (46.40) (1.67)
Total 26,013.65 7,188.42 183.28 33,018.79 5,359.42 95.01 1,362.65 6,627.06 26,391.73
(13,730.83) (12,453.62) (170.81) (26,013.65) (4,244.77) (70.44) (1,185.09) (5,359.42) (20,654.23)
Capital Work-in-Progress 2,783.03
(1,690.29)
Total 29,174.76
(22,344.52)
Notes :
(1) Figures in brackets are in respect of previous year.
(2) Buildings include improvements to leasehold premises and an amount of Rs. Nil (2009-2010: Rs.1,050) representingvalue of Shares in Co-operative Housing Societies/Condominium .
(3) Leasehold Land and building includes certain portions which have been given under operating leases.
Schedules forming part of the Balance Sheet

A Enterprise
57
Schedule Forming Part of the Balance Sheet
Schedule ‘E’ (Item No.6, Page 48)INVESTMENTS
Balance as Purchased during Sold during Balance ason 1.4.2010 the year the year on 31.3.2011
No.of. Rupees No.of. Rupees No.of. Rupees No.of. RupeesShares/Units in lakhs Shares/Units in lakhs Shares/Units in lakhs Shares/Units in lakhs
Long Term Investment
Face Value of Rs 10 each,Unquoted and fully paid-upunless otherwise stated
Trade Investments at Cost(unquoted and fully paid unless otherwise stated)
The Associated Building Company Limited-(Equity shares of Rs. 900/- each ) 50 0.45 - - - - 50 0.45
Tata International Limited-(Equity shares of Rs. 1000/- each ) 1,000 2.00 - - - - 1,000 2.00
Tata Services Limited-(Equity shares of Rs. 1000/- each ) 45 0.45 - - - - 45 0.45
Retailers Association of India 10,000 1.00 - - - - 10,000 1.00
Total Trade Investment 3.90 3.90
Other Investments at Cost (unquoted andfully paid unless otherwise stated)
(a) In Subsidiary Companies
Nahar Theatres Pvt Ltd.-(Equity shares of Rs. 1000/- each ) 1,996 2,832.13 - - - - 1,996 2,832.13
Nahar Theatres Pvt Ltd.- Pref Shares 100 1.00 - - - - 100 1.00
(9.5% Cumulative Redeemable Preference Shares ofRs 1000/- each)
Optim Estates Pvt. Ltd. (Refer Note 27,Page 77) - 10,000 4,901.15 10,000 4,901.15 - -
Trent Brands Limited 32,50,000 325.00 - - - - 32,50,000 325.00
Fiora Link Road Properties Ltd. 50,000 5.00 - - - - 50,000 5.00
Landmark Limited 41,97,370 12,479.89 - - - - 41,97,370 12,479.89
Fiora Services Limited-(Equity shares of Rs. 100/- each ) 39,000 76.58 - - - - 39,000 76.58
Trent Global Holdings Ltd.(USD 750000) 7,50,000 327.30 - - - - 7,50,000 327.30
Trent Hypermarket Ltd. (Refer Note 27,Page 77) 5,10,50,000 5,105.00 1,50,000 4,901.15 - - 5,12,00,000 10,006.15
Trent Hypermarket Ltd-10% Redeemable pref. shares(Refer Note 27,Page 77) - - 10,00,000 100.00 - - 10,00,000 100.00
Westland Ltd. Optionally convertible pref. shares - - 4,00,00,000 400.00 - - 4,00,00,000 400.00
Westland Limited 27,39,800 300.75 - - - - 27,39,800 300.75
10% Redeemable pref. shares -Optim Estates PrivateLimited -(Refer Note 27,Page 77) 10,00,000 100.00 - - 10,00,000 100.00 - -
Total Investment in Subsidiary Companies 21,552.65 26,853.80
(b) In Joint Ventures
Inditex Trent Retail India Private Limited—(Equity shares of Rs. 1000/- each ) 3,17,520 3,175.20 - - - - 317,520 3,175.20
TREXA ADMC Pvt Ltd 22,07,500 220.75 - - - - 22,07,500 220.75
Total Investment in Joint Ventures 3,395.95 - - 3,395.95
(c) In Other Company
IDBI Ltd. (Quoted) 18,867 31.87 - - - - 18,867 31.87
Reliance Industries Ltd. (Quoted) 5,624 92.53 - - 5,624 92.53 - -
Tata Investment Corporation Limited(Quoted) 25,700 83.53 - - - - 25,700 83.53
Tata Sons Limited 20,000 200.00 - - - - 20,000 200.00
Tata Investment Corpn.ZCCB-Warrants (warrantsof Rs.0/- each) 12,850 - - - - - 12,850 -
Total Investment in Other Companies 407.93 315.40

Fifty-Ninth Annual Report 2010-2011
58
Schedule Forming Part of the Balance SheetSchedule ‘E’ (Item No.6, Page 48)INVESTMENTS
Balance as Purchased during Sold during Balance ason 1.4.2010 the year the year on 31.3.2011
No.of. Rupees No.of. Rupees No.of. Rupees No.of. RupeesShares/Units in lakhs Shares/Units in lakhs Shares/Units in lakhs Shares/Units in lakhs
( d ) In Mutual FundsBirla Sun Life Fixed Term plan Series CF Growth - - 50,00,000 500.00 - - 50,00,000 500.00Birla Sun Life Fixed Term plan Series CI Growth - - 50,00,000 500.00 - - 50,00,000 500.00Birla Sun Life Fixed Term plan Series CK Growth - - 20,00,000 200.00 - - 20,00,000 200.00ICICI pru FMP Series 52 1 year Plan C Cum.. - - 1,00,00,000 1,000.00 - - 1,00,00,000 1,000.00ICICI Pru FMP Srs 53 1 year Plan A Growth - - 50,00,000 500.00 - - 50,00,000 500.00ICICI pru Annual interval plan II growth - - 39,12,945 500.00 - - 39,12,945 500.00ICICI pru Interval Fund Annual interval plan III growth - - 49,99,100 500.00 - - 49,99,100 500.00IDFC Fixed Maturity plan yrly Series 37 growth - - 10,00,000 100.00 - - 10,00,000 100.00Reliance Fixed Horizon Fund XV Series 9 Growth. - - 50,00,775 500.08 - - 50,00,775 500.08Birla Sunlife Income Plus - Growth 11,70,245 486.87 - - - - 11,70,245 486.87ICICI Pru Instt Income Plan- Dividend 46,16,759 500.60 97,709 10.58 47,14,468 511.18 - -HDFC High Interest Fund Quarterly Divd. Reinvst. - - 91,52,005 1,025.15 - - 91,52,005 1,025.15HDFC Income Fund Growth. - - 41,78,706 923.51 - - 41,78,706 923.51Templeton India Income Opportunities Fund Growth - - 46,92,809 500.00 - - 46,92,809 500.00Birla Sunlife G-Sec Fund LT Divid.Reinvst. - - 90,38,603 1,055.42 - - 90,38,603 1,055.42Birla Sunlife Gilt plus Regular Plan Growth - - 6,41,237 200.00 6,41,237 200.00 - -HDFC Gilt Fund Long term-Growth - - 52,00,354 1,000.00 25,68,753 493.96 26,31,601 506.04HDFC Short Term Plan Divid. Reinvst. 51,97,022 540.27 1,47,244 15.19 53,44,267 555.46 - -ICICI Pru. Inst. Short Term plan Fortnightly Divd. Reinvst. 43,52,412 532.47 1,62,428 19.36 45,14,840 551.83 - -Birla Sunlife Dynamic Bond Fund Retail Qtrly divid. 45,32,312 505.43 92,47,750 1,039.20 1,37,80,062 1,544.63 - -Templeton India Short term Income Plan Inst. - - 32,949 501.56 - - 32,949 501.56(Units of Rs 1000/- each) - - - - -JM Emerging Leaders Fund-Dividend 14,58,440 300.76 - - 14,58,440 300.76 - -
Total investment in Mutual Fund 2,866.40 9,298.63
Total Investment in Long Term 28,226.83 39,867.68
Current InvestmentsOther Investments at Cost (unquoted andfully paid unless otherwise stated)UTI Fixed Income Interval Fund Srs II Qrtly intvl plan VInst. Divid. 1,00,57,148 1,005.71 55,495 5.55 1,01,12,643 1,011.26 - -Birla Sunlife Quarterly Interval- Series- 4 -Divid.Reinvst. - 49,43,520 494.35 49,43,520 494.35 - -ICICI Pru Banking & PSU Debt Fund wkly Divid. Reinvst. 1,00,41,308 1,005.51 1,01,73,976 1,019.79 2,02,15,284 2,025.29 - -ICICI Pru Interval Fund V -Monthly Income plan AInst.Divid. - - 1,00,79,963 1,008.00 1,00,79,963 1,008.00 - -ICICI Pru Interval Fund Monthly interval plan1 Inst.Divid. - - 50,24,130 502.41 50,24,130 502.41 - -ICICI pru quarterly Interval Fund II Plan D Inst.Divid.Rinvst. - - 1,01,49,547 1,014.95 1,01,49,547 1,014.95 - -ICICI Pru Interval Fund Half yrly Interval plan1 Inst.Divid. - - 49,99,400 500.00 - - 49,99,400 500.00Kotak Quarterly Interval plan series 3 Divid 1,00,40,777 1,004.08 75,615 7.56 1,01,16,391 1,011.64 - -Kotak Quarterly Interval plan series 4 Divid. - - 50,00,000 500.00 50,00,000 500.00 - -Kotak Quarterly Interval plan series 7 Divid. 50,20,540 502.06 40,004 4.00 50,60,544 506.06 - -Kotak Quarterly interval plan series 8 Divid. - - 99,99,800 1,000.00 99,9,9,800 1,000.00 - -Kotak 370 FMP 370 days Series 7 Growth - - 50,00,000 500.00 - - 50,00,000 500.00Kotak Floater Short Term Weekly Dividend Reinvst. - - 99,98,497 1,006.69 99,98,497 1,006.69 - -Birla Sunlife interval income Fund-Instl-Qrtrly-Srs 2 Divid. 1,00,00,000 1,000.00 - - 1,00,00,000 1,000.00 - -Birla Sunlife interval income Fund-Instl-Qrtrly-Srs 1 Divid. 1,00,00,000 1,000.00 52,04,448 520.44 1,52,04,448 1,520.44 - -Reliance quarterly Interval Fund Series III Inst.Divid. - - 49,97,507 500.07 4,9,97,507 500.07 - -Tata Fixed Income Portfolio Fund Scheme A2 Inst. Divid.. - - 2,01,28,841 2,013.09 2,01,28,841 2,013.09 - -Tata Fixed Income Portfolio Fund Scheme A3 Inst. Divid. - - 1,00,00,000 1,000.00 1,00,00,000 1,000.00 - -Tata Fixed Income Portfolio Fund Scheme B3Inst. Qtrly.Divid. 50,00,000 500.00 - - 50,00,000 500.00 - -
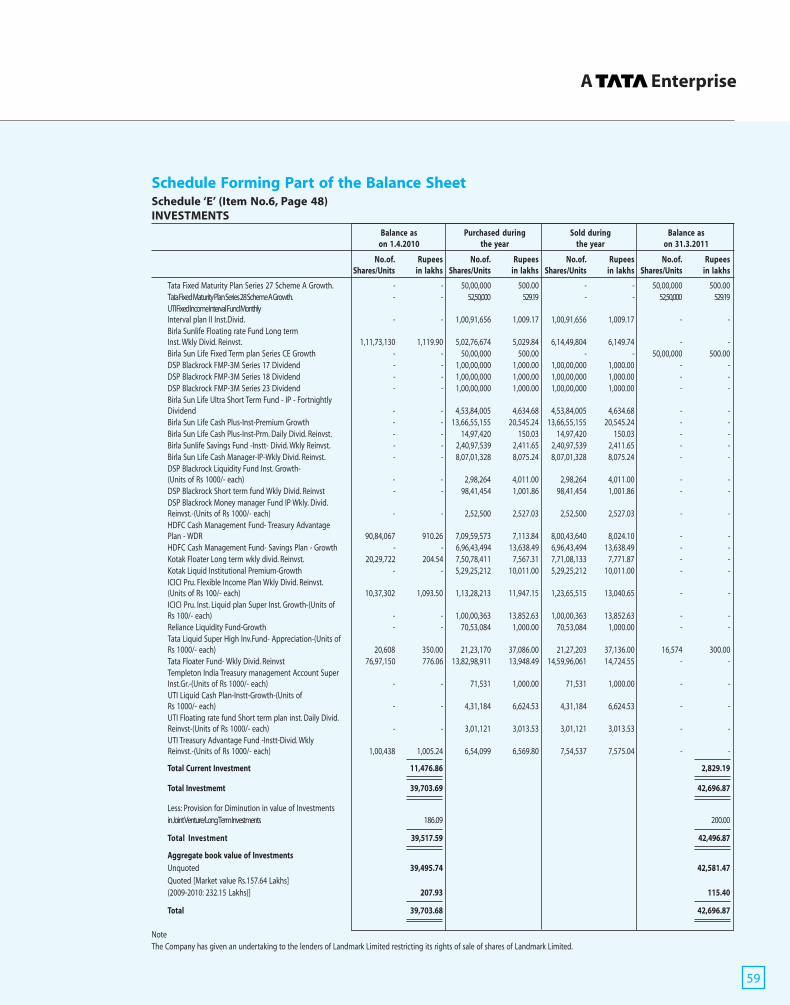
A Enterprise
59
Tata Fixed Maturity Plan Series 27 Scheme A Growth. - - 50,00,000 500.00 - - 50,00,000 500.00Tata Fixed Maturity Plan Series 28 Scheme A Growth. - - 52,50,000 529.19 - - 52,50,000 529.19UTI Fixed Income Interval Fund MonthlyInterval plan II Inst.Divid. - - 1,00,91,656 1,009.17 1,00,91,656 1,009.17 - -Birla Sunlife Floating rate Fund Long termInst. Wkly Divid. Reinvst. 1,11,73,130 1,119.90 5,02,76,674 5,029.84 6,14,49,804 6,149.74 - -Birla Sun Life Fixed Term plan Series CE Growth - - 50,00,000 500.00 - - 50,00,000 500.00DSP Blackrock FMP-3M Series 17 Dividend - - 1,00,00,000 1,000.00 1,00,00,000 1,000.00 - -DSP Blackrock FMP-3M Series 18 Dividend - - 1,00,00,000 1,000.00 1,00,00,000 1,000.00 - -DSP Blackrock FMP-3M Series 23 Dividend - - 1,00,00,000 1,000.00 1,00,00,000 1,000.00 - -Birla Sun Life Ultra Short Term Fund - IP - FortnightlyDividend - - 4,53,84,005 4,634.68 4,53,84,005 4,634.68 - -Birla Sun Life Cash Plus-Inst-Premium Growth - - 13,66,55,155 20,545.24 13,66,55,155 20,545.24 - -Birla Sun Life Cash Plus-Inst-Prm. Daily Divid. Reinvst. - - 14,97,420 150.03 14,97,420 150.03 - -Birla Sunlife Savings Fund -Instt- Divid. Wkly Reinvst. - - 2,40,97,539 2,411.65 2,40,97,539 2,411.65 - -Birla Sun Life Cash Manager-IP-Wkly Divid. Reinvst. - - 8,07,01,328 8,075.24 8,07,01,328 8,075.24 - -DSP Blackrock Liquidity Fund Inst. Growth-(Units of Rs 1000/- each) - - 2,98,264 4,011.00 2,98,264 4,011.00 - -DSP Blackrock Short term fund Wkly Divid. Reinvst - - 98,41,454 1,001.86 98,41,454 1,001.86 - -DSP Blackrock Money manager Fund IP Wkly. Divid.Reinvst.-(Units of Rs 1000/- each) - - 2,52,500 2,527.03 2,52,500 2,527.03 - -HDFC Cash Management Fund- Treasury AdvantagePlan - WDR 90,84,067 910.26 7,09,59,573 7,113.84 8,00,43,640 8,024.10 - -HDFC Cash Management Fund- Savings Plan - Growth - - 6,96,43,494 13,638.49 6,96,43,494 13,638.49 - -Kotak Floater Long term wkly divid. Reinvst. 20,29,722 204.54 7,50,78,411 7,567.31 7,71,08,133 7,771.87 - -Kotak Liquid Institutional Premium-Growth - - 5,29,25,212 10,011.00 5,29,25,212 10,011.00 - -ICICI Pru. Flexible Income Plan Wkly Divid. Reinvst.(Units of Rs 100/- each) 10,37,302 1,093.50 1,13,28,213 11,947.15 1,23,65,515 13,040.65 - -ICICI Pru. Inst. Liquid plan Super Inst. Growth-(Units ofRs 100/- each) - - 1,00,00,363 13,852.63 1,00,00,363 13,852.63 - -Reliance Liquidity Fund-Growth - - 70,53,084 1,000.00 70,53,084 1,000.00 - -Tata Liquid Super High Inv.Fund- Appreciation-(Units ofRs 1000/- each) 20,608 350.00 21,23,170 37,086.00 21,27,203 37,136.00 16,574 300.00Tata Floater Fund- Wkly Divid. Reinvst 76,97,150 776.06 13,82,98,911 13,948.49 14,59,96,061 14,724.55 - -Templeton India Treasury management Account SuperInst.Gr.-(Units of Rs 1000/- each) - - 71,531 1,000.00 71,531 1,000.00 - -UTI Liquid Cash Plan-Instt-Growth-(Units ofRs 1000/- each) - - 4,31,184 6,624.53 4,31,184 6,624.53 - -UTI Floating rate fund Short term plan inst. Daily Divid.Reinvst-(Units of Rs 1000/- each) - - 3,01,121 3,013.53 3,01,121 3,013.53 - -UTI Treasury Advantage Fund -Instt-Divid. WklyReinvst.-(Units of Rs 1000/- each) 1,00,438 1,005.24 6,54,099 6,569.80 7,54,537 7,575.04 - -
Total Current Investment 11,476.86 2,829.19
Total Investmemt 39,703.69 42,696.87
Less: Provision for Diminution in value of Investmentsin Joint Venture/Long Term Investments 186.09 200.00
Total Investment 39,517.59 42,496.87
Aggregate book value of InvestmentsUnquoted 39,495.74 42,581.47Quoted [Market value Rs.157.64 Lakhs](2009-2010: 232.15 Lakhs)] 207.93 115.40
Total 39,703.68 42,696.87
NoteThe Company has given an undertaking to the lenders of Landmark Limited restricting its rights of sale of shares of Landmark Limited.
Schedule Forming Part of the Balance SheetSchedule ‘E’ (Item No.6, Page 48)INVESTMENTS
Balance as Purchased during Sold during Balance ason 1.4.2010 the year the year on 31.3.2011
No.of. Rupees No.of. Rupees No.of. Rupees No.of. RupeesShares/Units in lakhs Shares/Units in lakhs Shares/Units in lakhs Shares/Units in lakhs
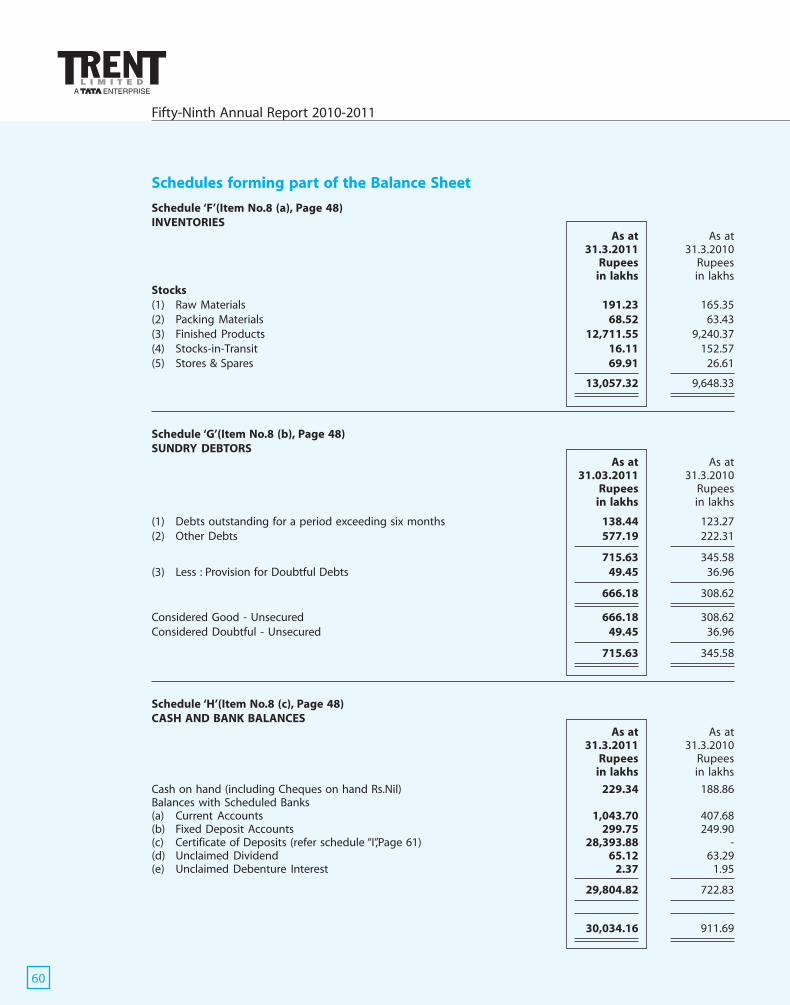
Fifty-Ninth Annual Report 2010-2011
60
Schedules forming part of the Balance Sheet
Schedule ‘F’(Item No.8 (a), Page 48)INVENTORIES
As at As at31.3.2011 31.3.2010
Rupees Rupeesin lakhs in lakhs
Stocks(1) Raw Materials 191.23 165.35(2) Packing Materials 68.52 63.43(3) Finished Products 12,711.55 9,240.37(4) Stocks-in-Transit 16.11 152.57(5) Stores & Spares 69.91 26.61
13,057.32 9,648.33
Schedule ‘G’(Item No.8 (b), Page 48)SUNDRY DEBTORS
As at As at31.03.2011 31.3.2010
Rupees Rupeesin lakhs in lakhs
(1) Debts outstanding for a period exceeding six months 138.44 123.27(2) Other Debts 577.19 222.31
715.63 345.58(3) Less : Provision for Doubtful Debts 49.45 36.96
666.18 308.62
Considered Good - Unsecured 666.18 308.62Considered Doubtful - Unsecured 49.45 36.96
715.63 345.58
Schedule ‘H’(Item No.8 (c), Page 48)CASH AND BANK BALANCES
As at As at31.3.2011 31.3.2010
Rupees Rupeesin lakhs in lakhs
Cash on hand (including Cheques on hand Rs.Nil) 229.34 188.86Balances with Scheduled Banks(a) Current Accounts 1,043.70 407.68(b) Fixed Deposit Accounts 299.75 249.90(c) Certificate of Deposits (refer schedule “I”,Page 61) 28,393.88 -(d) Unclaimed Dividend 65.12 63.29(e) Unclaimed Debenture Interest 2.37 1.95
29,804.82 722.83
30,034.16 911.69

A Enterprise
61
Schedules forming part of the Balance Sheet
Schedule’I’ (Item No.2(c), Page 60)
CERTIFICATE OF DEPOSITS
Balance as on Purchased during Sold during Balance as on1.4.2010 the year the year 31.3.2011
No. of. Rupees No. of. Rupees No. of. Rupees No. of. RupeesUnits in lakhs Units in lakhs Units in lakhs Units in lakhs
Face Value of Rs.1.00 Lakh
HDFC Bank Ltd - - 2,500 2,413.56 2,500 2,413.56 - -
ICICI Bank Ltd - - 2,500 2,411.77 2,500 2,411.77 - -
IDBI Bank Ltd - - 5,000 4,776.81 - - 5,000 4,776.81
ICICI Bank Ltd - - 2,500 2,392.23 - - 2,500 2,392.23
HDFC Bank Ltd - - 2,500 2,391.94 - - 2,500 2,391.94
Dhanlakshmi Bank Ltd - - 2,500 2,467.48 2,500 2,467.48 - -
Axis Bank Ltd - - 5,000 4,800.90 2,500 2,400.64 2,500 2,400.26
Union Bank Of India - - 2,500 2,374.22 2,500 2,374.22 - -
State Bank Of Patiala - - 2,500 2,337.09 - - 2,500 2,337.09
State Bank Of Hyderabad - - 2,500 2,373.19 2,500 2,373.19 - -
State Bank Of Bikaner & Jaipur - - 5,000 4,736.30 - - 5,000 4,736.30
Canara Bank - - 2,500 2,446.26 2,500 2,446.26 - -
State Bank Of Patiala - - 2,500 2,418.75 2,500 2,418.75 - -
Canara Bank - - 2,500 2,402.59 - - 2,500 2,402.59
Punjab & Sind Bank - - 2,500 2,366.48 - - 2,500 2,366.48
Axis Bank Ltd - - 2,500 2,272.47 - - 2,500 2,272.47
ICICI Bank Ltd - - 2,500 2,317.71 - - 2,500 2,317.71
- 28,393.88

Fifty-Ninth Annual Report 2010-2011
62
Schedules forming part of the Balance SheetSchedule ‘J’(Item No. 8 (d), Page 48)LOANS AND ADVANCES As at As at
31.3.2011 31.3.2010Rupees Rupees Rupees
in lakhs in lakhs in lakhs
(1) Security Deposits
Deposits for premises - Subsidiaries 412.50 412.50
Deposits for premises - Others 7,006.71 5,087.13
Other Deposits 100.03 170.76
7,519.24 5,670.39
(2) Loans
Loan to Subsidiaries 22,522.50 14,060.00
Other Loans 11,280.79 5,464.88
33,803.29 19,524.88(3) Other Loans and Advances recoverable
in cash or in kind or for value to be received 1,114.15 6,229.61
(4) Balances with Customs/Port Trust etc. 90.49 95.84
(5) Receivables from subsidiary 308.46 278.09
(6) Other Receivables 779.80 443.08
(7) Bills of Exchange 114.20 114.20
(8) Advances on Capital Account 355.56 258.70
(9) Advance payment of taxes - net of provision 793.75 1,090.97
(10) MAT Credit Entitlement 1,549.78 741.54
46,428.72 34,447.30
(11) Less : Provision for Doubtful Advances 214.72 211.91
46,214.00 34,235.39
Considered Good - Secured - -
Considered Good - Unsecured 46,214.00 34,235.39
Considered Doubtful - Unsecured 214.72 211.91
46,428.72 34,447.30

A Enterprise
63
Schedules forming part of the Balance Sheet
Schedule ‘K’ (Item No. 9 (a), Page 48)LIABILITIES As at As at
31.3.2011 31.3.2010Rupees Rupees Rupeesin lakhs in lakhs in lakhs
(1) Sundry Creditors 12,441.35 10,073.24
(2) Subsidiaries 71.72 7.28
(3) Security Deposits Received 1,524.53 1,522.03
(4) Investor Education and Protection Fund
(Appropriate amount shall be transferred to
“Investor Education and Protection Fund” if and due
(a) Unclaimed Dividend 65.12 63.29
(b) Unclaimed application money received by the Companyfor allotment of Rights Issue and due for refund 22.47 4.82
(c) Unclaimed Debenture Interest 2.37 1.95
89.96 70.06
14,127.56 11,672.61
Schedule ‘L’ (Item No.9 (b), Page 48)PROVISIONS As at As at
31.3.2011 31.3.2010Rupees Rupees
in lakhs in lakhs
(1) Proposed Dividend 1,505.49 1,302.29
(2) Tax on Dividend 244.23 216.29
(3) Contingencies 289.00 205.00
(4) Retirement Benefits 500.19 632.17
(5) Redemption Premium of Debentures 11,260.17 3,566.92
(6) Rent Equilisation 77.61 76.47
13,876.69 5,999.14

Fifty-Ninth Annual Report 2010-2011
64
Schedule ‘M’ SIGNIFICANT ACCOUNTING POLICIES
1.0 Basis of preparation of accounts
The financial statements are prepared on the accrual basis of accounting and in accordance with the Standardon Accordance with the standard on Accounting notified by the Companies (Accounting Standards) Rules,2006and refered to in Section 211(3C) of the Companies Act,1956
2.0 Fixed Assets and Depreciation
2.1 Fixed Assets are stated at cost less depreciation. Costs comprise of cost of acquisition, Borrowing Cost,Cost of Improvement and any attributable cost of bringing the asset to condition for its intended use.
2.2 Depreciation on tangible assets is provided in accordance with the provisions of Schedule XIV to theCompanies Act, 1956 as under: -
(a) In respect of the assets of the Retail Business on “Straight Line” method.
(b) In respect of all other assets on “Written Down Value” method.
2.3 Leasehold land is amortised over the period of lease remaining as at the date of their capitalisation.
2.4 Improvement to leasehold premises are depreciated over the period of lease remaining as at the date oftheir capitalisation.
2.5 Intangible Assets are amortised over their useful life not exceeding ten years.
3.0 Investments
Long Term Investments are stated at cost. A provision for diminution is made to recognise a decline, other thantemporary, in the value of Long Term Investments. Current Investments are stated at lower of cost or fair value.
4.0 Inventories
Inventories are valued as under :
Raw materials,packing materials and stores and spares : at cost.
Finished Products : at lower of cost or net realisable value.
5.0 Income
5.1 Sale of goods is recognised on delivery to customers and include amounts recovered towards sales tax.
5.2 Interest income is accounted on accrual basis.
5.3 Dividend income is accounted when right to receive payment is established.
6.0 Retirement Benefits
Defined Contribution Plans
6.1 a) Company’s contributions during the year towards Government administered Provident Fund, FamilyPension Fund, ESIC and Labour Welfare Fund are charged to the Profit and Loss Account asincurred.
b) Company’s contributions during the year towards Superannuation to the Superannuation Trustadministered by a Life Insurance Company are recognized in the Profit and Loss Account asincurred. (Refer Note No 21 (d), Page No. 72)
6.2 Defined Benefit Plans
a) Company’s Contribution towards Gratuity made under the Group Gratuity Schemes with LifeInsurance Companies are determined based on the amounts recommended by Life InsuranceCompanies as per actuarial valuation. (Refer Note 21(a), Page No. 71)
b) In the case of certain employees, contribution towards Provident Fund is made to an approvedtrust administered by the Company. The interest rate payable to the members of the trust shallnot be lower than the statutory rate of interest declared by the Central Government under theEmployees Provident Fund and Miscellaneous Provisions Act, 1952 and shortfall, if any, shall bemade good by the Company.
c) Provision for other retirement / post retirement benefits in the forms of pensions, medical benefitsand long term compensated absences (leave encashment) has been made on the basis of actuarialvaluation.
Schedule Forming Part of the Balance Sheet and Profit and Loss Account
A Enterprise
65
7.0 Foreign Currency Transactions
Foreign Currency transactions are accounted at the rates prevailing on the date of transaction.
Year end current assets and liabilities are translated at the exchange rate ruling on the date of the BalanceSheet.
Exchange differences on settlement/conversion are adjusted to the Profit and Loss Account.
8.0 Employee Stock Option Scheme (ESOS)
In respect of Options granted under the Company’s Employee Stock Options Scheme (ESOS), in accordancewith guidelines issued by SEBI , the accounting value of options is accounted as Deferred EmployeeCompensation, which is amortised on a straight line basis over the vesting period.
9.0 Provisions and Contingent Liabilities
The Company recognises a provision when there is a present obligation as a result of past event that probablyrequires an outflow of resources and a reliable estimate can be made of the amount of the obligation. Adisclosure for contingent liability is made when there is possible obligation or a present obligation that may,but probably will not, require an outflow of resources. Where there is a possible obligation or present obligationthat the likelihood of outflow of resources is remote, no provision or disclosure is made.
10.0 Taxation
10.1 Current Tax comprises of Provision for Income Tax and Wealth Tax is determined in accordance with theprovisions of Income Tax Act, 1961 and the Wealth Tax Act, 1957.
10.2 Deferred tax is recognised on timing difference between the taxable income and accounting incomethat originate in one period and are capable of reversal in one or more subsequent periods.
11.0 Leases
Lease arrangements where the risks and rewards incident to ownership of an asset substantially vest with thelessor are recognised as operating leases. Lease rents under operating leases are recognised in the Profit andLoss Account on straight line basis.
12.0 Borrowing Cost
Borrowing cost include interest, fees and other charges incurred in connection with the borrowing of fundsand is considered as revenue expenditure for the year in which it is incurred. Borrowing cost attributed to theacquisition/improvement of qualifying capital assets and incurred till the commencement of commercial useof the assets is capitalised as cost of the assets,
Notes on the Balance Sheet and Profit and Loss Account
1. Estimated amount of contracts remaining to be executed on capital account and not provided for Rs.2145.55lakhs (2009-2010 : Rs.2402.78 lakhs)
2. (a) Contingent Liability in respect of Sales tax, Excise and Customs demands against which the Companyhas filed appeals Rs.76.52 lakhs (2009-2010: Rs.61.81 lakhs) - net of tax Rs.51.10 lakhs (2009-2010 :Rs.41.28 lakhs).
(b) Contingent Liability in respect of Income-tax demands against which the Company has filed appeals :Rs.942.10 lakhs (2009-2010 :Rs. 362.23 lakhs).
(c) Claims made against the Company not acknowledged as debts : Rs.714.42 lakhs (2009-2010 : Rs.784.29lakhs)
(d) Corporate Guarantee given on behalf of Subsidiary: Rs.1500.00 Lakhs (2009-2010 :Rs. 1500.00 Lakhs)
(e) As a matter of abundant caution, a cumulative provision for contingencies of Rs.205.00 lakhs has beenmade against items (a), (b) and (c) above, which are disputed by the Company.
Schedule Forming Part of the Balance Sheet and Profit and Loss Account (Contd.)

Fifty-Ninth Annual Report 2010-2011
66
3. Managerial Remuneration :
Managerial remuneration for Managing Director and Non- Whole time Directors
2010-2011 2009-2010Rupees Rupees
in lakhs in lakhs(a) Salaries (including Company’s Contribution to Provident Fund and
Superannuation Fund) 32.09 74.88
(b) Commission 132.86 105.00
(c) Perquisites 18.74 45.23
(d) Directors’ sitting fees 13.12 11.98
(e) ESOP 86.80 -
283.61 237.09
Note: The above figures do not include contribution to Gratuity Fund as separate figure is not available for theManaging Director, and retirement benefits of Rs.14.40 lakhs (2009-2010: Rs.14.40 lakhs) paid to a formerManaging Director.
Computation of Net Profit in accordance with Section 309 (5) of the Companies Act, 1956 :
2010-2011 2009-2010Rupees Rupees Rupees
in lakhs in lakhs in lakhs
Profit before taxes as per Profit and Loss Account 6,033.92 4,985.00
Add :
(i) Depreciation as per accounts 1,362.65 1,185.09
(ii) Managerial Remuneration 283.61 237.09
(iii) Provision for doubtful debts/advances 29.18 10.86
(iii) Provision for diminution in investment in Joint Venture 200.00 -
1,875.44 1,433.04
7,909.36 6,418.04
Less :
(i) Depreciation as per Section 350 1,362.65 1,185.09
(ii) Capital Profit 1,260.35 1,303.39
(iii) Diminution in Value of Finished Goods Stock(Refer Note 26- Page No 76) - 918.77
2,623.00 3,407.25
Net Profit as per Section 309 (5) 5,286.36 3,010.79
Commission:
(a) Managing Director 80.00 75.00
(b) Non-Wholetime Directors- 1% of Net Profit Rs.5286.36 lakhs 52.86 30.00
(2009-10: Rs.3010.79 lakhs) restricted to Rs.52.86 lakhs(2009-2010 Rs.30.00 lakhs)
132.86 105.00
Notes on the Balance Sheet and Profit and Loss Account (Contd.)

A Enterprise
67
4. Major components of deferred tax assets and liabilities are: 2010-2011 2009-2010Rupees Rupees
in lakhs in lakhs
Deferred Tax Liability
Depreciation 1,243.26 840.93
Less: Deferred Tax Assets
Retirement Benefits 162.28 209.99
Premium on Redemption of Debentures 2,863.20 342.17
Other Provisions 274.10 96.95
3,299.58 649.11
Net Deferred Tax Asset/(Liability) 2,056.32 (191.82)
2010-2011 2009-2010Rupees Rupees
5. (i) Schedule 1 Item 4 (p) General Expenses include : in lakhs in lakhs
(a) Auditors’ Remuneration -
Audit Fees 7.17 7.17
Fees for Taxation matters 1.37 1.10
Other Services 14.68 12.98
Reimbursement of out-of-pocket expenses 0.57 0.68
(b) Provision/ Write Off for doubtful debts/advances (net) 29.18 45.82
(ii) Expenses on Amalgamation /Securities/Warrant issue includeauditors remuneration -other services 4.41 0.88
6. Gain on foreign exchange fluctuation (net) credited to the profit and loss account amounted to Rs. 19.82 Lakhs(2009-2010 : Rs.10.68 lakhs).
7. There are no Micro, Small and Medium Enterprises , to whom the Company owes dues, which are outstandingfor more than 45 days as at 31st March, 2011. This information as required to be disclosed under the Micro,Small and Medium Enterprise Development Act, 2006 has been determined to the extent such parties havebeen identified on the basis of information available with the Company. This has been relied upon by theAuditors.
8. There are no amounts due and outstanding to be credited to Investor Education and Protection Fund as at31st March, 2011 except Rs.4.48 lakhs (2009-2010 : Rs.3.99 lakhs) which is held in abeyance due to legal casespending.
9. Out of the proceeds of the issue of Cumulative Convertible Preference Shares (CCPS) of Rs. 489.66 crores,Rs.168.25 crores have been utilised towards objects of the issue and pending utilisation the balance amount isinvested mainly in mutual funds and money market instruments
10. Provision for taxation is inclusive of the tax impact on account of the securities / warrant issue expenses andpremium on redemption of debentures debited to the Securities Premium Account. The Company has takencredit for MAT which it is entitled on future taxable profits.
Notes on the Balance Sheet and Profit and Loss Account (Contd.)
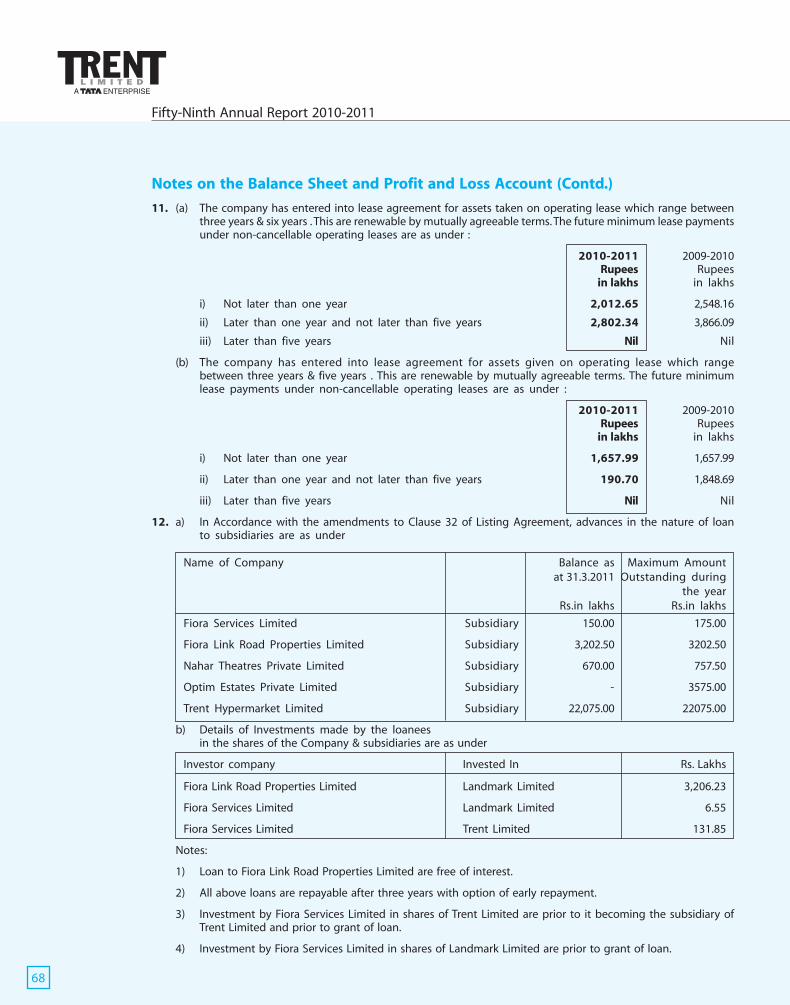
Fifty-Ninth Annual Report 2010-2011
68
11. (a) The company has entered into lease agreement for assets taken on operating lease which range betweenthree years & six years . This are renewable by mutually agreeable terms. The future minimum lease paymentsunder non-cancellable operating leases are as under :
2010-2011 2009-2010Rupees Rupees
in lakhs in lakhs
i) Not later than one year 2,012.65 2,548.16
ii) Later than one year and not later than five years 2,802.34 3,866.09
iii) Later than five years Nil Nil
(b) The company has entered into lease agreement for assets given on operating lease which rangebetween three years & five years . This are renewable by mutually agreeable terms. The future minimumlease payments under non-cancellable operating leases are as under :
2010-2011 2009-2010Rupees Rupees
in lakhs in lakhs
i) Not later than one year 1,657.99 1,657.99
ii) Later than one year and not later than five years 190.70 1,848.69
iii) Later than five years Nil Nil
12. a) In Accordance with the amendments to Clause 32 of Listing Agreement, advances in the nature of loanto subsidiaries are as under
Name of Company Balance as Maximum Amountat 31.3.2011 Outstanding during
the yearRs.in lakhs Rs.in lakhs
Fiora Services Limited Subsidiary 150.00 175.00
Fiora Link Road Properties Limited Subsidiary 3,202.50 3202.50
Nahar Theatres Private Limited Subsidiary 670.00 757.50
Optim Estates Private Limited Subsidiary - 3575.00
Trent Hypermarket Limited Subsidiary 22,075.00 22075.00
b) Details of Investments made by the loaneesin the shares of the Company & subsidiaries are as under
Investor company Invested In Rs. Lakhs
Fiora Link Road Properties Limited Landmark Limited 3,206.23
Fiora Services Limited Landmark Limited 6.55
Fiora Services Limited Trent Limited 131.85
Notes:
1) Loan to Fiora Link Road Properties Limited are free of interest.
2) All above loans are repayable after three years with option of early repayment.
3) Investment by Fiora Services Limited in shares of Trent Limited are prior to it becoming the subsidiary ofTrent Limited and prior to grant of loan.
4) Investment by Fiora Services Limited in shares of Landmark Limited are prior to grant of loan.
Notes on the Balance Sheet and Profit and Loss Account (Contd.)
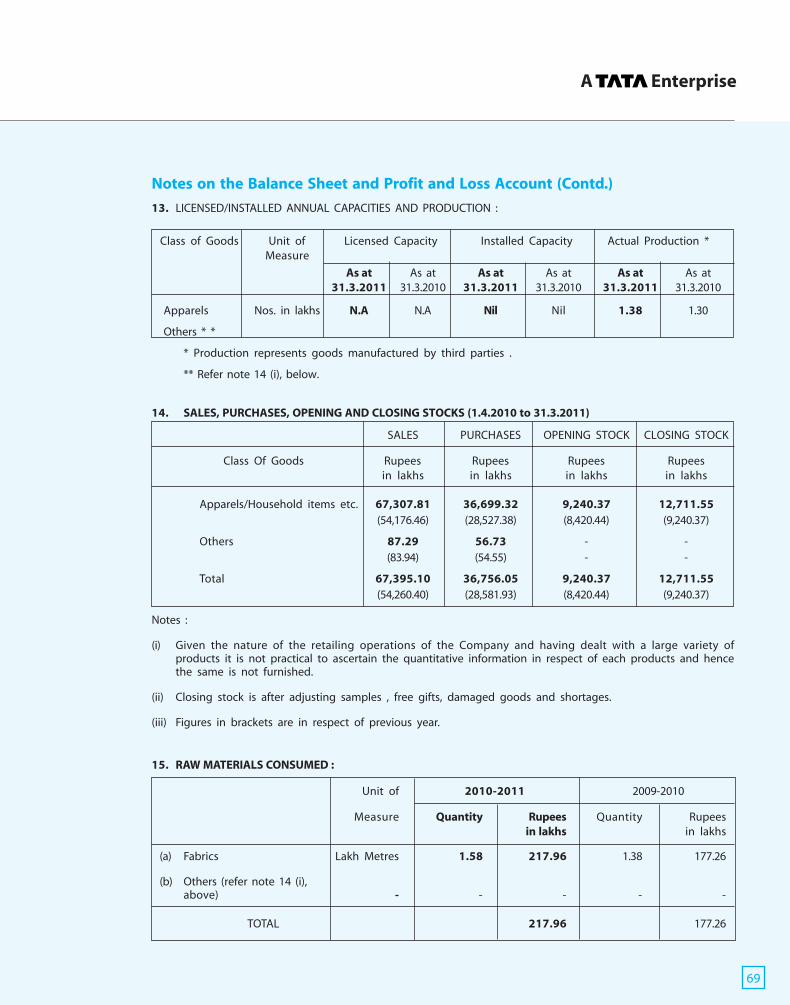
A Enterprise
69
13. LICENSED/INSTALLED ANNUAL CAPACITIES AND PRODUCTION :
Class of Goods Unit of Licensed Capacity Installed Capacity Actual Production *Measure
As at As at As at As at As at As at31.3.2011 31.3.2010 31.3.2011 31.3.2010 31.3.2011 31.3.2010
Apparels Nos. in lakhs N.A N.A Nil Nil 1.38 1.30
Others * *
* Production represents goods manufactured by third parties .
** Refer note 14 (i), below.
14. SALES, PURCHASES, OPENING AND CLOSING STOCKS (1.4.2010 to 31.3.2011)
SALES PURCHASES OPENING STOCK CLOSING STOCK
Class Of Goods Rupees Rupees Rupees Rupeesin lakhs in lakhs in lakhs in lakhs
Apparels/Household items etc. 67,307.81 36,699.32 9,240.37 12,711.55(54,176.46) (28,527.38) (8,420.44) (9,240.37)
Others 87.29 56.73 - -(83.94) (54.55) - -
Total 67,395.10 36,756.05 9,240.37 12,711.55(54,260.40) (28,581.93) (8,420.44) (9,240.37)
Notes :
(i) Given the nature of the retailing operations of the Company and having dealt with a large variety ofproducts it is not practical to ascertain the quantitative information in respect of each products and hencethe same is not furnished.
(ii) Closing stock is after adjusting samples , free gifts, damaged goods and shortages.
(iii) Figures in brackets are in respect of previous year.
15. RAW MATERIALS CONSUMED :
Unit of 2010-2011 2009-2010
Measure Quantity Rupees Quantity Rupeesin lakhs in lakhs
(a) Fabrics Lakh Metres 1.58 217.96 1.38 177.26
(b) Others (refer note 14 (i),above) - - - - -
TOTAL 217.96 177.26
Notes on the Balance Sheet and Profit and Loss Account (Contd.)

Fifty-Ninth Annual Report 2010-2011
70
16. VALUE OF IMPORTED AND INDIGENOUS MATERIALS CONSUMED :
2010-2011 2009-2010
Rupees % of Total Rupees % of Totalin lakhs Consumption in lakhs Consumption
(a) RAW MATERIALS :
(i) Imported 9.15 4 11.40 6
(ii) Indigenous 208.81 96 165.86 94
TOTAL 217.96 100 177.26 100
(b) PACKING MATERIALS
(i) Imported - - - -
(ii) Indigenous 339.68 100 207.57 100
TOTAL 339.68 100 207.57 100
17. VALUE OF IMPORTS ON C.I.F. BASIS :
2010-2011 2009-2010Rupees Rupees
in lakhs in lakhs
(a) Finished Products (including in -transit) 947.75 468.35
(b) Capital Goods 315.54 8.13
(c) Raw Material (Fabrics) - 1.26
TOTAL 1,263.29 477.74
18. EXPENDITURE IN FOREIGN CURRENCY :2010-2011 2009-2010
Rupees Rupeesin lakhs in lakhs
(a) Travelling Expenses 30.64 25.22
(b) Consultancy Fees (Net of Tax deducted at source) 31.88 47.15
(c) Payments on other accounts 219.74 22.91
TOTAL 282.26 95.28
19. EARNINGS IN FOREIGN CURRENCY :2010-2011 2009-2010
Rupees Rupeesin lakhs in lakhs
Sales of goods* 1,309.62 1,237.17
Fees - - 1,026.44
TOTAL 1,309.62 2,263.61
* Represents sale of goods which are collected in Foreign Currency through International Credit Cards,as certifiedby the collecting bankers.
20. SEGMENT REPORTINGThe main business of the Company is retailing. All other activities of the Company are incidental to the mainbusiness. Accordingly, there are no separate reportable segments in terms of the Accounting Standard 17 on“Segment Reporting” issued by ICAI.
Notes on the Balance Sheet and Profit and Loss Account (Contd.)

A Enterprise
71
21 EMPLOYEE BENEFITS(a) Defined Benefit Plans - Gratuity, Pension and Medical Benefits (As per actuarial valuations as on 31st March
2011) Rupees in lakhsGRATUITY (Fully funded) Pension
LIC Company and MedicalAdministered Administered Trust BenefitsTrust (See Note 1 Below) (non funded)
As on As on As on As on As on As on31st 31st 31st 31st 31st 31st
March, March, March, March, March, March,2011 2010 2011 2010 2011 2010
I Change in Obligation during the year ended 31st March 20111 Present value of obligations as at beginning of year 96.63 79.98 91.29 92.43 184.97 193.962 Present value of obligations transferred - - - - - -3 Liability taken over from other trust - - - - - -4 Liability extinguished - - - - - -5 Interest cost 9.30 8.26 7.03 7.02 13.56 14.056 Current Service Cost 25.67 23.25 5.61 6.45 - -7 Actuarial (gain)/loss on obligations (6.02) (2.93) 3.68 (14.61) (15.30) (6.34)8 Past Service Costs 21.32 - - - - -9 Benefits Paid (15.02) (11.93) (7.64) - (14.40) (16.71)10 Settlement Pending - - - - - -11 Present value of Defined Benefit Obligation at the end of the year 131.89 96.63 99.98 91.29 168.82 184.97
II Change in Assets during the Year ended 31st March 20111 Plan assets at the beginning of the year 97.80 95.47 99.29 97.27 - -2 Expected return on plan assets 8.72 7.16 7.45 7.30 - -3 Contributions by Employer 22.06 5.55 - - 14.40 16.714 Funds Transfer In 2.45 - - - - -5 Actual benefits paid (15.02) (11.93) (7.64) - (14.40) (16.71)6 Actuarial gains/ (losses) 0.46 1.55 1.19 (5.27) - -7 Plan Assets at the end of the year 114.02 97.80 102.75 99.29 - -
III Net Asset/(Liability) recognized in the Balance Sheet as at31st March 20111 Present Value of Defined Benefit Obligation as at 31st March 2011 131.89 96.63 99.98 91.29 168.82 184.972 Fair value of plan assets as at 31st March 2011 114.02 97.80 102.75 99.29 - -3 Fund status (Surplus/(Deficit)) (17.87) 1.17 2.77 8.00 (168.82) (184.97)4 Net Assets /(Liability) as at 31st March 2011 (17.87) 1.17 2.77 8.00 (168.82) (184.97)
IV Expenses recognized in the statement of Profit and Lossfor the year ended 31st March 20111 Current Service cost 25.67 23.25 5.61 6.45 - -2 Interest Cost 9.30 8.26 7.03 7.02 13.56 14.053 Expected return on plan assets (8.72) (7.16) (7.45) (7.30) - -4 Net Actuarial (Gains)/Losses (Net of Opening Actuarial
gain/(loss) adjustment) (6.48) (4.48) 2.49 (9.34) (15.30) (6.34)5 Past Service Cost 21.32 - - - - -6 Net effect of Transfer In (2.45) - - - - -7 Settlement Pending - - - - - -8 Expenses recognised in statement of Profit and Loss 41.10 19.87 5.24 (3.16) (1.74) 7.71
V The major categories of plan assets as a percentage of total plan1 Government of India Securities N.A. N.A. N.A. N.A. N.A. N.A.2 Corporate Bonds N.A. N.A. N.A. N.A. N.A. N.A.3 Special Deposit Scheme N.A. N.A. N.A. N.A. N.A. N.A.4 Equity Shares of Listed Companies N.A. N.A. N.A. N.A. N.A. N.A.5 Property N.A. N.A. N.A. N.A. N.A. N.A.6 Insurer Managed Funds 100% 100% 100% 100% N.A. N.A.7 Others N.A. N.A. N.A. N.A. N.A. N.A.Total 100% 100% 100% 100% N.A. N.A.
VI Method of valuation Projected Unit Credit MethodVII Expected Employers Contribution Next Year 40.00 40.00 5.68 5.31 N.A. N.A.VIII Actuarial Assumptions
1 Discount Rate 8.35% 7.70% 7.70% 7.70% 8.35% 7.70%2 Expected rate of return on plan assets 7.50% 7.50% 7.50% 7.50% N.A. N.A.3 Mortality Table LIC (1994-96) Ultimate N.A. N.A.4 Retirement Age 58 Years/ 58 Years/
60 years 60 years 60 years 60 years N.A. N.A.NOTES :1 The Company has approved an arrangement with TATA AIG Life Insurance Company Limited, for managing in fund in Self
Managed Gratuity Trust w.e.f. 1st February 2010. Accordingly, all the funds of the Trust have been managed by said insuranceCompany.
2 The estimates of future salary increases, considered in actuarial valuation, take account of inflation, seniority , promotion andother relevant factors, such as supply and demand in the employment market.
Notes on the Balance Sheet and Profit and Loss Account (Contd.)

Fifty-Ninth Annual Report 2010-2011
72
(b) Defined Benefit Plans - Provident Fund Contribution to Trust administered by the Company
The Guidance issued by the Accounting standard Board (ASB) on implementing AS-15, Employee benefits(revised 2005) states that provident fund set up by employers which requires interest short fall to be met bythe employer, needs to be treated as defined benefit plan. The Company administered trust The Trust hadreceived a letter dated 17/05/2010 from the Regional Commissioner of Provident Fund, Mumbai withdrawingthe relaxations granted to the establishment vide Order No. MH/ 13493 / PF / Exm. 17/ AST/1393 with effectfrom 01/04/2010 and instructing the establishment ot transfer the past accumulations of its employees tothe Regional PF Commissioner, Mumbai. Accordingly, the Board of Directors of Trent Ltd has passed resolutionas on 28/05/2010 for the surrender of Trust and the Trust has taken steps to transfer the past accumulationsof its employees to the Regional PF Commissioner, Mumbai.
(c) Leave Encashment (Long term compensated absences ) recognised as income for the year is Rs 67.33 Lakhs(2009-10 : Expense of Rs. 145.67 Lakhs)
d) Defined Contribution Plans 2010-2011 2009-2010
Company’s Contributions to defined Contribution Plans recognisedas expense for the year as under:
1 Towards Superannuation Fund 12.83 14.99
2 Towards Governement Administered Provident Fund / Family Pension Fund 150.07 120.51
3 Towards Employees State Insurance / Labour Welfare Fund 83.14 48.76
22. RELATED PARTY TRANSACTIONS :
Related parties are as certified by the management
22.01 Parties where control exists
Trent Brands Limited - Subsidiary Company.(100% Equity Share Capital is held by Trent Limited as at 31st March, 2011)
Fiora Services Limited - Subsidiary Company.(25.67% Equity Share Capital is held by Trent Limited as at 31st March, 2011)(64.20% Equity Share Capital is held by Trent Brands Limited as at 31st March, 2011)
Nahar Theatres Private Limited - Subsidiary Company(100% Equity Share Capital is held by Trent Limited as at 31st March, 2011)
Fiora Link Road Properties Limited - Subsidiary Company(100% Equity Share Capital is held by Trent Limited as at 31st March, 2011)
Landmark Limited - Subsidiary Company(57.39% Equity Share Capital is held by Trent Limited as at 31st March, 2011)(17.66% Equity Share Capital is held by wholly owned subsidiary companies as at 31st March, 2011)
Westland Limited - Subsidiary Company(96.64% Equity Share Capital is held by Trent Limited as at 31st March, 2011)
Trent Retail Services private Limited (Formerly Regent Management Private Limited ) - Subsidiary Company(100% Equity Share Capital is held by Landmark Limited as at 31st March, 2011)
Landmark E-Tail Private Limited - Subsidiary Company(100% Equity Share Capital is held by Landmark Limited as at 31st March, 2011)
Trent Hypermarket Limited - Subsidiary Company.(100% Equity Share Capital is held by Trent Limited as at 31st March, 2011)
Trent Global Holdings Limited-Subsidiary Company(100% Equity Share Capital is held by Trent Limited as at 31st March, 2011)
Optim Estates Private Limited (wef 30th April 2010)(Merged with Trent Hyper Market Limited-Effective date 20th September 2010)
Notes on the Balance Sheet and Profit and Loss Account (Contd.)

A Enterprise
73
22.02 Other Related Parties with whom transactions have taken place during the year:
Associates:
Tata Sons Ltd.(Holds more than 20% of the Share Capital of the Company)
Joint Ventures
Trexa Admc Private Limited(50% Equity Share Capital is held by Trent Limited as at 31st March, 2011)
Inditex Trent Retail India Private Limited(49% Equity Share Capital is held by Trent Limited as at 31st March, 2011)
22.03 Directors of the Company
Managing Director Mr.N.N.Tata (resigned on 11th August 2010)
Non Executive Directors Mr. F.K. KavaranaMr.B.S.Bhesania (retired on 18th August 2010)Mr.A.D.CooperMr.K.N.SuntookMr.N.N.Tata (wef 12th August 2010 till 18th August 2010.)Appointed as an Additional Director and Vice Chairman wef19th August 2010Mr.Zubin Dubash (wef 26th April 2010)Mr.Bhaskar Bhat (wef 27th September 2010)
Details of remuneration to directors is disclosed in Note No. 3 (Page No. 66)2010-2011 2009-2010
Rupees Rupeesin lakhs in lakhs
22.04 Sales to and Other recoveries from related parties
a) Subsidiaries 844.68 550.74
b) Associates 9.32 5.63
c) Joint Venture - 45.66
22.05 Purchase/other services from related parties
a) Subsidiaries 1675.68 1230.87
b) Associates 493.35 429.69
22.06 Purchases of Fixed Assets from related parties
a) Subsidiaries - 36.61
22.07 Sale of Fixed Assets to related parties
a) Subsidiaries - 11.55
22.08 Interest/Dividend received from related parties
a) Subsidiaries 1,700.24 770.40
b) Associates 14.00 14.00
22.09 Security Deposit Repaid
a) Subsidiaries 96.00 -
b) Associates - -
Notes on the Balance Sheet and Profit and Loss Account (Contd.)
{
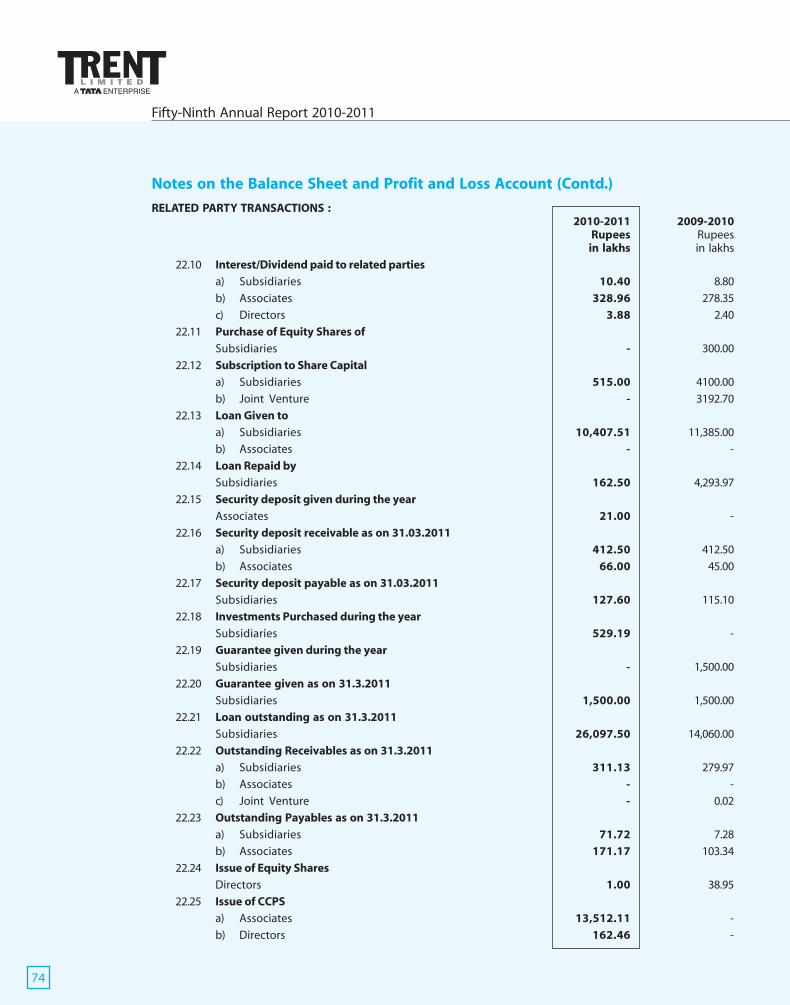
Fifty-Ninth Annual Report 2010-2011
74
RELATED PARTY TRANSACTIONS :2010-2011 2009-2010
Rupees Rupeesin lakhs in lakhs
22.10 Interest/Dividend paid to related parties
a) Subsidiaries 10.40 8.80
b) Associates 328.96 278.35
c) Directors 3.88 2.40
22.11 Purchase of Equity Shares of
Subsidiaries - 300.00
22.12 Subscription to Share Capital
a) Subsidiaries 515.00 4100.00
b) Joint Venture - 3192.70
22.13 Loan Given to
a) Subsidiaries 10,407.51 11,385.00
b) Associates - -
22.14 Loan Repaid by
Subsidiaries 162.50 4,293.97
22.15 Security deposit given during the year
Associates 21.00 -
22.16 Security deposit receivable as on 31.03.2011
a) Subsidiaries 412.50 412.50
b) Associates 66.00 45.00
22.17 Security deposit payable as on 31.03.2011
Subsidiaries 127.60 115.10
22.18 Investments Purchased during the year
Subsidiaries 529.19 -
22.19 Guarantee given during the year
Subsidiaries - 1,500.00
22.20 Guarantee given as on 31.3.2011
Subsidiaries 1,500.00 1,500.00
22.21 Loan outstanding as on 31.3.2011
Subsidiaries 26,097.50 14,060.00
22.22 Outstanding Receivables as on 31.3.2011
a) Subsidiaries 311.13 279.97
b) Associates - -
c) Joint Venture - 0.02
22.23 Outstanding Payables as on 31.3.2011
a) Subsidiaries 71.72 7.28
b) Associates 171.17 103.34
22.24 Issue of Equity Shares
Directors 1.00 38.95
22.25 Issue of CCPS
a) Associates 13,512.11 -
b) Directors 162.46 -
Notes on the Balance Sheet and Profit and Loss Account (Contd.)

A Enterprise
75
23. Interests in Joint Venture:
The Company’s interests, as a venture, in jointly controlled entities are:
Name Country of % of ownership % of ownershipIncorporation interest as at interest as at
31st March, 2011 31st March, 2010
Trexa ADMC Private Limited India 50% 50%
Inditex Trent Retail India Private Limited India 49% 49%
For the year ended For the year ended31st March 2011 31st March 2010
Rupees Rupeesin lakhs in lakhs
I Income
1. Income From Operations 7,247.46 24.01
2. Other Income 67.19 30.54
II Expenditure
1. Expenses 5,421.94 230.55
2. Depreciation 261.66 4.00
III Assets:
1. Fixed Assets 3,310.60 866.33
2. Investments 0.43 0.41
3. Deferred tax Asset/(Liabilities) 10.84 (0.03)
4. Current Assets Loans & Advances
- Cash and bank balances 1,409.66 2,548.17
- Loans and Advances 830.88 332.24
- Debtors 1.86 1.86
- Inventories 854.96 38.03
- Miscellaneous Expenditure - -(to the extent not written off or adjusted)
IV Liabilities:
Current Liabilities 2,202.46 669.65
Provisions 7.34 4.83
Notes on the Balance Sheet and Profit and Loss Account (Contd.)
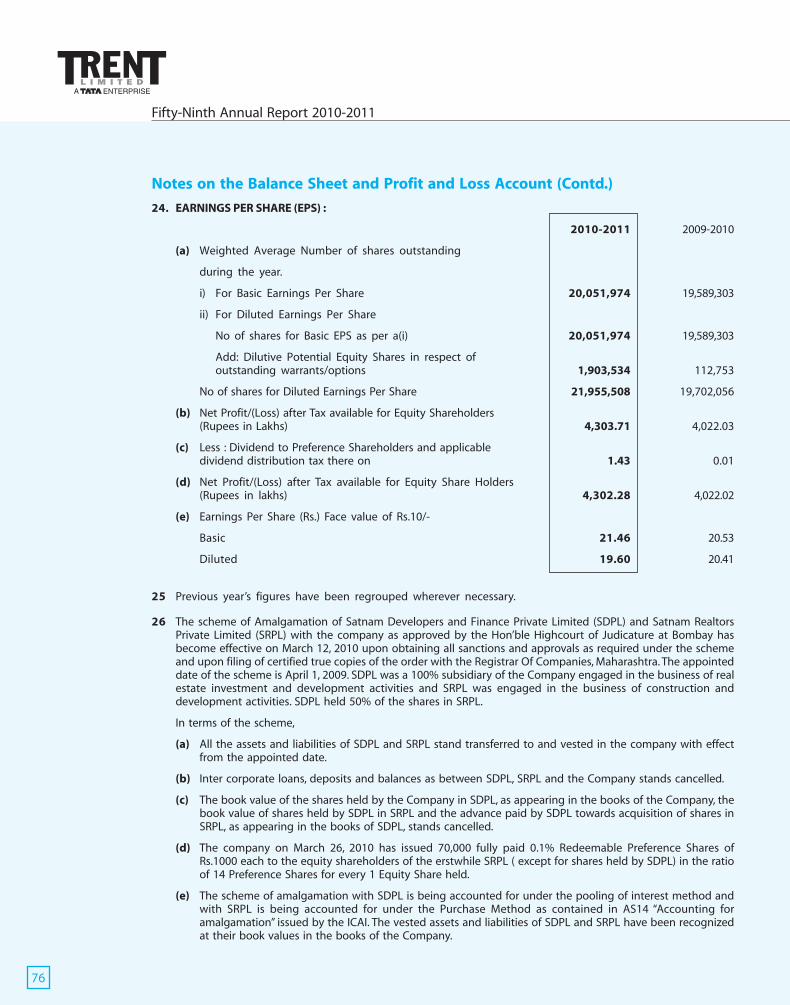
Fifty-Ninth Annual Report 2010-2011
76
24. EARNINGS PER SHARE (EPS) :
2010-2011 2009-2010
(a) Weighted Average Number of shares outstanding
during the year.
i) For Basic Earnings Per Share 20,051,974 19,589,303
ii) For Diluted Earnings Per Share
No of shares for Basic EPS as per a(i) 20,051,974 19,589,303
Add: Dilutive Potential Equity Shares in respect ofoutstanding warrants/options 1,903,534 112,753
No of shares for Diluted Earnings Per Share 21,955,508 19,702,056
(b) Net Profit/(Loss) after Tax available for Equity Shareholders(Rupees in Lakhs) 4,303.71 4,022.03
(c) Less : Dividend to Preference Shareholders and applicabledividend distribution tax there on 1.43 0.01
(d) Net Profit/(Loss) after Tax available for Equity Share Holders(Rupees in lakhs) 4,302.28 4,022.02
(e) Earnings Per Share (Rs.) Face value of Rs.10/-
Basic 21.46 20.53
Diluted 19.60 20.41
25 Previous year’s figures have been regrouped wherever necessary.
26 The scheme of Amalgamation of Satnam Developers and Finance Private Limited (SDPL) and Satnam RealtorsPrivate Limited (SRPL) with the company as approved by the Hon’ble Highcourt of Judicature at Bombay hasbecome effective on March 12, 2010 upon obtaining all sanctions and approvals as required under the schemeand upon filing of certified true copies of the order with the Registrar Of Companies, Maharashtra. The appointeddate of the scheme is April 1, 2009. SDPL was a 100% subsidiary of the Company engaged in the business of realestate investment and development activities and SRPL was engaged in the business of construction anddevelopment activities. SDPL held 50% of the shares in SRPL.
In terms of the scheme,
(a) All the assets and liabilities of SDPL and SRPL stand transferred to and vested in the company with effectfrom the appointed date.
(b) Inter corporate loans, deposits and balances as between SDPL, SRPL and the Company stands cancelled.
(c) The book value of the shares held by the Company in SDPL, as appearing in the books of the Company, thebook value of shares held by SDPL in SRPL and the advance paid by SDPL towards acquisition of shares inSRPL, as appearing in the books of SDPL, stands cancelled.
(d) The company on March 26, 2010 has issued 70,000 fully paid 0.1% Redeemable Preference Shares ofRs.1000 each to the equity shareholders of the erstwhile SRPL ( except for shares held by SDPL) in the ratioof 14 Preference Shares for every 1 Equity Share held.
(e) The scheme of amalgamation with SDPL is being accounted for under the pooling of interest method andwith SRPL is being accounted for under the Purchase Method as contained in AS14 “Accounting foramalgamation” issued by the ICAI. The vested assets and liabilities of SDPL and SRPL have been recognizedat their book values in the books of the Company.
Notes on the Balance Sheet and Profit and Loss Account (Contd.)

A Enterprise
77
(f ) The costs and expenses amounting to Rs. 120.02 lakhs (net of tax Rs.80.15 lakhs) incurred forimplementation of the scheme have been adjusted against the general reserve of the company.
(g) The deficit of Rs.2519.32 lakhs arising due to the difference between the value of assets over the valueof liabilities of SDPL and SRPL and the face value of the preference shares issued by the company andafter adjusting the diminution in the value of Long term investments to the extent of Rs.186.09 lakhsand Finished goods inventory Rs. 918.77 lakhs (net of tax - Rs.606.48 lakhs) as approved by the boardhas been adjusted first against the amalgamation reserve to the extent of Rs.1492.95 lakhs and thebalance Rs.1026.37 lakhs against the general reserve.
27. On 30th April 2010 the Company acquired 100% Equity Shares and Preference Shares of Optim Estate PrivateLimited making it a wholly owned subsidiary of the company. The Scheme of Amalgamation of Optim EstatesPrivate Limited with Trent Hypermarket Limited (100 % subsidiary of the Company) as approved by the Hon’ableHighcourt of judicature at Bombay is effective 20th September 2010 . The appointed date of the Scheme is 1stApril 2009. In terms of the Scheme Trent Hypermarket Limited has issued the Company 1,50,000 Equity Sharesof Rs 10 each and 10,00,000 10% p.a. Redeemable Preference Shares of Rs 10 each in consideration against itsholdings in Optim Estates Private Limited.
28. Balance Sheet Abstract and Company’s General Business Profile as required in terms of Part IV of Schedule VI ofthe Companies Act, 1956 is attached herewith.
Notes on the Balance Sheet and Profit and Loss Account (Contd.)
Signatures to Schedules ‘1’ to ‘5’ and ‘A’ to ‘M’ and Notes.
As per our report attached. For and on behalf of the Board,
For N. M. RAIJI & CO., F. K. KAVARANA ChairmanChartered Accountants
N. N. TATA Vice Chairman
A. D. COOPERZUBIN DUBASH Directors
Y. N. THAKKAR M. M. SURTI BHASKAR BHATPartner Company Secretary
Mumbai, 25th May 2011
}

Fifty-Ninth Annual Report 2010-2011
78
Balance Sheet Abstract and Company’s General Business Profile
I. Registration Details: :CIN No. : L24240MH1952PLC008951State Code : 11Balance Sheet Date : 31.3.2011
II. Capital raised during the year(Amount in Rupees Thousands):Public Issue : NilRights Issue : 4896555Bonus Issue : NilPrivate Placement : 218
III. Position of mobilisation and deployment of funds(Amount in Rupees Thousands):Total Liabilities : 13569536Total Assets : 13569536
Sources of Funds:Paid-up Capital : 359597Warrant Application MoneyReserves and Surplus : 10459939Secured Loans : 1000000Unsecured Loans : 1750000
Application of Funds: :Net Fixed Assets : 2917476Investments : 4249687Net Current Assets : 6196741Net Deferred Tax : 205632Miscellaneous Expenditure : -Accumulated Losses : Nil
IV. Performance of Company(Amount in Rupees Thousands):Turnover* : 7681414Total Expenditure : 7049622Profit before Tax : 631792Profit after Tax : 430371Earnings per share (in Rs.) :Basic : 21.46Diluted : 19.60Dividend Rate (%) : 75
V. Generic Names of three principal products/services of the Company:Item Code No. (ITC CODE) Product Description1. 62 07 : Menswear2. 62 08 : Ladieswear3. 62 09 : Childrenswear
*Represents Income from Operations and other income
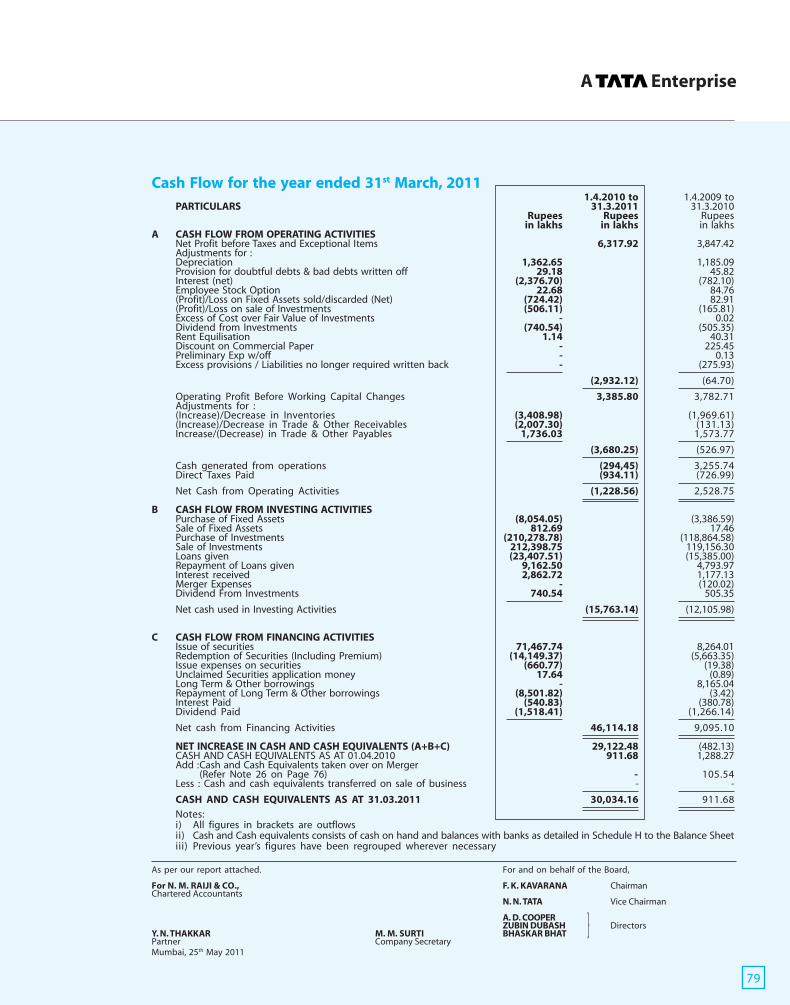
A Enterprise
79
Cash Flow for the year ended 31st March, 20111.4.2010 to 1.4.2009 to
PARTICULARS 31.3.2011 31.3.2010Rupees Rupees Rupees
in lakhs in lakhs in lakhsA CASH FLOW FROM OPERATING ACTIVITIES
Net Profit before Taxes and Exceptional Items 6,317.92 3,847.42Adjustments for :Depreciation 1,362.65 1,185.09Provision for doubtful debts & bad debts written off 29.18 45.82Interest (net) (2,376.70) (782.10)Employee Stock Option 22.68 84.76(Profit)/Loss on Fixed Assets sold/discarded (Net) (724.42) 82.91(Profit)/Loss on sale of Investments (506.11) (165.81)Excess of Cost over Fair Value of Investments - 0.02Dividend from Investments (740.54) (505.35)Rent Equilisation 1.14 40.31Discount on Commercial Paper - 225.45Preliminary Exp w/off - 0.13Excess provisions / Liabilities no longer required written back - (275.93)
(2,932.12) (64.70)
Operating Profit Before Working Capital Changes 3,385.80 3,782.71Adjustments for :(Increase)/Decrease in Inventories (3,408.98) (1,969.61)(Increase)/Decrease in Trade & Other Receivables (2,007.30) (131.13)Increase/(Decrease) in Trade & Other Payables 1,736.03 1,573.77
(3,680.25) (526.97)
Cash generated from operations (294,45) 3,255.74Direct Taxes Paid (934.11) (726.99)
Net Cash from Operating Activities (1,228.56) 2,528.75
B CASH FLOW FROM INVESTING ACTIVITIESPurchase of Fixed Assets (8,054.05) (3,386.59)Sale of Fixed Assets 812.69 17.46Purchase of Investments (210,278.78) (118,864.58)Sale of Investments 212,398.75 119,156.30Loans given (23,407.51) (15,385.00)Repayment of Loans given 9,162.50 4,793.97Interest received 2,862.72 1,177.13Merger Expenses - (120.02)Dividend From Investments 740.54 505.35
Net cash used in Investing Activities (15,763.14) (12,105.98)
C CASH FLOW FROM FINANCING ACTIVITIESIssue of securities 71,467.74 8,264.01Redemption of Securities (Including Premium) (14,149.37) (5,663.35)Issue expenses on securities (660.77) (19.38)Unclaimed Securities application money 17.64 (0.89)Long Term & Other borrowings - 8,165.04Repayment of Long Term & Other borrowings (8,501.82) (3.42)Interest Paid (540.83) (380.78)Dividend Paid (1,518.41) (1,266.14)
Net cash from Financing Activities 46,114.18 9,095.10
NET INCREASE IN CASH AND CASH EQUIVALENTS (A+B+C) 29,122.48 (482.13)CASH AND CASH EQUIVALENTS AS AT 01.04.2010 911.68 1,288.27Add :Cash and Cash Equivalents taken over on Merger
(Refer Note 26 on Page 76) - 105.54Less : Cash and cash equivalents transferred on sale of business - -
CASH AND CASH EQUIVALENTS AS AT 31.03.2011 30,034.16 911.68
Notes:i) All figures in brackets are outflowsii) Cash and Cash equivalents consists of cash on hand and balances with banks as detailed in Schedule H to the Balance Sheetiii) Previous year’s figures have been regrouped wherever necessary
As per our report attached. For and on behalf of the Board,
For N. M. RAIJI & CO., F. K. KAVARANA ChairmanChartered Accountants
N. N. TATA Vice Chairman
A. D. COOPERZUBIN DUBASH Directors
Y. N. THAKKAR M. M. SURTI BHASKAR BHATPartner Company SecretaryMumbai, 25th May 2011
}
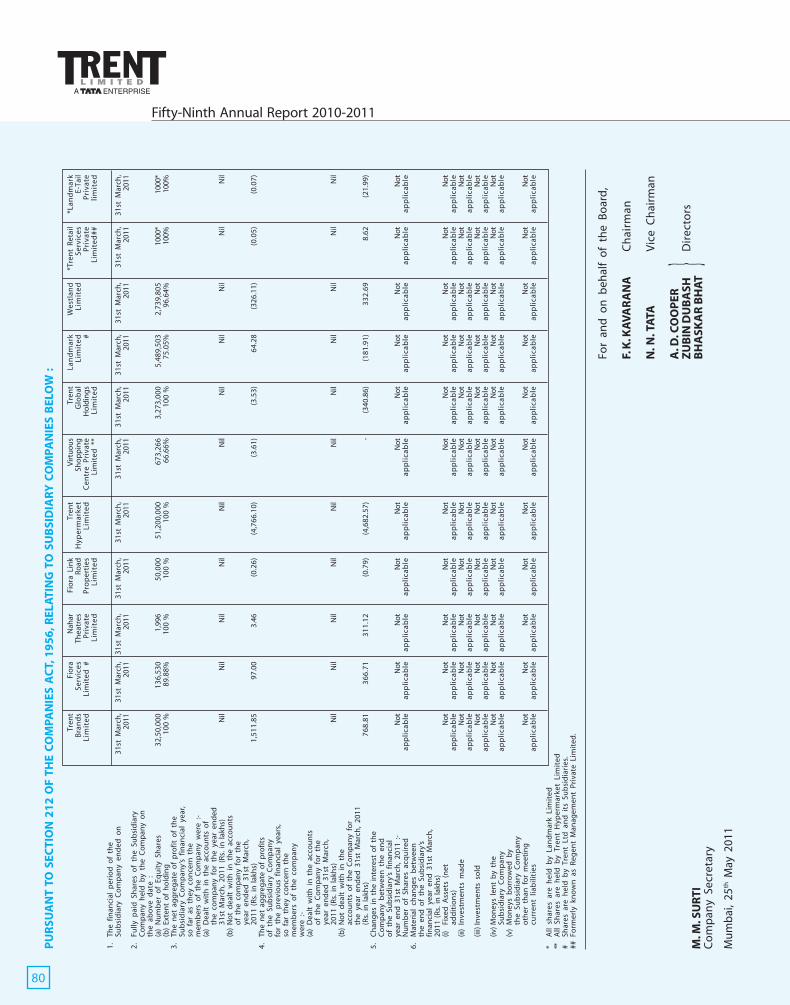
Fifty-Ninth Annual Report 2010-2011
80
Tren
tFi
ora
Nah
arFi
ora
Lin
kTr
ent
Vir
tuo
us
Tren
tLa
nd
mar
kW
estl
and
*Tre
nt
Ret
ail
*Lan
dm
ark
Bra
nd
sSe
rvic
es T
hea
tres
Road
Hyp
erm
arke
t S
ho
pp
ing
Glo
bal
Lim
ite
dLi
mit
ed
Serv
ices
E-T
ail
Lim
ite
dLi
mit
ed #
Pri
vate
Pro
per
ties
Lim
ite
dC
entr
e P
riva
teH
old
ing
s#
Pri
vate
Pri
vate
Lim
ite
dLi
mit
ed
Lim
ited
**
Lim
ite
dLi
mit
ed
##li
mit
ed
1.
The
fin
anci
al p
erio
d o
f th
eSu
bsi
dia
ry C
om
pan
y en
ded
on
31st
Mar
ch,
31st
Mar
ch,
31st
Mar
ch,
31st
Mar
ch,
31st
Mar
ch,
31st
Mar
ch,
31st
Mar
ch,
31st
Mar
ch,
31st
Mar
ch,
31st
Mar
ch,
31st
Mar
ch,
2011
2011
2011
2011
2011
2011
2011
2011
2011
2011
2011
2.
Fully
pai
d S
har
es o
f th
e Su
bsi
dia
ryC
om
pan
y h
eld
by
the
Co
mp
any
on
the
abo
ve d
ate
:(a
)N
um
ber
of
Equ
ity
Shar
es32
,50,
000
136,
530
1,99
650
,000
51,2
00,0
0067
3,26
63,
273,
000
5,48
9,50
32,
739,
805
1000
*10
00*
(b)
Exte
nt
of
ho
ldin
g10
0 %
89.8
8%10
0 %
100
%10
0 %
66.6
6%10
0 %
75.0
5%96
.64%
100%
100%
3.
The
net
ag
gre
gat
e o
f p
rofi
t o
f th
eSu
bsi
dia
ry C
om
pan
y’s
fin
anci
al y
ear,
so f
ar a
s th
ey c
on
cern
th
em
emb
ers
of
the
Co
mp
any
wer
e :-
(a)
Dea
lt w
ith
in
th
e ac
cou
nts
of
the
com
pan
y fo
r th
e ye
ar e
nd
ed31
st M
arch
, 20
11 (
Rs.
in
lak
hs)
Nil
Nil
Nil
Nil
Nil
Nil
Nil
Nil
Nil
Nil
Nil
(b)
No
t d
ealt
wit
h i
n t
he
acco
un
tso
f th
e co
mp
any
for
the
year
en
ded
31s
t M
arch
,20
11 (
Rs.
in
lak
hs)
1,51
1.85
97.0
03.
46(0
.26)
(4,7
66.1
0)(3
.61)
(3.5
3)64
.28
(326
.11)
(0.0
5)(0
.07)
4.
The
net
ag
gre
gat
e o
f p
rofi
tso
f th
e Su
bsi
dia
ry C
om
pan
yfo
r th
e p
revi
ou
s fi
nan
cial
yea
rs,
so f
ar t
hey
co
nce
rn t
he
mem
ber
s o
f th
e co
mp
any
wer
e :-
(a)
Dea
lt w
ith
in
th
e ac
cou
nts
of
the
Co
mp
any
for
the
year
en
ded
31s
t M
arch
,20
11 (
Rs.
in
lak
hs)
Nil
Nil
Nil
Nil
Nil
Nil
Nil
Nil
Nil
Nil
Nil
(b)
No
t d
ealt
wit
h i
n t
he
acco
un
ts o
f th
e C
om
pan
y fo
rth
e ye
ar e
nd
ed 3
1st
Mar
ch,
2011
(Rs.
in
lak
hs)
768.
8136
6.71
311.
12(0
.79)
(4,6
82.5
7)-
(340
.86)
(181
.91)
332.
698.
62(2
1.99
)5
.C
han
ges
in
th
e in
tere
st o
f th
eC
om
pan
y b
etw
een
th
e en
do
f th
e Su
bsi
dia
ry’s
fin
anci
alye
ar e
nd
31s
t M
arch
, 20
11 :
-N
otN
otN
otN
otN
otN
otN
otN
otN
otN
otN
otN
um
ber
of
Shar
es a
cqu
ired
ap
pli
cab
leap
pli
cab
leap
pli
cab
leap
pli
cab
leap
pli
cab
leap
pli
cab
leap
pli
cab
leap
pli
cab
leap
pli
cab
leap
pli
cab
leap
pli
cab
le6
.M
ater
ial
chan
ges
bet
wee
nth
e en
d o
f th
e Su
bsi
dia
ry’s
fin
anci
al y
ear
end
31s
t M
arch
,20
11 (
Rs.
in
lak
hs)
(i)Fi
xed
Ass
ets
(net
Not
Not
Not
Not
Not
Not
Not
Not
Not
Not
Not
add
itio
ns)
ap
pli
cab
leap
pli
cab
leap
pli
cab
leap
pli
cab
leap
pli
cab
leap
pli
cab
leap
pli
cab
leap
pli
cab
leap
pli
cab
leap
pli
cab
leap
pli
cab
le(ii
)In
vest
men
ts m
ade
Not
Not
Not
Not
Not
Not
Not
Not
Not
Not
Not
ap
pli
cab
leap
pli
cab
leap
pli
cab
leap
pli
cab
leap
pli
cab
leap
pli
cab
leap
pli
cab
leap
pli
cab
leap
pli
cab
leap
pli
cab
leap
pli
cab
le(ii
i)In
vest
men
ts s
old
Not
Not
Not
Not
Not
Not
Not
Not
Not
Not
Not
app
lica
ble
app
lica
ble
app
lica
ble
app
lica
ble
app
lica
ble
app
lica
ble
app
lica
ble
app
lica
ble
app
lica
ble
app
lica
ble
app
lica
ble
(iv)M
on
eys
len
t b
y th
eN
otN
otN
otN
otN
otN
otN
otN
otN
otN
otN
otSu
bsi
dia
ry C
om
pan
yap
pli
cab
leap
pli
cab
leap
pli
cab
leap
pli
cab
leap
pli
cab
leap
pli
cab
leap
pli
cab
leap
pli
cab
leap
pli
cab
leap
pli
cab
leap
pli
cab
le(v
)M
on
eys
bo
rro
wed
by
the
Sub
sid
iary
Co
mp
any
oth
er t
han
fo
r m
eeti
ng
Not
Not
Not
Not
Not
Not
Not
Not
Not
Not
Not
curr
ent
liab
iliti
esap
pli
cab
leap
pli
cab
leap
pli
cab
leap
pli
cab
leap
pli
cab
leap
pli
cab
leap
pli
cab
leap
pli
cab
leap
pli
cab
leap
pli
cab
leap
pli
cab
le
*A
ll sh
ares
are
hel
d b
y La
nd
mar
k Li
mit
ed**
All
Shar
es a
re h
eld
by
Tren
t H
yper
mar
ket
Lim
ited
#Sh
ares
are
hel
d b
y Tr
ent
Ltd
an
d i
ts S
ub
sid
iari
es.
##Fo
rmer
ly k
no
wn
as
Reg
ent
Man
agem
ent
Pri
vate
Lim
ited
.
PU
RSU
AN
T TO
SEC
TIO
N 2
12
OF
THE
CO
MPA
NIE
S A
CT,
19
56
, REL
ATI
NG
TO
SU
BSI
DIA
RY
CO
MPA
NIE
S B
ELO
W :
For
and
on
beh
alf
of
the
Bo
ard
,
F. K
. KA
VA
RA
NA
Ch
airm
an
N. N
. TA
TAV
ice
Ch
airm
an
A. D
. CO
OP
ERZ
UB
IN D
UB
ASH
Dir
ecto
rsB
HA
SKA
R B
HA
T}
M. M
. SU
RTI
Co
mp
any
Secr
etar
y
Mu
mb
ai,
25th
May
201
1

A Enterprise
81
1. We have audited the attached Consolidated Balance Sheet of TRENT LIMITED (“the Company”) and
its subsidiaries, collectively referred to as “the Group”, as at 31st March 2011, and also the Consolidated
Profit and Loss Account and the Consolidated Cash Flow Statement for the year ended on that date
annexed thereto. These Consolidated Financial Statements are the responsibility of the Company’s
management. Our responsibility is to express an opinion on these financial statements based on our
audit.
2. We conducted our audit in accordance with auditing standards generally accepted in India. Those
standards require that we plan and perform the audit to obtain reasonable assurance about whether
the financial statements are free of material misstatements. An audit includes examining, on a test
basis, evidence supporting the amounts and disclosures in the financial statements. An audit also
includes assessing the accounting principles used and significant estimates made by management,
as well as evaluating the overall financial statement presentation. We believe that our audit provides
a reasonable basis for our opinion.
3. a) We did not audit the financial statements of the subsidiary Landmark Limited and its subsidiaries
namely Landmark E-Tail Private Limited and Regent Management Private Limited. The
consolidated financial statements of Landmark Limited and its subsidiaries reflect total net assets
of Rs. 10163.70 lakhs as at 31st March 2011 and total revenue of Rs. 26192.80 lakhs and the net
cash outflow amounting to Rs. 32.89 lakhs for the year ended on that date, as considered in the
consolidated financial statements. These financial statements and other information of the
subsidiaries have been audited by other firms of Chartered Accountants, and our opinion, in so
far as it relates to the amounts included in respect of the subsidiaries is based solely on their
audit reports.
b) We did not audit the financial statements of the subsidiary Westland Limited, whose financial
statements reflect total net assets of Rs.1092.05 lakhs as at 31st March 2011 and total revenue of
Rs. 3812.95 lakhs and the net cash outflow amounting to Rs.3.44 lakhs for the year ended on
that date, as considered in the consolidated financial statements. These financial statements and
other information of the subsidiary have been audited by other firm of Chartered Accountants
and our opinion, in so far as it relates to the amounts included in respect of the subsidiary are
based solely on their audit report.
c) We did not audit the financial statements of the foreign subsidiary Trent Global Holdings Limited,
whose financial statements reflect total net assets of Rs. 11.68 lakhs as at 31st March 2011 and
Auditors’ Report on the Consolidated Financial Statements to the Board of Directors ofTrent Limited

Fifty-Ninth Annual Report 2010-2011
82
total revenue of Rs. 2.78 lakhs and the net cash outflow amounting to Rs.6.40 lakhs for the year
ended on that date, as considered in the consolidated financial statements. These financial
statements and other information of the subsidiary have been audited by other firm of Chartered
Accountants, duly qualified to act as auditor in the country of incorporation of such subsidiary
and our opinion, in so far as it relates to the amounts included in respect of the subsidiary are
based solely on their audit report.
4. a) We did not audit the financial statements of the joint venture Trexa ADMC Private Limited,
whose financial statements reflect total net assets of Rs.28.53 lakhs as at 31st March 2011 and
total revenue of Rs.0.56 lakhs and the net cash outflow amounting to Rs12.86 lakhs for the year
ended on that date, as considered in the consolidated financial statements. These financial
statements and other information of the joint venture have been audited by other firm of
Chartered Accountants, and our opinion, in so far as it relates to the amounts included in respect
of the joint venture are based solely on their audit report.
b) We did not audit the financial statements of the joint venture Inditex Trent Retail India Private
Limited, whose financial statements reflect total net assets of Rs.8561.54 lakhs as at 31st March
2011 and total revenue of Rs.14927.30 lakhs and the net cash outflow amounting to Rs.2310.37
lakhs for the year ended on that date, as considered in the consolidated financial statements.
These financial statements and other information of the joint venture have been audited by
other firm of Chartered Accountants, and our opinion, in so far as it relates to the amounts
included in respect of the joint venture are based solely on their audit report.
5. We report that the Consolidated Financial Statements have been prepared by the Company’s
management in accordance with the requirements of Accounting Standard (AS) 21 - Consolidated
Financial Statements and Accounting Standard (AS) 27 - Financial Reporting of Interest in Joint
Ventures issued by The Institute of Chartered Accountants of India and on the basis of the separate
audited / certified financial statements of the Company and its subsidiaries included in the
Consolidated Financial Statements.
6. Based on the audit and on consideration of the reports of the other auditors on the separate financial
statements and on the other financial information of the components and the accounts as explained
in paragraph 5 above; in our opinion and to the best of our information and according to the
explanations given to us, the attached Consolidated Financial Statements read together with Notes

A Enterprise
83
thereon, give a true and fair view in conformity with the accounting principles generally accepted
in India:
(a) in the case of the Consolidated Balance Sheet, of the state of affairs of the Group as at 31st
March 2011;
(b) in the case of the Consolidated Profit and Loss Account, of the profit of the Group for the year
ended on that date; and
(c) in the case of the Consolidated Cash Flow Statement, of the cash flows of the Group for the year
ended on that date.
For N. M. RAIJI & CO.,
Chartered Accountants
(Registration No. 108296W)
Y.N. THAKKAR
Partner
Membership No. 33329
Mumbai, 25th May, 2011
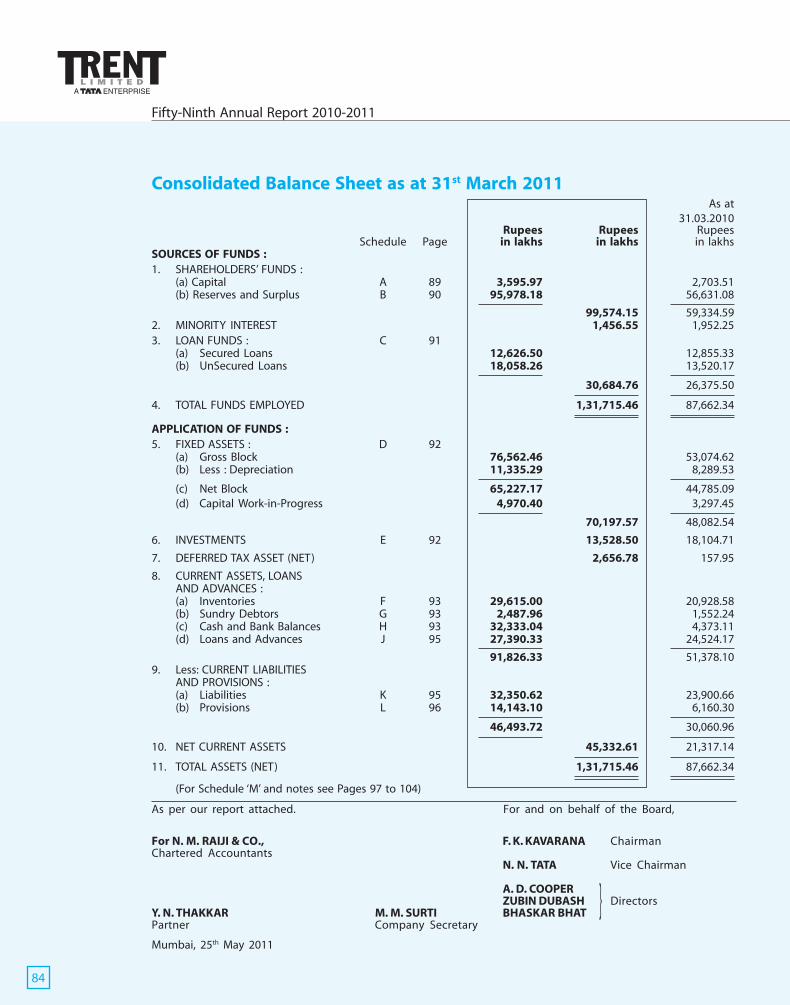
Fifty-Ninth Annual Report 2010-2011
84
Consolidated Balance Sheet as at 31st March 2011As at
31.03.2010Rupees Rupees Rupees
Schedule Page in lakhs in lakhs in lakhsSOURCES OF FUNDS :1. SHAREHOLDERS’ FUNDS :
(a) Capital A 89 3,595.97 2,703.51(b) Reserves and Surplus B 90 95,978.18 56,631.08
99,574.15 59,334.592. MINORITY INTEREST 1,456.55 1,952.253. LOAN FUNDS : C 91
(a) Secured Loans 12,626.50 12,855.33(b) UnSecured Loans 18,058.26 13,520.17
30,684.76 26,375.50
4. TOTAL FUNDS EMPLOYED 1,31,715.46 87,662.34
APPLICATION OF FUNDS :5. FIXED ASSETS : D 92
(a) Gross Block 76,562.46 53,074.62(b) Less : Depreciation 11,335.29 8,289.53
(c) Net Block 65,227.17 44,785.09(d) Capital Work-in-Progress 4,970.40 3,297.45
70,197.57 48,082.54
6. INVESTMENTS E 92 13,528.50 18,104.71
7. DEFERRED TAX ASSET (NET) 2,656.78 157.95
8. CURRENT ASSETS, LOANSAND ADVANCES :(a) Inventories F 93 29,615.00 20,928.58(b) Sundry Debtors G 93 2,487.96 1,552.24(c) Cash and Bank Balances H 93 32,333.04 4,373.11(d) Loans and Advances J 95 27,390.33 24,524.17
91,826.33 51,378.109. Less: CURRENT LIABILITIES
AND PROVISIONS :(a) Liabilities K 95 32,350.62 23,900.66(b) Provisions L 96 14,143.10 6,160.30
46,493.72 30,060.96
10. NET CURRENT ASSETS 45,332.61 21,317.14
11. TOTAL ASSETS (NET) 1,31,715.46 87,662.34
(For Schedule ‘M’ and notes see Pages 97 to 104)
As per our report attached. For and on behalf of the Board,
For N. M. RAIJI & CO., F. K. KAVARANA ChairmanChartered Accountants
N. N. TATA Vice Chairman
A. D. COOPERZUBIN DUBASH Directors
Y. N. THAKKAR M. M. SURTI BHASKAR BHATPartner Company Secretary
Mumbai, 25th May 2011
}

A Enterprise
85
Consolidated Profit and Loss Account for the year ended 31st March 2011Previous Year
Schedule Page Rupees Rupees Rupeesin lakhs in lakhs in lakhs
INCOME :1. INCOME FROM OPERATIONS 2 87 1,59,224.42 1,12,046.072. OTHER INCOME 3 87 3,664.50 1,714.443. TOTAL INCOME 1,62,888.92 1,13,760.51EXPENDITURE :4. OPERATING AND OTHER EXPENSES 1 86 1,57,985.90 1,10,687.645. DEPRECIATION 3,185.88 2,208.49
1,61,171.78 1,12,896.136. INTEREST 4 88 931.77 788.25
7. TOTAL EXPENDITURE 1,62,103.55 1,13,684.36
PROFIT BEFORE TAXES AND EXCEPTIONAL ITEM 785.37 76.138. EXCEPTIONAL INCOME/(EXPENSES) 5 88 (84.00) 836.71
PROFIT FROM ORDINARY ACTIVITIES BEFORE TAXES 701.37 912.849. PROVISION FOR TAXATION
CURRENT TAX 1,807.49 832.20(EXCESS)/SHORT TAX PROVISION FOR PRIOR YEARS (NET) (1,501.79) (78.15)MAT CREDIT ENTITLEMENT (808.24) (302.95)DEFERRED TAX 1,056.44 315.70
553.90 766.80
PROFIT BEFORE EXTRA ORDINARY ITEM 147.47 146.0410. EXTRA ORDINARY ITEM (NET OF TAX) 105.98 -
PROFIT AFTER EXTRA ORDINARY ITEMBEFORE MINORITY INTEREST 253.45 146.04
11. LESS : MINORITY SHARE OF PROFIT / (LOSS) (495.72) (15.00)12. LESS: PRE ACQUISITION PROFIT / (LOSS) - 5.54
NET PROFIT AFTER MINORITY INTEREST 749.17 155.50BALANCE BROUGHT FORWARD FROM PREVIOUS YEAR (1,658.44) 607.65BROUGHT FORWARD LOSS ARISING OUT OF AMALGAMATION (349.94) -PROFIT AVAILABLE FOR APPROPRIATION (1,259.21) 763.14
13. APPROPRIATIONS :(i) GENERAL RESERVE 500.00 403.00(ii) DEBENTURE REDEMPTION RESERVE 500.00 500.00(iii) DIVIDEND PAID -EQUITY SHARES 1.42 -(iv) PROPOSED DIVIDEND -EQUITY SHARES 1,504.27 1,302.28(v) PROPOSED DIVIDEND -PREFERENCE SHARES 1.23 0.01(vi) TAX ON DIVIDEND 244.46 216.29(vii) BALANCE CARRIED TO BALANCE SHEET (4,010.59) (1,658.44)
(1,259.21) 763.1414. Earnings Per Share Before Extra Ordinary
Item (Rs.) (Note 12. Page 103)Basic 3.20 0.79Diluted 2.92 0.79
15. Earnings Per Share After Extra OrdinaryItem (Rs.) (Note 12. Page 103)Basic 3.73 0.79Diluted 3.41 0.79(For Schedule ‘M’ and notes see Pages 97 to 104)
As per our report attached. For and on behalf of the Board,
For N. M. RAIJI & CO., F. K. KAVARANA ChairmanChartered Accountants
N. N. TATA Vice Chairman
A. D. COOPERZUBIN DUBASH Directors
Y. N. THAKKAR M. M. SURTI BHASKAR BHATPartner Company Secretary
Mumbai, 25th May 2011
}

Fifty-Ninth Annual Report 2010-2011
86
Schedule forming part of the Consolidated Profit and Loss AccountSchedule ‘1’ (Item No. 4, Page 85)OPERATING AND OTHER EXPENSES
PreviousYear
Rupees Rupees Rupeesin lakhs in lakhs in lakhs
1 RAW MATERIALS CONSUMED 1,356.07 548.62
2 PURCHASE OF FINISHED PRODUCTS 98,881.88 69,140.32
3 PAYMENTS TO AND PROVISIONS FOR EMPLOYEES
(a) Salaries, Wages, Bonus, etc.(refer note schedule “B”,Page 90) 10,784.76 7,765.28
(b) Contribution to Provident, Superannuationand Gratuity Funds 662.18 472.82
(c) Workmen and Staff Welfare Expenses 652.40 488.44
12,099.34 8,726.544 OTHER EXPENSES
(a) Processing Charges 193.73 169.23(b) Packing Materials Consumed 936.46 613.26(c) Power and Fuel 4,587.80 3,603.23(d) Repairs to Building 3,211.36 2,259.32(e) Repairs to Machinery 649.57 580.92(f ) Repairs Others 931.81 685.95(g) Rent 6,651.06 4,962.10(h) Rates and Taxes 1,058.10 729.21(i) Insurance 126.43 136.51(j) Advertisement and Sales Promotion 6,510.92 5,847.76(k) Travelling Expenses 925.19 646.43(l) Professional and Legal Charges 1,127.53 858.03(m) Printing and Stationery 298.44 206.28(n) Bank Charges 946.67 694.55(o) Postage, Telegrams and Telephones 746.82 589.00(p) General Expenses (Note 5(i), Page 99) 3,653.88 2,519.30(q) Retail Business Fees 5,967.96 4,601.39(r) Sales Tax paid 8,079.74 5,339.14(s) Directors’ Fees 16.77 14.01(t) Commission to Non whole-time Directors 52.86 30.00(u) Excess of cost over fair value of Current Investments - 0.63(v) Loss on Sale of Fixed Assets Sold/Discarded (Net) 113.43 173.10(w) Loss on sale of Long Term Investments (Net) 46.60 164.90
46,833.13 35,424.25
5 FREIGHT AND FORWARDING CHARGES 1,282.07 675.86
6 CHANGES IN FINISHED PRODUCTSAccretion to stocks deducted (7,892.15) (4,058.50)
1,52,560.34 1,10,457.09
7 Share of Joint Ventures -[Note 11 (b), Page 102] 5,425.56 230.55
1,57,985.90 1,10,687.64

A Enterprise
87
Schedule ‘3’(Item No.2, Page 85)OTHER INCOME Previous
YearRupees Rupees Rupeesin lakhs in lakhs in lakhs
(1) Miscellaneous Income 12.97 18.63(2) Interest on Loans and Advances-Gross 643.07 621.07
[Tax deducted at source: Rs.95.94 lakhs(2009-2010: Rs 63.37 lakhs)]
(3) Interest/Discounts on Deposits with Banks - Gross 877.51 60.11[Tax deducted at source: Rs.6.73 lakhs(2009-2010: Rs 6.88 lakhs)]
(4) Income from Current Investments - Non trade(a) Dividend on Current Investments 723.99 351.77(b) Profit on sale of Current Investments (Net) 534.33 311.51
1,258.32 663.28(5) Dividend on Long Term Investments -Gross
(a) Trade - 1.50(b) Others - Gross 69.57 184.96
69.57 186.46(6) Profit on Sale of Long Term Investments (Net) 11.45 -(7) Profit on sale of fixed assets 724.42 -(8) Excess provision no longer required written back - 134.35
3,597.31 1,683.90
(9) Share of Joint Ventures - [Note 11 (b), Page 102] 67.19 30.54
3,664.50 1,714.44
Schedules forming part of the Consolidated Profit and Loss AccountSchedule ‘2’ (Item No. 1, Page 85)
INCOME FROM OPERATIONS PreviousYear
Rupees Rupees Rupeesin lakhs in lakhs in lakhs
(1) Sales 1,44,798.59 1,06,224.46Less: Excise Duty 16.41 2.86
1,44,782.18 1,06,221.60(2) OTHER OPERATING INCOME
(a) Display and Sponsorship Income 1,081.03 356.86(b) Commission on sales 583.30 562.59(c) Discounts and Fees 2,238.52 1,267.09(d) Rent received 2,477.73 1,510.37(e) Others 814.20 2,124.25
7,194.78 5,821.16
1,51,976.96 1,12,042.76
(3) Share of Joint Ventures -[Note 11 (b), Page 102] 7,247.46 3.31
1,59,224.42 1,12,046.07
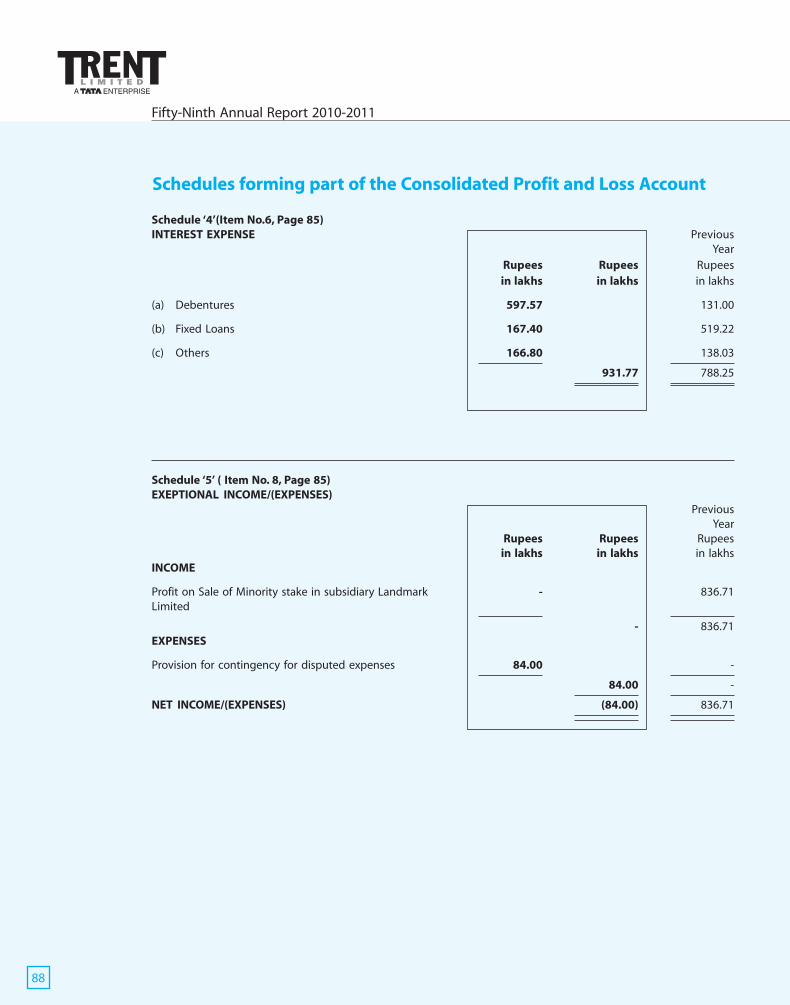
Fifty-Ninth Annual Report 2010-2011
88
Schedule ‘4’(Item No.6, Page 85)INTEREST EXPENSE Previous
YearRupees Rupees Rupeesin lakhs in lakhs in lakhs
(a) Debentures 597.57 131.00
(b) Fixed Loans 167.40 519.22
(c) Others 166.80 138.03
931.77 788.25
Schedule ‘5’ ( Item No. 8, Page 85)EXEPTIONAL INCOME/(EXPENSES)
PreviousYear
Rupees Rupees Rupeesin lakhs in lakhs in lakhs
INCOME
Profit on Sale of Minority stake in subsidiary Landmark - 836.71Limited
- 836.71EXPENSES
Provision for contingency for disputed expenses 84.00 -
84.00 -
NET INCOME/(EXPENSES) (84.00) 836.71
Schedules forming part of the Consolidated Profit and Loss Account

A Enterprise
89
Schedule forming part of the Consolidated Balance SheetSchedule ‘A’(Item No. 1(a), Page 84)CAPITAL
As at As at31.03.2011 31.3.2010
Rupees Rupees Rupeesin lakhs in lakhs in lakhs
AUTHORISED :
3,20,00,000 Equity Shares of Rs.10/- each 3,200.00 2,400.00(2009-2010 : 2,40,00,000 Equity Shares of Rs.10/- each)
50,00,000 Unclassified Shares of Rs.10/- each 500.00 500.00(2009-2010 : 50,00,000 Unclassified Shares of Rs.10/- each)
70,000 Preference Shares of Rs 1000/- each 700.00 700.00(2009-2010 : 70,000 Preference shares of Rs.1000/-each)
1,20,00,000 Cumulative Convertible Preference shares ofRs.10/-each. 1,200.00 -
5,600.00 3,600.00
2,00,56,877 Equity Shares of Rs. 10/- each fully paid-up 2,005.69 2,003.51[2009-2010 : 2,00,35,052 Equity Shares of Rs. 10/-each fully paid-up]
70,000 0.1% Cumulative Redeemable Preference Shares of 700.00 700.00Rs.1000/-each, fully paid up
44,51,414 Cumulative Compulsorily Convertible PreferenceShares Series A of Rs.10/- each fully paid up (2009-10: Nil) 445.14 -
44,51,414 Cumulative Compulsorily Convertible PreferenceShares Series B of Rs.10/- each fully paid up (2009-10: Nil) 445.14 -
3,595.97 2,703.51
Notes :
1. Of the above -
(a) 1,08,81,021 Equity Shares were allotted as fully paid Bonus Shares by capitalisation of Share Premium andReserves.
(b) 1,12,616 Equity Shares were allotted as fully paid pursuant to Schemes of Amalgamation without paymentbeing received in cash.
(c) 70,000 Cumulative Redeemable Preference Shares were allotted as fully paid pursuant to Scheme ofAmalgamation without payment being received in cash.
2 During the current year, the Company has issued 44,51,414 0.1%Cumulative Compulsorily Convertible PreferenceShares (CCPS) Series A of Rs 10/- @550 each and 44,51,414 0.1% Cumulative Compulsorily Convertible PreferenceShares (CCPS) Series B of Rs 10/- @550 each to the Equity Shareholders on Right basis in the ratio of 4 CCPS(2series A and 2 Series B) for every 9 Equity Shares held. Each CCPS of Series A is Convertible to 1 Equity Share ofRs 10 each at premium of Rs 540 automaticaly on 1st September 2011 and each CCPS of Series B is Convertibleto 1 Equity Share of Rs 10 each at premium of Rs 540 automatically on 1st September 2012 .Until conversion,CCPS of both series will be eligible for a dividend of 0.1% p.a. on the face value.
3 The term of the 0.1% Cumulative Redeemable Preference Shares is of twenty years from 26th March 2010, beingthe date of allotment, with an option to the Company to redeem the Preference Shares at any time after 36months from the date of allotment. The Board of Directors at their meeting held on 26th April 2010 have fixed1st June 2013 as the date of redemption of the Preference Shares.
4 During the year 2009-10, the Company had granted 21,825 stock options under the Employee Stock OptionScheme. During the current year 21,825 Equity Shares of Rs 10/- each were issued at par pursuant to StockOptions exercised. No stock Options are outstanding as on 31st March, 2011.

Fifty-Ninth Annual Report 2010-2011
90
Schedule forming part of the Consolidated Balance SheetSchedule ‘B’ (Item No. 1(b), Page 84)RESERVES AND SURPLUS As at As at
31.03.2011 31.3.2010Rupees Rupees Rupeesin lakhs in lakhs in lakhs
(1) SECURITIES PREMIUM ACCOUNTBalance as per last account 34,557.40 31,995.25Add : Premium on issue of Equity Shares on
conversion of Warrants - 3,213.80Add : Transfer from Employee Stock Options
on issue of Equity Shares 107.44 -Add : Premium on issue of Compulsorily
Convertible Preference Shares 48,075.27 -Less : Premium on redemption of Debentures
(refer note c,d,e and f of Schedule ‘C’) 6,873.51 -Less : Write off of securities / warrant issue
expenses (net of deferred tax) 524.38 638.83Less : Write off of securities / warrant issue
expenses (net of deferred tax) - 12.82
75,342.22 34,557.40(2) DEBENTURE REDEMPTION RESERVE
(a) Balance as per last account 5,300.00 4,800.00(b) Add : Transferred from Profit and Loss Account 500.00 500.00
5,800.00 5,300.00(3) EMPLOYEE STOCK OPTIONS
a) Employee Stock Options OutstandingBalance as per last account 107.44 -Additions - 107.44Lapsed - -Transferred to share Premium Account 107.44 -
Outstanding - 107.44
b) Less: Deferred Employee CompensationBalance as per last account 22.68 -Additions - 22.68
Amortised/Lapsed 22.68 -
Balance - 22.68
Net Employee Stock Options - 84.76(4) GENERAL RESERVE :
(a) Balance as per last account 16,210.51 18,572.47(b) Add : Transferred from Profit and Loss Account 500.00 403.00(c) Less : Deficit in Profit and Loss account (2,352.15) 1,658.44(d) Less : Expenses on Amalgamation (Note 13, Page 103) - 80.15(e) Less : Deficit on Amalgamation (Note 13, Page 103) - 1,026.37
14,358.36 16,210.51(5) AMALGAMATION RESERVE :
Arising out of AmalgamationOpening Balance - 1,492.95Less : Deficit on Amalgamation (Note 13, Page 103) - 1,492.95
- -(6) CAPITAL RESERVE ON ACQUISITION OF SUBSIDIARY 448.84 448.84(7) FOREIGN EXCHANGE RESERVE ON CONSOLIDATION 28.76 29.57(8) PROFIT AND LOSS ACCOUNT (-) -
95,978.18 56,631.08
Note :-In respect of Options granted under the Company’s Employee Stock Options Scheme 2009 (ESOS), in accordancewith guidelines issued by SEBI, the accounting value of options is accounted as deferred employee compensation,which is amortised on a straight line basis over the vesting period. Consequently, salaries, wages, bonus etc. includeRs.22.68 lakhs being the amortisation of deferred employee compensation.

A Enterprise
91
Schedule forming part of the Consolidated Balance SheetSchedule ‘C’ (Item No. 3, Page 84)LOAN FUNDS
As at As at31.03.2011 31.3.2010
Rupees Rupeesin lakhs in lakhs
(1) SECURED LOANS :a) Debentures
Non Convertible Debentures (Note ‘a’) - 6,550.24Non Convertible Debentures- April 10 Series-I (Note ‘b’) 10,000.00 -Non Convertible Debentures-Series-II (Note ‘b’) - 5,000.00
b) From BanksCash Credit (Note ‘g’) 2,626.50 1,305.09
12,626.50 12,855.33
(2) UNSECURED LOANS :Sales Tax loan from Government of Maharashtra - 1.82Non Convertible Debentures-Oct-09-Series I (note “c”) 5,000.00 5,000.00Non Convertible Debentrues-April 10 Series 2 (note “e”) 5,000.00 -Non Convertible Debentures - June 10 Series 1 (note “f”) 4,500.00 -Non Convertible Debentures - June 10 Series 2 (note “f”) 3,000.00 -Commercial Paper - 5,000.00Inter Corporate Deposits - 3,500.00Others 558.26 18.35
18,058.26 13,520.17
30,684.76 26,375.50
Note:-(a) During the year 2005-2006 the Company has issued 13,10,047 Partly Convertible Debentures of Rs. 900/- each.Of
the above, Convertible Debenture of the face value of Rs. 400/- has been converted into one Equity Share of Rs.10/- each at a premium of Rs. 390/- per share on the date of allotment. The Non Convertible Debenture of facevalue of Rs. 500/- are redeemed at a premium of Rs. 98/- each on 7th July 2010.The Premium payable onredemption of Debentures amounting to Rs 1283.85 lakhs has been provided and debited to Securities PremiumAccount during 2005-2006.
(b) During the current year , the Company has reedeemed 500 Redeemable Non Convertible Debentures - Series IIof Rs. 10 each issued during 2008-09, together with a premium of Rs 2.63 lakhs each. The Premium payable onredemption of these Debentures has been fully provided and is debited to Securities Premium Account net ofdeferred tax.
(c) During the 2009-10, the Company issued 500 Redeemable Non Convertible Debentures of Rs. 10 lakhs each onprivate placement basis.These Debentures are free of interest and are redeemable at a premium of Rs.1.94 lakhseach on 21st October 2011.The Premium payable on redemption of these Debentures has been fully providedand is debited to Securities Premium Account net of deferred tax during 2009-10.
(d) During the current year, the Company issued 1,000 Redeemable Non Convertible Debentures of Rs. 10 lakhseach on private placement basis.These Debentures are free of interest and are redeemable at a premium ofRs.6.11 lakhs each on 14th April 2015 .The Premium payable on redemption of these Debentures has been fullyprovided and is debited to Securities Premium Account net of deferred tax.These Debentures are secured byway of charge on immovable property of the company in favour of DebentureTrustees as stipulated in theDebenture Trust Deed and 1.25 times asset cover will be maintained by the company on continuous basis.
(e) During the current year, the Company issued 50 Redeemable Non Convertible Debentures April 10 Series 2 ofRs. 10 lakhs each on private placement basis.These Debentures are at 5% p.a of interest and are redeemable ata premium of Rs.2.89 lakhs each on 27th April 2015.The Premium payable on redemption of these Debentureshas been fully provided and is debited to Securities Premium Account net of deferred tax.
(f ) During the current year, the Company issued 450 Redeemable Non Convertible Debentures June 2010 Series 1of Rs 10 lakhs each and 300 Redemable Non Convertible Debentures June 2010 Series 2 of Rs. 10 lakhs each onprivate placement basis. Series 1 Debentures will carry an interest of 9.75% p.a and are redeemable at a Par on 30thJune 2017 and series 2 Debentures are free of Interest and will be redeemed at Premium of Rs 9.13 Lakhs on30th June 2017 .The Premium payable on redemption of Series 2 Debentures has been fully provided and isdebited to Securities Premium Account net of deferred tax.
(g) Cash credit from Banks is secured by first exclusive charge on the current assets of and equitable mortgage onthe immovable property of Landmark Limited (Subsidiary).
(h) Of the above secured loans amount payable within one year Rs. 558.26 Lakhs (2009-10 : Rs.11550.24 Lakhs)(i) Of the above unsecured loans, amount repayable within a year Rs.5000.00 Lakhs (2009-2010 : Rs. 8501.82 Lakhs).

Fifty-Ninth Annual Report 2010-2011
92
Schedule forming part of the Consolidated Balance SheetSchedule ‘D’ (Item No.5, Page 84)
FIXED ASSETS
ASSETS GROSS BLOCK (AT COST) DEPRECIATION NET BLOCK
As at Additions/ Deductions/ As at As at Deductions/ For the As at As at1.4.2010 Adjustments Adjustments 31.03.2011 1.4.2010 Adjustments year 31.03.2011 31.03.2011
Rupees Rupees Rupees Rupees Rupees Rupees Rupees Rupees Rupeesin lakhs in lakhs in lakhs in lakhs in lakhs in lakhs in lakhs in lakhs in lakhs
Goodwill 6.00 4.80 - 10.80 6.00 - 4.80 10.80 -(6.00) ( - ) ( - ) (6.00) (6.00) ( - ) ( - ) (6.00) ( - )
Goodwill onConsolidation 12,910.69 4,915.84 - 17,826.54 - - - - 17,826.54
(17,609.82) (3,087.15) (7,786.28) (12,910.69) ( - ) ( - ) ( - ) ( - ) (12,910.69)
Freehold Land 533.12 212.41 72.01 673.52 - - - - 673.52(533.12) ( - ) ( - ) (533.12) ( - ) ( - ) ( - ) ( - ) (533.12)
Leasehold Land 5,457.66 21.25 - 5,478.91 70.65 (0.23) 72.40 143.28 5,335.63(8.13) (5,449.53) ( - ) (5,457.66) (4.39) ( - ) (66.26) (70.65) (5,387.01)
Buildings 11,164.82 9,862.53 721.91 20,305.44 1,737.83 98.87 641.20 2,280.16 18,025.28(6,587.32) (4,639.31) (61.81) (11,164.82) (1,316.42) (12.70) (434.11) (1,737.83) (9,426.99)
Plant and Machinery 9,257.70 2,843.26 85.47 12,015.49 1,851.12 21.86 604.02 2,433.28 9,582.21(6,769.84) (2,606.51) (118.65) (9,257.70) (1,455.43) (27.63) (423.32) (1,851.12) (7,406.58)
Furniture, Fixtures,Office and Other 13,451.70 4,057.82 83.33 17,426.19 4,498.77 18.11 1,555.06 6,035.72 11,390.47Equipment (10,733.83) (2,909.48) (191.61) (13,451.70) (3,317.24) (59.20) (1,240.73) (4,498.77) (8,952.93)
Vehicles 129.13 25.10 28.38 125.85 42.89 - 13.39 56.28 69.57(154.08) (44.40) (69.34) (129.13) (43.97) (16.05) (14.97) (42.89) (86.25)
Intangible Assets 133.94 113.89 3.62 244.21 77.22 1.51 33.35 109.06 135.15(121.31) (14.09) (1.46) (133.94) (52.59) (0.47) (25.10) (77.22) (56.72)
Total 53,044.77 22,056.91 994.72 74,106.95 8,284.48 140.12 2,924.21 11,068.58 63,038.37(42,523.45) (18,750.47) (8,229.15) (53,044.77) (6,196.04) (116.05) (2,204.49) (8,284.48) (44,760.30)
Share of Joint Ventures -[Note 11 (b), Page 102] 29.85 2,425.66 - 2,455.51 5.05 - 261.66 266.71 2,188.80
(4.80) (25.05) ( - ) (29.85) (1.05) ( - ) (4.00) (5.05) (24.80)
53,074.61 24,482.57 994.72 76,562.46 8,289.53 140.12 3,185.88 11,335.29 65,227.17(42,528.25) (18,775.52) (8,229.15) (53,074.61) (6,197.10) (116.05) (2,208.49) (8,289.53) (44,785.10)
Capital Work-in-Progress 4,970.40(3,297.45)
Total 70,197.57(48,082.54)
Notes :
(1) Figures in brackets are in respect of previous year.
(2) Buildings include improvements to leasehold premises and an amount of Rs. Nil (2009-2010: Rs.1,050) representing value of Shares in Co-operative Housing Societies/Condominium .
(3) Leasehold Land and building includes certain portions which have been given under operating leases.
Schedule ‘E’(Item No.6, Page 84)
INVESTMENTSAs at As at
31.03.2011 31.3.2010Rupees Rupeesin lakhs in lakhs
(1) Investments 13,528.07 18,104.30
(2) Share of Joint Ventures -[Note 11 (b), Page 102] 0.43 0.41
13,528.50 18,104.71

A Enterprise
93
Schedules forming part of the Consolidated Balance SheetSchedule ‘F’(Item No.8(a), Page 84) As at As at
INVENTORIES 31.03.2011 31.3.2010
Rupees Rupeesin lakhs in lakhs
Stocks(1) Raw Materials 262.88 212.08(2) Packing Materials 132.21 125.42(3) Finished Products (Note 13, Page 103) 28,266.02 20,373.87(4) Stocks-in-Transit 16.11 152.57(5) Stores & Spares 82.82 26.61
28,760.04 20,890.55
(6) Share of Joint Venture -[Note11 (b), Page 102] 854.96 38.03
29,615.00 20,928.58
Schedule ‘G’(Item No.8 (b), Page 84) As at As at
SUNDRY DEBTORS 31.03.2011 31.3.2010Rupees Rupeesin lakhs in lakhs
(1) Debts outstanding for a period exceeding six months 1,421.70 227.69
(2) Other Debts 1,162.24 1,415.97
2,583.94 1,643.66(3) Less : Provision for Doubtful Debts 97.84 93.28
2,486.10 1,550.38
Considered Good - Unsecured 2,486.10 1,550.38
Considered Doubtful - Unsecured 97.84 93.28
2,583.94 1,643.66
(4) Share of Joint Ventures -[Note 11 (b), Page 102] 1.86 1.86
2,487.96 1,552.24
Schedule ‘H’(Item No.8(c), Page 84) As at As at
CASH AND BANK BALANCES 31.03.2011 31.3.2010Rupees Rupeesin lakhs in lakhs
(1) Cash on hand (including cheques on hand Rs. Nil) (2009-2010 : Rs.Nil) 419.76 323.54(2) Balances with Scheduled Banks
(a) Current Accounts 1,577.77 1,083.53(b) Fixed Deposit Accounts 397.15 352.62(c) Certificate of Deposits (refer schedule “I”,Page 94) 28,393.88 -(d) Unclaimed Dividend 65.12 63.30(e) Unclaimed Debenture Interest 2.37 1.95
30,436.29 1,501.40
30,856.05 1,824.94
(3) Share of Joint Ventures -[Note 11 (b), Page 102] 1,476.99 2,548.17
32,333.04 4,373.11

Fifty-Ninth Annual Report 2010-2011
94
Schedules forming part of the Consolidated Balance SheetSchedule’I’ (Item No.2(c), Page 93)
CERTIFICATE OF DEPOSITS
Balance as on Purchased during Sold during Balance as on1.4.2010 the year the year 31.3.2011
No. of. Rupees No. of. Rupees No. of. Rupees No. of. RupeesUnits in lakhs Units in lakhs Units in lakhs Units in lakhs
Face Value of Rs.1.00 Lakh
HDFC Bank - - 2,500 2,413.56 2,500 2,413.56 - -
ICICI Bank - - 2,500 2,411.77 2,500 2,411.77 - -
IDBI Bank - - 5,000 4,776.81 - - 5,000 4,776.81
ICICI Bank - - 2,500 2,392.23 - - 2,500 2,392.23
HDFC Bank - - 2,500 2,391.94 - - 2,500 2,391.94
Dhanlakshmi Bank - - 2,500 2,467.48 2,500 2,467.48 - -
Axis Bank - - 5,000 4,800.90 2,500 2,400.64 2,500 2,400.26
Union Bank Of India - - 2,500 2,374.22 2,500 2,374.22 - -
State Bank Of Patiala - - 2,500 2,337.09 - - 2,500 2,337.09
State Bank Of Hyderabad - - 2,500 2,373.19 2,500 2,373.19 - -
State Bank Of Bikaner & Jaipur - - 5,000 4,736.30 - - 5,000 4,736.30
Canara Bank - - 2,500 2,446.26 2,500 2,446.26 - -
State Bank Of Patiala - - 2,500 2,418.75 2,500 2,418.75 - -
Canara Bank - - 2,500 2,402.59 - - 2,500 2,402.59
Punjab & Sind Bank - - 2,500 2,366.48 - - 2,500 2,366.48
Axis Bank Ltd - - 2,500 2,272.47 - - 2,500 2,272.47
ICICI Bank Ltd - - 2,500 2,317.71 - - 2,500 2,317.71
- 28,393.88

A Enterprise
95
Schedules forming part of the Consolidated Balance Sheet
Schedule ‘J’ (Item No. 8 (d), Page 84)LOANS AND ADVANCES
As at As at31.03.2011 31.3.2010
Rupees Rupees Rupeesin lakhs in lakhs in lakhs
(1) Security DepositsDeposits for Premises-Others 11,961.45 8,760.76Other Deposits 133.01 749.39
12,094.46 9,510.15(2) Loans 7,705.78 5,464.89(3) Other Loans and Advances recoverable in
cash or in kind or for value to be received 2,114.10 6,925.58(4) Balances with Customs/Port Trust etc. 107.53 95.84(5) Other Receivables 782.46 470.23(6) Bills of Exchange 114.20 114.20(7) Advances on Capital Account 806.12 765.62(8) Advance payment of taxes - net of Advance Tax 1,492.79 315.79(9) MAT Credit Entitlement 1,549.78 741.54
26,767.22 24,403.84(10) Less : Provision for Doubtful Advances 214.72 211.91
26,552.50 24,191.93
Considered Good - Unsecured 26,552.50 24,191.92
Considered Doubtful - Unsecured 214.72 211.91
26,767.22 24,403.83
(11) Share of Joint Ventures -[Note 11 (b), Page 102] 837.83 332.24
27,390.33 24,524.17
Schedule ‘K’ (Item No.9 (a), Page 84)LIABILITIES
As at As at31.03.2011 31.3.2010
Rupees Rupees Rupeesin lakhs in lakhs in lakhs
(1) Sundry Creditors (Note 7, Page 99) 28,549.51 21,726.12(2) Security Deposits Received 1,501.33 1,434.84(3) Investor Education and Protection Fund
(Appropriate amount shall be transferred to“Investor Education and Protection Fund” if andwhen due)(a) Unclaimed Dividend 65.12 63.29(b) Unclaimed application money received
by the company for allotment of Rights Issueand due for refund 22.47 4.82
(c) Unclaimed Debenture Interest 2.37 1.95
89.96 70.06
30,140.80 23,231.01
(4) Share of Joint Ventures -[Note 11 (b), Page 102] 2,209.82 669.64
32,350.62 23,900.66

Fifty-Ninth Annual Report 2010-2011
96
Schedules forming part of the Consolidated Balance SheetSchedule ‘L’ (Item No.9 (b), Page 84)PROVISIONS
As at As at31.03.2011 31.3.2010
Rupees Rupeesin lakhs in lakhs
(1) Proposed Dividend 1,505.49 1,302.29
(2) Tax on Dividend 244.23 216.29
(3) Contingencies 289.00 205.00
(4) Retirement Benefits 759.26 788.50
(5) Redemption Premium of Debentures 11,260.17 3,566.92
(6) Rent Equilisation 77.61 76.47
14,135.76 6,155.47
(7) Share of Joint Ventures -[Note 11 (b), Page 102] 7.34 4.83
14,143.10 6,160.30

A Enterprise
97
Schedule ‘M’
CONSOLIDATED SIGNIFICANT ACCOUNTING POLICIES
1 Basis of preparation of accounts
1.1 The consolidated financial statement have been prepared in accordance with the accounting standard 21 (AS -21) “ Consolidated Financial Statements” and Accounting Standard-27 (AS-27) “Financial Reporting ofInterest in Joint Ventures” issued by the Institute of Chartered Accountants of India. The consolidatedfinancial statements are prepared by consolidating the accounts of Trent Limited with its subsidiaries, TrentBrands Limited, Fiora Services Limited, Nahar Theatres Private Limited, Fiora Link Road Properties Limited,Trent Hypermarket Limited, Trent Global Holdings Limited, Landmark Limited, Westland Limited , TrentRetail Services Private Limited (Formerly Regent Management Private Limited )(Subsidiary of LandmarkLimited), Landmark E-Tail Private Limited (Subsidiary of Landmark Limited) and Joint Venture -Trexa ADMCPrivate Limited,Inditex Trent Retail India Private Limited, Virtuous Shopping Centres Private Limited (JointVenture of Trent Hypermarket Limited).
(a) Depreciation in respect of Landmark Limited: Depreciation is provided on Straight Line Method at therates specified in Schedule XIV of the Companies Act, 1956 except for the following assets, which aredepreciated at rate higher than that specified in Schedule XIV based on useful life of the assets as estimatedby the Management .
Asset Useful Life(Years)
(a) Motor Cars and Other Vehicles 5
(b) Office Equipment 5
(c) Furniture and Fixtures 10
(d) Plant and Machinery 10
Leasehold improvements are depreciated over its economic useful life, not exceeding a maximum period of10 years.
Cost of Software is amortised over a period of six years
(b) Depreciation in respect of Westland Limited: Depreciation is provided on Written Down Value Method atthe rates specified in Schedule XIV of the Companies Act, 1956. Leasehold improvements are depreciatedover the lease period not exceeding 5 years. Computer application software is fully depreciated in the yearof addition.
(c) Depreciation in respect of Trent Brands Limited: Depreciation has been provided in accordance withSchedule XIV of the Companies Act, 1956 on “Written Down Value” method.
(d) Depreciation in respect of Inditex Trent Retail Private Limited: Depreciation on fixed assets is providedon straight-line method over the useful lives of assets estimated by the management. The rates used by themanagement are higher than rates specified in Schedule XIV to the Companies Act, 1956.The useful lives ofassets are as follows:
Asset Useful Life(Years)
(a) Furniture and Fixtures 7
(b) Computers 4
(c) Office Equipment 7
Schedules forming part of the Consolidated Balance Sheet

Fifty-Ninth Annual Report 2010-2011
98
Leasehold improvements are amortised on the straight-line basis over the estimated useful life of sevenyears or remaining lease term, whichever is lower.
(e) Other significant accounting policies are set out in the Notes to Accounts under the schedule “SignificantAccounting Policies” of Trent Limited, Trent Brands Limited, Fiora Services Limited, Nahar Theatres PrivateLimited, Fiora Link Road Properties Limited , Trent Hypermarket Limited, Trent Global Holdings Limited,Landmark Limited, Westland Limited, Trent retail Services Private limited Formerly Regent ManagementPrivate Limited , Landmark E-Tail Private Limited, Virtuous Shopping Centres Private Limited,Trexa ADMCPrivate Limited and Inditex Trent Retail India Private Limited.
Notes on the Consolidated Balance Sheet and Profit and Loss Account
1. (a) Estimated amount of contracts remaining to be executed on capital account and not provided for Rs.2851.68lakhs (2009-2010: Rs.2966.00 lakhs).
Share of Joint Venture Rs. 521.00 lakhs ( 2009-2010 : Rs. 225.15 lakhs)
2. (a) Contingent Liability in respect of Sales tax, Excise and Customs demands against which the Company hasfiled appeals: Rs.195.64 lakhs (2009-2010: Rs. 61.81 lakhs) - net of tax Rs. 130.65 lakhs (2009-2010 : Rs. 41.28lakhs).
(b) Contingent Liability in respect of Income-tax demands against which the Company has filed appeals : Rs.5384.33 lakhs (2009-2010 :Rs.377.09 lakhs).
(c) Claims made against the Company not acknowledged as debts : Rs.5514.42 lakhs (2009-2010 : Rs.984.29lakhs).In respect of one of the subsidiaries amount not ascertained.
(d) As a matter of abundant caution, a cumulative provision for contingencies of Rs.205.00 lakhs has beenmade against items (a), (b) and (c) above, which are disputed by the company.
3 Managerial Remuneration (Holding Company) :
Managerial remuneration for Managing Director and Non- Whole time Directors
2010-2011 2009-2010Rupees Rupees
in lakhs in lakhs
(a) Salaries (including Company’s Contribution toProvident Fund and Superannuation Fund) 32.09 74.88
(b) Commission 132.86 105.00
(c) Perquisites 18.74 45.23
(d) Directors’ sitting fees 13.12 11.98
(e) ESOP 86.80 -
283.61 237.09`
Note:
(a) The above figures do not include contribution to Gratuity Fund as separate figure is not available for theManaging Director, and retirement benefits of Rs.14.40 lakhs (2009-2010: Rs.14.40 lakhs) paid to a formerManaging Director.
Schedules forming part of the Consolidated Balance Sheet and Profit and Loss Account (Contd.)

A Enterprise
99
Notes on the Consolidated Balance Sheet and Profit and Loss Account (Contd.)
4. Major components of Deferred Tax Assets and Liabilities are:
2010-2011 2009-2010Rupees Rupees
in lakhs in lakhsDeferred Tax Liability
Depreciation 1,805.73 1,149.35
Deferred Tax Assets
Retirement Benefits 214.44 251.77
Premium on redemption of Debentures 2,863.20 342.17
Carried forward losses and unabsorbed depreciation 1,075.37 594.41
Other Provisions 298.66 118.97
4,451.67 1,307.33
Share of Joint Ventures [Note 11(b) Page 102) (10.84) 0.03
Net Deferred Tax (Asset)/Liability (2,656.78) (157.95)
5 (i) Schedule 1 Item 4 (p) General Expenses include :2010-2011 2009-2010
Rupees Rupeesin lakhs in lakhs
(a) Auditors’ Remuneration -
Audit Fees 27.81 23.05
Fees for Taxation matters 6.36 4.02
Other Services 22.10 16.97
Reimbursement of out-of-pocket expenses 1.98 1.31
(b) Provision for doubtful debts/advances (net) 47.79 45.82
Expenses on Amalgamation /Securities/Warrant Issue includes
Auditors’ Remuneration - Other Services 4.41 0.88
6. Gain on foreign exchange fluctuation (net) credited to the profit and loss account amounted to Rs. 87.55 lakhs(2009-2010 : Rs. 84.88 lakhs) including share of Joint Ventures Rs. 58.33 lakhs (2009-10 : Rs. 17.23 lakhs)
7. There is no Micro and Small Enterprises to whom the Company owes dues, which are outstanding for more than45 days as at 31st March, 2011. This information as required to be disclosed under the Micro, Small and MediumEnterprises Development Act, 2006 has been determined to the extent such parties have been identified on thebasis of the information available with the Company.
8. There are no amounts due and outstanding to be credited to Investor Education and Protection Fund as at31st March, 2011 except Rs.4.48 lakhs (2009-2010 : Rs.3.99 lakhs) which is held in abeyance due to legal casespending.

Fifty-Ninth Annual Report 2010-2011
100
Notes on the Consolidated Balance Sheet and Profit and Loss Account (Contd.)
9. SEGMENTAL REPORTING :
2010-2011
Retailing Others Unallo- Totalcated Company
Rs. In lakhs Rs. In lakhs Rs. In lakhs Rs. In lakhsA SEGMENT REVENUE
1. External Revenue 1,56,485.99 2,828.00 3,574.93 1,62,888.92(1,10,033.63) (2,244.35) (1,482.54) (1,13,760.52)
2. Intersegment Revenue - 988.14 - 988.14- (1,403.48) - (1,403.48)
3. Total Revenue 1,56,485.99 3,816.14 3,574.93 1,63,877.06(110,033.63) (3,647.83) (1,482.54) (115,164.00)
4. Less: Intersegment Revenue - 988.14 - 988.14( - ) (1,403.48) ( - ) (1,403.48)
NET SEGMENT REVENUE 1,56,485.99 2,828.00 3,574.93 1,62,888.92(1,10,033.63) (2,244.35) (1,482.54) (1,13,760.52)
B RESULTS1. Segment Results (1,613.94) (173.62) 3,504.70 1,717.14
(253.28) (109.95) (1,227.61) (864.38)2. Interest Expense - - 931.77 931.77
( - ) ( - ) (788.25) (788.25)3. Exceptional Items (Income)/ Expense - - 84.00 84.00
( - ) ( - ) (836.71) (836.71)3. Provision For Taxation - - 2,055.69 2,055.69
( - ) ( - ) (844.95) (844.95)5. Excess tax provision for prior years (Net) - - (1,501.79) (1,501.79)
( - ) ( - ) (78.15) (78.15)
6. Net Profit (1,613.94) (173.62) 1,935.03 147.47(253.28) (109.95) (509.27) (146.04)
C SEGMENT ASSETS 1,00,663.94 2,970.21 71,918.24 1,75,552.39(71,307.29) (2,165.44) (44,092.60) (1,17,565.33)
D SEGMENT LIABILITIES 28,226.57 1,863.47 45,888.20 75,978.24(22,520.69) (1,375.32) (32,816.15) (56,712.17)
E CAPITAL EXPENDITURE 17,833.91 84.74 4,890.95 22,809.60(17,561.75) (37.20) (3,087.15) (20,686.10)
F DEPRECIATION 3,172.33 45.10 2.88 3,220.31(2,183.25) (21.93) (3.31) (2,208.49)
G NON CASH EXPENSESEmployee Stock Options Scheme 22.68 - - 22.68
(84.76) ( - ) ( - ) (84.76)
Notes:(1) In respect of standalone accounts of the Company, disclosure of segment - wise information is not applicable as
retailing is the main business of the Company. The Company, its subsidiaries and its jointly controlled entities areprimarily engaged in the business of retailing and services related to retailing except one subsidiary which isengaged in the business of distribution and one jointly controlled entity engaged in the business of consultancyservices. Segment “Others” primarily includes distribution business and consultancy services.
(2) Segment-wise Revenue, Results and Capital Employed figures include the respective amounts identifiable toeach of the Segments. Other unallocable income, expenses and unallocated assets mainly relate to investmentsof surplus funds.
(3) Figures in brackets are in respect of previous year.(4) Previous year’s figures have been regrouped wherever necessary.

A Enterprise
101
10. RELATED PARTY TRANSACTIONS :
10.1 Related Parties with whom transactions have taken place during the year:
Associates: Tata Sons Ltd.(Holds more than 20% of the Share Capital of the Company)
Joint Venture Trexa ADMC Private LimitedInditex Trent Retail India Private LimitedVirtuous Shopping Centres Private Limited (Held byTrent Hypermarket Limited)
10.2 Directors of the CompanyManaging Director Mr.N.N.Tata (resigned on 11th August 2010)Non Executive Directors Mr. F.K. Kavarana
Mr.B.S.Bhesania (retired on 18th August 2010)Mr.A.D.CooperMr.K.N.SuntookMr.N.N.Tata (wef 12th August 2010 till 18th August 2010.)Appointed as an Additional Director and Vice Chairman wef19th August 2010Mr.Zubin Dubash (wef 26th April 2010)Mr.Bhaskar Bhat (wef 27th September 2010)
Details of remuneration to directors is disclosed in Note No. 3 Page No. 98 on Balance Sheet and Profit and Loss account.
2010-2011 2009-2010Rupees Rupees
in lakhs in lakhs10.3 Sales to and Other recoveries from related parties
a) Associates 9.32 5.63b) Joint Venture - 45.66
10.4 Purchase/other services from related partiesAssociates 493.35 429.69
10.5 Interest/Dividend received to related partiesAssociates 14.00 14.00
10.6 Interest/Dividend paid to related partiesa) Associates 328.96 278.35b) Directors 3.88 2.40
10.7 Subscription to Share CapitalJoint Venture - 3,192.70
10.8 Security deposit given during the yearAssociates 21.00 -
10.9 Security deposit receivable as on 31.03.2011Associates 66.00 45.00
10.10 Outstanding Balance as on 31.3.2011 receivables by CompanyJoint Venture - 0.02
10.11 Outstanding Payables as on 31.3.2011Associates 171.17 103.34
10.12 Issue of Equity SharesDirectors 1.00 38.95
10.13 Issue of CCPSa) Associates 13,512.11 -b) Directors 162.46 -
10.14 Sitting feesDirectors 16.67 13.51
Notes on the Consolidated Balance Sheet and Profit and Loss Account (Contd.)

Fifty-Ninth Annual Report 2010-2011
102
11. The Subsidiaries and Interest in Joint Venture considered in Consolidated Financial Statements are :Country of Proportionate
Origin ownership interest
as on 31.3.2011 as on 31.3.2010
(a) Particulars of Subsidiaries1 Trent Brands Limited India 100.00 % 100.00 %2 Fiora Services Limited India
Held by Trent Limited 25.67 % 25.67 %Held by Trent Brands Limited (Subsidiary) 64.20% 64.20%
3 Nahar Theatres Private Limited India 100.00 % 100.00 %4 Fiora Link Road Properties Limited India 100.00 % 100.00 %5 Landmark Limited India
Held by Trent Limited 57.39 % 57.39 %Held by Subsidiaries of Trent Limited 17.66% 17.66%
6 Westland Limited India 96.64% 96.64%7 Trent Retail Services Private Limited Formerly
Regent Management Private Limited IndiaHeld by Landmark Limited (Subsidiary) 100.00 % 100.00 %
8 Landmark E Tail Private Limited IndiaHeld by Landmark Limited (Subsidiary) 100.00 % 100.00 %
9 Trent Hypermarket Limited India 100.00 % 100.00 %10 Trent Global Holdings Limited Mauritius 100.00 % 100.00 %
(b) Interest in Joint Venture1 Virtuous Shopping Centers Private Limited India 66.66% -
Held by Trent Hypermarket Limitedsubsidiary of the Company
2 Trexa ADMC Private Limited India 50.00 % 50.00 %3 Inditex Trent Retail Private Limited India 49.00% 49.00%
As at As at31.03.2011 31.03.2010
(Rupees (Rupeesin Lakhs) in Lakhs)
I Income1 Income from Operations 7,247.46 24.012 Other Income 67.19 30.54
II Expenditure1 Expenses 5,425.56 230.552 Depreciation 261.66 4.00
III Assets1 Fixed Assets 3,310.60 866.332 Investments 0.43 0.413 Deferred tax Asset/(Liabilities) 10.84 (0.03)4 Current Assets, Loans & Advances
- Cash and bank balances 1,477.00 2,548.17- Loans and Advances 830.88 332.24- Debtors 1.86 1.86- Inventories 854.96 38.03- Other Current Assets 6.95 -- Miscellaneous Expenditure - -
IV Liabilities1 Unsecured Loans - -2 Current Liabilities 2,213.02 669.653 Provisions 7.34 4.83
V Capital Commitments 521.00 225.15
Notes on the Consolidated Balance Sheet and Profit and Loss Account (Contd.)

A Enterprise
103
12. EARNINGS PER SHARE (EPS) :2010-2011 2009-2010
(a) Weighted Average Number of shares outstanding during the year.
i) For Basic Earnings Per Share 20,051,974 19,589,303
ii) For Diluted Earnings Per Share
No of shares for Basic EPS as per a(i) 20,051,974 19,589,303
Add: Dilutive Potential Equity Shares in respect ofoutstanding warrants/options 1,903,534 112,753
No of shares for Diluted Earnings Per Share 21,955,508 19,702,056
(b) Net Profit/(Loss) after Tax available for Equity Shareholders(Rupees in Lakhs) 749.17 155.70
(c) Less : Dividend to Preference Shareholders and applicabledividend distribution tax there on 1.43 0.01
(d) Net Profit/(Loss) after Tax After extra Ordinary item available for 747.74 1 5 5 . 6 9Equity Share Holders ( Rupees in lakhs)
(e) Less : Extra Ordinary Item 105.98 -
(f ) Net Profit/(Loss) after Tax Before extra Ordinary item available for 641.76 1 5 5 . 6 9Equity Share Holders ( Rupees in lakhs)
(g) Earnings Per Share before Extra Ordinary Item(Rs.)(Face value of Rs.10/-)
Basic 3.20 0.79
Diluted 2.92 0.79
(h) Earnings Per Share After Extra Ordinary Item(Rs.) (Face value of Rs.10/-)
Basic 3.73 0.79
Diluted 3.41 0.79
13. The scheme of Amalgamation of Satnam Developers and Finance Private Limited (SDPL) and Satnam RealtorsPrivate Limited (SRPL) with the company as approved by the Hon’ble High Court of Judicature at Bombay hasbecome effective on March 12, 2010 upon obtaining all sanctions and approvals as required under the schemeand upon filing of certified true copies of the order with the Registrar Of Companies, Maharashtra. The appointeddate of the scheme is April 1, 2009. SDPL was a 100% subsidiary of the Company engaged in the business of realestate investment and development activities and SRPL was engaged in the business of construction anddevelopment activities. SDPL held 50% of the shares in SRPL.
In terms of the scheme,
(a) All the assets and liabilities of SDPL and SRPL stand transferred to and vested in the company with effectfrom the appointed date.
(b) Inter corporate loans, deposits and balances as between SDPL, SRPL and the Company stands cancelled.
(c) The book value of the shares held by the Company in SDPL, as appearing in the books of the Company, thebook value of shares held by SDPL in SRPL and the advance paid by SDPL towards acquisition of shares inSRPL, as appearing in the books of SDPL, stands cancelled.
Notes on the Consolidated Balance Sheet and Profit and Loss Account (Contd.)

Fifty-Ninth Annual Report 2010-2011
104
(d) The company on March 26, 2010 has issued 70,000 fully paid 0.1% Redeemable Preference Shares ofRs.1000 each to the equity shareholders of the erstwhile SRPL ( except for shares held by SDPL) in the ratioof 14 Preference Shares for every 1 Equity Share held.
(e) The scheme of amalgamation with SDPL is being accounted for under the pooling of interest method andwith SRPL is being accounted for under the Purchase Method as contained in AS14 “Accounting foramalgamation” issued by the ICAI. The vested assets and liabilities of SDPL and SRPL have been recognizedat their book values in the books of the Company.
(f ) The costs and expenses amounting to Rs. 120.02 lakhs (net of tax Rs.80.15 lakhs) incurred for implementationof the scheme have been adjusted against the general reserve of the company.
(g) The deficit of Rs.2519.32 lakhs arising due to the difference between the value of assets over the value ofliabilities of SDPL and SRPL and the face value of the preference shares issued by the company and afteradjusting the diminution in the value of Long term investments to the extent of Rs.186.09 lakhs andFinished goods inventory Rs. 918.77 lakhs (net of tax - Rs.606.48 lakhs) as approved by the board has beenadjusted first against the amalgamation reserve to the extent of Rs.1492.95 lakhs and the balance Rs.1026.37lakhs against the general reserve.
14. On 30th April 2010 the Company acquired 100% Equity Shares and Preference Shares of Optim Estate PrivateLimited making it a wholly owned subsidiary of the company. The Scheme of Amalgamation of Optim EstatesPrivate Limited with Trent Hypermarket Limited (100 % subsidiary of the Company) as approved by the Hon’ableHighcourt of judicature at Bombay is effective 20th September 2010 . The appointed date of the Scheme is 1stApril 2009. In terms of the Scheme Trent Hypermarket Limited has issued the Company 1,50,000 Equity Sharesof Rs 10 each and 10,00,000 10% p.a. Redeemable Preference Shares of Rs 10 each in consideration against itsholdings in Optim Estates Private Limited.
15 Extra ordinary item represents profit of Rs. 144.97 Lakhs (net of tax Rs. 105.98 Lakhs) on sale of investments bya subsidiary of the Company.
16 Previous year’s figures have been regrouped wherever necessary.Signatures to Schedules ‘1’ to ‘5.’ and ‘A’ to ‘M’ and Notes.
Notes on the Consolidated Balance Sheet and Profit and Loss Account (Contd.)
As per our report attached. For and on behalf of the Board,
For N. M. RAIJI & CO., F. K. KAVARANA ChairmanChartered Accountants
N. N. TATA Vice Chairman
A. D. COOPERZUBIN DUBASH Directors
Y. N. THAKKAR M. M. SURTI BHASKAR BHATPartner Company Secretary
Mumbai, 25th May 2011
}
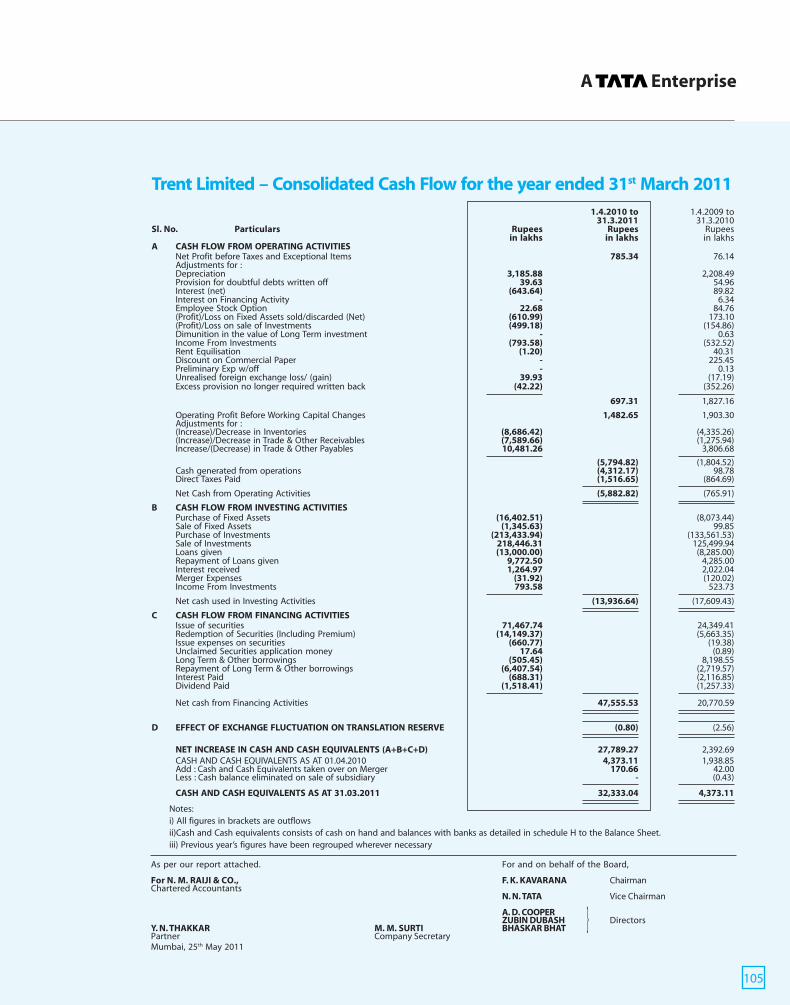
A Enterprise
105
Trent Limited – Consolidated Cash Flow for the year ended 31st March 20111.4.2010 to 1.4.2009 to
31.3.2011 31.3.2010Sl. No. Particulars Rupees Rupees Rupees
in lakhs in lakhs in lakhsA CASH FLOW FROM OPERATING ACTIVITIES
Net Profit before Taxes and Exceptional Items 785.34 76.14Adjustments for :Depreciation 3,185.88 2,208.49Provision for doubtful debts written off 39.63 54.96Interest (net) (643.64) 89.82Interest on Financing Activity - 6.34Employee Stock Option 22.68 84.76(Profit)/Loss on Fixed Assets sold/discarded (Net) (610.99) 173.10(Profit)/Loss on sale of Investments (499.18) (154.86)Dimunition in the value of Long Term investment - 0.63Income From Investments (793.58) (532.52)Rent Equilisation (1.20) 40.31Discount on Commercial Paper - 225.45Preliminary Exp w/off - 0.13Unrealised foreign exchange loss/ (gain) 39.93 (17.19)Excess provision no longer required written back (42.22) (352.26)
697.31 1,827.16
Operating Profit Before Working Capital Changes 1,482.65 1,903.30Adjustments for :(Increase)/Decrease in Inventories (8,686.42) (4,335.26)(Increase)/Decrease in Trade & Other Receivables (7,589.66) (1,275.94)Increase/(Decrease) in Trade & Other Payables 10,481.26 3,806.68
(5,794.82) (1,804.52)Cash generated from operations (4,312.17) 98.78Direct Taxes Paid (1,516.65) (864.69)
Net Cash from Operating Activities (5,882.82) (765.91)
B CASH FLOW FROM INVESTING ACTIVITIESPurchase of Fixed Assets (16,402.51) (8,073.44)Sale of Fixed Assets (1,345.63) 99.85Purchase of Investments (213,433.94) (133,561.53)Sale of Investments 218,446.31 125,499.94Loans given (13,000.00) (8,285.00)Repayment of Loans given 9,772.50 4,285.00Interest received 1,264.97 2,022.04Merger Expenses (31.92) (120.02)Income From Investments 793.58 523.73
Net cash used in Investing Activities (13,936.64) (17,609.43)
C CASH FLOW FROM FINANCING ACTIVITIESIssue of securities 71,467.74 24,349.41Redemption of Securities (Including Premium) (14,149.37) (5,663.35)Issue expenses on securities (660.77) (19.38)Unclaimed Securities application money 17.64 (0.89)Long Term & Other borrowings (505.45) 8,198.55Repayment of Long Term & Other borrowings (6,407.54) (2,719.57)Interest Paid (688.31) (2,116.85)Dividend Paid (1,518.41) (1,257.33)
Net cash from Financing Activities 47,555.53 20,770.59
D EFFECT OF EXCHANGE FLUCTUATION ON TRANSLATION RESERVE (0.80) (2.56)
NET INCREASE IN CASH AND CASH EQUIVALENTS (A+B+C+D) 27,789.27 2,392.69CASH AND CASH EQUIVALENTS AS AT 01.04.2010 4,373.11 1,938.85Add : Cash and Cash Equivalents taken over on Merger 170.66 42.00Less : Cash balance eliminated on sale of subsidiary - (0.43)
CASH AND CASH EQUIVALENTS AS AT 31.03.2011 32,333.04 4,373.11
Notes:i) All figures in brackets are outflowsii)Cash and Cash equivalents consists of cash on hand and balances with banks as detailed in schedule H to the Balance Sheet.iii) Previous year’s figures have been regrouped wherever necessary
As per our report attached. For and on behalf of the Board,
For N. M. RAIJI & CO., F. K. KAVARANA ChairmanChartered Accountants
N. N. TATA Vice Chairman
A. D. COOPERZUBIN DUBASH Directors
Y. N. THAKKAR M. M. SURTI BHASKAR BHATPartner Company SecretaryMumbai, 25th May 2011
}

Fifty-Ninth Annual Report 2010-2011
106
Tren
t Br
ands
Fior
a Se
rvic
esN
ahar
The
atre
sFi
ora
Link
Roa
dTr
ent
Tren
t G
loba
lLa
ndm
ark
Wes
tland
Tren
tLa
ndm
ark
E-Ta
ilLi
mite
dLi
mite
dPr
ivat
e Li
mite
dPr
oper
ties
Lim
ited
Hyp
erm
arke
tH
oldi
ngs
Lim
ited
Lim
ited
Reta
il Se
rvic
esPr
ivat
e Li
mite
dLi
mite
dLi
mite
d #
Pvt.
Lim
ited
31st
31st
31st
31st
31st
31st
31st
31st
31st
31st
31st
31st
31st
31st
31st
31st
31st
31st
31st
31st
Mar
chM
arch
Mar
chM
arch
Mar
chM
arch
Mar
chM
arch
Mar
chM
arch
Mar
chM
arch
Mar
chM
arch
Mar
chM
arch
Mar
chM
arch
Mar
chM
arch
2011
2010
2011
2010
2011
2010
2011
2010
2011
2010
2011
2010
2011
2010
2011
2010
2011
2010
2011
2010
Rupe
esRu
pees
Rupe
esRu
pees
Rupe
esRu
pees
Rupe
esRu
pees
Rupe
esRu
pees
Rupe
esRu
pees
Rupe
esRu
pees
Rupe
esRu
pees
Rupe
esRu
pees
Rupe
esRu
pees
InIn
InIn
InIn
InIn
InIn
InIn
InIn
InIn
InIn
InIn
lakh
sla
khs
lakh
sla
khs
lakh
sla
khs
lakh
sla
khs
lakh
sla
khs
lakh
sla
khs
lakh
sla
khs
lakh
sla
khs
lakh
sla
khs
lakh
sla
khs
Capi
tal
325
.00
325
.00
151
.91
151
.91
20.
96 2
0.96
5.0
0 5
.00
5,2
20.0
0 5
,105
.00
327
.30
327
.30
731
.47
731
.47
428
.35
28.
35 1
.00
1.0
0 1
.00
1.0
0
Rese
rves
and
Surp
lus
2,2
80.6
7 7
68.8
1 5
85.9
3 4
78.0
0 3
03.7
4 3
00.2
8 -
- 7
,122
.90
7,1
22.9
0 1
29.6
4 3
44.2
6 8
.56
8.6
2 -
Tota
l A
sset
s 2
,605
.67
1,0
93.8
1 8
87.8
3 7
29.9
1 9
94.7
0 1
,117
.19
3,2
07.5
0 3,
207.
50 2
7,29
5.00
15,
105.
00 1
1.68
16.
01 1
0,38
2.24
8,4
90.4
6 1
,214
.87
1,0
59.9
4 9
.56
9.6
2 1
.00
1.0
0
Tota
l Lia
bilit
ies
2,6
05.6
7 1
,093
.81
887
.83
729
.91
994
.70
1,1
17.1
9 3
,207
.50
3,20
7.50
27,
295.
00 1
5,10
5.00
11.
68 1
6.01
10,
382.
24 8
,490
.46
1,2
14.8
7 1
,059
.94
9.5
6 9
.62
1.0
0 1
.00
31st
31st
31st
31st
31st
31st
31st
31st
31st
31st
31st
31st
31st
31st
31st
31st
31st
31st
31st
31st
Mar
chM
arch
Mar
chM
arch
Mar
chM
arch
Mar
chM
arch
Mar
chM
arch
Mar
chM
arch
Mar
chM
arch
Mar
chM
arch
Mar
chM
arch
Mar
chM
arch
2011
2010
2011
2010
2011
2010
2011
2010
2011
2010
2011
2010
2011
2010
2011
2010
2011
2010
2011
2010
Rupe
esRu
pees
Rupe
esRu
pees
Rupe
esRu
pees
Rupe
esRu
pees
Rupe
esRu
pees
Rupe
esRu
pees
Rupe
esRu
pees
Rupe
esRu
pees
Rupe
esRu
pees
Rupe
esRu
pees
InIn
InIn
InIn
InIn
InIn
InIn
InIn
InIn
InIn
InIn
lakh
sla
khs
lakh
sla
khs
lakh
sla
khs
lakh
sla
khs
lakh
sla
khs
lakh
sla
khs
lakh
sla
khs
lakh
sla
khs
lakh
sla
khs
lakh
sla
khs
Turn
over
* 7
9.65
54.
82 1
,825
.29
1,31
6.87
109
.83
105
.38
- -
51,
987.
72 2
8,96
9.84
2.8
0 -
26,
192.
69 2
2,84
8.80
3,8
12.9
5 3
,600
.30
0.1
2 -
- 0
.96
Prof
it/(L
oss)
Befo
re T
ax 1
7.16
(13
3.72
) (
23.9
3) 4
.32
9.9
0 (
6.23
) (
0.26
) (
0.23
) (5
,089
.16)
(3,
150.
96)
(3.
53)
(6.
67)
(1,8
58.8
4) (
160.
59)
(23
2.08
) (
84.1
2) (
0.05
) (
0.18
) (
0.07
) 0
.87
Prov
isio
n Fo
rTa
xatio
n (
1,49
4.69
) 3
0.35
(4.
69)
(1.
09)
6.4
4 4
.61
- -
(32
3.03
) (
237.
24)
- -
21.
32 7
.00
- -
- -
- -
Net
Pro
fit/(
Loss
) 1,
511.
85 (
164.
07)
107
.92
5.4
1 3
.46
(10
.84)
(0.
26)
(0.
23)
(4,7
66.1
3) (
2,91
3.72
) (
3.53
) (
6.67
) 8
5.65
(16
7.59
) (
337.
45)
(84
.12)
(0.
05)
(0.
18)
(0.
07)
0.8
7
Prop
osed
Div
iden
dPe
rcen
tage
(Equ
ity)
Nil
Nil
Nil
Nil
Nil
Nil
Nil
Nil
Nil
Nil
Nil
Nil
Nil
Nil
Nil
Nil
Nil
Nil
Nil
Nil
Am
ount
(Eq
uity
Div
iden
d) N
il N
il N
il N
il N
il N
il N
il N
il N
il N
il N
il N
il N
il N
il N
il N
il N
il N
il N
il N
il
*Re
pres
ents
inco
me
from
ope
ratio
n an
d ot
her
inco
me
# T
he C
losi
ng e
xcha
nge
rate
as
on 3
1st
Mar
ch 2
011
USD
=IN
R 44
.61
Sum
mar
ised
Fin
anci
al S
tate
men
t o
f Su
bsi
dia
ries

A Enterprise
107
Details of Investments - Subsidiary - TRENT BRANDS LIMITED
Balance as Purchased during Sold during Balance ason 1.4.2010 the year the year on 31.3.2011
No.of. Rupees No.of. Rupees No.of. Rupees No.of. RupeesShares/Units in lakhs Shares/Units in lakhs Shares/Units in lakhs Shares/Units in lakhs
Long Term Investments :
(at Cost less provision for diminution in value)
Face Value of Rs 10 each,Unquoted andfully paid-up unless otherwise stated
(a) In Subsidiary Company :
Fiora Services Limited 97,530 203.42 - - - - 97,530 203.42(Equity shares of Rs. 100/- each )
Landmark Limited 264,028 804.79 - - - - 264,028 804.79
Total Investments in Subsidiary Company 1,008.21 - 1,008.21
(b) In Other Shares
Aftek Ltd. (Quoted) 50,000 29.49 - - - - 50,000 29.49(Equity shares of Rs. 2/- each )
B F Utilities Ltd (Quoted) 800 1.77 - - - - 800 1.77(Equity shares of Rs. 5/- each )
B F Investments Ltd. 800 16.72 - - - - 800 16.72
Indus Fila ltd. (Quoted) 12,000 27.03 - - - - 12,000 27.03
Jai Corp Ltd. (Quoted) 5,000 51.88 - - - - 5,000 51.88(Equity shares of Rs. 1/- each )
Northgate Technologies Ltd. (Quoted) 8,500 50.97 - - - - 8,500 50.97
Punj Llyod Ltd. (Quoted) 10,000 52.02 - - - - 10,000 52.02(Equity shares of Rs. 2/- each )
Reliance Industries Ltd. (Quoted) 5,624 96.40 - - 5,624 96.40 - -
Sasken Communication Technologies Ltd. (Quoted) 10,000 49.03 - - - - 10,000 49.03
Take Solutions Ltd (Quoted) 73,000 75.65 - - - - 73,000 75.65
Tata Investment Corporation Ltd. (Quoted) 17,325 34.68 - - - - 17,325 34.68
Tata Investment Corporation Ltd.-ZCCB-Warrant 2,475 - - - - - 2,475 -
Venus Remidies Ltd (Quoted) 10,000 38.95 - - - - 10,000 38.95
Videocon Industries Ltd. (Quoted) 9,500 49.90 - - - - 9,500 49.90
Total Invstment in Other Co.-Long Term 574.49 478.09
(c) In Mutual Funds
- -
HDFC Cash Mgmt Fund-Savings Plan—Growth - - 5,021,795 1,000.00 5,021,795 1,000.00 - -
HDFC Cash Mgmt Fund-Treasury Advantage Plan-WDR 5,275,503 528.79 20,787,453 2,084.32 26,062,957 2,613.11 - -
Tata Fixed Maturity Plan Series 28 Scheme A dividend - - 10,000,000 1,000.00 5,250,000 525.00 4,750,000 475.00
Total investment in Mutual Fund 528.79 475.00
Total Investments 2,111.48 1,961.30
Aggregate book value of Investments
Unquoted 1,537.00 1,483.21
Quoted [ Market value Rs.460.07 (2009-2010: 574.49 478.09Rs.280.00 Lakhs)]
Total 2,111.48 1,961.30

Fifty-Ninth Annual Report 2010-2011
108
LONG TERM INVESTMENTS :Non Trade (unquoted and fully paid unlessotherwise stated)
(a) In SharesTrent Limited (Quoted) 159,943 131.85 159,943 131.851,59,943 (2009-10 : 1,59,943) Equity Shares ofRs. 10/- each
131.85 131.85
(b) In Subsidiary CompanyLandmark Limited 2,513 6.55 2,513 6.552,513 (2009-10: 2,513) Equity Shares of Rs. 100/- each
Total Investments in Subsidiary Company 6.55 6.55
Total Long Term Investments 138.40 138.40
Total Investment 138.40 138.40
Aggregate book value of InvestmentsUnquoted 6.55 6.55Quoted [Market value Rs.1,571.68 lakhs - (2009-10 131.85 131.85Rs.1,283.38 lakhs)]
Total 138.40 138.40
Details of Investments - Subsidiary - FIORA SERVICES LIMITED
Balance as Purchased during Sold during Balance ason 1.4.2010 the year the year on 31.3.2011
No.of. Rupees No.of. Rupees No.of. Rupees No.of. RupeesShares/Units in lakhs Shares/Units in lakhs Shares/Units in lakhs Shares/Units in lakhs
Details of Investments - Subsidiary - TRENT HYPER MARKET LIMITED
Balance as Purchased during Sold during Balance ason 1.4.2010 the year the year on 31.3.2011
No.of. Rupees No.of. Rupees No.of. Rupees No.of. RupeesShares/Units in lakhs Shares/Units in lakhs Shares/Units in lakhs Shares/Units in lakhs
Long Term Investment
Investment in Joint Venture
Virtuous Shopping Centres Private Limited - 673,266 92.22 673,266 92.22
Total Long Term Investment - 92.22
Mutual Funds
HDFC Cash Managt Treasury advantage wholesale Growth 2,477,394 500.00 2,477,394 500.00
Tata Floater Fund Growth 7,282,897 1,000.00 7,282,897 1,000.00
Total Current Investment 1,500.00 1,500.00
Total Investments 1,500.00 1,592.22
Quoted -Unquoted 1,500.00 1,592.22
Details of Investments - Subsidiary - FIORA LINK ROAD PROPERTIES LIMITED
Balance as Purchased during Sold during Balance ason 1.4.2010 the year the year on 31.3.2011
No.of. Rupees No.of. Rupees No.of. Rupees No.of. RupeesShares/Units in lakhs Shares/Units in lakhs Shares/Units in lakhs Shares/Units in lakhs
Long Term Investments:
(at cost less provision for dumunition in value)
Other Investmenst :
Landmark Limited 1,025,592 3,206.23 - - - - 1,025,592 3,206.23
Equity shares of Rs.10/- each

A Enterprise
109
Details of Investments - Subsidiary - LANDMARK LIMITED
Balance as Purchased during Sold during Balance ason 1.4.2010 the year the year on 31.3.2011
No.of. Rupees No.of. Rupees No.of. Rupees No.of. RupeesShares/Units in lakhs Shares/Units in lakhs Shares/Units in lakhs Shares/Units in lakhs
Long term investments (At cost)
1. Trade - Unquoted
A. Subsidiaries
Landmark E-Tail Private Ltd 1,000 1.00 - - - - 1,000 1.00
Trent Retail Services Management
Private Limited
(Formerly Regent Management Private Limited) 1,000 1.00 - - - - 1,000 1.00
Total Investments in Subsidiary Company 2.00 - 2.00
2. Non Trade - Quoted
B. In fully paid equity shares
Kothari Industries Ltd 1,000 0.48 - - - - 1,000 0.48
DSQ Software Ltd 100 0.13 - - - - 100 0.13
TOTAL QUOTED INVESTMENT IN SHARES 0.61 0.61
C. Mutual Funds
HDFC Cash Management Treasury Advantage 1,751,673 350.00 - - 1,751,673 350.00 - -
Reliance Money Manager Fund - Retail Growth 28,114 350.00 - - 28,114 350.00 - -
UTI Master Share 1,300 0.20 1,300 0.20
TOTAL QUOTED INVESTMENT IN MUTUAL FUNDS 700.20 - - 0.20
Less : Provision for diminution in value of investment (1.61) - - - - (1.61)
Total Investment 701.20 - - 1.19
Aggregate book value of Investments
Unquoted 701.20 1.19
Quoted - -

Fifty-Ninth Annual Report 2010-2011
110
NOTES
Registered Office: Bombay House, 24 Homi Mody Street, Mumbai – 400 001.
ATTENDANCE SLIPI hereby record my presence at the FIFTY-NINTH ANNUAL GENERAL MEETING of the Company at Walchand HirachandHall, 4th Floor, Indian Merchants’ Chamber (IMC), IMC Building, IMC Marg, Churchgate, Mumbai – 400 020 on Friday,5th August 2011 at 3.00 p.m.
Member’s/Proxy‘s full name __________________________________________________________________________(In block letters)
Folio No. _____________________ DP ID* ______________________ Client ID*_______________________
No. of shares held __________________________________________________________________________________
* Applicable for members holding shares in electronic form.
Member’s/Proxy Signature
NOTES : 1. Shareholder/Proxyholder wishing to attend the meeting must bring the Attendance Slip to the meetingand hand over the same duly signed, at the entrance.
2. Shareholder/Proxyholder desiring to attend the meeting should bring his copy of the Annual Report forreference at the meeting.
Registered Office: Bombay House, 24 Homi Mody Street, Mumbai – 400 001.
PROXY FORM
I/We___________________________________________________________________________________________ of______________________________________________________________________________________ in the district of_______________________________________________ being a member/members of the above named Company, herebyappoint ____________________ of ____________________________ in the district of ______________________________or failing him/ her _______________________________________________ of ________________________ in the districtof ________________________ as my/our Proxy to attend and vote for me/us, on my/our behalf at the FIFTY-NINTHANNUAL GENERAL MEETING of the Company, to be held on Friday,5th August, 2011 at 3.00 p.m. or at any adjourned meeting thereof.
Signed this ____________________________ day of _____________________________ 2011.
Folio No. ________________________ DP ID* ______________________ Client ID*_______________________
No. of shares held ______________________________
This form is to be used @ in favour of the resolution, Unless otherwise instructed, the Proxy will vote as he/ she thinks fit. @ against* Applicable for members holding shares in electronic form.@ Strike out whichever is not desired.NOTES: 1. The proxy must be returned so as to reach the Registered Office of the Company, Bombay House,
24, Homi Mody Street, Mumbai – 400 001, not less than FORTY-EIGHT HOURS before the time for holdingthe aforesaid meeting.
2. The proxy need not be a member of the Company.
AffixSignature_____________ Revenue ___________
Stamp
Dematerialise your Physical Shares to Electronic Form• Eliminate all risks associated with Physical Shares• Ease in Portfolio Management
Procedure for Dematerialisation of Shares :• Open Beneficiary Account with a Depository Participant (DP) registered with SEBI.• Submit Dematerialisation Request Form (DRF) as given by the DP, duly signed by all the holders with the
names and signatures in the same order as appearing in the concerned certificate(s).


Cover Back I ns ide


