14
Ministry of Environment, Forest & Climate Change, Govt. of India CHAPTER - 1 TELANGANA PROFILE “What you do today can improve all your tomorrows.” Ralph Marston

Ministry of Environment, Forest & Climate Change, Govt. of India
CHAPTER - 1
TELANGANA PROFILE
“What you do today can improve all your
tomorrows.”
Ralph Marston
This chapter gives on overview of the historical
journey, profile, language, state symbols of
Telangana. Discuss on population, sex ratio,
density, economy, PCI, Employment pattern,
unemployment, HDI in the state. An overview of
different sectors is also outlined.
Environment Protection Training & Research Institute, HyderabadMinistry of Environment, Forest & Climate Change, Govt. of India
1State of Environment Report, Telangana - 2015Chp.1
CHAPTER 1
TELANGANA PROFILE
1.0 Historical Journey
1.1 State Profile
1.1.1 Language
th ndTelangana is the 29 youngest state in Union of India, formed on 2 of June 2014. The Telangana region was
th 1stpart of the Hyderabad state from September 17 1948 to November 1956, until it was merged with
Andhra state to form the state of Andhra Pradesh. After a prolonged agitation and movements for a separate
State, Telangana emerged as separate state as per the Andhra Pradesh Reorganization Act, 2014 (no.6 of
2014) of Parliament with the city of Hyderabad as its capital.
The state has a glorious legacy of the rulers of Pre-Satavahanas (1000 BCE-300 BCE), Satavahanas (250
BCE-200 CE), Rastrakuttas, Kakatiyas (950 CE – 1323 CE), Qutub shahis (1496-1687) and Asaf Jahis (1724-
1948), further enriched by the contribution of the immigrant cultures of the Mudaliars, Marwadis,
Kayasthas and Parsis. Telangana apart from the historical perspective of various dynastic, regional and
cultural influences offers a plethora of pristine natural beauty and historical monuments.
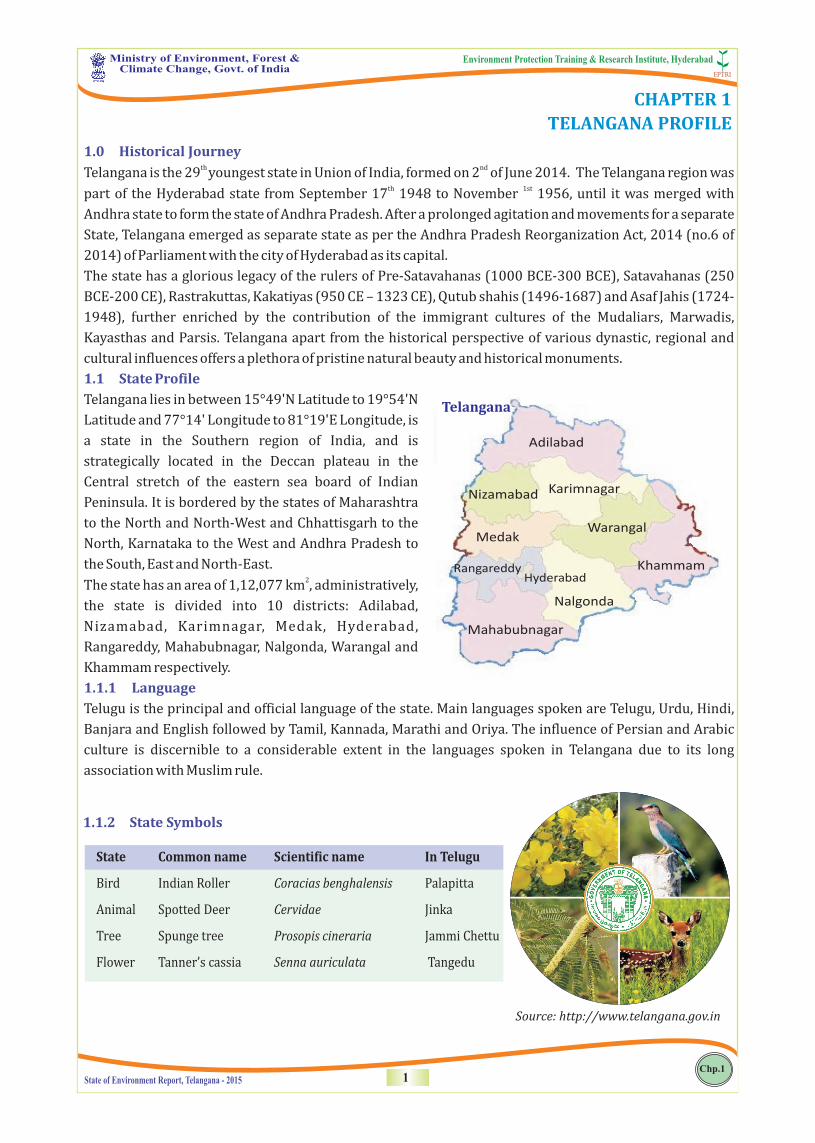
Telangana lies in between 15°49'N Latitude to 19°54'N
Latitude and 77°14' Longitude to 81°19'E Longitude, is
a state in the Southern region of India, and is
strategically located in the Deccan plateau in the
Central stretch of the eastern sea board of Indian
Peninsula. It is bordered by the states of Maharashtra
to the North and North-West and Chhattisgarh to the
North, Karnataka to the West and Andhra Pradesh to
the South, East and North-East.2The state has an area of 1,12,077 km , administratively,
the state is divided into 10 districts: Adilabad,
Nizamabad, Karimnagar, Medak, Hyderabad,
Rangareddy, Mahabubnagar, Nalgonda, Warangal and
Khammam respectively.
Telugu is the principal and official language of the state. Main languages spoken are Telugu, Urdu, Hindi,
Banjara and English followed by Tamil, Kannada, Marathi and Oriya. The influence of Persian and Arabic
culture is discernible to a considerable extent in the languages spoken in Telangana due to its long
association with Muslim rule.
Source: http://www.telangana.gov.in
1.1.2 State Symbols
State Common name Scientific name In Telugu
Bird Indian Roller Coracias benghalensis Palapitta
Animal Spotted Deer Cervidae Jinka
Tree
Spunge tree
Prosopis cineraria
Jammi Chettu
Flower
Tanner’s cassia
Senna auriculata
Tangedu
Adilabad
Nizamabad
Karimnagar
Warangal
Medak
Hyderabad
Rangareddy
Khammam
Nalgonda
Mahabubnagar
Telangana

Nirmal Painting Bidri Craft
1.1.3 Arts and Crafts
The artifacts and crafts made by the artisans of Telangana are in great demand throughout the world. The
Art, Culture and Traditions of Telangana are a fusion of the Telugu and Persian culture dating back to the
Nizams and Mughals. Hence, there is a combined influence of Hinduism and Islam. The wood crafts and
Nirmal paintings from Nirmal district, Cheriyal paintings from Warangal district, Pochampally weaves from
Nalgonda district, Bidri craft from Hyderabad and Sliver Filigree from Karimnagar district are famous in the
state.
1.1.4 Festivals
The people of Telangana not only celebrate the major festivals of India like Dassera, Holi, Eid, Ramzan, Bhai
duj, Christmas etc., but also other regional festivals like Bathukamma and Bonalu (State festivals),
Yedupayala Jatra, Saralamma Jatra, Ayak or Bhimanna festival and Sadar festivals.
Bathukamma Bonalu
Sammakka Saarakka Jaatara Ramzan
Environment Protection Training & Research Institute, HyderabadMinistry of Environment, Forest & Climate Change, Govt. of India
2State of Environment Report, Telangana - 2015Chp.1
3State of Environment Report, Telangana - 2015Chp.1
Environment Protection Training & Research Institute, HyderabadMinistry of Environment, Forest & Climate Change, Govt. of India
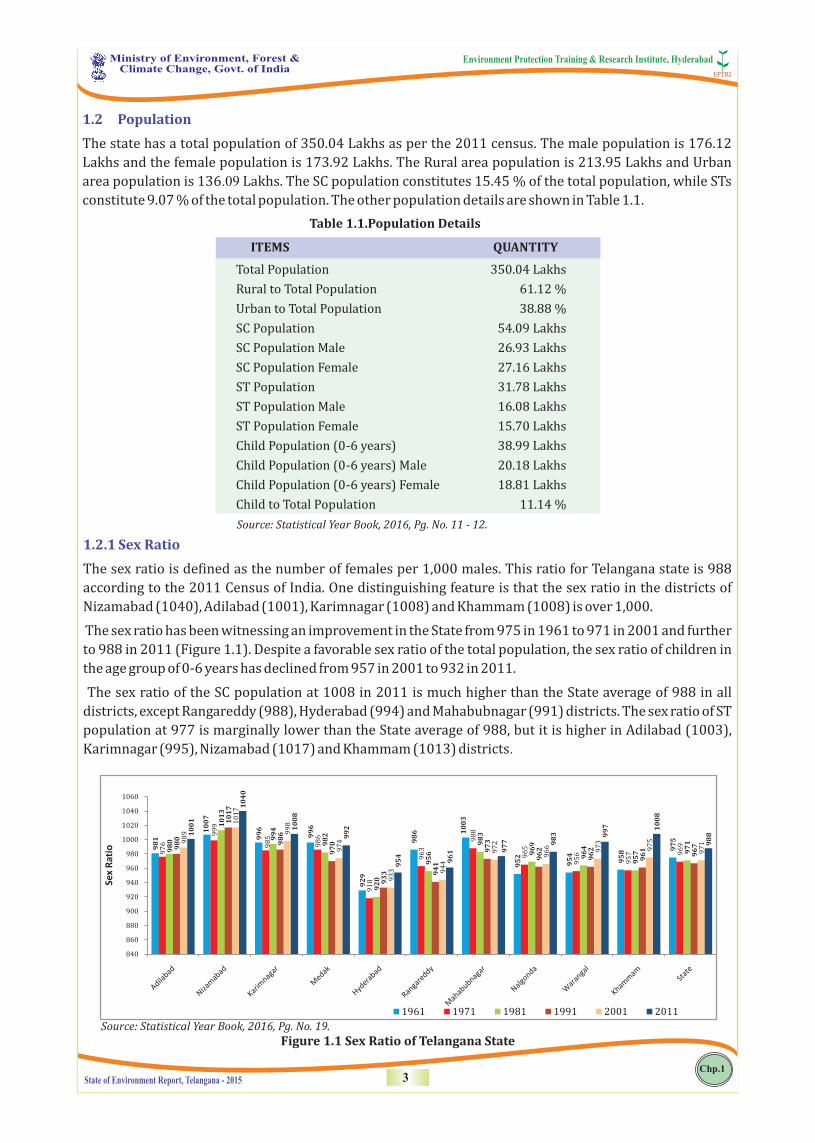
1.2.1 Sex Ratio
The sex ratio is defined as the number of females per 1,000 males. This ratio for Telangana state is 988
according to the 2011 Census of India. One distinguishing feature is that the sex ratio in the districts of
Nizamabad (1040), Adilabad (1001), Karimnagar (1008) and Khammam (1008) is over 1,000.
The sex ratio has been witnessing an improvement in the State from 975 in 1961 to 971 in 2001 and further
to 988 in 2011 (Figure 1.1). Despite a favorable sex ratio of the total population, the sex ratio of children in
the age group of 0-6 years has declined from 957 in 2001 to 932 in 2011.
The sex ratio of the SC population at 1008 in 2011 is much higher than the State average of 988 in all
districts, except Rangareddy (988), Hyderabad (994) and Mahabubnagar (991) districts. The sex ratio of ST
population at 977 is marginally lower than the State average of 988, but it is higher in Adilabad (1003),
Karimnagar (995), Nizamabad (1017) and Khammam (1013) districts.
Figure 1.1 Sex Ratio of Telangana StateSource: Statistical Year Book, 2016, Pg. No. 19.
1.2 Population
The state has a total population of 350.04 Lakhs as per the 2011 census. The male population is 176.12
Lakhs and the female population is 173.92 Lakhs. The Rural area population is 213.95 Lakhs and Urban
area population is 136.09 Lakhs. The SC population constitutes 15.45 % of the total population, while STs
constitute 9.07 % of the total population. The other population details are shown in Table 1.1.
Source: Statistical Year Book, 2016, Pg. No. 11 - 12.
Table 1.1.Population Details
ITEMS QUANTITY
Total Population 350.04 Lakhs
Rural to Total Population 61.12 %
Urban to Total Population 38.88 %
SC Population 54.09 Lakhs
SC Population Male 26.93 Lakhs
SC Population Female 27.16 Lakhs
ST Population 31.78 Lakhs
ST Population Male 16.08 Lakhs
ST Population Female 15.70 Lakhs
Child Population (0-6 years) 38.99 Lakhs
Child Population (0-6 years) Male 20.18 Lakhs
Child Population (0-6 years) Female 18.81 Lakhs
Child to Total Population 11.14 %
98
1
10
07
99
6
99
6
92
9
98
6 10
03
95
2
95
4
95
8 97
5
97
6
99
9
98
5
98
6
91
8
96
3
98
8
96
5
95
6
95
7 96
9
98
0
10
13
99
4
98
2
92
0
95
6
98
3
96
9
96
4
95
7 97
1
98
0
10
17
98
6
97
0
93
3 94
1
97
3
96
2
96
2
96
1
96
7
98
9
10
17
99
8
97
4
93
3 94
4
97
2
96
6 97
3
97
5
97
1
10
01
10
40
10
08
99
2
95
4
96
1 97
7 98
3 99
7 10
08
98
8
840
860
880
900
920
940
960
980
1000
1020
1040
1060
Sex
Rat
io
1961 1971 1981 1991 2001 2011
170 321 319 313
18172
707 220 245 273 1970
2000
4000
6000
8000
10000
12000
14000
16000
18000
20000
De
nsi
ty o
f P
op
ula
tio
n (
pe
r Sq
.Km
)
Environment Protection Training & Research Institute, HyderabadMinistry of Environment, Forest & Climate Change, Govt. of India
4State of Environment Report, Telangana - 2015Chp.1
Hyderabad125882
Rangareddy120817
Mahabubnagar 37203
Nalgonda45072
32033Khammam32421
Adilabad23878
Nizamabad22585
Karimnagar 38581
Medak, 43528
Warangal
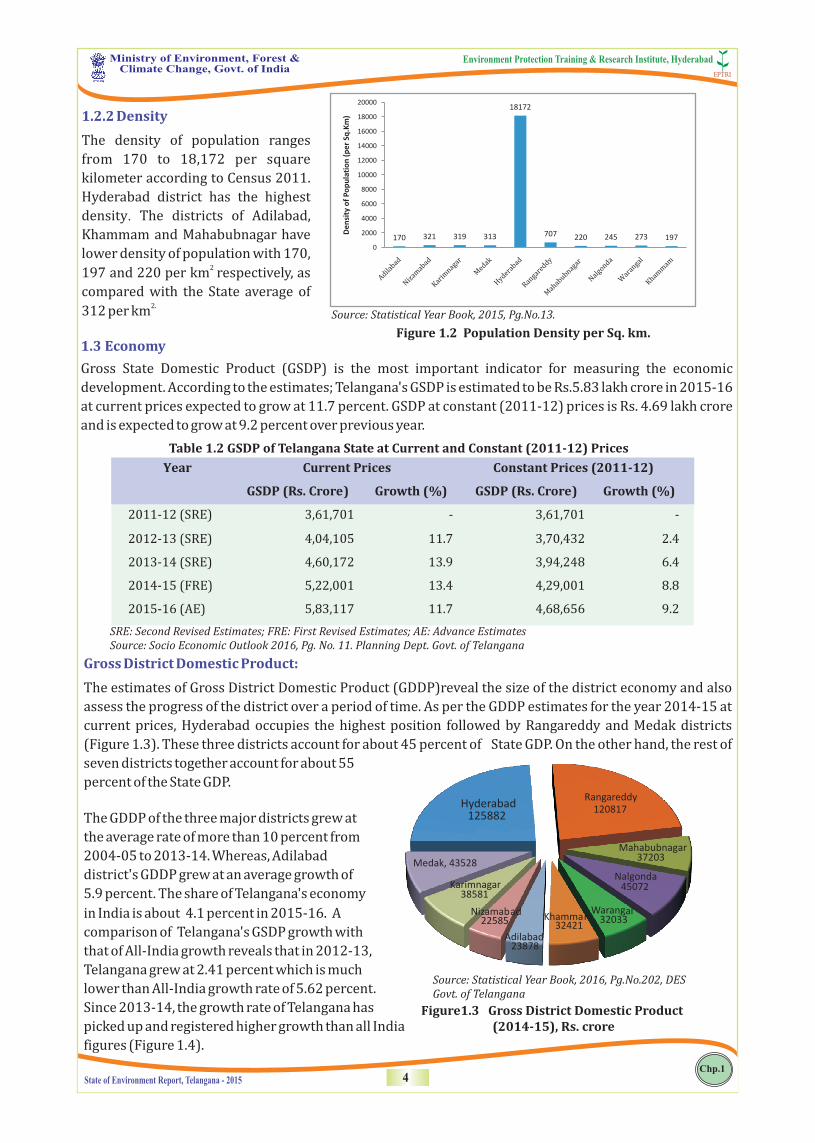
1.2.2 Density
The density of population ranges
from 170 to 18,172 per square
kilometer according to Census 2011.
Hyderabad district has the highest
density. The districts of Adilabad,
Khammam and Mahabubnagar have
lower density of population with 170, 2
197 and 220 per km respectively, as
compared with the State average of 2.312 per km
Figure 1.2 Population Density per Sq. km.
Source: Statistical Year Book, 2015, Pg.No.13.
1.3 Economy
Gross State Domestic Product (GSDP) is the most important indicator for measuring the economic
development. According to the estimates; Telangana's GSDP is estimated to be Rs.5.83 lakh crore in 2015-16
at current prices expected to grow at 11.7 percent. GSDP at constant (2011-12) prices is Rs. 4.69 lakh crore
and is expected to grow at 9.2 percent over previous year.
Table 1.2 GSDP of Telangana State at Current and Constant (2011-12) Prices
SRE: Second Revised Estimates; FRE: First Revised Estimates; AE: Advance EstimatesSource: Socio Economic Outlook 2016, Pg. No. 11. Planning Dept. Govt. of Telangana
Year Current Prices Constant Prices (2011-12)
GSDP (Rs. Crore) Growth (%) GSDP (Rs. Crore) Growth (%)
2011-12 (SRE) 3,61,701 - 3,61,701 -
2012-13 (SRE) 4,04,105 11.7 3,70,432 2.4
2013-14 (SRE) 4,60,172 13.9 3,94,248 6.4
2014-15 (FRE) 5,22,001 13.4 4,29,001 8.8
2015-16 (AE) 5,83,117 11.7 4,68,656 9.2
Figure1.3 Gross District Domestic Product (2014-15), Rs. crore
Source: Statistical Year Book, 2016, Pg.No.202, DES Govt. of Telangana
Gross District Domestic Product:
The estimates of Gross District Domestic Product (GDDP)reveal the size of the district economy and also
assess the progress of the district over a period of time. As per the GDDP estimates for the year 2014-15 at
current prices, Hyderabad occupies the highest position followed by Rangareddy and Medak districts
(Figure 1.3). These three districts account for about 45 percent of State GDP. On the other hand, the rest of
seven districts together account for about 55
percent of the State GDP.
The GDDP of the three major districts grew at
the average rate of more than 10 percent from
2004-05 to 2013-14. Whereas, Adilabad
district's GDDP grew at an average growth of
5.9 percent. The share of Telangana's economy
in India is about 4.1 percent in 2015-16. A
comparison of Telangana's GSDP growth with
that of All-India growth reveals that in 2012-13,
Telangana grew at 2.41 percent which is much
lower than All-India growth rate of 5.62 percent.
Since 2013-14, the growth rate of Telangana has
picked up and registered higher growth than all India
figures (Figure 1.4).

76921 78828 80121 81221 90184102919 114353 121639
180039
294220
129182
0
50000
100000
150000
200000
250000
300000
350000
PC
I, in
Rs.
Environment Protection Training & Research Institute, HyderabadMinistry of Environment, Forest & Climate Change, Govt. of India
5State of Environment Report, Telangana - 2015Chp.1
Source: Socio Economic Outlook 2016, Pg. No.11 Planning Dept. Govt. of Telangana
1.4 Per Capita Income
1.5 Employment Pattern
Per capita income (PCI) is the mean income
from all sources computed for every man,
woman and child in a geographical area. It
gives an idea about the level of development
in a state. The percapita income of the state
for the year 2014-15 is 1.29 lakh. District
wise analysis shows that Hyderabad district
has the highest PCI with Rs. 2.94 lakh
followed by Rangareddy and Medak
districts. Adilabad district has the lowest
PCI of Rs 76,921 followed by Nizamabad,
Mahabubnagar and Warangal.
The share of agriculture sector in total GSDP has been declining steeply as compared to a decline in
employment in agriculture sector. As
per the 2011-12 prices, agriculture and
allied activities share in total GVA was
12.9 percent, whereas about 55.6
percent of total workforce was
dependent on it, the share of the
services sector in total GVA was 60.5
p e rc e n t , b u t i t wa s p rov i d i n g
employment to only 26.6 percent of the
workforce. The Industry sector was
contributing about 26.7 percent to GVA
of the State while 17.8 percent of total
workforce was dependent on this sector
for employment.
Figure 1.4 Comparision of Growth rate of Telangana vis-a-vis All India(Constant Prices) Department
Figure 1.6 Industry wise Employment in Telangana in 2013-14
Source : Socio Economic Outlook 2016, Pg. No.15 Planning Dept. Govt. of Telangana
Figure 1.5 District-wise per capita Income in 2014-15
Source: Socio Economic Outlook 2016, Pg. No.14 Planning Dept. Govt. of Telangana
12.9
62.3
26.612.9
30.8
17.8
74.2
6.9
55.6
0
20
40
60
80
100
120
Rural Urban Total
% S
har
e
Agriculture & allied Industry Sector Services Sector

Environment Protection Training & Research Institute, HyderabadMinistry of Environment, Forest & Climate Change, Govt. of India
6State of Environment Report, Telangana - 2015Chp.1
1.6 Unemployment
1.7 Poverty and Human Development Index
The Unemployment Rate under the Usual Principal and Subsidiary Status (UPSS) among the age group 15
years and above is 2.7 percent. In rural areas, the unemployment rate is 1.1 percent, whereas in urban areas
it is 6.6 percent indicating that unemployment in urban areas is much higher than the rural areas.
The highest unemployment is in age groups of 15-29 years, unemployment rate is estimated to be 7.7% at
state level (3.8% in rural areas and 17.2 percent in the urban areas). "This indicates that youth
unemployment is one of the major concerns at the present juncture, especially in urban areas”.
In terms of nature of employment, 45.8% of the total workforce is reported to be self-employed, 35.4% as
casual labor and about 16.1 percent as wage/salaried earners while 2.7 percent are contract workers.
According to area-wise analysis the largest number of work force (48.8 percent) is self-employed in rural
areas where as majority of the workforce in urban areas are working as wage earners (salaries).
(Source: Socio - Economic Outlook 2016, Pg. No.16.)
Telangana has been successful in sharply reducing poverty levels from a steep 44.2 percent in 1993-94 to
8.8 percent in 2011-12. In fact, the poverty gap ratio has been declining over the years.
Human Development Index of different districts in Telangana State – conducted in 2004 and 2011 and
projected for the year 2015 is shown in Table 1.3. Hyderabad and Ranga Reddy retained their positions as
the first and second highest HDI districts in the State. Medak and Mahbubnagar remained as the bottom two
districts. There were changes in rankings at the middle level. Khammam, Adilabad and Nizamabad
improved their positions while the ranks of Warangal, Karimnagar and Nalgonda slipped down.
1.8 Seasonal Conditions
1.9 Agriculture
Telangana state is geographically located in a semi-arid area and has a predominantly hot and dry climate.
Summer starts in March, and peaks in May with average high temperatures of 42 °C (108 °F). The monsoon
starts in June and lasts until September with about 700 mm of precipitation. A dry, mild winter starts in late
November and lasts until early February with little humidity and average temperatures in the range of
22–23 °C (72–73 °F). The state is also prone to hailstorms in the month of April and May, occasionally.
The average or normal rainfall of the state is about 905.3 mm and about 80% of annual rainfall is received
from the south-west monsoons during June-September. The rainfall in the state is erratic and uncertain and
distribution of the rainfall is uneven in various mandals thus, making agriculture a proverbial gamble.
During 2014-15, production of total food grains was recorded as 72.18 lakh tones. Of the total food grains,
production of cereals and millets was 69.56 lakh tones, pulses 2.63 lakh tones. Production of oil seeds was
7.22 lakh tones, Chillies 2.53 lakh tones, Turmeric 2.16 lakh tones etc.
Table 1.3 Human Development Index (2004 - 05, 2011 - 12 and 2015 - 16)
Source : Socio Economic Outlook 2016, Pg. no. 90,92 ,Planning Dept, Govt. of Telangana.
Sl. Districts 2004-05 2011-12 2015-16 (projected)
Index Rank Index Rank Index Rank
1. Adilabad 0.289 6 0.508 6 0.700 4 2. Nizamabad 0.251 10 0.466 8 0.665 6 3. Karimnagar 0.350 4 0.521 4 0.654 7 4. Medak 0.261 9 0.446 10 0.606 10 5. Hyderabad 0.631 1 0.764 1 0.853 1 6. Rangareddy 0.364 2 0.605 2 0.808 2 7. Mahabubnagar 0.270 8 0.464 9 0.632 9 8. Nalgonda 0.320 5 0.500 7 0.646 8 9. Warangal 0.356 3 0.534 3 0.673 5
10. Khammam 0.286 7 0.519 5 0.728 3
Total 0.322 - 0.510 - 0.663 -

Environment Protection Training & Research Institute, HyderabadMinistry of Environment, Forest & Climate Change, Govt. of India
7State of Environment Report, Telangana - 2015Chp.1
7State of Environment Report, Telangana - 2015Chp.1
1.10 Horticulture
1.11 Livestock
1.12 Fisheries
1.13 Forestry
1.14 Seri Culture
1.15 Irrigation
1.16 Industries and Labour
Total area under Horticulture crops covers 10.86 lakh hectares with a total production of 112.56 lakh Mts.
Major fruit crops in the state are Mango, Citrus, Banana, Guava and Papaya while vegetables like Tomato,
Brinjal, Bhendi and various varieties of Gourds are predominant. Chillies, Turmeric and Coriander are
important spices. Coconut, Cashew and Oil palm constitute major plantation crops. In India, Telangana rd st
ranks 3 in fruits and 1 in Turmeric under cultivated area.
Telangana State is blessed with rich livestock resources especially cattle and sheep population accounting
for 5.52% of the country's population. The value of livestock produce is estimated to be Rs.34363 crores at
current prices and the livestock sector contributes 6.5% to the state GSDP (2015 -16 FR Estimates).
During 2015-16 - 2.37 Lakh tonnes of fish and prawn were produced in Telangana as against a target of 3.20
Lakh tonnes. The production of fish and prawn which was 1.36 lakh tonnes in 2009-10 has increased to 2.68
lakh tonnes in 2014-15 in Telangana.
2 th 2The Geographical area of Telangana State is 1,12,077 km (12 in India), of which 26,903.70 km is Recorded
Forest Area (RFA), which amounts to 24 % of state's geographical area and to 3.52% of India's Forest area.
The state is endowed with rich diversity of Flora and Fauna with over 2939 plant species, 365 bird species,
103 mammal species, 28 reptile species and 21 amphibian species in addition to a large number of
invertebrate species.
The state has an advantage of having a number of silk weaving pockets like Pochampally, Kothakota,
Narayanpet and Gadwal where silk yarn can be consumed and there is high potential and scope to introduce
further increase in production of mulberry silk and Tassar silk.
The department is implementing various schemes under different programs for Sericulture Development in
the State of Telangana, which are aimed to improve production of international Grade Bivoltine Silk , to meet
the gap between supply and demand of silk, transfer of technology to the farmers through Technical Service
Centers, preparation of High Yielding Varieties of Mulberry, economic conservation of water, promoting
private chawkie rearing units for supply of chawkie worms, promoting construction of a separate rearing
sheds and providing marketing facilities to farmers through cocoon markets.
The development of irrigation in Telangana is mostly dependent on Godavari and Krishna Rivers and their
tributaries, tanks and ponds. The Gross Area Irrigated in the State during 2014-15 was 25.29 lakh hectares
as compared to 31.54 lakh hectares in previous year, showing a negative growth of -20 percent. Similarly, net
area irrigated came down from 22.8 lakh hectares (2013-14) to17.26 lakh hectares (2014-15), showing a
negative growth of -24 percent during the same period. Source wise distribution reveals that wells are the
main source of irrigation in the State, irrigating about 82% of the total net irrigated area in 2014-15. The
share of canal and tank irrigation is confined to a mere 10 % and 4% respectively.
Manufacturing sector contributes about 55.0% in total industrial sector GVA in the State, as a result, growth
in manufacturing sector has a high impact on the industrial sector. Industrial sector in the State is likely to
register a growth rate of 8.4% in current prices and 8.3% at constant (2011-12) prices during 2015-16 (AE)
(Figure 1.7), during the same period manufacturing sector is likely to grow at 8.2% in current prices and
9.5% in constant prices. A trend analysis reveals that industrial sector growth has picked up over a period of
time, and is on a high growth trajectory.

Source : Socio Economic Outlook 2016, TS, Pg. No.54.
Figure 1.7 Growth rate of Industry and manufacturing Sectors during 2011-12 to 2015-16
1.17 Power
1.18 Roads
1.19 Transport
1.20 Airport
As per AP Reorganization Act 2014, APTRANSCO was divided into TSTRANSCO and APTRANSCO.
Accordingly, TSTRANSCO was established as a company with effect from 2-6-2014 for the State of
Telangana. TSTRANSCO is third largest power utility in the country with installed capacity of 4365.30 MW.
The State has 63 power generating projects out of which 14 projects are conventional and remaining are
non–conventional.
The State's power supply network which consists of 1683 Circuit Kilometer (CKM) of Extra High Tension
(EHT) lines, 167034 CKM of High Tension (HT) lines and 310507 CKM of low Tension (LT) lines and 1338
substations is one of the largest networks in the country supplying power to over 8 million consumers. The
power generation is around 67387 million units and the per capita consumption is approximately 746 kWh
annually.
Telangana comprises of 24,245 km of road length with 3,152 km of State Highways, 12,079 km of Major
District Roads, and 9,014 km of Other District Roads and 16 National Highways covering a length of 2,592
km, out of which 868 km are with National Highways Authority of India (NHAI). Of the total road length in
the state, 17076 km of roads are of single lane, 772 km are of intermediate lane, 7357 km are double lane and
the remaining are 4-lane and above.
State Transport includes Roadways, Railways and Airways. In Road transport, it is observed that the
Vehicular population in Telangana increased from 25.34 lakh in 2005 to 88.95 lakh in 2016 up to month of
June, an increase of 71.50%.
The Rajiv Gandhi International Airport (RGIA) is strategically located at Hyderabad, and is the only
operating airport in the state of Telangana with connections to domestic and international destinations. The
Capacity of the airport is over 40 Million Passengers Per Annum. The modular integrated Cargo facility is 2spread over 14,330 m , and has the capacity to handle 150000 MT per annum. The airport has a fuel farm
consisting of three storage tanks, with a total capacity for 13,500 kiloliters (480,000 cu ft.). The airport has
two prime access points, one is through National High NH-7 and another one is through Outer Ring Road and
Srisailam State High way. Warangal airport is a non-operational airport built over an area of 748.02 acres.
Environment Protection Training & Research Institute, HyderabadMinistry of Environment, Forest & Climate Change, Govt. of India
8State of Environment Report, Telangana - 2015Chp.1
1.21 Tourism
1.22 Information and Technology
Popular tourist destinations of Telangana attract tourists not just from within the state or country, but also
from around the world. The number of tourist arrivals in the State doubled in the last decade. About 3.26
crore tourists visited the State in 2005, and the same increased to 9.46 crore by the end of 2015, indicating a
surge in tourist arrivals.
With the formation of Telangana State a new journey has begun for building “Bangaru Telangana” and
Information Technology plays a crucial role in its vision. Information technology helps Telangana to be
identified on the global map, brings the government closer to the masses, helps attract new investments to
the state and creates new jobs and employment.
The Contribution to the overall GSDP from the IT/ITES sector base and create new jobs is high. Hyderabad is
a prominent hub for the Software industry, the state has introduced proactive and investor-friendly policies.
This has brought a new buoyancy and dynamism to the IT sector in the state. The initiatives like TASK, T-
HUB, Wi-Fi and Digital Telangana help create employment for rural youth in the state.
Major Initiatives
�Industry Friendly IT Policy with Single Window Clearance through TS-iPASS2
�Building Hyderabad ITIR Project in 202 km with IT investment potential of Rs. 2,19,440 Cr
�Electronic Manufacturing Clusters: eCity - 602. Acre estimated to cost Rs.580 Cr. It has a SEZ area of
263 acre and non-SEZ area of 339 acre. Maheshwaram EMC: 310 acre at an estimated cost of Rs.360 Cr.
�T-Hub: India's largest incubation facility (Built up area of 300,000 sq. ft). 60,000 sq. ft. will be
operational by June 2015. The objective of the Government is to develop a vibrant ecosystem for
providing the requisite support and unleash the entrepreneurial spirit amongst new age youth.
�TASK (Telangana Academy for Skill and Knowledge) academy is a unique and first-of-its kind
initiative in the country aiming to strengthen the quality of graduates coming out of colleges by
imparting industry-grade skill sets, both technical and non-technical.
�NDLM: First state in India to launch the National Digital literacy Mission program across the state.
1.23 Health & Family welfare
1.24 Housing
Life expectancy for males and females in the State are 63.92 and 66.16 as against 67.46 and 72.61 years for
the country. Birth Rate, Death Rate and Infant Mortality Rates for the year 2013 for the State are 17.4, 7.3 and
39 respectively as against 20.22, 7.4 and 40 deaths/1000 population for the country.
Telangana State Housing Corporation Limited (TSHCL) aims to bring dignity to each and every BPL family by
assisting them, both financially and technically, for construction of permanent (Pucca) houses.
Initiatives in Housing Program
?Cost of Rural Unit Permanent House (RPH) is enhanced to Rs. 45,000/- and Urban Permanent House
(UPH) to Rs. 55,000/- in May 2011.
?For SC/STs, additional loan of Rs. 20,000/- in Rural and Rs. 30,000/- in Urban areas, over and above the
unit cost is being given.
?Additional loan of Rs. 15,000/- for Weaver Worksheds is being provided.
?Unit Cost of Rs. 98,000/- (Rs. 53,000 + Rs. 45,000) for Project Displaced Families (R & R). For SC/STs,
additional Rs. 20,000/- is being given.(R&R). For SC/STs, additional Rs.20,000/- is being given.
?Supply of cement at low price to all housing beneficiaries.
(Source:http://www.it.telangana.gov.in/wp-content/uploads/2015/06/Telangana-IT-Dept-Annual-Report-Jun-20152.pdf.)
Environment Protection Training & Research Institute, HyderabadMinistry of Environment, Forest & Climate Change, Govt. of India
9State of Environment Report, Telangana - 2015Chp.1
�Electricity and Water Supply in layouts are being provided from the housing budget
�Total monitoring of progress through online system
(Source: http://www.telangana.gov.in/Departments/Housing.)
Telangana State has multiple institutes along with numerous primary and secondary schools. There are 43,861 schools functioning under various managements in 2014-15 in the state and imparting quality education to pupils.
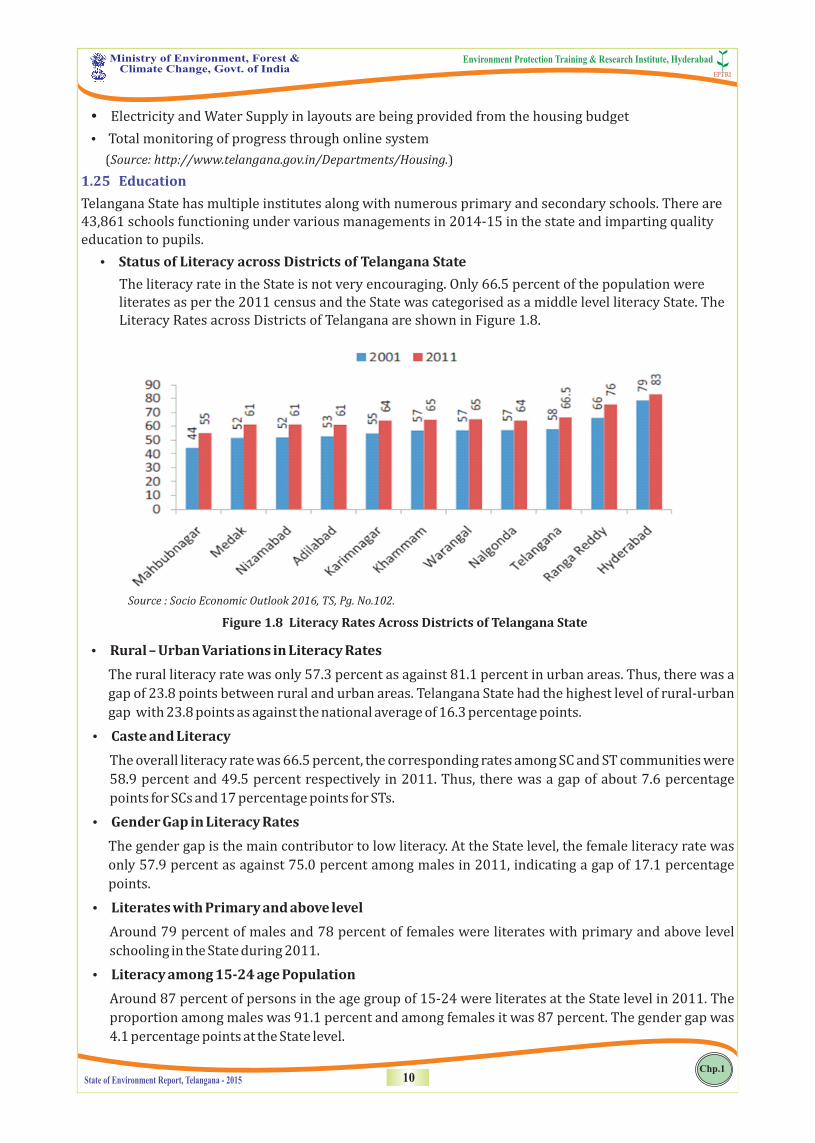
�Status of Literacy across Districts of Telangana State
The literacy rate in the State is not very encouraging. Only 66.5 percent of the population were literates as per the 2011 census and the State was categorised as a middle level literacy State. The Literacy Rates across Districts of Telangana are shown in Figure 1.8.
1.25 Education
Figure 1.8 Literacy Rates Across Districts of Telangana State
Source : Socio Economic Outlook 2016, TS, Pg. No.102.
?Rural – Urban Variations in Literacy Rates
The rural literacy rate was only 57.3 percent as against 81.1 percent in urban areas. Thus, there was a
gap of 23.8 points between rural and urban areas. Telangana State had the highest level of rural-urban
gap with 23.8 points as against the national average of 16.3 percentage points.
?Caste and Literacy
The overall literacy rate was 66.5 percent, the corresponding rates among SC and ST communities were
58.9 percent and 49.5 percent respectively in 2011. Thus, there was a gap of about 7.6 percentage
points for SCs and 17 percentage points for STs.
?Gender Gap in Literacy Rates
The gender gap is the main contributor to low literacy. At the State level, the female literacy rate was
only 57.9 percent as against 75.0 percent among males in 2011, indicating a gap of 17.1 percentage
points.
?Literates with Primary and above level
Around 79 percent of males and 78 percent of females were literates with primary and above level
schooling in the State during 2011.
?Literacy among 15-24 age Population
Around 87 percent of persons in the age group of 15-24 were literates at the State level in 2011. The
proportion among males was 91.1 percent and among females it was 87 percent. The gender gap was
4.1 percentage points at the State level.
Environment Protection Training & Research Institute, HyderabadMinistry of Environment, Forest & Climate Change, Govt. of India
10State of Environment Report, Telangana - 2015Chp.1
Environment Protection Training & Research Institute, HyderabadMinistry of Environment, Forest & Climate Change, Govt. of India
11State of Environment Report, Telangana - 2015Chp.1
�Primary Completion among children of 12 years old
The proportion of children of 12 years completing primary education was 67 percent according to
2011 Census. The percentage of boys was 68 and that of girls was 66 percent with reference to the
completion of primary education.
�Drop-out rates at the Primary level
The drop-out rate at the primary level in the State was 23.1 percent during 2011-12. The drop-out rate
among STs was 35.8 percent, higher than that of SCs and all social groups.
Telangana State has 459 Revenue Mandals and 8687 Gram Panchayats; the average density of population in
rural areas of Telangana is 194 persons per sq. km. The people of state are predominantly residing in rural
areas (61.12 percent) and the rest (38.88 percent) are residing in urban areas. As per the 2011 census, rural
population growth has been 2.13 percent, whereas urban population has grown by 38.12 percent, which
clearly indicates the prevalence of very high rural-to-urban migration.
The Gram Jyothi scheme launched by Telangana is aimed at strengthening the panchayat raj system and to
allow gram panchayats to formulate their own development plans. Some of the schemes by the Department
of Rural development include Self Help Groups and the Community Based Organization (CBOs) under the
MEPMA Society the Mission for Elimination of poverty in Municipal Areas. Swarna Jayanthi Gram Swarozgar
Yojana Scheme and Rural Self Employment Training Institutes.
Hyderabad, the Bulk Drug Capital of India, accounts for almost 20% of pharma exports from India, while rd
Telangana State contributes to 1/3 of the total pharma production in the country. As of 2014-15, Telangana
state had about 429 and 185 pharma companies and bulk drug units respectively. Total R&D by
pharmaceutical enterprises has grown by 20.6 percent in 2014-15. The major pharmaceuticals
manufacturing companies in Telangana state are Dr. Reddy's, Aurobindo pharma, Divis Laboratories and
Granules India Ltd.
Associations such as the Bulk Drug Manufacturers Association (India) have already estimated the need for
around 7,000 acres of plotted industrial land to meet the investment plans of its members. Therefore, in
order to provide an impetus to the pharma industry in Telangana and also to provide an industry-friendly
integrated environment for expansion of units of existing pharma companies as well as to attract new
investments in manufacturing and allied segments of pharma industry, Government of Telangana proposes
to develop a Pharma City near Hyderabad, which is a prestigious and priority project. The Hyderabad
Pharma City is proposed to be developed with integrated physical, environmental, social and technical
infrastructure in an area of over 19,333 acres of land in Rangareddy district of Telangana State.
Hyderabad Metro Rail after becoming operational will be catering to 15 lakh passengers by 2016-17. It
would cover a distance of 72 kilometers, with stations at every kilometer. The three corridors spanning a
length of approximately 72 km to be taken up in phase-I are as under.
Corridor I: Miyapur – LB Nagar : 29 kms; 27 stations.
Corridor II: JBS – Falaknuma : 15 kms; 16 stations.
Corridor III: Nagole – Shilparamam : 28 kms; 23 stations.
1.26 Rural Development
1.27 Pharmaceuticals
1.28 Metro Rail

Environment Protection Training & Research Institute, HyderabadMinistry of Environment, Forest & Climate Change, Govt. of India
12State of Environment Report, Telangana - 2015Chp.1
Bibliography
1. Annual Administration Report 2013- 2014, Forest Department, Government of Telangana
2. Department of Horticulture – Govt. of Telangana. An Action plan 2015-2016 by MIDH was
drafted component wise.
3. Dept. of Agriculture, Govt. of Telangana
4. Directorate of economics & statistics of Telangana
5. www.serp.telangana.gov.in/SHGTG/
6. www.telangana.gov.in/About/State-Profile
7. www.thehansindia.com/posts/index/Telangana/2016-03-04/Irrigation-Potential-In-
Bangaru-Telangana/211368
8. en.wikipedia.org/wiki/Economy_of_Telangana#Agriculture
9. Hyderabad Airport development Authority
10. Socio Economic Outlook 2016
11. Statistical year book 2016
12. Telangana.gov.in
13. Telangana-IT-Dept-Annual-Report-Jun-2015, 2.pdf
14. The Book – A walk inside Wilderness –Protected Areas of Telangana, Telangana Forest
Department. (P.K.Sharma, IFS, Chief Wildlife Warden & Spl. Prl. CCF (Dev) Telangana
15. www.ibef.org
16. www.thisismyindia.com/telangana/telangana-geography.html
17. www.indianscriptures.com/vedic-society/arts/arts-and-traditions-of-telangana.


