COVER SHEET C S 2 0 0 3 2 1 2 4 0 SEC REGISTRATION NUMBER C E B U L A N D M A S T E R S , I N C . (Company Name) 1 0 T H F L O O R , P A R K C E N T R A L E , B 2 L 3 , J O S E M A . D E L M A R S T . , C E B U I T P A R K , A P A S , C E B U C I T Y (Business Address: No. Street/City/Province) Clarissa Mae A. Cabalda 032-231-4870 Contact Person Company Telephone Number 1 2 3 1 17-A 0 5 3 0 Month Day Form Type Month Day Annual Meeting Secondary License Type, If Applicable Dept. Requiring this Doc Amended Articles Number/Section Total Amount of Borrowings Total No. of Stockholders Domestic Foreign To be accomplished by SEC Personnel concerned File Number LCU Document I.D. Cashier
Transcript
COVER SHEET
C S 2 0 0 3 2 1 2 4 0
SEC REGISTRATION NUMBER
C E B U L A N D M A S T E R S , I N C .
(Company Name)
1 0 T H F L O O R , P A R K C E N T R A L E ,
B 2 L 3 , J O S E M A . D E L M A R S T . ,
C E B U I T P A R K , A P A S , C E B U C I T Y
(Business Address: No. Street/City/Province)
Clarissa Mae A. Cabalda 032-231-4870
Contact Person Company Telephone Number
1 2 3 1 17-A 0 5 3 0
Month Day Form Type Month Day
Annual Meeting
Secondary License Type, If Applicable
Dept. Requiring this Doc Amended Articles
Number/Section
Total Amount of Borrowings
Total No. of Stockholders Domestic Foreign
To be accomplished by SEC Personnel concerned
File Number LCU
Document I.D. Cashier
2
SEC Number: CS200321240 File Number: ________
CEBU LANDMASTERS, INC. ___________________________________
December 31, 2020 ___________________________________
(Fiscal Year Ended)
SEC Form 17-A Annual Report ___________________________________
(Form Type)
- ___________________________________
(Amendments)
3
SECURITIES AND EXCHANGE COMMISSION
SEC FORM 17-A
ANNUAL REPORT PURSUANT TO SECTION 17
OF THE SECURITIES REGULATION CODE AND SECTION 141
OF THE CORPORATION CODE OF THE PHILIPPINES
1. For the fiscal year ended December 31, 2020
2. SEC Identification Number CS200321240
3. BIR Tax Identification No. 227-599-320
4. Exact name of issuer as specified in its charter CEBU LANDMASTERS, INC
5. Province, Country or other jurisdiction of incorporation or organization CEBU CITY,
CEBU, PHILIPPINES
6. Industry Classification Code (SEC Use Only)
7. Address of principal office
10th FLOOR, PARK CENTRALE, B2 L3, JOSE MA. DEL MAR ST., CEBU IT
PARK, APAS, CEBU CITY Postal Code 6000
8. Issuer's telephone number, including area code (032) 231-4914
9. Former name, former address, and former fiscal year, if changed since last report
not applicable
10. Securities registered pursuant to Sections 8 and 12 of the SRC, or Sec. 4 and 8 of
the RSA
Title of each class Number of shares issued and
outstanding
COMMON SHARES 1,554,999,600
11. Are any or all of these securities listed on a Stock Exchange.
Yes [ X] No [ ]
If yes, state the name of such stock exchange and the classes of securities listed therein:
Stock Exchange: Philippine Stock Exchange Securities listed: Common shares
12. Check whether the issuer:
(a) has filed all reports required to be filed by Section 17 of the SRC and SRC Rule
17.1 thereunder or Section 11 of the RSA and RSA Rule 11(a)-1 thereunder, and
Sections 26 and 141 of The Corporation Code of the Philippines during the preceding
twelve (12) months (or for such shorter period that the registrant was required to file
such reports);
Yes [X] No [ ]
(b) has been subject to such filing requirements for the past ninety (90) days.
Yes [X] No [ ]
13. Aggregate market value of the voting stock held by non-affiliates: ₱1,867,856,614 as
of December 31, 2020
4
TABLE OF CONTENTS
PART I – BUSINESS AND GENERAL INFORMATION
Item 1 Business 5
Item 2 Properties 31
Item 3 Legal Proceedings 32
Item 4 Submission of Matters to a Vote of Security Holders 32
PART II – OPERATIONAL AND FINANCIAL INFORMATION
Item 5 Market for Registrant’s Common Equity and Related Stockholder Matters 33
Item 6 Management’s Discussion and Analysis or Plan of Operation 35
Item 7 Financial Statements 40
Item 8 Changes in and Disagreements with Accountants and Financial Disclosure 41
PART III – CONTROL AND COMPENSATION INFORMATION
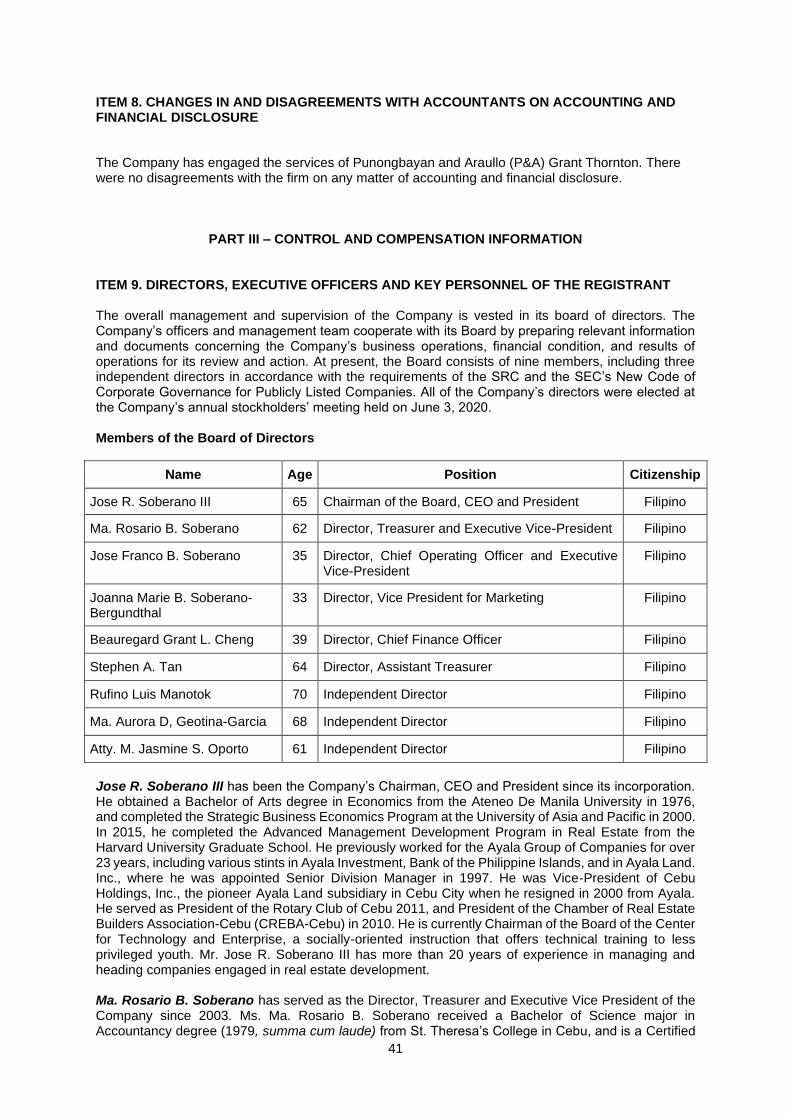
Item 9 Directors, Executive Officers and Key Personnel of the Registrant 41
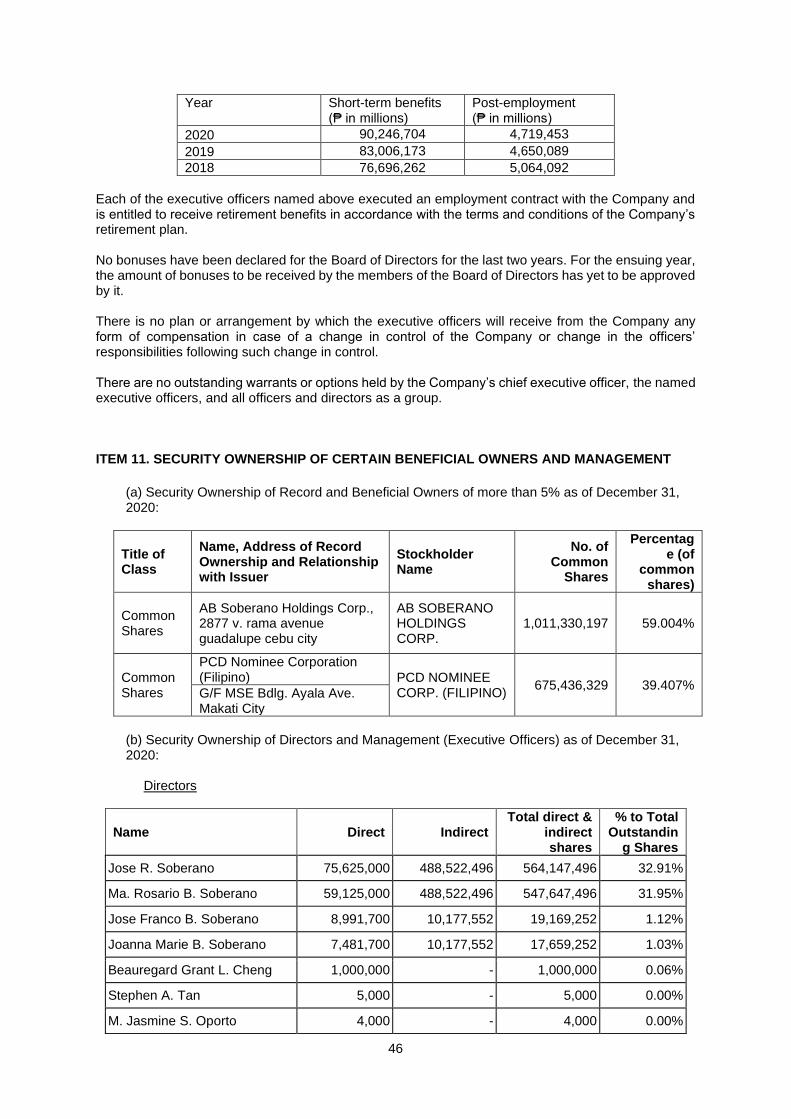
Item 10 Executive Compensation 45
Item 11 Security Ownership of Certain Beneficial Owners and Management 46
Item 12 Certain Relationships and Related Transactions 47
PART IV – CORPORATE GOVERNANCE
Item 13 Corporate Governance 47
PART V – EXHIBITS AND SCHEDULES
Item 14 Exhibit: Audited Financial Statements 52
Item 15 Reports on SEC Form 17-C 52
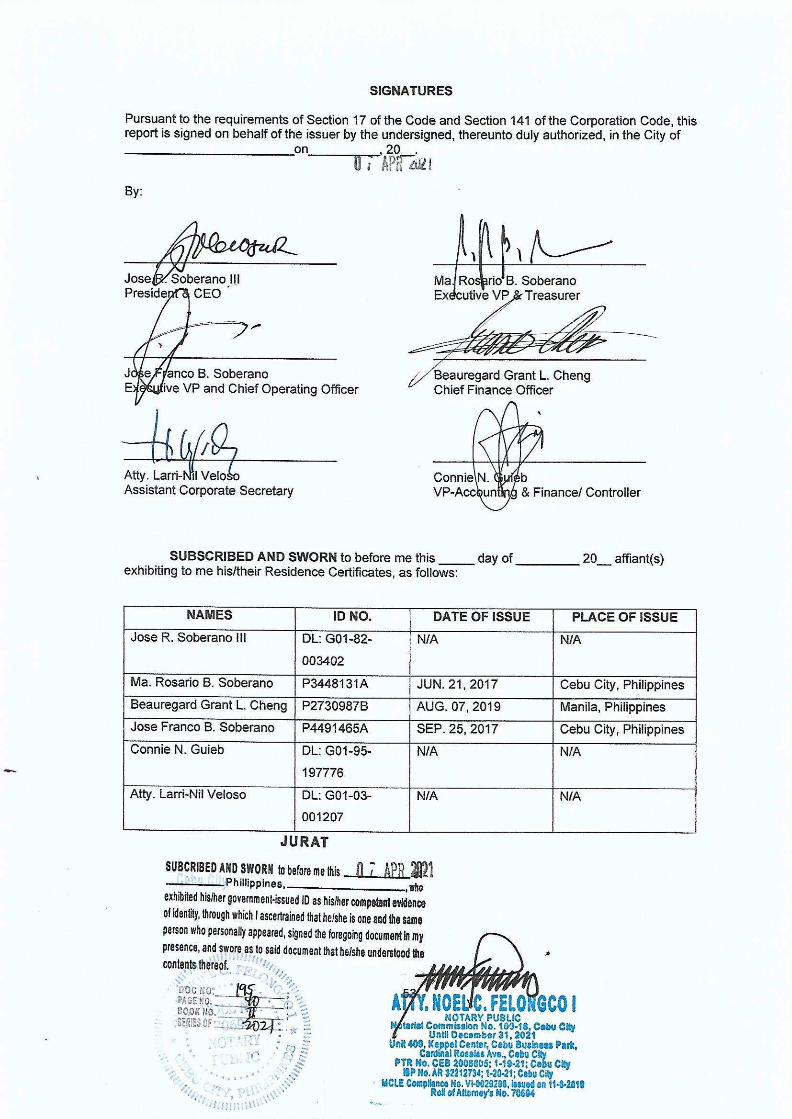
SIGNATURES 53
5
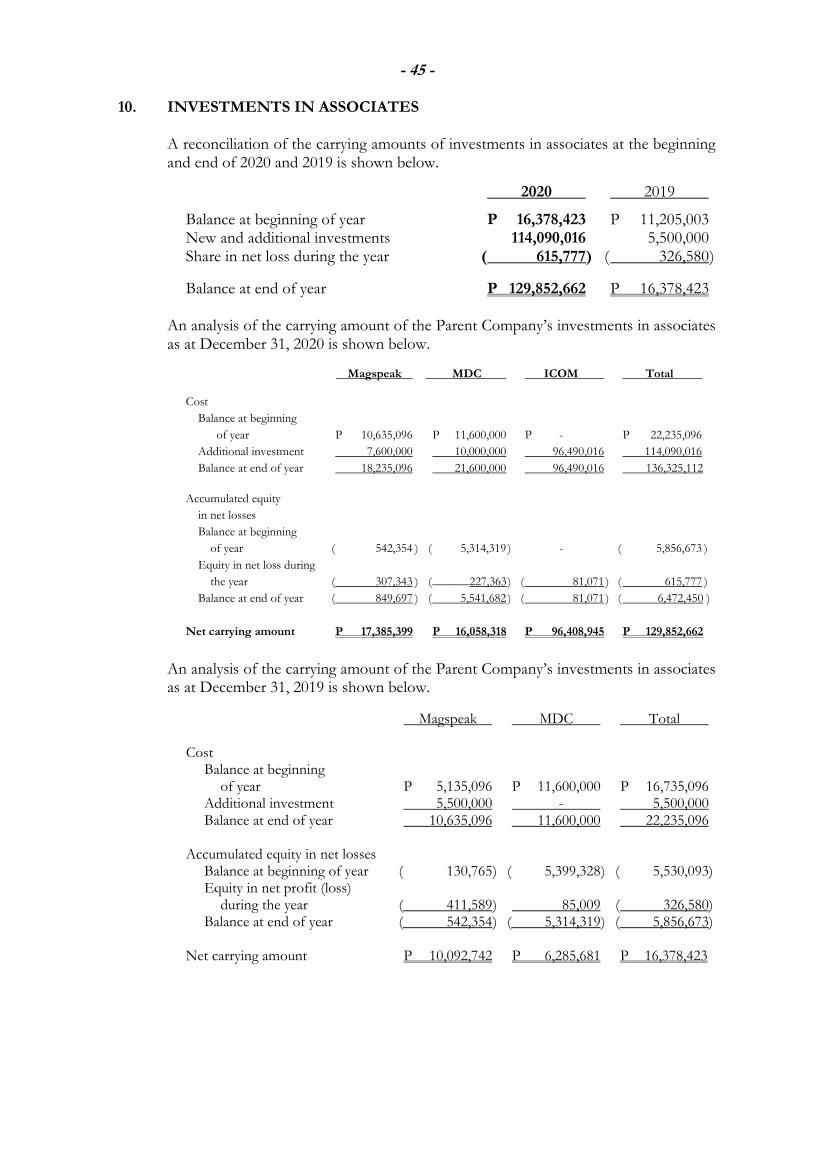
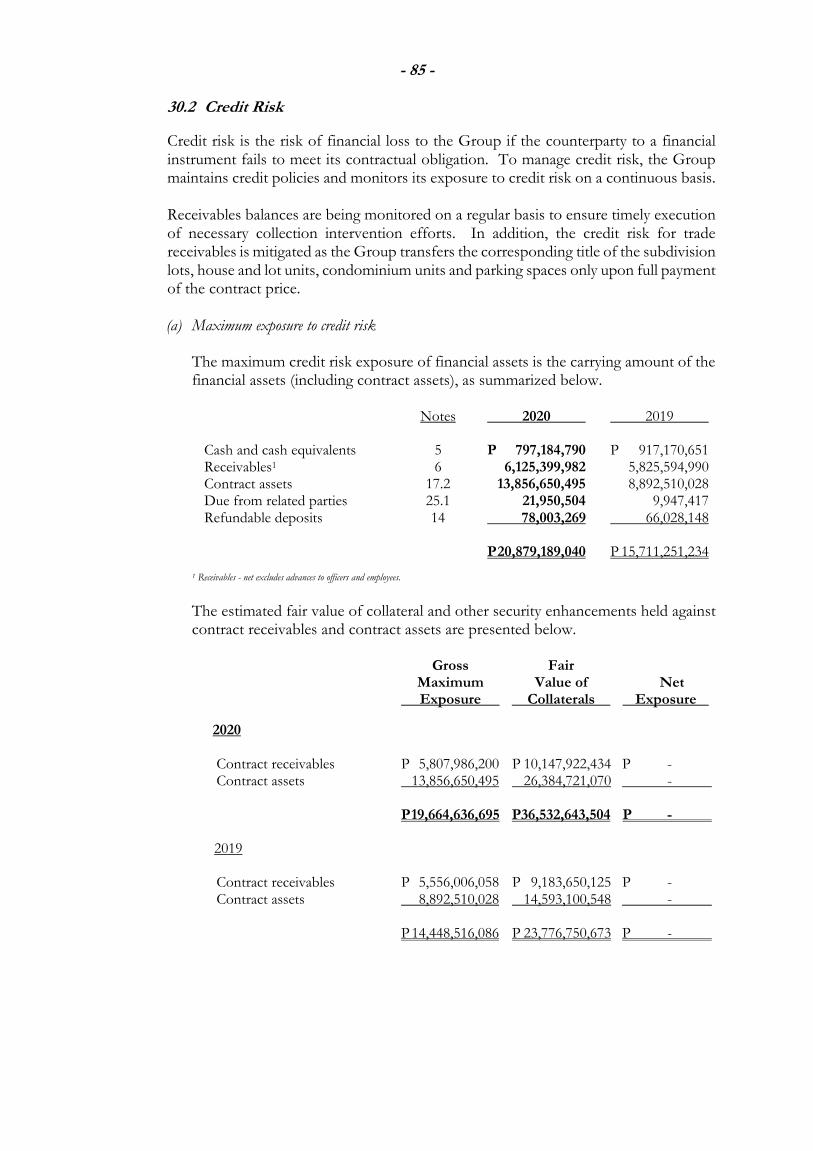
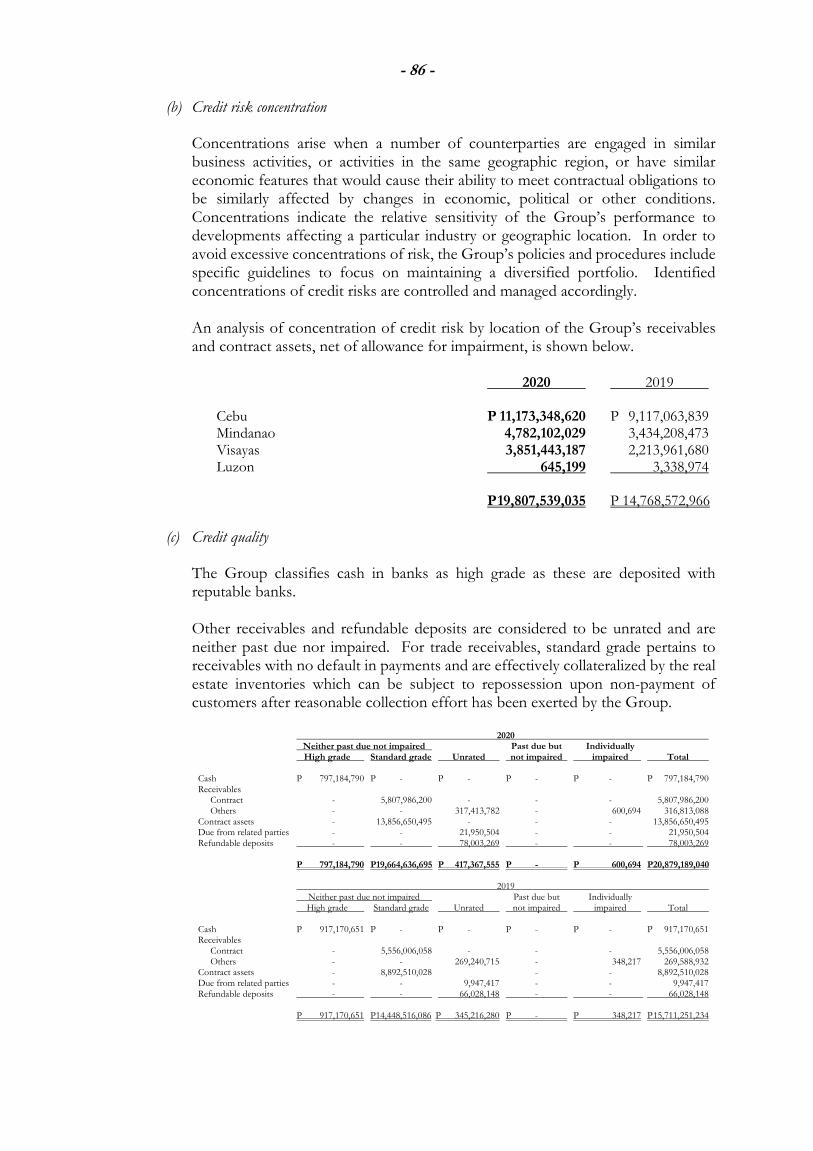
PART I – BUSINESS AND GENERAL INFORMATION ITEM 1. BUSINESS Background Cebu Landmasters, Inc. (“CLI” or “Cebu Landmasters” or “the Company”) was incorporated on September 26, 2003. On June 2, 2017, the Company was listed on the Philippine Stock Exchange (PSE) with “CLI” as its ticker symbol. A total of 430,000,000 shares were issued and fully subscribed at P5.00 per share. After 17 years of operations, the Company has diversified its portfolio to better match the myriad demands of the Visayas and Mindanao (VisMin) property sector. As of date, CLI has a total of 77 projects in different stages of development, which include 23 residential subdivisions, 29 residential condominiums, 6 hotels, 7 retail locations, 5 offices, 5 mixed-use and 1 estate development. CLI opened its first hotel development in September 2019—Citadines Cebu City. The 180-room condotel, is operated and managed by Ascott International Management Pte Ltd., one of the leading international lodging owner-operators. This is the first of several hotel developments being built by CLI that will be managed by Ascott and other world-renowned hotel operators. A recent market study by Santos Knight Frank named CLI as the leading residential developer in the Visayas and Mindanao (VisMin) in 2020 with the largest market share from among real estate firms providing condominium and subdivision projects in the region. The study disclosed that CLI accounted for 18,683 units or 12% of the available 86,126 units in VisMin pulling ahead of developers operating nationwide. CLI continues to expand its land bank to support its expansion plans. As of December 31, 2020, the Company has a total of 908,959 square meter (sq.m.) of developable land in 15 growth centers in VisMin. The Company has several strategic land acquisitions lined up in greater Cebu, Bacolod and Davao, with new expansion areas such as Ormoc, Palawan, Butuan and General Santos City also on the horizon. CLI Visayas – Mindanao Presence Since its incorporation, CLI has grown its portfolio to include residential subdivision and condominium, mixed-use, offices, hotels, retail locations and recently, estate and reclamation developments. The Company designs its projects to meet the needs of different market segments. Its brands are carefully planned and priced to provide excellent value for the particular segment it serves. The Premier Masters include projects such as Base Line Premier, 38 Park Avenue, Astra Center and Paragon Center that are designed for world-class living in prime urban locations. The Garden Series brand, like Mivela Garden and Velmiro Greens Bohol cater to the middle market. The Casa Mira brand, on the other hand, is for the affordable economic housing segment while the Villa Casita brand is for the socialized housing market. The Company’s projects are discussed in detail in the succeeding sections. In 2018, CLI started to venture into larger scale developments with the launch of Davao Global Township (“DGT”), a 22-hectare (ha) estate located in Matina, Davao. Site development is ongoing and the first project on the site is scheduled for launch in 2021. Aside from DGT, the Company has ongoing negotiations with landowners in Cebu, Davao, Bohol, Bacolod , and Cagayan de Oro (CDO) for future estate and reclamation projects. The Company endeavors to sustain its growth momentum by launching 15 new residential projects in 2021 across VisMin.
6
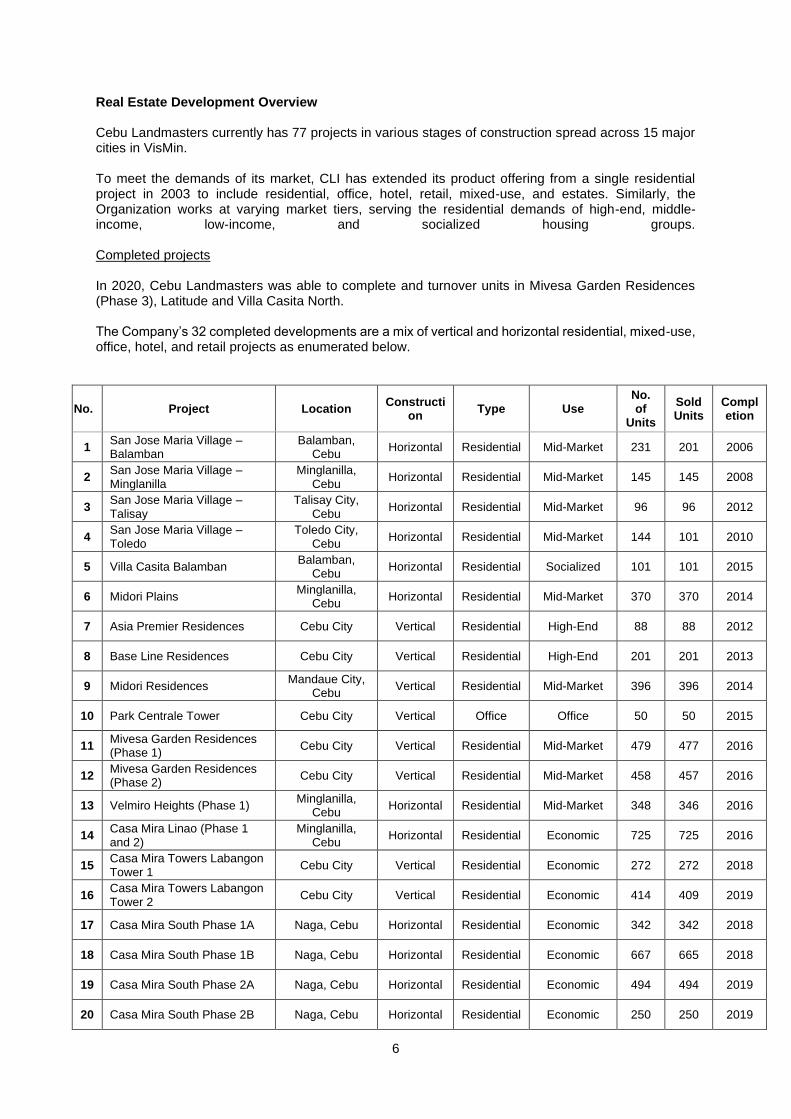
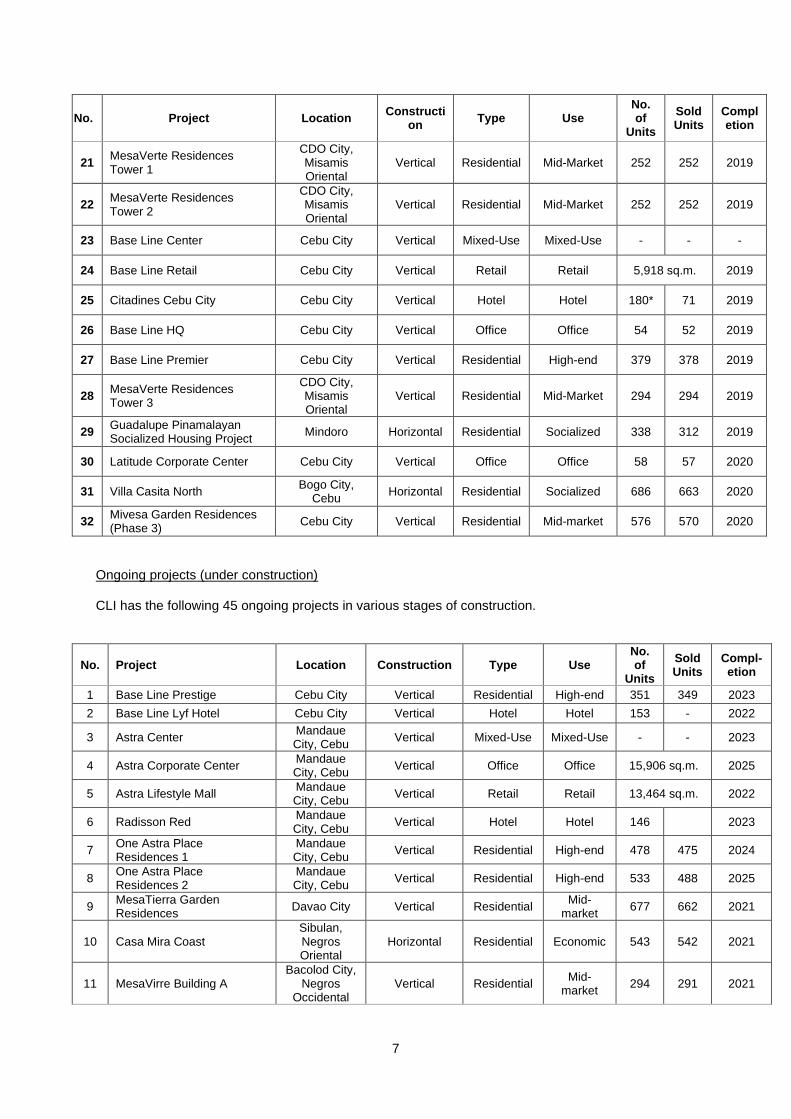
Real Estate Development Overview Cebu Landmasters currently has 77 projects in various stages of construction spread across 15 major cities in VisMin. To meet the demands of its market, CLI has extended its product offering from a single residential project in 2003 to include residential, office, hotel, retail, mixed-use, and estates. Similarly, the Organization works at varying market tiers, serving the residential demands of high-end, middle-income, low-income, and socialized housing groups. Completed projects In 2020, Cebu Landmasters was able to complete and turnover units in Mivesa Garden Residences (Phase 3), Latitude and Villa Casita North. The Company’s 32 completed developments are a mix of vertical and horizontal residential, mixed-use, office, hotel, and retail projects as enumerated below.
43 Casa Mira Towers LPU Davao City Vertical Residential Economic 930 674 2024
9
No. Project Location Construction Type Use No. of
Units
Sold Units
Compl- etion
44 Casa Mira Linao (Phase 3) Minglanilla,
Cebu Horizontal Residential Economic 128 120 2024
45 Casa Mira South (Phase 3A) Naga, Cebu Horizontal Residential Economic 165 165 2022
Notes: *Citadines Cebu City has total of 180 condotel units with 74 units in inventory for sale. **Mixed-use – individual components already describe its respective number of units, hotel keys and gross leasable area ***Not applicable as the project relates to pure hotel operations Residential developments The Company's brands are classified into four categories: Premier Masters, which are high-end residential developments with prices beginning at more than ₱3.0 million per unit; Garden Series, which are mid-market housing projects with prices starting at ₱2.0 million per unit; Casa Mira Series, which are affordable housing units with prices ranging from ₱480,000 to ₱3.0 million; and Villa Casita, which are socialized housing units with prices not exceeding ₱480,000. The list below categorizes the projects according to market segments: a. Horizontal (Subdivision) Projects:
Socialized: Villa Casita Bogo and Villa Casita Balamban in Cebu; Guadalupe Pinamalayan
Socialized Housing Project Economic: Casa Mira Linao and Casa Mira South in Cebu; Casa Mira Coast and Casa Mira
Homes Dumaguete in Negros Oriental; Casa Mira Bacolod in Negros Occidental; and Casa Mira Iloilo in Panay
Mid-Market: San Jose Maria Villages, Midori Plains and Velmiro Heights in Cebu; Velmiro
Uptown CDO in Misamis Oriental; and Velmiro Plains Bacolod in Negros Occidental; Velmiro Greens Bohol;
b. Vertical (Condominium) Projects:
Economic: Casa Mira Towers Labangon, Casa Mira Towers Guadalupe and Casa Mira Towers Mandaue in Cebu; Casa Mira Towers CDO in Misamis Oriental; and Casa Mira Towers LPU in Davao
Mid-Market: Midori Residences, Mivesa Garden Residences and Mivela Garden Residences in
Cebu; MesaVerte Garden Residences CDO; MesaTierra Garden Residences in Davao; and MesaVirre Garden Residences in Bacolod
High-End: Asia Premier Residences, Base Line Residences, Base Line Premier, Base Line
Prestige, 38 Park Avenue, and One Astra Place in Cebu; and One Paragon Place in Davao
Horizontal (Subdivision) Projects Villa Casita Balamban Launched in 2014, CLI’s first socialized housing development is located at Buanoy, Balamban, Cebu. With a land area of 8,128 sq.m., it consists of 101 row house units having a lot area of 36 sq.m. and a floor area of 22.65 sq.m. Pre-sold units were priced at about ₱400,000. It is fully developed, completed and sold out.
10
Villa Casita North The second project of the Company’s Villa Casita brand offers its homeowners well-designed homes, well-planned site development, and sizable green spaces for parks and community facilities traditionally found only in mid-market or upscale developments. The development is designed to provide over 686 homes to families in the North of Cebu with a selling price of ₱480,000 per unit. Guadalupe Pinamalayan Socialized Housing Project This socialized housing project in Pinamalayan, Oriental Mindoro, was started in 2015 in collaboration with Habitat for Humanity. The 3.9-hectare initiative includes 337 single-story and detached units, with 77 of them going to Habitat for Humanity recipients. Casa Mira Linao Launched in 2015, Casa Mira Linao is CLI’s first foray into economic housing development. The project is located in the hills of Linao-Lipata, Minglanilla, Cebu on a 12-ha property. Phase 1 and 2 comprises 725 townhouse units with floor areas ranging from 37 to 62 sq.m and average selling price starting from ₱900,000 to ₱1.40 million. It is fully developed, completed and sold out. In 2020, CLI launched Casa Mira Linao Phase 3 composing 120 single-detached townhouse units with 59 sq.m. in floor areas at an average selling price of ₱3.50 million. Casa Mira South Launched in 2016, this economic housing development is located in the Naga City and the Municipality of San Fernando, both in Cebu. This 32-ha community built on a rolling terrain that allows for expansive views and generous open spaces and amenities is divided into four phases consisting of 3,338 townhouse units, with each unit having floor areas ranging from 36 to 59 sq.m. Average pre-selling price ranges from ₱1.10 million to ₱1.60 million. Phase 1 and 2 are completed and turnover to unit owners is almost complete. In 2018, it was awarded as the Best Housing Development in Cebu at the Philippine Property Awards. In 2020, CLI launched Casa Mira South Phase 3A and Phase 3B with 618 units at an average pre-selling price of ₱1.20 million to ₱2.60 million. The expansion projects are both fully sold during the year while Phase 4 are still being marketed. Casa Mira Coast Casa Mira Coast, a residential economic subdivision located in Barangay Maslong, Sibulan, Negros Oriental, is a 5.3-ha project that consists of 543 townhouses selling at ₱1.60 million to ₱2.20 million. It offers amenities that are not only top of the line but also affordable. Apart from this, the project has a breathtaking view of the nearby coast and is only 2.0 km away from the Dumaguete Airport. The development is scheduled for completion and turn-over in 2021. Casa Mira Dumaguete Launched in 2020, the second Casa Mira project in Negros Oriental is located in a 7-ha land in Junob, Dumaguete City. Its modern architecture and design were inspired by the classic American Country Home. This development is split into two phases with a total of 586 house and lot units. Phase 1 was already launched during the year with selling prices ranging from ₱2.20 million to ₱3.70 million per house and lot while Phase 2 is currently in the planning stage. Average floor range is 60 to 135 sq.m. Casa Mira Bacolod Casa Mira Bacolod is the 7th Casa Mira project of CLI with 431 house and lot units. With its accessible location, homeowners enjoy more the conveniences brought by business establishments, malls, schools, churches and major institutions. The development offers generous open spaces and well-
11
planned amenities at an affordable price ranging from ₱1.70 million to ₱2.2 million. The well-designed houses range from 40 to 46 sq.m. in floor area. Casa Mira Homes Iloilo This 14-ha community features a contemporary mix of townhouses and single detached units inspired by the cultural evidence of the Spanish colonial era that has been part of our Philippine history. It’s design and architecture mimic that of the Bahay na Bato that is one of the most iconic historical places in Iloilo. In 2020, CLI launched its first project in Iloilo City, Panay comprising 1,188 house and lots with a typical floor area of 48 sq.m. and average pre-selling price of ₱1.80 million to ₱2.7 million. San Jose Maria Villages (“SJMV”) This series of villages located in the south and southwest of Cebu City paved the way for CLI in providing affordable mid-cost quality homes to the middle market segment. SJMV offered a mix of single-detached, semi-attached townhouses and lot-only choices to the buyers. SJMV-Balamban is a 3.0-ha development with 231 units launched in 2013 SJMV-Minglanilla is a 2.9-ha development with 145 units launched in 2007. SJMV-Toledo is a 3.0-ha development with 144 units launched in 2009. SJMV-Talisay is a 1.9-ha development with 96 units launched in 2010. Lots were pre-sold at ₱7,000 per sq.m., while house and lot units averaged at ₱1.40 million to ₱3.60 million. All SJMV projects are fully developed and completed, with both SJMV-Minglanilla and SJMV-Talisay sold out. Midori Plains Launched in 2011, this mid-market development is located in the Municipality of Minglanilla, Cebu. This 7.0-ha Asian-inspired subdivision south of Cebu City has 370 residential units ranging from townhouse units with 40-sq.m. floor areas to single-detached units with an area of 77 sq.m. each. It is fully developed, completed and sold-out. Velmiro Heights Cebu This mid-market development was launched in 2013 and is located on an 8.80-ha property in Tunghaan, Minglanilla, Cebu. This 428-unit development offers 11 different house models, ranging from townhouses to single-detached, two-storey units. Townhouses have 60-sq.m. floor areas, while the largest unit contained 131 sq.m. of living space. Townhouses were pre-sold at an average price of ₱1.70 million while the largest single-detached unit is about ₱5.30 million. Phase 1 is now fully developed, completed, and sold, while Phase 2's 81 units are still on the market. Velmiro Uptown CDO Launched in 2017, Velmiro Uptown is located in Upper Canituan, CDO City, providing easy access to various establishments in the city. This 14-ha mid-market residential subdivision has a total 396 house and lot units nestled at a prime spot in CDO City. The project offers a mix of units from townhouses to single detached houses with floor areas 60 to 106 sq.m., respectively. The average selling price ranges from ₱2.40 million to ₱5.0 million. The project is set to be completed by 2022. Velmiro Plains Bacolod Bringing new heights to the City of Smiles in 2019 is Velmiro Plains Bacolod. This 8.3-ha development is a modern mid-market residential community comprising 342 house and lot units with floor area ranging from 60 sq.m. to 106 sq.m. Located strategically at Granada, Bacolod City, the average selling price ranges from ₱2.60 million to ₱4.20 million per house and lot. Velmiro Greens Bohol CLI’s first development in this 3.6 ha property in Dauis Panglao, Bohol is accessible to schools, places of worship, tourist spots, malls, beach resorts and other major establishments. The project offers a mix of units from townhouses to single detached houses with average floor area ranging from 48 sq.m. to 67 sq.m. Average prices range from ₱2.30 million to ₱3.6 million per house and lot.
12
Vertical (Condominium) Projects Casa Mira Towers Labangon Launched in 2016, this is CLI’s primary venture in the economic segment of residential condominiums. The project is located in Labangon, Cebu City on a 3,681-sq.m. property that used to be the location of the old CLI headquarters. This two-tower development on top of a commercial podium has a total of 686 residential units. It offers 20-sq.m. studio units and 1-bedroom units averaging 37 sq.m. units pre-sold at ₱1.25 million to ₱1.43 million. Construction for the development started in 2016 and completed in 2018. Casa Mira Towers Guadalupe Located across the Fooda intersection of V. Ramos St., and V. Rama, is beautifully designed three-towered residential condominium offers quality living and an upgraded lifestyle. This three-tower residential condominium has a total of 1,231 condominium units and retail components. A studio room currently costs around ₱2.60 million from its pre-selling price at ₱1.58 million. Tower 1, with 544 condo units, is fully sold and is expected to be completed by 2021. Tower 2, with 234 units, was launched in 2020 while Tower 3 is expected to be launched in 2021. Casa Mira Towers Mandaue Launched in 2019, Casa Mira Towers Mandaue, a four-tower mid-rise condominium located in Marciano Quizon, St, Mandaue City, Cebu, is the 8th development of CLI’s Casa Mira flagship housing community. The project offers a mix of studio and one-bedroom units with prices ranging from ₱75,000 to ₱80,000 per sq.m. Phase 1 and phase 2 development are allocated with 659 units while 736 units, respectively. The project is expected to be delivered and turned over by 2023. Casa Mira Towers CDO Located within the progressive city of Cagayan de Oro, Casa Mira towers CDO is a two-tower residential condominium with 986 units offering an upgraded lifestyle for the Filipino family. Launched in 2019, the development also has its own retail spaces on the ground floor area providing utmost convenience to its residents. With more space and more amenities, Casa Mira Towers CDO prides in giving its residents more value for their homes. The project had sold out in 2020, despite the nationwide community quarantines and the global pandemic. Casa Mira Towers LPU Located within minutes from Davao’s Francisco Bangoy International Airport, Casa Mira Towers LPU is composed of two residential towers and retail at the podium with 930 condominium units. The project will have a retail component at the ground floor for retail and food outlets to cater students from Lyceum of the Philippines - Davao. This two-tower project is to support LPU Davao as a globally competitive university township – a one-stop development with not just a standalone university, but including supplementing components such as residential, hospitality, retail, and meetings, incentives, conventions, and exhibitions needs; and to position Davao as one of the country’s up-and-coming bustling and vibrant destinations. Midori Residences This zen-inspired twin-vertical mid-market residential condominium development is located in Mandaue City, Cebu. Its 22-sq.m. studio and 40-sq.m. 1-bedroom units were pre-sold at an average of ₱1.30 million to ₱2.60 million. It is fully developed, complete and fully sold out a total of 396 units. Mivesa Garden Residences Located in Lahug, Cebu City and launched in 2013, this 1.8 hadevelopment is a home to seven mid-rise, mid-market residential buildings, and is designed as a garden-inspired community which has 60% open spaces within the prime property. This is a three-phase project with the first two phases covering the first five buildings. The first two phases offer 937 units consisting of studio, 1-bedroom and 2-bedroom units. Pre-selling started at ₱1.20 million for a 20-sq.m. studio unit, and up to ₱2.90
13
million for a 2-bedroom 48-sq.m. unit. Phase 1 and 2 are completed and delivered. Phase 3 with a total of 576 units is completed and started turn-over in 2020. MesaVerte Residences Launched in 2015, this is CLI’s initial entry into the Mindanao market. It is located on an 8,740-sq.m. property in downtown CDO, Misamis Oriental, and 60% of the property is dedicated to open spaces. The project offers 20-sq.m. studio and 39-sq.m. 1-bedroom units which were pre-sold at ₱1.47 million and ₱2.88 million, respectively. The development is fully sold and is completed with turn-over to unit owners on-going. MesaTierra Garden Residences Located in Emilio Jacinto Extension, the heart of Davao City, this 5,094 sq m. mid-market condominium has a total of 677 residential units priced between ₱1.60 million to ₱3.40 million. This development has various amenities like swimming pools, a sky garden, a playground and work space. This condo project is expected to be turned over by 2021. MesaVirre Garden Residences Launched in the first quarter of 2018, MesaVirre Garden Residences, a three-tower mid-market condominium with 1,072 condo units, is CLI’s first project in Bacolod. The project is only 17 minutes away from the airport, 3 km from the Riverside hospital and situated near a number of malls. Building construction is expected to be finished by the end of 2021. Mivela Garden Residences Mivela Garden Residences is a ₱5.3 billion project, located in Banilad, Cebu City, with four-towers and 1,585 condo units. The Best-Selling Garden Series development has generated overwhelming buyer interest as it is 80% sold out after 3 weeks of selling. The project is close to major establishments providing urban comforts within near distance while maintaining its serene and refreshing ambiance. Construction immediately started and will be completed by the first half of 2023. Asia Premier Residences Launched in 2010, CLI’s first vertical high-end residential condominium project is located at the Cebu IT Park, Cebu City. The development is also the first residential development in the area. The units ranged from studio units sized at 28 sq.m. and 3-bedroom units measuring 109 sq.m. It is fully developed and completed and has since sold out its 88 units. Base Line Residences This 201-unit residential condominium project is located in uptown Cebu City on Juan Osmeña Street. The project offered 23-sq.m. studio units at a pre-selling price of ₱1.59 million, while its 41-sq.m. 1-bedroom unit pre-sold at ₱3.15 million. The project was launched in 2011, and is fully developed and completed, with its 201 units having been sold out. Base Line Premier This development was launched in 2015 as the residential component of Base Line Center, a one-hectare mixed-use development located along Juan Osmeña Street, Cebu City and right beside another CLI project, Base Line Residences. It has 379 units consisting of 24-sq.m. studio and 45-sq.m. 1-bedroom units. Studio units pre-sold at ₱2.22 million, while 1-bedroom units pre-sold at ₱4.16 million. Construction started in March 2016 and was completed in 2018. 38 Park Avenue 38 Park Avenue was launched last 2017 with a total of 764 units. This 38-floor New York inspired condominium is designed to be the highest building in Cebu I.T. Park offering an exclusive and breath-taking 360 view of the city. 38 Park Avenue presents five (5) types of condo residences: studio (24
14
sq.m.), one-bedroom (54 to 56 sq.m.), two-bedroom (80 sq.m.), three-Bedroom (111 to 137 sq.m.) and penthouse (320 to 420 sq.m.). The project is expected to be completed by end of 2022. Base Line Prestige Located in Juana Osmena St., Kapmuthaw Cebut City, this high-end residential condominium is the final tower to rise in the Base Line Center. With 351 units, each unit is designed to be spacious and accessible to various establishments. This tower has a wide range of amenities, from retail podiums, fitness gyms, pools and playgrounds. Units for this project are being sold for ₱2.0 million to ₱10.0 million. The project is set to be completed by 2023. One Astra Place Residences Situated in the heart of A.S. Fortuna Street, the lifestyle avenue of Mandaue City, One Astra Place is the residential component of Astra Centre, a mixed-use development that carries astounding design of residential towers, upscale lifestyle mall, world-class hotel and modern office spaces. One Astra place is a 15-storey condominium at 99% take-ups that comes with a wide range of world-class amenities and features. The second residential tower was launched in 2019 with 92% take-up as of December 31, 2020. The project is scheduled to be completed by 2024.
Office Projects CLI capitalized on the growth of the BPO sector in Cebu when it launched its first office project, Park Centrale in IT Park Cebu way back in 2013. Today, part of CLI’s strategy is to significantly grow its recurring income projects to deliver 200,000 sq.m. of gross leasable area (GLA) in the next five years. In 2020, the Company turned over Latitude Corporate Center, a Grade A office tower at the Cebu Business Park with a Gross Floor Area (GFA) of 21,000 sq.m. Building development for Astra Corporate Center (18,823 sq.m. GFA) and Patria de Cebu Office (4,562 sq.m. GFA) are currently ongoing.
Office Buildings: Park Centrale Tower, Base Line HQ, Latitude Corporate Center, Astra Corporate
Center, Patria de Cebu Office and Masters Tower Cebu Office
Park Centrale Tower Park Centrale Tower is CLI’s first office development. Located at the Cebu IT Park, the 19-storey Grade B office tower was launched in 2013 with total GFA of 11,920 sq.m. and was completed in only two years of construction. The project was positioned to cater to both BPOs and executive offices. 60% of the office spaces were offered for lease, while the rest were fully sold as office condo units. In 2014, the project was awarded as the Best Commercial Development (Cebu) during the 2014 Philippines Property Awards. Base Line HQ This project is the office component of the Base Line Center, a major mixed-used development of CLI. Similar to the Company’s successful Park Centrale, the said project also caters to both BPOs and executive offices. CLI offers for sale 70% of the 74 office units, while 40% was retained for the Company’s growing leasing business. The strategic location attracted customers in the medical, legal, government and outsourcing services. Latitude Corporate Center Latitude is a green building project registered with BERDE, the nationally accepted green building rating system used to measure, verify and monitor the environmental performance of buildings that exceed existing mandatory regulations and standards in the Philippines. This 21,000-sq.m. (in GFA) development is a project of BL CBP Ventures, Inc., a joint venture company of CLI and Borromeo Bros, Inc. At 24-storeys, Latitude will be the tallest office development at the Cebu Business Park. As the project developer and manager, CLI uniquely positioned this project as a three-product office development with BPO, enterprise and executive office offerings. With its iconic design and green building features, the project is aiming for a 3-star BERDE certification. The BERDE project was completed in 2020 with ongoing turn-over.
15
Astra Corporate Center Part of the mixed-use project in AS Fortuna, is Astra Corporate Center, the office leasing component of Astra Centre. The Office building is 15-storey high with a total of 18,823 sq.m. of GFA. The project is expected to be completed and be a source of leasing income of the Company by 2025. Patria de Cebu Office In 2018, Cebu Landmasters announced its partnership through a 40-year lease with the Archdiocese of Cebu to develop and operate a mixed-use project in the 6,670 sq.m. property. The project will be a redevelopment of the existing Patria de Cebu, an old Spanish establishment to accommodate hotel, retail and offices. It will have approximately 21,000 sq.m. of GFA, with 4,562 sq.m. (GFA) of office spaces. The project is expected to be completed and fully operational by year 2025. Masters Tower Cebu Office On February 19, 2021, the Company unveiled its ₱4-billion skyscraper that is set to open in 2025. This mixed-use tower located on a 2,840 sq.m. area in the Cebu Business Park will have an iconic office component in anticipation of a robust economic recovery in the next few years. The tower’s office spaces from the 8th to the 12th floor anticipate the needs of locators who value efficiency and sustainability and keenly follow global trends. The spaces will highlight horizontal louvers to reduce solar heat by almost 70% and to create a comfortable work environment. In addition to the louvers that reflect Cebuano craftsmanship, sky gardens in every floor and throughout the LEED-registered building will enhance the well-being of its occupants.
Hotel and recreational development In addition to its residential and office developments, CLI has recently entered the hospitality business starting with the completion of its’ first hotel, Citadines Cebu City in September 2019.
Hotel: Citadines Cebu City, Radisson Red, Base Line Lyf Hotel, Citadines Paragon
Davao, Citadines Bacolod, Patria de Cebu Hotel, Abaca Resort Mactan Cebu, and Sofitel Cebu City
Citadines Cebu City Started operations in September 2019, the project is an international serviced residence with 180 rooms of which 74 units were offered for sale and 106 units were retained by the Company for recurring revenue. Citadines Cebu City is part of the mixed-use Base Line Center located in Juana Osmeña St, Cebu City, Cebu. It complies with international hospitality standards as it operates under the management of The Ascott Limited, the world’s largest international serviced residence owner-operator. Radisson Red Cebu Landmasters expands partnership with international hotel brands by signing a management contract with Radisson Hotel Group, one of the world’s largest and most dynamic hotel groups, for the first Radisson RED in the Philippines. Radisson RED will be part of the Astra Centre, a major mixed-use development of the Cebu Landmasters, Inc. along A.S. Fortuna St. in Mandaue City, Cebu. The 146 guest rooms of Radisson RED, with its unique design and upscale select service offering, injects life into the hotel through informal services. The development is scheduled for completion and operations by 2023. Base Line Lyf Hotel Portion of the 3rd tower in Base Line Center project is Base Line Lyf Hotel. This 153-room serviced residence project targets the booming local and foreign millennial market in Cebu City. The hotel will be managed by Ascott Limited, one of the world’s leading international serviced residences. This project is set to be completed by 2022.
16
Citadines Paragon Davao Located at General Douglas Mcarthur Highway, Bucana Tolomo, Davao City, Citadines Riverside is an apartment hotel which will be managed by Ascott. The hotel is designed to provide guests its world class amenities, such as a fully-equipped kitchen, home entertainment, dining and retail outlets. Citadines Paragon is set to open by 2024. Citadines Bacolod Citadines Bacolod will be the first internationally branded hotel of Bacolod managed by Ascott Limited. The international hotel will provide 200 hotel units, an events hall, function rooms, meeting rooms, restaurants, bar and various hotel amenities within a 4,502 sqm property. The project is scheduled to open and start contributing to hotel revenue by 2022.
Patria de Cebu Hotel In 2018, Cebu Landmasters announced its partnership through a 40-year lease with the Archdiocese of Cebu to develop and operate a mixed-use project in the 6,670 sq.m. property. The project will be a redevelopment of the existing Patria de Cebu to accommodate hotel, retail and offices. This Filipino-Spanish inspired hotel development will cater to 167 guest rooms and is expected to be completed and fully operational by year 2025 Abaca Resort Mactan Cebu The all-suite Abaca Resort Mactan is a luxury resort in the Punta Engano area of Mactan island that has received the highest ratings from global travel experts. With a footprint of 4,328 sqm., the property is one of the few remaining prime properties in the area with an attractive oceanfront and just a short drive from the Mactan Cebu International Airport. CLI envisions the Abaca Resort Mactan to expand to a 100-room all-suite luxury development from its current nine rooms, to be completed in 2025. In 2020, Abaca Boutique Resort in Cebu has been nominated as Asia’s Leading Boutique Beach Resort 2020 and Asia’s Leading Boutique Resort 2020 in the 27th World Travel Awards.
Sofitel Cebu City The first five-star luxury hotel in the Queen City of the South will rise on a 2,840 sqm property considered to be the remaining prime corner lot in the Cebu Business Park, Cebu City’s prestigious central business district. Sofitel Cebu City will be operated by multinational chain Accor, a world leading hospitality group headquartered in France. The sustainability of this LEED-registered building will be reflected in the design of the 14th to the 32nd floors which will house the luxury hotel with 195 guest rooms, a grand ballroom, 2 restaurants, executive lounge, meeting rooms, roof deck, swimming pool, gym and spa.
Mixed-use developments and Townships With its growing brand, experience and portfolio, CLI pursued larger scale developments in prime urban locations.
Mixed-Use and Township: Base Line Center, Astra Center, 38 Park Avenue, Paragon Center, Patria de Cebu, Davao Global Township and Masters Tower Cebu
Base Line Center CLI’s first major mixed-use development is the Base Line Center, a 1.6-ha modern redevelopment in the heart of midtown Cebu. The Company removed the existing structures in the old Base Line, a well-known favorite gathering place of Cebuano families, and built a mixed-use development. The project was completed in 2019.
17
38 Park Avenue CLI, through its joint venture, El Camino, also acquired a 1.18-hectare property inside the Cebu IT Park, the largest remaining private property inside the prestigious address. This property called 38 Park Avenue at the Cebu IT Park, will be transformed into a mixed-use urban park with a 38-storey residential tower, BPO office, hotel and retail boulevard. Astra Center In 2017, CLI launched another major mixed-used development, the Astra Center, in the bustling AS Fortuna Mandaue area, a growing commercial district and the major thoroughfare that connects Cebu and Mandaue. This medium-density project will house a hotel, residential, office and boutique mall. Paragon Center Another mixed-use development by CLI is the Paragon Center, a joint venture project in Davao that was launched in 2018. The development comprises of the premier condominium, One Paragon Place, Citadines Davao Hotel, a convention center and a lifestyle retail strip. Patria de Cebu In 2018, Cebu Landmasters announced its partnership through a 40-year lease with the Archdiocese of Cebu to develop and operate a mixed-use project in the 6,670 sq.m. property. The project will be a redevelopment of the existing Patria de Cebu, an old Spanish establishment to accommodate hotel, retail and offices. It will have approximately 21,000 sq.m. of GFA and is expected to be completed and fully operational by year 2025. Davao Global Township CLI also entered into another joint venture to develop a central business district in Matina, Davao. The 22-hectare estate, called Davao Global Township will be developed into a large-scale self-contained community with office, residential, mall and institutional uses. Masters Tower Cebu Set to be completed in 2025, will offer prime office and retail spaces and the first five-star luxury hotel in the Queen City of the South. Sofitel Cebu City will be operated by multinational chain Accor, a world leading hospitality group headquartered in France. The tower is Cebu Landmasters' most iconic architectural structure to date, building a towering crown-like structure to represent the “Queen City of the South”. The architectural masterpiece will top-off at 192 meters above sea level and will be among the top three tallest structures in the metropolis. It will have a structural height of 172 meters high, with an architectural design inspired by the best of Cebuano creativity and craftsmanship, and with sustainability as one of its cornerstones having been conceptualized to use energy and resources efficiently and responsibly. Groundbreaking of the LEED-registered Masters Tower Cebu is slated for the second quarter of 2021. CLI is aiming for the building’s LEED Gold certification. Ming-mori Reclamation Project CLI is currently working on Ming-mori Reclamation Project in its pipeline projects. This master planned reclamation development covering 100 ha was issued an ECC by the Department of Environment and Natural Resources (DENR) on July 22, 2020 following a comprehensive two-year review. This project is a joint venture among the local government of Minglanilla and private consortium partners Ming-Mori Development Corp. The techno business hub will be a township project to house light industrial facilities with residential, commercial areas and an integrated port facility and to generate over 75,000 jobs in the municipality while meeting sound environmental guidelines.
18
Competitive strengths
Leading property developer in VisMin with a distinguished brand and reliable track record of project execution CLI is the leading VisMin property developer with its unique regional expertise, sound “acquire-to-develop” strategy, a strong relationship with the local broker community, a trusted brand by its buyers and end-users, and a preferred partner of landowners as demonstrated by its successful JV partnerships. CLI has a 12 percent market share in the Visayas and Mindanao in terms of overall supply of residential units for both vertical and horizontal developments, according to a survey undertaken by Santos Knight Frank (SKF) in 2020. As a result, CLI is now the leading residential developer in VisMin region. CLI has responded well to the increasing market demands of VisMin, outpacing other developers in finishing construction and delivering completed units to its customers. On the average, CLI can convert raw land to a turned-over project in less than two to three years, depending on the project size. CLI’s condominium developments Base Line Residences, Park Centrale Tower, Mivesa Garden Residences, Midori Residences, and Casa Mira Labangon were delivered to the buyers in two years, as committed by the Company in its marketing materials. The Company adopted a rigorous project management team approach, wherein key personnel from each business unit are given a regular platform to monitor project milestones, and discuss important synergies and shared deliverables among business units.
Strategic location selection to provide value-for-money proposition to customers The criteria for choosing a location at CLI are very rigid. The Company is still on the lookout for properties of high value appreciation potential. CLI's site quality has always been a catalyst for its excellent sales success, whether for a high-end condominium project or an affordable housing project. CLI has projects in some of Cebu City's most valuable real estate areas, including Cebu IT Park, Cebu Business Park, Salinas Drive (Lahug), AS Fortuna (Mandaue), Base Line (midtown Cebu), and Mactan. The Company looks at locations within a two-kilometer radius of the closest highway for its mid-market and affordable housing developments. The Company has enhanced the facilities in the neighborhoods where its housing developments are located. This has always proved to be a win-win environment for the residents as well as the local neighborhood. CLI's experience with the city and its communities, as a native developer, allows the company to choose the best locations for its projects and to cater to the market's needs and tastes. San Jose Maria Village - Balamban, CLI's first project, was established when CLI's founder, Mr. Jose R. Soberano III, recognized that there was a ready demand for affordable housing among employees of Balamban's manufacturing companies. Because of CLI’s proven track record, landowners who wish to sell or develop their properties find it easier to approach and work together with the Company. This is evidenced by the number of proposals from landowners regularly received by CLI to buy or develop their properties.
19
CLI gives its clients more value for their investment. Its properties are distinguished by the quality of its locations, award-winning planning and design, generous amenities, timely and quality construction, and industry-best customer service, after-sales and property management support at very competitive prices. The Company has a strong pipeline in various affordability levels, and will strive to continuously improve its products’ value proposition. As a success criterion and as practiced, CLI has always projected its initial pre-selling prices to appreciate by at least 20-25% by the time the construction is completed. As an indication of the positive market response, a number of its projects have set selling records in the markets they are launched. 98% of the inventory from its completed projects have been sold out. CLI’s MesaVirre Garden Residences in Bacolod, and Mivela Garden Residences in Cebu for example, were respectively 100% and 80% sold out in three weeks. Highly diversified and expanding project portfolio and socio-economic markets From its first project in Balamban Cebu, CLI is now a fully integrated real estate developer with a highly and diversified expanding portfolio of residences, offices, retail spaces, hotels, mixed use developments and a township across VisMin. 2020 growth in revenue was mainly driven by its Garden Series (mid-market segment), followed by the Casa Mira Series (economic segment), representing 36% and 32% of this year’s revenue. Because of the Company’s diverse portfolio of projects addressing the needs of customers from all socioeconomic classes, the Company should be less affected by negative economic trends that impact a certain segment of the market. The Company is also able to harness the full potential of the market with its capability and passion to supply the market demands. Experienced management team and organizational culture The Company aims to grow its workforce in line with high standards of professionalism, as it has over the last 17 years. The Company has grown from two employees to a dynamic team of 574 executives, managers, officers and staffs, who have contributed to the Company’s culture of excellence and strong corporate governance values. CLI’s customer-first attitude and family-oriented team enables the Company to achieve high stakeholder satisfaction and establish strong brand equity. CLI is led by a family of real estate professionals. Its founder, Chairman of the Board of Directors, President and CEO Jose R. Soberano III, was a former executive at Ayala Land, where he played an integral role in the development of Cebu Business Park and Cebu IT Park, the two most valuable commercial districts in Cebu City up to this day. CLI has grown its talent pool with the addition of knowledgeable accounting and finance, business development, engineering, legal, marketing, and sales professionals with extensive experience and success in their respective professional careers. CLI’s key executives have had prior experience in reputable companies from related industries such as real estate development, construction, power, banking, business process outsourcing, consulting and others. In 2016, CLI has launched a new marketing push for its brand with the tagline “We Build With You in Mind”. This captures the customer-centric focus the Company has adopted since its incorporation in 2003 and shows how CLI personnel perform in every phase of the development cycle from project planning to turnover. The customer service department extends post-turnover services by assisting the tenants and unit owners in title processing and payment of their unit’s real property taxes. CLI’s 2017 campaign, “With You Every Step of the Way” encapsulates the solid partnership between CLI and the buyer in every stage leading to the creation of Cebu Landmasters Property Management, Inc. (“CLPM”), the property management arm of Cebu Landmasters. CLPM offers integrated property management services including building administration, subdivision maintenance, and special technical services. In 2018, CLI announced its new marketing campaign dubbed “live extraordinarily” a promise that the Company gives to its stakeholders. This campaign aims to embrace the Company’s hands-on service, value-added amenities, VisMin expertise and the wide-range of developments that we offer to our customers. As the leading local developer in VisMin, the Company have grown through the trust and satisfaction of our clients.
20
Socially responsible development CLI is committed to demonstrate responsible planning and development. Wherever the Company develops, community and infrastructure improvements within the neighborhood are integral parts of the development plans. CLI has partnerships with various barangays, local government units and institutions, including Habitat for Humanity (“Habitat”). For partnerships with barangays, a fine example is the community improvements done in Barangay Lahug, Cebu City as part of its Mivesa Garden Residences project. As its gesture of goodwill for the barangay and its constituents, the Company upgraded various barangay infrastructures including the widening of the Salvador Ext. barangay road, installation of new drainage lines, and the construction of a three-storey public market in 2013. The previous market was located along the sidewalk, so the developer provided a more stable, hygienic and secure facility. This was well received by the local community and serves as a testament that private development can also generate good social works. Cebu Landmasters also developed a tricycle terminal for Barangay Quijada Guadalupe, right beside Casa Mira Towers Guadalupe. The terminal was built to alleviate traffic in the area caused by the loading and unloading of tricycle passengers. The new establishment provides safety and security to both passengers and operators of Guadalupe. Additionally, CLI collaborated with Habitat for the Pinamalayan Socialized Housing Project and Bastikville 4 Socialized Housing Project in Quezon City, where CLI served as the developer of over 338 socialized units and 94 walk-up apartments, respectively. Aside from this, the Company generously contributed to the Habitat Bohol Rebuild Program in 2015, which aimed to rebuild over 8,000 homes affected by the October 2013 earthquake. For its partnership with Ramon Aboitiz Foundation,Inc (RAFI), CLI’s current tree growing program includes over 202,436 native seedlings planted over 43 hectares. CLI collaborates with RAFI as part of its responsible compliance to Environmental Compliance Certificate (ECC) requirements for its growing number of projects. CLI is also an advocate of green building standards with some of its projects incorporating important green building and environmentally friendly features. Its Latitude Corporate Center office project is marked to be the first registered project in Cebu Business Park under BERDE, the Philippines’ green building rating system that aims to promote sustainable design and operations. In 2020, when the Covid-19 pandemic hit the country, CLI was in the forefront to nurture partnerships despite the health crisis. CLI was proactive in supporting the healthcare community. The Company turned over medical supplies and relief packs to 18 local government units and 30 barangays around VisMin where CLI is present. And through Its partners from The Abaca Group and Citadines Cebu City, CLI provided food packs to frontliners and health care providers in Cebu. In cooperation with the Cebu City Government, CLI likewise donated two-unit fully air conditioned collapsible vans situated at the Cebu City Quarantine Center in the North Reclamation Area. These served as temporary sleeping quarters for doctors, nurses, and medical personnel during the pandemic. The Company highly value the services of its frontliners and third-party contractors, especially during the global crisis. To help them and their families, CLI provided weekly financial assistance to those who worked during the pandemic. A total of ₱12.5 million cash aid was extended to the Company’s construction workers, security personnel, housekeeping and maintenance employees, and other suppliers.
21
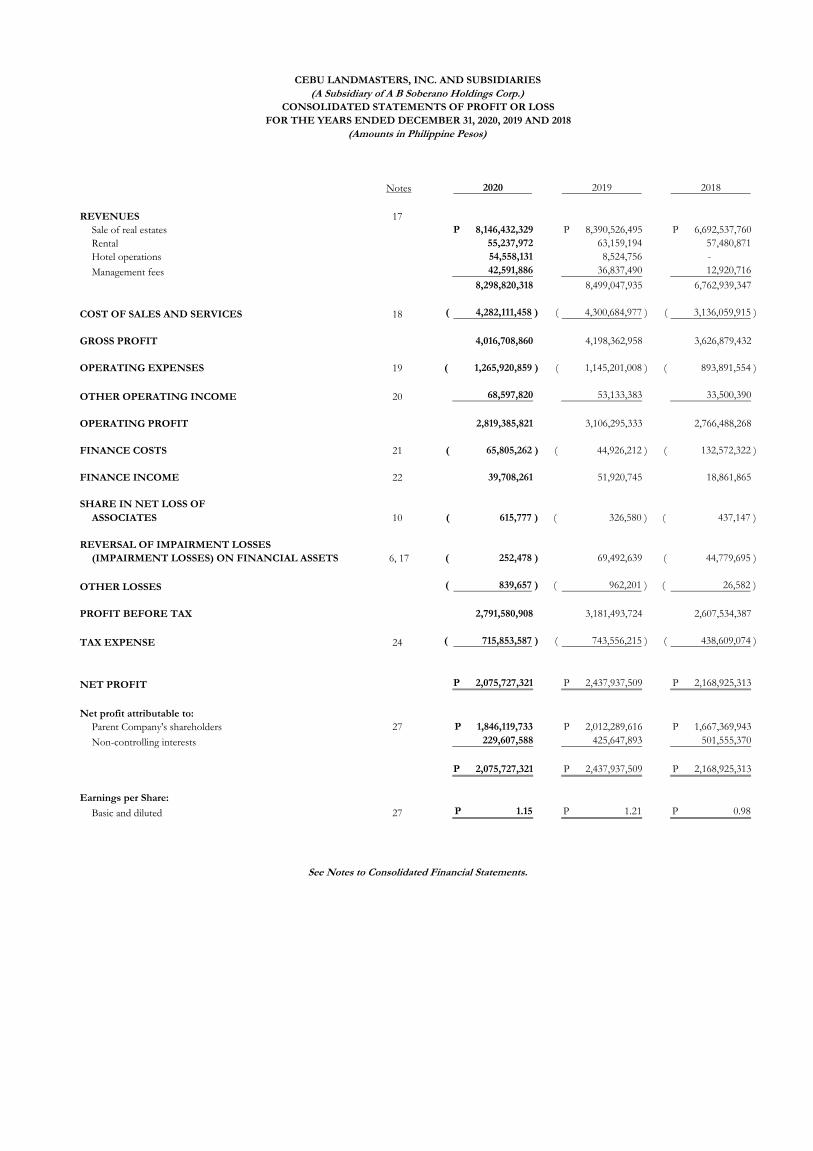
Strategic joint venture partnerships CLI takes pride in its ability to collaborate with and deliver great value to its joint venture (JV) partners. CLI is the project manager and developer in all its joint ventures. These joint ventures enable the Company to position itself in strategic locations such as Cebu Business Park through BL CBP Ventures, Inc., and Cebu IT Park through El Camino Developers Cebu, Inc. CLI’s JV partnerships are typically of a closer and more collaborative nature than the norm, where it treats its JV partners as true and equal business partners. Its collaboration results in better-suited products in the markets they are launched in, while benefiting from the market intelligence of its partners. Product execution and delivery are also improved by leveraging on the professional and regulatory networks of its partners. Collaborating with a joint venture partner also facilitated the Company’s forays into new markets such as Davao, Bacolod and Iloillo. After the success of MesaTierra, the Company entered into new partnerships with YHES Inc. to develop Paragon Center and with YHEST Realty Dev’t Corp. to develop Davao Global Township, both in Davao. In 2019, Cebu Landmasters signed a joint venture agreement with an Aboitiz company. The JV company, Cebu Homegrown Developers, Inc., is set to develop a mid-market, mixed-use, multi-tower condominium project in Mandaue City, Cebu as its first project. After the success of Latitude Corporate Center, CLI and Borromeo Bros. partnered afresh to develop another project in another prime location within Cebu City. Cebu BL-Ramos Ventures, Inc. was incorporated in 2020 to develop a mixed-use multi-tower residential condominium in Ramos Cebu City. Additionally, CLI recently signed a joint venture agreement with prominent Iloilo businessman Alfonso Tan, chairman of International Builders Corporation, for a high-rise residential tower on a prime corner lot in Iloilo City’s downtown area. The tower will be the first condominium offering in the highly accessible location. The Company’s successful JV partnerships in its past and present projects underscores CLI’s prominence as a preferred JV partner because of the priority it gives to its partners, its transparency in terms of project planning and accountability, and its quick execution and delivery of projects. The fast business development cycle it implements makes the Company attractive to its current and future JV partners. Financial strength: Strong profitability, prudent financial management and healthy balance sheet Throughout its growth, the Company has consistently demonstrated strong profitability and prudent financial management. CLI’s gross profit and net income posted steady growth while maintaining healthy margins and practicing prudence in its debt management. As of December 31, 2020, CLI’s balance sheet remained healthy despite the global pandemic with current ratio at 2.41x and net debt to equity ratio at 1.48x. For the year ended December 31, 2020, CLI reported consolidated gross profit margin of 48% and net income margin of 25%. Bottom-line decline was brought about by the impact of the coronavirus disease (COVID-19) global pandemic. With the rapid increase of COVID-19 cases in the VisMin region, the government implemented community quarantine to contain the spread of infection temporarily. Company’s construction and transportation of resources gradually renormalized to 90% in the starting the second half of the year from a 50% decline during the height of the pandemic in VisMin regions where CLI operates. The Company also prides itself in its cost discipline. While CLI hires contractors for its projects, it purchases its own raw materials to ensure that the quality and cost are according to the Company’s specifications. Moreover, CLI has one of the most disciplined and responsive accounts receivable and customer service teams. During the lockdown, the Company granted grace period to customers who requested to defer their equity payments due to the pandemic. Despite this, delinquency rate remains low at 5.5%,
22
which can be attributed to CLI’s proactive approach in managing its accounts receivable. With this the Company was able to manage a net sales cancellation rate of 4%. For the year ending December 31, 2020, the Company’s net cancellation effect in revenue is at ₱103 million with recovery rate of 89%. CLI also has a dedicated accounts management team who facilitates the take-out process, whether through a bank mortgage or a cash payout for the contract balance. Operational excellence CLI has a fully integrated real estate set-up encompassing different areas, namely, acquisitions, business development, technical planning, engineering and project management, sales and marketing, documentation and licensing, legal services, customer service, and property management. The Company prides itself on its hands-on and personalized approach, which allows itself to respond effectively to its clients and industry partners.
Construction For each horizontal and vertical development, CLI engages various general and specialty contractors with both local and national experience. With over 121 engineers in its roster, CLI handles the project and construction management aspect of every project, and manages the various contractors and sub-contractors that are utilized. As the project manager, CLI controls the delivery of its projects with priority on promptness, quality and professionalism. CLI does not have any in-house construction or any affiliated general contracting business. Sales CLI has one of the industry-leading sales support teams. With over 55 sales support personnel, this team collaborates, coordinates and supports the over 11,000-strong accredited broker/agent network of CLI. This is CLI’s strategy in working harmoniously with the seller community by assisting the brokers 24/7 from sales origination to closing. CLI works alongside brokers in addressing the client inquiries until closing.
Key Strategies Expansion to key cities in the Visayas and Mindanao Regional Developments:
Bohol : Velmiro Plains Bohol Dumaguete : Casa Mira Coast, Casa Mira Dumaguete Bacolod : MesaVirre Garden Residences, Casa Mira Granada, Velmiro Plains Iloilo : Casa Mira Iloilo CDO : MesaVerte Garden Residences, Velmiro Uptown CDO, Casa Mira Towers CDO Davao City : MesaTierra Garden Residences, The Paragon Center, Davao Global
Township, Casa Mira Towers LPU In 2015, CLI embarked on its regional expansion when it launched MesaVerte Residences in CDO. This is the mid-market condominium offering of CLI with three 15-storey residential towers having a total of 798 units which almost sold out in less than a year of pre-selling. In 2018, the Company then introduced its mid-market horizontal project in the same city – Velmiro Uptown CDO. The subdivision’s master plan shows an inventory of 396 units intended to meet the housing demand in the area. In CDO, the Company set up its first satellite sales, administrative and engineering offices. The Company finds a unique advantage in being homegrown, as it can distinguish itself further in these new regional markets with similar local dynamics as Cebu.
23
In 2016, CLI successfully set its foothold in Davao by launching MesaTierra Garden Residences, a 22-storey residential condominium. In 2017, CLI strengthened its market presence in Davao by entering into two new joint ventures to develop the Paragon Center and Davao Global Township, a 22-hectare estate project. The Company then launched Casa Mira Coast, a five-hectare property in Sibulan, Negros Oriental. After the successful launch of its first Casa Mira brand outside Cebu, CLI expanded its footprint from Negros Oriental to Negros Occidental by introducing MesaVirre Garden Residences, a three-tower residential condominium project in Bacolod City. In 2018, the Company launched Astra Center, its first mixed-used building in Mandaue, Cebu. The Astra Centre is composed of Astra Centre Mall, Radisson RED, One Astra Place and Astra Corporate Centre. In 2019, the Company acquired Abaca Resorts Mactan and Lowaii Marine Cebu Resort in Mactan, Cebu to increase revenues from its hotel segment. CLI entered into a joint venture with an Aboitiz Company, to develop Mandtra Residences, a mid-market, mixed-use, multi-tower condominium project in Mandaue City, Cebu. In 2020, CLI sets footprint in Bohol and Iloilo with the successful launching of Velmiro Greens Bohol, a 3.6-hectare modern mid-market horizontal development in Jaro Dauis, Panglao, Bohol, and Casa Mira Iloilo, 14.4-hectare economic subdivision project in Jaro, Iloilo City with 1,188 housing units. With the fully take-up Casa Mira Coast in Sibulan, Negros Oriental, the Company launched Casa Mira Dumaguete, a 6.1-hectare project to develop 586 economic horizontal housing units. CLI also launched Casa Mira Towers LPU, a 930-unit economic condominium project, as a housing options for students in Lyceum of the Philippines University. CLI has several strategic land acquisitions lined up in greater Cebu, Bacolod and Davao, with new expansion areas such as Ormoc, Palawan, Butuan and General Santos City also on the horizon. CLI continues to pursue its aggressive plans to establish and deliver quality developments across the VisMin region. Building recurring income developments As CLI sets its sight on a long-term growth trajectory, the Company is committed to growing its recurring income portfolio. In 2013, CLI launched its first office building in Cebu IT Park. The project, Park Centrale Tower, was designed to host both BPO and executive offices (office condominium units). With its Grade A design and features, Park Centrale Tower was awarded as the Best Commercial Development in Cebu in the 2014 Philippines Property Awards. In 2015, CLI made another significant step in growing its recurring income portfolio when it launched its Phase 1 of Base Line Center, a redevelopment of one of the largest remaining properties in the prime midtown Cebu area. The project is a mix of retail, office, hotel and residential project. In 2016, CLI launched Latitude Corporate Center, a joint venture development under BL CBP Ventures Inc. This is a 24-storey Grade A office building offering future-ready spaces for businesses with a 13,000 sq.m. GLA. In 2017, the Company launched 38 Park Avenue, a residential high-rise project with 3,000 sq.m of retail space located in the last 1.18-hectare patch of green in Cebu I.T. Park, one of the Philippines’ top 20 prime real estate property. In 2018, the Company launched Astra Center, a mixed-use development located in Mandaue City designed to have a boutique mall, hotel, office and residential tower adding over 30,000 sq.m. GLA. The first hotel business of the Company started operations in September 2019 allowing CLI to recognize a new stream of revenue from the segment. Citadines Cebu City, the 180-room condotel, is operated and managed by Ascott International Management Pte Ltd., the world’s largest international serviced residence owner-operator.
24
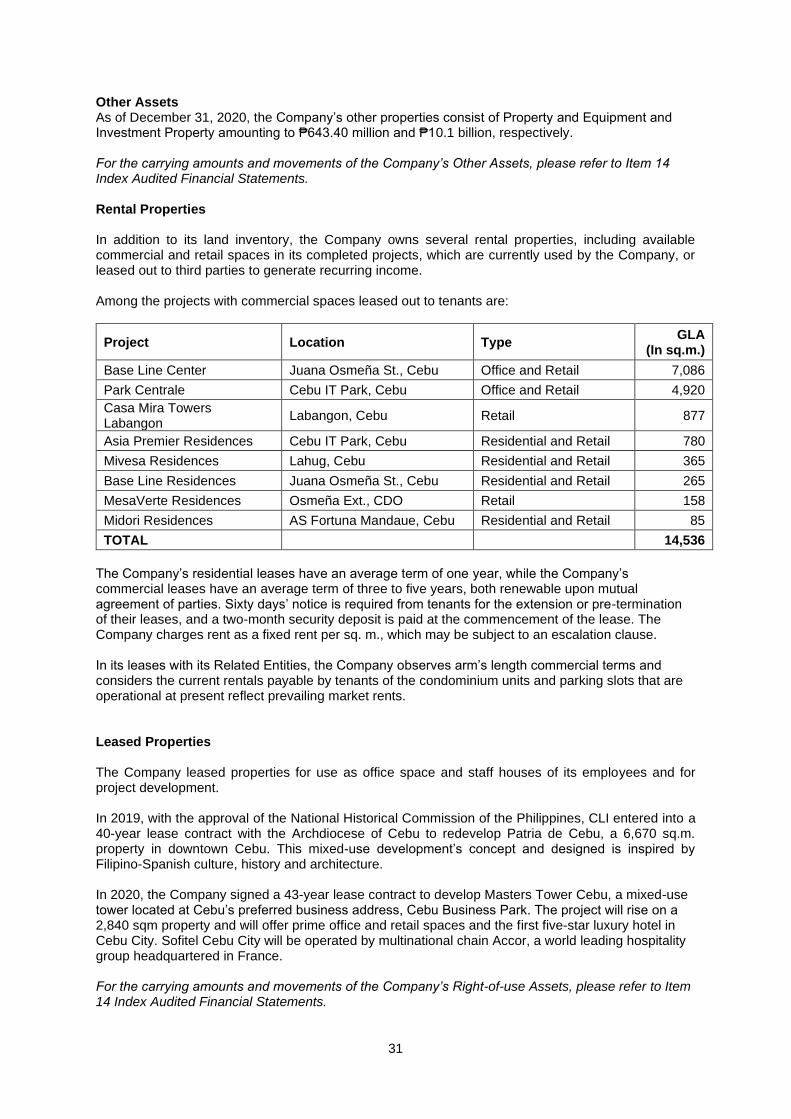
CLI’s current recurring income assets include BPO floor space, executive office space, residential units, and various commercial and retail units in its condominium projects. These assets are now delivering an annual lease income to CLI of close to ₱55.20 million with their combined GLA of 14,536 sq.m. At present, the Company’s rental occupancy rate is at 79%, a minor decline from 82% as of December 31, 2019 with several ongoing commercial developments that will further boost its recurring income. This includes Astra Center, Patria de Cebu and Masters Towers Cebu. The new developments in Davao, Phase 1 of Davao Global Township and Paragon Center, are also designed to boost the recurring income of the Company by 2025 by integrating a hotel, commercial center, office and residential tower into one development. Vertical integration – property management On April 20, 2017, Cebu Landmasters Property Management, Inc. (“CLPM”), a wholly-owned subsidiary of the Company, was incorporated to provide property management services to housing, condominium and office projects developed by the Company. With the goal of making CLPM a self-sustaining and revenue generating business unit, CLPM is envisioned to eventually offer and expand its services to outside clients. Currently, CLPM is managing 32 projects with revenue for the period ending December 31, 2020, 2019 and 2018 are ₱42.60 million, ₱36.80 million, and ₱12.30 million. Growth of economic housing brand (Casa Mira) The Casa Mira brand of Cebu Landmasters is designed to answer the underserved demand in the affordable housing sector. And even after the pandemic, Casa Mira remained CLI’s fastest selling and most sought-after brand. Unit prices range from ₱1.80 million to ₱3.0 million. Correspondingly, the monthly amortizations range from as low as ₱6,000 to as high as ₱15,000. This caters to households with monthly incomes of ₱15,000 to ₱30,000. Despite the pandemic, residents in VisMin purchased a record number of housing units from Casa Mira which altogether accounted for 69% of CLI’s reservation sales that reached ₱14.23 billion, it said. Currently, there are 11 Casa Mira communities and a total of over 10,500 housing units in VisMin namely: (1) Casa Mira Linao, (2) Casa Mira South, (3) Casa Mira Towers Guadalupe, (4) Casa Mira Towers Labangon, (5) Casa Mira Towers Mandaue, (6) Casa Mira Coast, (7) Casa Mira Bacolod, (8) Casa Mira Towers CDO, (9) Casa Mira Iloilo, (10) Casa Mira Dumaguete, and (11) Casa Mira Towers LPU. In 2021, CLI will roll out this brand in Ormoc, Davao, Bacolod and Palawan. The Company sees this as a great opportunity to tap into the class B, C and D markets where most of the working population belongs. With the Philippines’ young and growing workforce, the need for affordable permanent housing options will continue to escalate.
Capitalizing on pipeline projects
CLI has positioned itself well for the next two years with healthy pipeline of over 25 projects: 18 residential and 7 recurring business projects in Metro Cebu, and key cities in VisMin. CLI intends to grow its current product offerings with new vertical residential and mixed-use developments across VisMin, which are expected to generate revenues and recurring income for the Company. The Company’s envisions to launched 15 residential projects with sales value worth ₱19.0 billion including untapped market such as Puerto Princess and Ormoc. Establish and leverage strategic partnerships, alliances joint ventures and cooperation CLI will also continue to pursue local partnerships that will serve to enhance its expansion plans. The Company has proven that strategic alliances can provide a winning formula for securing strategic locations and entering new markets for as long as the joint ventures are executed with best practices. Its existing joint venture are CLI Premier Hotels Int’l. Inc. (CPH), BL CBP Ventures, Inc. (BL Ventures), Yuson Excellence Soberano, Inc. (YES), Mivesa Garden Residences, Inc. (MGR), Yuson Huang Excellence Soberano, Inc. (YHES), YHEST Realty and Development Corporation (YHEST), CCLI
25
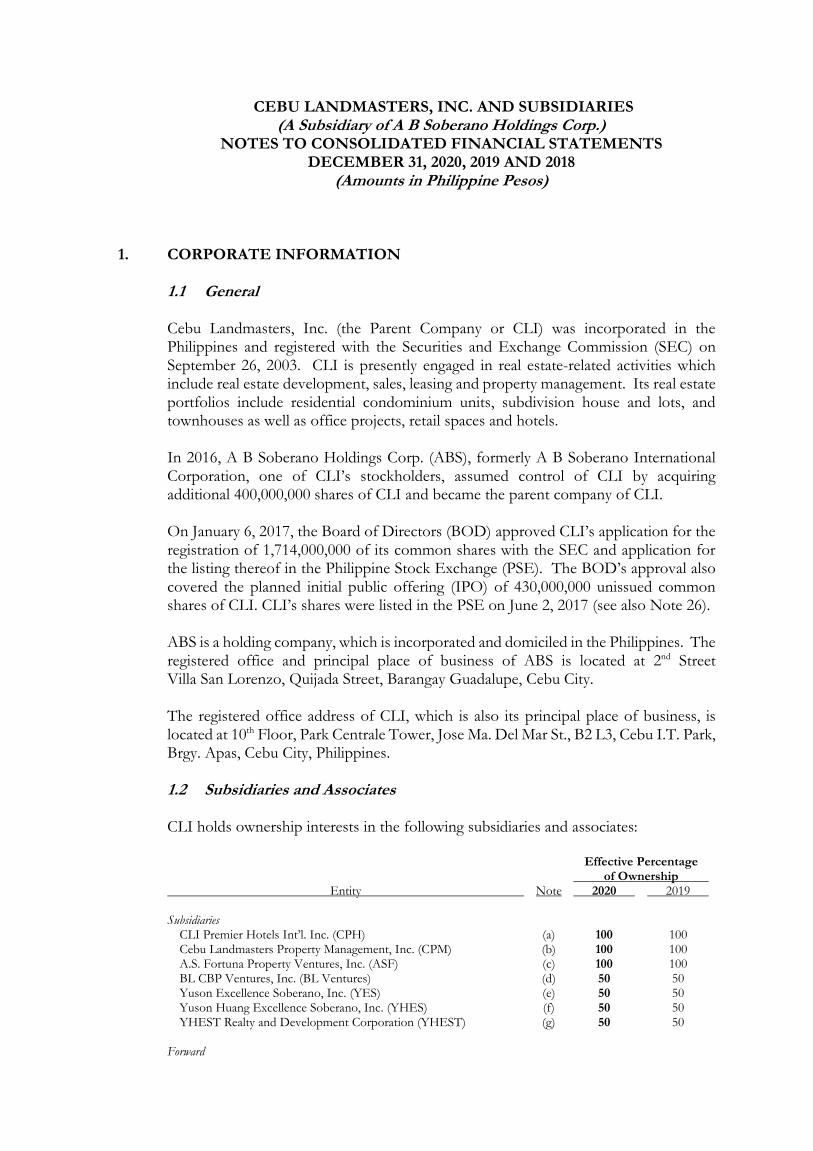
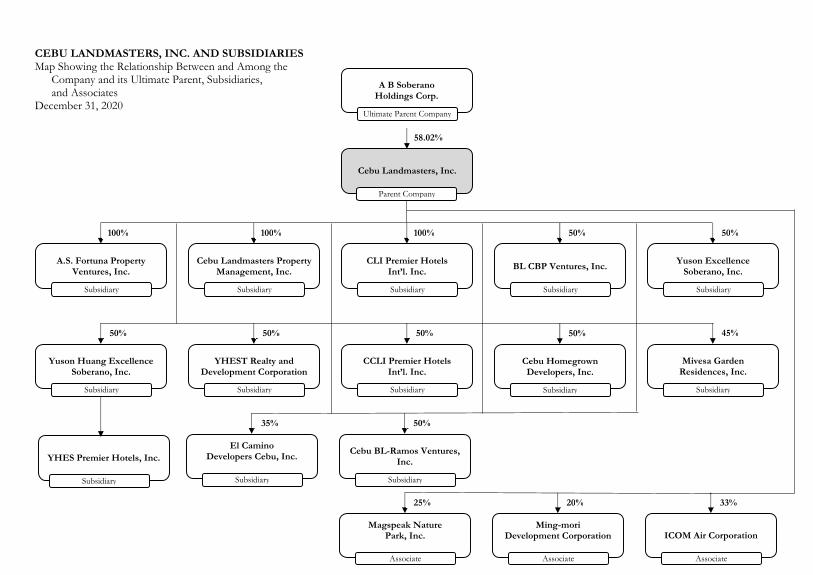
Premier Hotels, Inc. (CCLI), El Camino Developers Cebu, Inc. (El Camino), Cebu Homegrown Developers, Inc. (CHDI), and YHES Premier Hotel Inc. (YHESPH). In 2020 CLI’s new joint venture partnerships are Cebu BL-Ramos Ventures Inc. (CBLRV) and GGTT Realty Corporation (GGTT). Corporate Organization CLI is presently engaged in real estate-related activities such as real estate development, sales, leasing and property management. Its real estate portfolios include residential condominium units, subdivision house and lots, and townhouses as well as hotels, office projects, retail spaces and townships. In 2016, A B Soberano Holdings Corp. (“ABS”), formerly A B Soberano International Corporation, one of CLI’s stockholders, assumed control of CLI by acquiring additional 400,000,000 shares of CLI and became the parent company of CLI. ABS is a holding company and is incorporated and domiciled in the Philippines. The registered office and principal place of business of ABS is located at 2nd Street Villa San Lorenzo, Quijada Street, Barangay Guadalupe, Cebu City. On January 6, 2017, the board of directors approved CLI’s application for the registration of 1,714 million of its common shares with the SEC and application for the listing thereof in the PSE. The board of directors’ approval also covered the planned initial public offering of 430 million unissued common shares of CLI. CLI’s shares were listed in the PSE on June 2, 2017. On February 26, 2021, the Company increased the authorized capital stock to P10.0 billion common shares and P1.0 billion voting preferred shares.
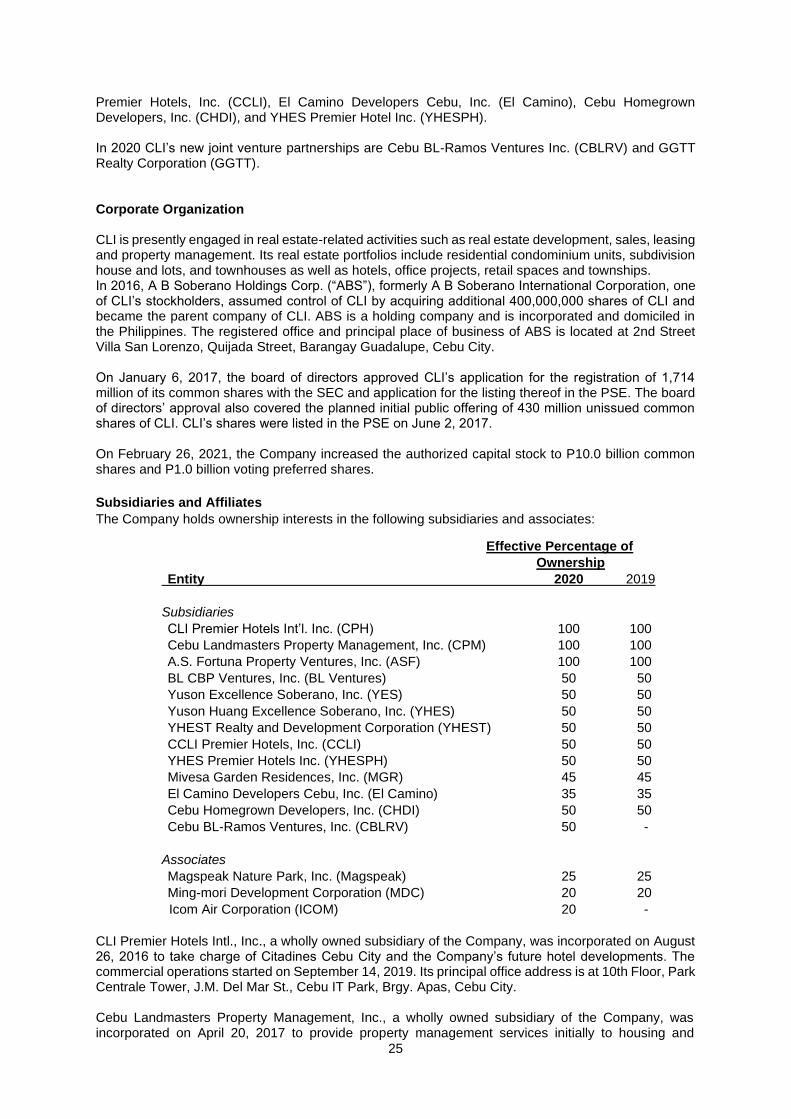
Subsidiaries and Affiliates
The Company holds ownership interests in the following subsidiaries and associates:
Effective Percentage of
Ownership
Entity 2020 2019
Subsidiaries
CLI Premier Hotels Int’l. Inc. (CPH) 100 100
Cebu Landmasters Property Management, Inc. (CPM) 100 100
A.S. Fortuna Property Ventures, Inc. (ASF) 100 100
BL CBP Ventures, Inc. (BL Ventures) 50 50
Yuson Excellence Soberano, Inc. (YES) 50 50
Yuson Huang Excellence Soberano, Inc. (YHES) 50 50
YHEST Realty and Development Corporation (YHEST) 50 50
CCLI Premier Hotels, Inc. (CCLI) 50 50
YHES Premier Hotels Inc. (YHESPH) 50 50
Mivesa Garden Residences, Inc. (MGR) 45 45
El Camino Developers Cebu, Inc. (El Camino) 35 35
Cebu Homegrown Developers, Inc. (CHDI) 50 50
Cebu BL-Ramos Ventures, Inc. (CBLRV) 50 -
Associates
Magspeak Nature Park, Inc. (Magspeak) 25 25
Ming-mori Development Corporation (MDC) 20 20
Icom Air Corporation (ICOM) 20 -
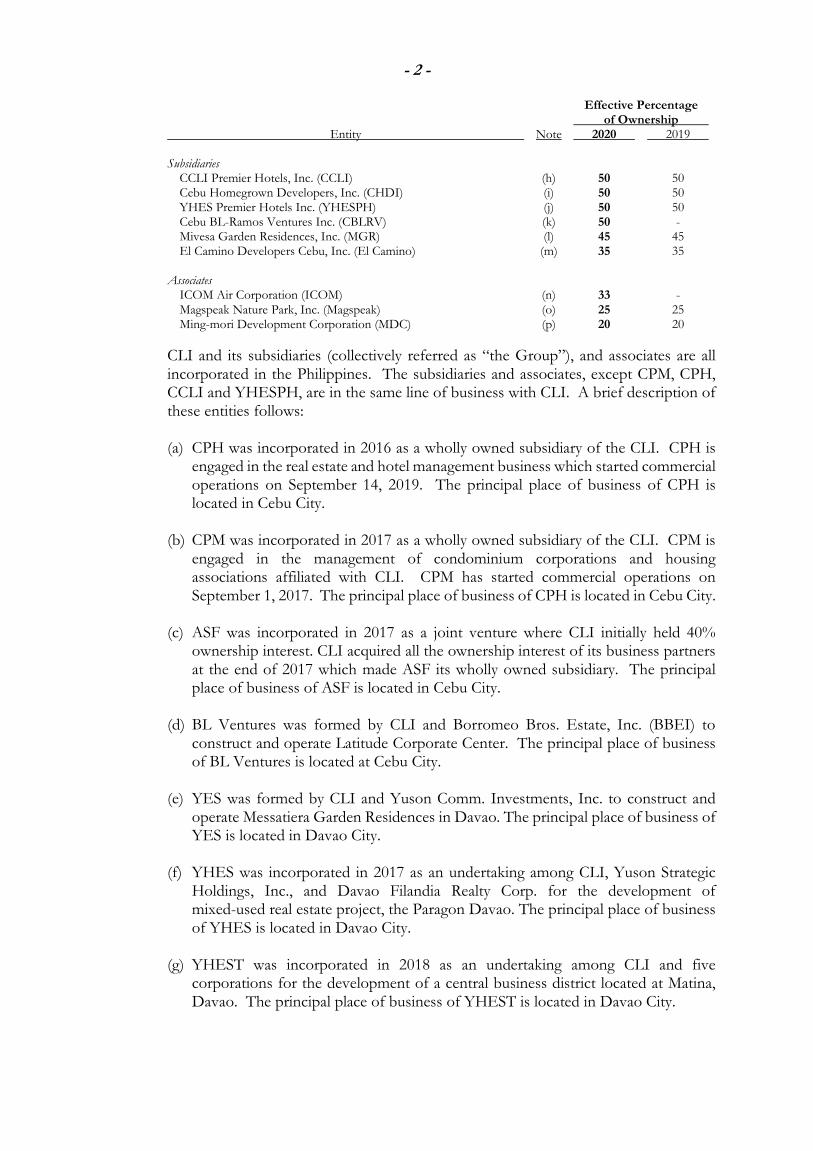
CLI Premier Hotels Intl., Inc., a wholly owned subsidiary of the Company, was incorporated on August 26, 2016 to take charge of Citadines Cebu City and the Company’s future hotel developments. The commercial operations started on September 14, 2019. Its principal office address is at 10th Floor, Park Centrale Tower, J.M. Del Mar St., Cebu IT Park, Brgy. Apas, Cebu City. Cebu Landmasters Property Management, Inc., a wholly owned subsidiary of the Company, was incorporated on April 20, 2017 to provide property management services initially to housing and
26
condominium projects developed by the Company. It is envisioned to eventually offer and expand its services to outside clients. The started commercial operations on September 1, 2017. Its principal office address is at 10th Floor, Park Centrale Tower, J.M. Del Mar St., Cebu IT Park, Brgy. Apas, Cebu City. A.S. Fortuna Property Ventures, Inc. was incorporated as a joint venture on March 9, 2017 to facilitate the acquisition of a 9,989-sq.m. property along AS Fortuna Avenue for the development of the Astra Center Mandaue, a mixed-use development in the AS Fortuna Mandaue area that will house a hotel, residential and office development and a boutique mall. CLI acquired all the ownership interest of its business partners at the end of 2017 which made ASF its wholly owned subsidiary as of December 31, 2017. Its principal office is located 10th Floor, Park Centrale Tower, Josemaria del Mar St., Cebu IT Park, Brgy. Apas, Cebu City. BL CBP Ventures, Inc. was incorporated on February 3, 2016 to develop Latitude Corporate Center, a 24-storey office development at the Cebu Business Park. BL CBP Ventures, Inc. was a joint venture of the Company and Borromeo Bros, Inc. Its principal office address is at AB Soberano Bldg., Salvador Ext., Labangon, Cebu City. YES, Inc. was incorporated on December 15, 2016 to mark the Company’s entry into the Davao market. It is a joint venture between the Company and Yuson Comm. Investments Inc. to undertake the development of MesaTierra Garden Residences, a 21-storey residential condominium, and two other mixed-use projects in Davao City. It will also engage in real estate brokering to facilitate the marketing and sale of the joint venture developments in Davao. Its principal office address is at Suite A, 204 Plaza De Luisa Complex, 140 R. Magsaysay Ave. in Davao City. YHES, Inc. was incorporated on November 10, 2017 to develop the Paragon Davao, a 1.9-hectare property in Riverside Davao. The development will become a mixed-use real estate which will include a residential, retail, hotel and convention center. YHES Inc., is a joint venture of CLI, Yuson Strategic Holdings Inc., and Davao Filandia Realty Corp. Its principal office is located at MesaTierra Garden Residences Showroom, E. Quirino Avenue in Davao City. YHEST Realty and Development, Inc was incorporated on August 10, 2018 to develop the Davao Global Township. YHEST Realty and Development is a joint venture between CLI, Yuson Strategic Holdings Inc., Davao Filandia Realty Corp., Plaza De Luisa Development Inc., Yuson Newtown Corp., and Davao Primeland Properties Corp. Its principal address is at MesaTierra Garden Residences Showroom, E. Quirino Avenue in Davao City. CCLI Premier Hotels, Inc. was incorporated on November 12, 2018 as an undertaking between CLI and Capitaine, Inc. for the development of Citadines hotel in Bacolod City. The Citadines hotel is planned to be managed by Ascott. The principal place of business of CCLI is located at 2nd floor MesaVirre showroom in Bacolod City. Mivesa Garden Residences, Inc. was incorporated on March 13, 2017 to develop Towers 6 and 7 (Phase 3) of Mivesa Garden Residences, a real property development project located on a 3,000-sq.m. property to be registered in the Company’s name. Its principal office is located 10th Floor, Park Centrale Tower, Josemaria del Mar St., Cebu IT Park, Brgy. Apas, Cebu City. CLI holds a 45% stake in MGR. EL Camino Developers Cebu, Inc. was incorporated on August 15, 2016 to develop a 1.17-hectare property inside the Cebu IT Park, and to construct (1) 38 Park Avenue at the Cebu IT Park, a 38-storey high-end residential condominium, and (2) Park Avenue Corporate Center, a Grade A office building with over 20,000 sq.m. of leasable area. Its principal office address is at Base Line Center, Juana Osmeña St., Brgy. Kamputhaw, Cebu City. The Company has a 35% stake in El Camino. YHES Premier Hotels Inc. was incorporated on October 28, 2019 as a wholly owned subsidiary of YHES that will engage in hotel business. Its ultimate parent is CLI which owns 50% of YHES. YHESPH has not yet started its commercial operations. Cebu Homegrown Developers, Inc., a joint venture of Aboitizland and CLI, was recently incorporated on December 5, 2019 to develop a high-rise mixed-use condominium complex, with sellable and leasable units, in a 12,405 sq.m. lot area in Mandaue City, Cebu. The Company has a 50% stake in Aboitiz CLI Cebu Developers, Inc.
27
CBLRV was incorporated on February 21, 2020 as an undertaking between CLI and BBEI and is engaged in the development of a mixed-use condominium tower in Cebu City. Its principal place of business also is located in Cebu City. Magspeak. was incorporated on October 21, 2011 to acquire, lease and develop lands into nature and eco-tourism parks in Balamban Cebu, and to manage and operate the same. CLI holds a 25% stake in Magspeak. MDC was incorporated on August 1, 2013 to undertake and execute land reclamation projects, submit bids and accept awards for reclamation projects, and manage, hold and sell reclaimed land and other real property. MDC is the private consortium that has proposed to undertake the Ming-Mori Reclamation Project of the Municipality of Minglanilla, which involves the development of the Minglanilla TechnoBusiness Hub, a 100-hectare techno-business park in the progressive town of Minglanilla, a mere 30 minutes away from Cebu City. The Company has subscribed to 20% in Ming-Mori Development Corporation. TWDC was incorporated on July 4, 2019 as a joint undertaking for the development of a reclamation project in Bohol. CLI holds an 18% stake in TWDC. ICOM was incorporated on December 2020 as an undertaking of CLI and various individual stockholders to import aircraft(s) and operate a transportation business in the Philippines. ICOM’s principal place of business is located in Iloilo City. As a result of the above-described transactions, please refer to Item 14 Index Audited Financial Statements for CLI’s corporate structure as of date.
Competition In 2019, a real estate market study by SKF reveals that CLI is the number 1 developer of residential projects in VisMin. The SKF market study that covered 10 key cities and included both national and local developers in the VisMin areas named CLI as “the leading residential developer in VisMin”. In 2020, a recent market study by SKF, CLI retained the position as “the leading residential developer in VisMin” with the largest market share from among real estate firms providing condominium projects and subdivisions in the region. The 2020 study shows that CLI leads the residential market with a 12% market share, delivering close to 18,683 units, of the available 86,126 units in VisMin. These are based on actual and current market supply offering. The listed company bested Sta. Lucia Realty and Development and Camella Homes, at 11,897 units and 11,768 units, respectively. In Metro Cebu, CLI has the largest market share of vertical residential developments at 23%, according to the SKF study. The company’s absorption rate registered at 96% or significantly above the 80% industry average in Metro Cebu indicating high demand for its products. Recently, for instance, it launched Mivela Garden Residences, which sold out more than 80% of units in less than three weeks from market launch. The firm’s average take-up rate at 210 per month and absorption rate at 83% is way above the industry average in the market. The condominium and subdivision absorption rate is at 86% and 82%, respectively. To leverage itself against competition, CLI draws its advantage on its core strengths – its hands-on personalized service, local (i.e., VisMin) real estate expertise, stringent location selection, and responsible development as well as in its aggressiveness, speed to market and best value projects. Suppliers CLI sources construction materials and services from third party suppliers and service providers both in the local and national level who meet the Company’s strict quality standards through a pre-qualification and a bidding process. There is no shortage of raw materials or services that the Company needs for its day-to-day business as these are readily available in the market. Hence, the CLI is not dependent on any single supplier or service provider.
28
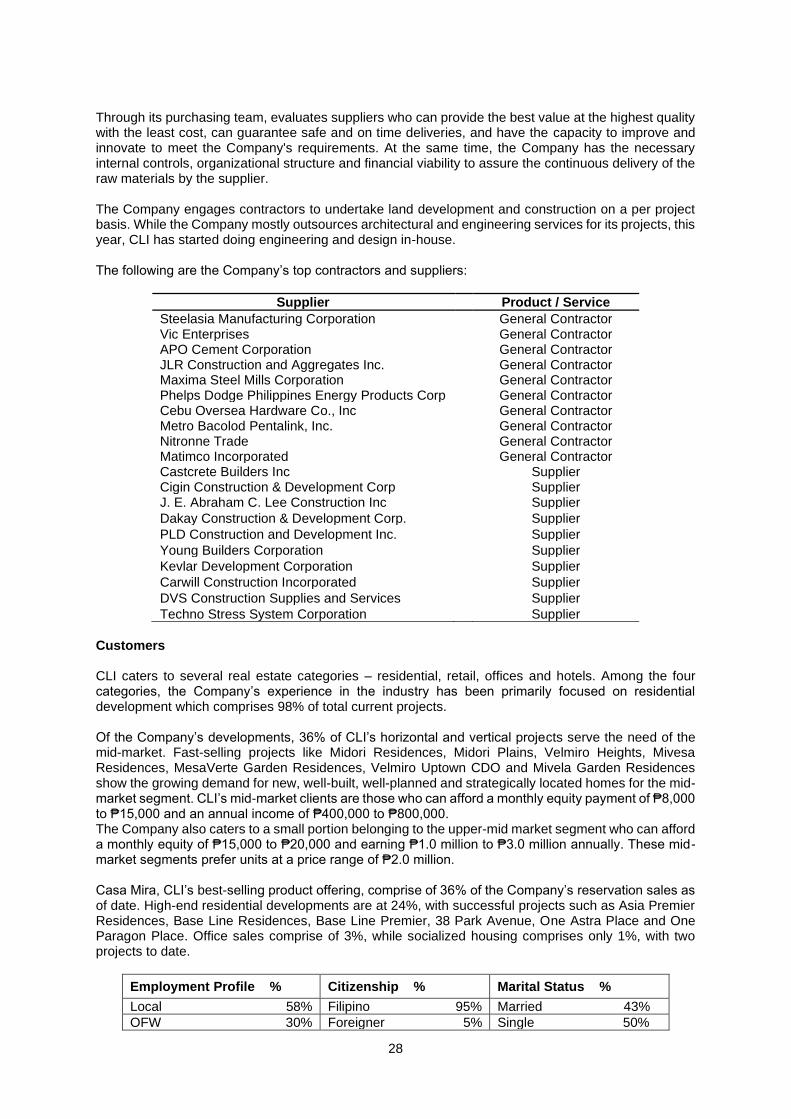
Through its purchasing team, evaluates suppliers who can provide the best value at the highest quality with the least cost, can guarantee safe and on time deliveries, and have the capacity to improve and innovate to meet the Company's requirements. At the same time, the Company has the necessary internal controls, organizational structure and financial viability to assure the continuous delivery of the raw materials by the supplier. The Company engages contractors to undertake land development and construction on a per project basis. While the Company mostly outsources architectural and engineering services for its projects, this year, CLI has started doing engineering and design in-house. The following are the Company’s top contractors and suppliers:
Supplier Product / Service
Steelasia Manufacturing Corporation General Contractor Vic Enterprises General Contractor APO Cement Corporation General Contractor JLR Construction and Aggregates Inc. General Contractor Maxima Steel Mills Corporation General Contractor Phelps Dodge Philippines Energy Products Corp General Contractor Cebu Oversea Hardware Co., Inc General Contractor Metro Bacolod Pentalink, Inc. General Contractor Nitronne Trade General Contractor Matimco Incorporated General Contractor Castcrete Builders Inc Supplier Cigin Construction & Development Corp Supplier J. E. Abraham C. Lee Construction Inc Supplier
Dakay Construction & Development Corp. Supplier
PLD Construction and Development Inc. Supplier
Young Builders Corporation Supplier
Kevlar Development Corporation Supplier
Carwill Construction Incorporated Supplier
DVS Construction Supplies and Services Supplier
Techno Stress System Corporation Supplier
Customers CLI caters to several real estate categories – residential, retail, offices and hotels. Among the four categories, the Company’s experience in the industry has been primarily focused on residential development which comprises 98% of total current projects. Of the Company’s developments, 36% of CLI’s horizontal and vertical projects serve the need of the mid-market. Fast-selling projects like Midori Residences, Midori Plains, Velmiro Heights, Mivesa Residences, MesaVerte Garden Residences, Velmiro Uptown CDO and Mivela Garden Residences show the growing demand for new, well-built, well-planned and strategically located homes for the mid-market segment. CLI’s mid-market clients are those who can afford a monthly equity payment of ₱8,000 to ₱15,000 and an annual income of ₱400,000 to ₱800,000. The Company also caters to a small portion belonging to the upper-mid market segment who can afford a monthly equity of ₱15,000 to ₱20,000 and earning ₱1.0 million to ₱3.0 million annually. These mid-market segments prefer units at a price range of ₱2.0 million. Casa Mira, CLI’s best-selling product offering, comprise of 36% of the Company’s reservation sales as of date. High-end residential developments are at 24%, with successful projects such as Asia Premier Residences, Base Line Residences, Base Line Premier, 38 Park Avenue, One Astra Place and One Paragon Place. Office sales comprise of 3%, while socialized housing comprises only 1%, with two projects to date.
Employment Profile % Citizenship % Marital Status %
Local 58% Filipino 95% Married 43%
OFW 30% Foreigner 5% Single 50%
29
Self-Employed 9% Others 7%
Entrepreneur 4%
For its leasing business, the Company’s top lessees include a BPO company, a supermarket store, service providers and food establishments. CLI is committed to continuously address the growing needs and demand of the market in each segment the Company caters to. CLI aims to constantly innovate, and remain consistent with the quality of the developments, the selection of location and the hands-on service that goes along with it. Transactions with related parties Please refer to Item 12 of this report (“Certain Relationships and Related Transactions”). Government approvals/regulations The Company secures various government approvals such as the environmental compliance certificate, development permits, license to sell, etc. as part of the normal course of its business. Employees The Company has a total of 574 employees, broken down in entities and department as follows:
Department/Company Employees
Parent Company Engineering 121 Sales 55 Accounting and Finance 51 Treasury 46 Business Development 29 Permits & Licenses 25 Property Management 22 Accounts Management 19 Customer Care 19 Human Resources & Admin 17 Tax 13 Marketing 12 Purchasing 12 Corporate Finance 9 IT 9 Legal 5 Internal Audit 4 Leasing 3 Top Management 5
Subsidiaries CLPM 60 CPH 38
ITEM 2. PROPERTIES Land Inventory Using its location selection criteria, the Company, its joint ventures and associates (“Company and its Related Entities”) have invested in properties located in strategic areas in VisMin which the Company and its Related Entities believe to have high future appreciation potential for its existing and future
30
development projects. The table below enumerates the parcels of land owned by the Company and its Related Entities.
Location Primary Use Ownership Total Area (In sq.m.)
Magtuod, Davao Residential Parent Company 285,842
Matina, Davao Mixed-use YHEST 220,000
Teakwood CDO Residential Parent Company 121,915
Ormoc, Leyte Residential Parent Company 94,000
Casa Mira South, Cebu Residential Parent Company 24,627
Mandaue, Cebu Residential CHDI 24,623
Puerto Princesa, Palawan Residential Parent Company 20,974
Lowaii Mactan, Cebu Mixed-use Parent Company 18,413
Minglanilla, Cebu Residential Parent Company 18,369
Dauis Panglao, Bohol Residential Parent Company 12,518
Mandaue, Cebu Residential CHDI 12,405
Lacson, Bacolod Residential Parent Company 11,209
Junob, Dumaguete Residential Parent Company 11,181
Paragon, Davao Mixed-use YHES 10,201
Ramos, Cebu Residential CBLRV 5,539
Mactan Abaca, Cebu Hotel Parent Company 4,328
Lyceum Property, Davao Residential Parent Company 3,672
Cebu IT Park, Cebu Mixed-use El Camino 3,389
Arroyo, Iloilo Residential GGTT 2,539
Guadalupe, Cebu Residential Parent Company 1,915
Baseline, Cebu Mixed-use Parent Company 913
AS Fortuna Mandaue, Cebu Mixed-use ASF 387
Total 908,959
31
Other Assets As of December 31, 2020, the Company’s other properties consist of Property and Equipment and Investment Property amounting to ₱643.40 million and ₱10.1 billion, respectively. For the carrying amounts and movements of the Company’s Other Assets, please refer to Item 14 Index Audited Financial Statements. Rental Properties In addition to its land inventory, the Company owns several rental properties, including available commercial and retail spaces in its completed projects, which are currently used by the Company, or leased out to third parties to generate recurring income. Among the projects with commercial spaces leased out to tenants are:
Project Location Type GLA
(In sq.m.)
Base Line Center Juana Osmeña St., Cebu Office and Retail 7,086
Park Centrale Cebu IT Park, Cebu Office and Retail 4,920
Casa Mira Towers Labangon
Labangon, Cebu Retail 877
Asia Premier Residences Cebu IT Park, Cebu Residential and Retail 780
Mivesa Residences Lahug, Cebu Residential and Retail 365
Base Line Residences Juana Osmeña St., Cebu Residential and Retail 265
MesaVerte Residences Osmeña Ext., CDO Retail 158
Midori Residences AS Fortuna Mandaue, Cebu Residential and Retail 85
TOTAL 14,536
The Company’s residential leases have an average term of one year, while the Company’s commercial leases have an average term of three to five years, both renewable upon mutual agreement of parties. Sixty days’ notice is required from tenants for the extension or pre-termination of their leases, and a two-month security deposit is paid at the commencement of the lease. The Company charges rent as a fixed rent per sq. m., which may be subject to an escalation clause. In its leases with its Related Entities, the Company observes arm’s length commercial terms and considers the current rentals payable by tenants of the condominium units and parking slots that are operational at present reflect prevailing market rents. Leased Properties The Company leased properties for use as office space and staff houses of its employees and for project development. In 2019, with the approval of the National Historical Commission of the Philippines, CLI entered into a 40-year lease contract with the Archdiocese of Cebu to redevelop Patria de Cebu, a 6,670 sq.m. property in downtown Cebu. This mixed-use development’s concept and designed is inspired by Filipino-Spanish culture, history and architecture. In 2020, the Company signed a 43-year lease contract to develop Masters Tower Cebu, a mixed-use tower located at Cebu’s preferred business address, Cebu Business Park. The project will rise on a 2,840 sqm property and will offer prime office and retail spaces and the first five-star luxury hotel in Cebu City. Sofitel Cebu City will be operated by multinational chain Accor, a world leading hospitality group headquartered in France. For the carrying amounts and movements of the Company’s Right-of-use Assets, please refer to Item 14 Index Audited Financial Statements.
32
Mortgage, Liens And Encumbrances In pursuit of its business, the Company has entered into various mortgage agreements covering certain parcels of land and improvements for the purposes of securing development loans or credit facilities extended by financial institutions. The cost of such projects aggregating to ₱7.85 billion and ₱10.23 billion, respectively. Under Section 18 of Presidential Decree No. 57, no mortgage on any unit or lot shall be made by the owner or developer without prior written approval of the HLURB. Accordingly, before the Company can mortgage properties being used for its condominium or subdivision projects, it should ensure compliance with the said law and its implementing regulations. Properties of the Company and its Related Entities in which particular projects have been developed are also subject to restrictions arising from the nature of such projects. For instance, certain properties over which a condominium building project has been constructed would have restrictions annotated on the title of such property arising from the Master Deed restrictions on the use of the property for condominium use. Likewise, properties being leased by the Company are subject to typical lease-related limitations on usage, e.g., for office use only. Insurance CLI procures insurance coverage required by relevant laws and regulations for its real and personal properties and requires contractors to submit performance bonds, marine insurance policies, and other sureties for its covered activities. Throughout the construction stage, the Company also maintains Contractor’s All-risk Insurance for each of its projects, subject to customary deductibles and exclusions. For completed projects, CLI also requires homeowner’s associations and condominium corporations to obtain fire and allied risks insurance as part of the master deed for these projects. ITEM 3. LEGAL PROCEEDINGS The Company and its subsidiaries are not a party to, nor any of the Company’s properties are the subject of any pending material litigation, arbitration or other legal proceeding, and no litigation or claim of material importance is known to the management and the directors to be threatened against the Company, its subsidiaries or any of its properties. ITEM 4. SUBMISSION OF MATTERS TO A VOTE OF SECURITY HOLDERS No matter was submitted during the fourth quarter of the fiscal year covered by this report to a vote of security holders, through the solicitation of proxies or otherwise.
33
PART II – OPERATIONAL AND FINANCIAL INFORMATION
ITEM 5. MARKET FOR REGISTRANT’S COMMON EQUITY AND RELATED STOCKHOLDER
MATTERS
Market information Cebu Landmasters, Inc. listed its common shares with the Philippine Stock Exchange last June 2,
2017. Philippine Stock Exchange
Prices (in ₱/ share)
High Low Close
2017
Second Quarter (month of June only)
5.98 5.13 5.34
Third Quarter 5.51 4.58 5.07
Fourth Quarter 5.17 4.59 4.88
2018
First Quarter 5.12 4.21 4.70
Second Quarter 5.06 4.48 4.58
Third Quarter 4.73 4.27 4.42
Fourth Quarter 4.59 3.60 4.14
2019
First Quarter 4.29 4.19 4.20
Second Quarter 4.89 4.80 4.83
Third Quarter 4.75 4.70 4.74
Fourth Quarter 4.83 4.67 4.83
2020
First Quarter 3.80 3.70 3.72
Second Quarter 5.10 4.35 4.69
Third Quarter 4.92 4.83 4.90
Fourth Quarter 5.05 4.99 5.05
The market capitalization of CLI as of December 31, 2020, based on the closing price of ₱5.05/share,
was approximately ₱7.85 billion.
Stockholders
The following are the list of registered holders of the common equity securities of the Company as of
The following are common shares held by the Company’s Board of Directors lodged with PCD
Nominee Corporation:
Stockholder Name No. of Common
Shares Percentage (of
common shares)
1 Jose R. Soberano III 61,625,000 3.96%
2 Ma. Rosario B.Soberano 59,125,000 3.80%
3 Jose Franco B. Soberano 5,741,700 0.37%
4 Janella Mae B. Soberano 5,231,700 0.34%
5 Joanna Marie B. Soberano 5,231,700 0.34%
6 AB Soberano Holdings, Inc 23,360,004 1.50%
TOTAL 160,315,104 10.31%
Dividends The Company has declared the following cash and stock dividends.
Cash Dividends
Year of Dividend Declaration
Rate of Dividend Declared per Share (in ₱)
Record Date Amount Paid
(in ₱)
2014 12.50 November 3, 2014 48,000,000
2015 7.19 February 28, 2015 42,000,000
2015 10.27 June 15, 2015 60,000,000
2015 8.56 October 15, 2015 50,000,000
2015 5.66 December 15, 2015 50,000,000
2016 2.26 March 31, 2016 20,000,000
2016 5.99 August 31, 2016 52,943,457
2016 4.32 September 15, 2016 38,150,000
2016 1.70 September 30, 2016 15,000,000
2016 0.74 November 21, 2016 650,000,000
2016 0.05 December 1, 2016 40,000,000
2016 0.03 December 1, 2016 40,000,000
2018 0.15 March 23, 2018 235,186,980
2019 0.20 March 26, 2019 332,590,000
2020 0.25 April 3, 2020 414,795,000
35
Year of Dividend Declaration
Rate of Dividend Declared per Share (in ₱)
Record Date Amount Paid
(in ₱)
2021 0.25 April 16, 2021 (est.)
388,749,900
Stock Dividends
Year of Dividend Declaration
Rate of Dividend Declared per Share
Record Date No. of Shares
2014 0.5208 November 30, 2014 2,000,000
2015 0.3394 December 15, 2015 3,000,000
2021 1.23 TBA TBA
Recent Sale of Securities
There was no sale of the Company’s securities during the reporting period.
ITEM 6. MANAGEMENT’S DISCUSSION AND ANALYSIS OR PLAN OF OPERATION Company Milestones Cebu Landmasters, Inc. (“CLI” or the “Company”) is the leading real estate developer in Visayas and Mindanao currently located in 15 key cities. Despite the crisis brought about by the COVID-19 pandemic, CLI continues to establish strength and leadership. In 2020, the Company launched nine projects worth ₱11.4 billion, with a total of 4,300 homes, namely:
a. Velmiro Greens Bohol b. Casa Mira Iloilo c. Casa Mira South Phase 3B d. Casa Mira Towers Mandaue Tower 2 e. Casa Mira Towers Guadalupe Tower 2 f. Casa Mira Towers - LPU g. Casa Mira Linao Phase 3 h. Casa Mira South Phase3A i. Casa Mira Dumaguete
The Company posted a 12% year-on-year (y-o-y) increase in its reservation sales to ₱14.25 billion driven by increased demand from end-users of affordable homes. Until the end of 2019, 40% of CLI buyers were mostly OFWs. In 2020, the company’s share of OFW buyers dropped to 30% while local buyers’ share now increased to 58% from 40% in 2019. On February 21, 2020, Cebu BL-Ramos Ventures, Inc. was incorporated as an undertaking between CLI and BBEI and engaged in the development of a mixed-use condominium tower in Ramos, Cebu City. On March 5, 2020, to fund CLI’s expansion plans, the Company entered into a notes facility agreement with several financial institutions wherein the Company issued a five-year corporate notes amounting to ₱1.3 billion; seven-year corporate notes amounting to ₱5.7 billion; and 10-year corporate notes amounting to ₱1.0 billion at an average fixed rate of 4.15%. Proceeds of the notes will be used to finance capital expenditures and general corporate purposes. Institutions which participated in the exercise were Bank of the Philippine Islands, China Banking Corporation, Development Bank of the Philippines, Land Bank of the Philippines, Rizal Commercial Banking Corporation and Social Security System. The issuance was jointly arranged by BPI Capital Corp. and China Banking Corp.
36
On June 16, 2020, CLI acquired 50% ownership and obtained controlling interest in GGTT Realty Corporation. GGTT is engaged to construct a mid-market residential condominium project in downtown Iloilo City. On July 22, 2020, the Company’s Ming-Mori Minglanilla Reclamation Project covering 100 hectares was issued an ECC by the following a comprehensive two-year review. The joint venture among the local government of Minglanilla and private consortium partners Ming-Mori Development Corp. The techno business hub will be a township project to house light industrial facilities with residential, commercial areas and an integrated port facility. After regular review and monitoring of CLI’s financial performance and position, Philratings has maintained its initial rating of PRS Aa with Stable outlook to Cebu Landmasters. Obligations rated PRS Aa are of high quality and are subject to very low credit risk and capacity to meet financial commitments is very strong. The rating and outlook reflect the following key considerations: (1) Sound management and strategy, with a sustained competitive advantage in the Visayas and Mindanao markets as evidenced by its growth over the last few years; (2) Sustained growth in the past years although the pandemic is seen to temper growth momentum in the medium term; (3) Good coverage of interest and current debt, complemented by an adequate capital structure, which are seen to provide a satisfactory buffer for debt servicing during the pandemic; and (4) Threats from a highly competitive market, with peers having access to significant capital and a substantial landbank, counterbalanced by the Company’s ability to form strategic joint venture partnerships. Furthermore, the Board of Directors and stockholders approved on November 24, 2020 and February 26, 2021, respectively, the declaration of stock dividend of 123% on the outstanding capital stock of CLI or a total of 1,912,649,508 new common shares. The stock dividends shall be sourced from the increase in authorized capital stock of the Corporation, and payable to stockholders of record as of a record date to be fixed and approved by the SEC, on such payment date to be fixed by the Board. With the Company’s stellar performance and resilience despite disruptions brought about by the pandemic, the Board declared cash dividend of ₱0.25 per share on March 16, 2021 with a total estimated amount of ₱388.75 million to stockholders on record as of April 16, 2021. Such dividend will be paid on May 10, 2021. Review on the Company’s Results of Operation
FY 2020 vs FY 2019
For the period ending December 31, 2020, CLI generated Parent Company NIAT is at ₱1.85 billion, a slight decline of 8% y-o-y from ₱2.01 billion. A decline in the Company’s bottom line numbers was due to the stringent lockdown measures imposed by the government during the period. This translates to an earnings per share of ₱1.15. CLI bounced back and posted a strong financial growth as restrictions eased during the second half of 2020. The Company’s consolidated NIAT during the second half of the year is at ₱1.16 billion, 26% higher as compared to the first half. Parent NIAT during the second half of 2020, on the other hand, is at ₱1.05 billion, 33% higher than the first half. Revenues For the period ending December 31, 2020, CLI generated consolidated revenue of ₱8.30 billion, a slight decline of 2% y-o-y from ₱8.50 billion. In the fourth quarter of the period, consolidated revenue registered at ₱2.59 billion, 18% growth from ₱2.20 billion in the third quarter of 2020, as travel restrictions eases and as operations and construction recuperate.
Real estate sales Revenue from sale of real estate reached ₱8.15 billion, 3% y-o-y slight decline from ₱8.39 billion in 2019, driven by Garden Series (36%), followed by Casa Mira Series (32%) and Premier Masters (27%). In the same period of 2019, Garden Series generated 37% of the total revenues, followed by Casa Mira
37
(30%) and Premier Masters (30%). In terms of location, CLI’s presence in Cebu remains to be strong, representing 52% of the total revenues, followed by CDO (16%) and Bacolod (11%), for both periods ending December 31, 2020.
Premier Masters (Premier market), at ₱2.22 billion, declined by 13% y-o-y from ₱2.54 billion, with the construction slowdown of 38 Park Avenue due to the pandemic. Garden Series (Mid-market), at ₱2.99 billion, slightly declined by 6% y-o-y from ₱3.12 billion, driven by Mivela Garden Residences, Velmiro Plains Bacolod and, the recently launched, Velmiro Greens Bohol. Casa Mira Series (Economic market), at ₱2.67 billion, grew by 6% y-o-y from ₱2.51 billion, mainly from newly launched projects during the year: Casa Mira Iloilo and Casa Mira South Phase 3B.
During the second half of 2020, CLI posted a 38% growth as compared to the first half. The robust growth was driven by the easement of quarantine across VisMin sites increasing construction efficiency to 90% from 70% in the 2nd quarter. Collections on the other hand has also improved with more accounts qualifying for revenue recognition in the last two quarters. Hotel operations Launched on September 14, 2019, Citadines Cebu City posted ₱54.56 million for the period ending December 31, 2020. With hotel revenues driven from BPO companies that housed their employees during the lockdown. Leasing The Company offered rental concessions and holidays to support local businesses during lockdown decreasing its rental revenue by 13% y-o-y to ₱55.24 million from ₱63.16 million. GLA increases by 2% y-o-y to 14,536 sq.m. from 14,296 sq.m. with the completion of retail spaces in residential projects. As of December 31, 2020, rental occupancy rate is at 79%, a minor decline from 82% as of December 31, 2019. Property Management Revenue from property management fees is at ₱42.59 million, 16% y-o-y increase from ₱36.84 million mainly from continuous turn-over of completed projects during the year—Casa Mira South Phase 1 and 2, MesaVerte Residences, and Mivesa Garden Residences Phase 3. Cost and Expenses The Company’s cost of sales for the period ended December 31, 2020 is at ₱4.28 billion, from ₱4.30 billion in line with the slim decrease in revenue. Total operating expenses during the period amount to ₱1.27 billion, 11% y-o-y increase from ₱1.15 billion mainly from increase in commissions and incentives to ₱429.73 million with the implementation of PFRS 15. Salaries and employee benefits also grew by 18% to ₱352.75 million due to an increase in the Group’s manpower to 574 employees from 475 employees to support CLI’s expansions across VisMin. Despite the digitalization of the Company’s sales and marketing, other operating expenses likewise increased as the Company implemented and heightened safety and health protocols in the workplace. During the year, borrowing costs amount to ₱460.13 million with average borrowing rate of 4.96% representing the costs on bank loans and corporate notes to fund the Company’s project developments. This includes the ₱8.0 billion corporate notes issued during the year.
FY 2019 vs FY 2018 CLI posted a consolidated NIAT growth of 12%, from ₱2.17 billion to billion ₱2.44 billion. Parent NIAT likewise increases to ₱2.01 billion, solid earnings growth of 21% y-o-y as compared to the ₱1.67 billion in 2018. The favorable result is driven from the construction progress of the following ongoing projects: MesaVirre Garden Residences in Bacolod, Velmiro Uptown in CDO, 38 Park Avenue and Casa Mira South in Cebu, and MesaTierra Garden Residences in Davao.
38
For 2019, CLI registered an EPS of ₱1.21 per share, a notable 24% increase from the ₱0.98 EPS in 2018. Revenues For the period ending December 31, 2019, total consolidated revenues reached ₱8.50 billion, 26% higher than from ₱6.76 billion reported y-o-y. The growth was mainly driven by its Garden Series, a mid-market segment, representing 37% of revenue, 30% for Premier Masters, a high-end segment, and 30% for Casa Mira, an economic housing segment. In 2018, Garden series represented 45% of the total revenue, 28% from Casa Mira Series and 19% from Premier Masters. In 2019, 38 Park Avenue, a high-end segment project in Cebu, posted the highest revenue growth in 2019, followed by Casa Mira South, an economic housing project, and MesaVirre Garden Residences and Velmiro Uptown CDO, both mid-market projects. In terms of location, the CLI’s real estate revenue presence in Cebu remains to be strong representing 56% of the total revenues, followed by CDO’s revenue of 14% and Bacolod of 12%. In 2018, Cebu’s real estate revenue generated 64% of the total revenues, while Davao and CDO posted significant contributions of 12% and 11%, respectively. The Company expects to grow revenue contribution of its expansion areas such as Iloilo, Davao, Bohol and Puerto Princesa in 2020. The rental revenue grew by 10% y-o-y to ₱63.16 million from ₱57.48 million. This is attributable to the Company’s 60% increase in GLA to 14,296 sq.m. with the recent turnover of Base Line Retail (5,216 sq.m. GLA), Base Line HQ (1,721 sq.m. GLA) and Casa Mira Towers Labangon (1,124 sq.m. GLA) in Cebu. Cost and Expenses CLI reported a total cost of sales of ₱4.30 billion in 2019, a 37% y-o-y increase from the prior year of ₱3.14 billion. The increase is in line with the growth of the Company’s revenue. Total operating expenses for the year amounted to ₱1.15 billion, a 28% increase from ₱893.89 million in 2018 to support the Company’s expansion. The increase is primarily attributed to higher commissions and incentives and transfer taxes which resulted from the stronger sales performance as 13 projects were launched during the year. Salaries and employee benefits posted 40% growth due to increase manpower to support the CLI’s increase in operations. Borrowing costs, both booked as cost of real estate sale and outright expense, for the year decrease from ₱176.95 million to ₱169.53 million due to interest cost savings during 2019. Total interest cost capitalized as real estate inventory amounted to ₱802.55 million, from ₱242.24 million y-o-y, as more debt was availed in 2019 to support the Company’s planned capital expenditures including land banking initiative and project development. This includes the ₱2.0 billion corporate notes issued in 2019 and ₱5.00 billion corporate notes issued in 2018.
Review on the Company’s Financial Condition As of December 31, 2020 vs December 31, 2019 CLI’s balance sheet remained to be solid and healthy to support construction and expansion plans. As of December 31, 2020, CLI’s consolidated assets reported a 31% y-o-y growth to ₱50.09 billion from ₱38.28 billion driven by increase in contract assets and investment properties. ASSETS 13% decrease in Cash and Cash equivalents Decrease to ₱797.18 million from ₱917.17 million due to additional safety and health equipment, rapid testing and donations to aid the Company’s customers, employees and community during COVID. 5% increase in Accounts receivable (including non-current portion) Increase to ₱6.14 billion from ₱5.88 billion mainly due to reclassification of customer’s outstanding receivable on fully completed units in Mivesa Garden Residences, Latitude and Villa Casita North from contract assets to accounts receivable.
39
56% increase in Contract assets (including non-current portion) Increase to ₱13.86 billion from ₱8.89 billion mainly from installment contracts on existing and newly launched projects during the year that continue to recognize real estate sales revenue as construction progresses. 42% increase in Real estate inventory Increase to ₱13.40 billion from ₱9.45 billion driven by unsold inventory on newly projects launched during the year and ₱1.46 billion fully paid raw land reclassified from deposits on land to real estate inventory. 46% decrease in Deposits on land for future development (including non-current portion) Decrease to ₱699.77 million from ₱1.29 billion as fully paid land purchases were reclassified to raw land inventory. Additional deposits on land for the year amount to ₱868.10 million. 121% increase in Due from related parties
Transactions paid by the Parent Company on behalf of its related parties increase to ₱21.95 million
from ₱9.95 million mainly from cash advances to shareholders, entities under common ownership and associates. 33% increase in Prepayments and other current assets Increase to ₱3.02 billion from ₱2.27 billion coming from advances to suppliers and subcontractors; prepaid commissions and related input Value Added Tax on construction materials purchased. 693% increase in Associates Increase to ₱129.85 million from ₱16.38 million mainly from investment to Icom Air Corporation during the year amounting to ₱96.49 million. 81% increase in Property and equipment Increase to ₱ 643.39 million from ₱355.12 million with the construction of new offices and branches to support CLI’s expanding developments. 13% increase in Investment properties Increase to ₱10.09 billion from ₱8.90 billion attributed to ongoing construction on recurring income projects and businesses. 444% increase in Right-of-use asset and 495% increase in Lease liabilities Right-of-use asset and Lease liability increase to ₱950.90 million and ₱834.73 million, respectively, with recognition of the high-value leasehold rights acquired on the 43-year land lease for Cebu Business Park Office during the year. LIABILITIES 41% increase in Interest-bearing loans and borrowings (including non-current portion) Increase to ₱23.79 billion from ₱16.85 billion mainly from the ₱8.0 billion Corporate Notes issued during the year. 29% increase in Trade and other payables (including non-current portion) Increase to ₱7.48 billion from ₱5.78 billion representing outstanding obligations to subcontractors and suppliers of construction materials. 50% increase in Deferred Tax Liabilities Increase to ₱1.69 billion from ₱1.12 billion due to additional recognized tax liability on taxable temporary differences. EQUITY 196% increase in Treasury Shares On March 27, 2020, the Board of Directors (BOD) of the Parent Company approved an additional ₱500.0 million stock buy-back program to support CLI’s stock price and take advantage of the current
40
low valuation for the next two years. Treasury shares purchased during the period amount to ₱485.66 million. 105% increase in Revaluation reserves Increase to ₱12.88 million from ₱6.59 million due to increase in estimated loss on remeasurement of post-employment defined benefit obligation. 15% increase in Non-Controlling Interest Increase to ₱6.90 billion from ₱6.06 billion significantly from additional paid-in capital during the year to Cebu Homegrown Developers, Inc. (CHDI), Cebu BL Ramos Ventures (CBLRV), and GGTT Realty Corporation (GGTT). Key Performance Indicators The Company uses a range of financial and operational key performance indicators (“KPIs”) to help measure and manage its performance. These KPIs reflect the Company’s continuous focus on efficiency, cost control and profitability across all its operations. The management considers the following as KPIs:
2020 2019 2018
Gross Profit Margin1 48% 49% 54%
Net Income Margin2 25% 29% 32%
EBITDA3 ₱3.36 billion ₱3.42 billion ₱2.88 billion
EBITDA Margin4 40% 40% 41%
Return on Average Assets5 5% 8% 11%
Return on Average Equity (Parent)6 23% 29% 31%
Current Ratio7 2.41 2.56 3.66
Debt to Equity Ratio8 1.53 1.23 0.94
Net Debt to Equity Ratio9 1.48 1.16 0.86
Interest Coverage Ratio10 2.89 4.11 9.45
1 Gross Profit Margin is gross profit as a percentage of revenues 2 Net Income Margin is net income as a percentage of revenues 3 EBITDA is defined as earnings before interest, tax, depreciation and amortization from continuing operations and before exceptional items. 4 EBITDA margin is EBITDA as a percentage of revenues 5 Return on Average Assets is net income as a percentage of the average assets as at year-end and assets as at end of the immediately preceding year. 6 Return on Average Equity is net income as a percentage of the average of the equity as at year-end and equity as at end of the immediately preceding year. 7 Current Ratio is current assets divided by current liabilities 8 Debt to Equity Ratio is interest bearing debt over total equity 9 Net Debt to Equity Ratio is interest bearing debt less cash and cash equivalent over total equity 10 Interest Coverage ratio is EBIT divided by interest paid ITEM 7. FINANCIAL STATEMENTS
The Company’s consolidated financial statements as of and for the periods ending December 30, 2020 and 2019 are incorporated in the accompanying Index to Exhibits.
41
ITEM 8. CHANGES IN AND DISAGREEMENTS WITH ACCOUNTANTS ON ACCOUNTING AND FINANCIAL DISCLOSURE
The Company has engaged the services of Punongbayan and Araullo (P&A) Grant Thornton. There were no disagreements with the firm on any matter of accounting and financial disclosure.
PART III – CONTROL AND COMPENSATION INFORMATION
ITEM 9. DIRECTORS, EXECUTIVE OFFICERS AND KEY PERSONNEL OF THE REGISTRANT The overall management and supervision of the Company is vested in its board of directors. The Company’s officers and management team cooperate with its Board by preparing relevant information and documents concerning the Company’s business operations, financial condition, and results of operations for its review and action. At present, the Board consists of nine members, including three independent directors in accordance with the requirements of the SRC and the SEC’s New Code of Corporate Governance for Publicly Listed Companies. All of the Company’s directors were elected at the Company’s annual stockholders’ meeting held on June 3, 2020. Members of the Board of Directors
Name Age Position Citizenship
Jose R. Soberano III 65 Chairman of the Board, CEO and President Filipino
Ma. Rosario B. Soberano 62 Director, Treasurer and Executive Vice-President Filipino
Jose Franco B. Soberano 35 Director, Chief Operating Officer and Executive Vice-President
Filipino
Joanna Marie B. Soberano- Bergundthal
33 Director, Vice President for Marketing Filipino
Beauregard Grant L. Cheng 39 Director, Chief Finance Officer Filipino
Stephen A. Tan 64 Director, Assistant Treasurer Filipino
Rufino Luis Manotok 70 Independent Director Filipino
Ma. Aurora D, Geotina-Garcia 68 Independent Director Filipino
Atty. M. Jasmine S. Oporto 61 Independent Director Filipino
Jose R. Soberano III has been the Company’s Chairman, CEO and President since its incorporation. He obtained a Bachelor of Arts degree in Economics from the Ateneo De Manila University in 1976, and completed the Strategic Business Economics Program at the University of Asia and Pacific in 2000. In 2015, he completed the Advanced Management Development Program in Real Estate from the Harvard University Graduate School. He previously worked for the Ayala Group of Companies for over 23 years, including various stints in Ayala Investment, Bank of the Philippine Islands, and in Ayala Land. Inc., where he was appointed Senior Division Manager in 1997. He was Vice-President of Cebu Holdings, Inc., the pioneer Ayala Land subsidiary in Cebu City when he resigned in 2000 from Ayala. He served as President of the Rotary Club of Cebu 2011, and President of the Chamber of Real Estate Builders Association-Cebu (CREBA-Cebu) in 2010. He is currently Chairman of the Board of the Center for Technology and Enterprise, a socially-oriented instruction that offers technical training to less privileged youth. Mr. Jose R. Soberano III has more than 20 years of experience in managing and heading companies engaged in real estate development. Ma. Rosario B. Soberano has served as the Director, Treasurer and Executive Vice President of the Company since 2003. Ms. Ma. Rosario B. Soberano received a Bachelor of Science major in Accountancy degree (1979, summa cum laude) from St. Theresa’s College in Cebu, and is a Certified
42
Public Accountant. She obtained a Master’s Degree in Business Administration from the University of the Philippines – Cebu in 1983. Jose Franco B. Soberano has served as Director of the Company since 2010 and joined the Company as Chief Operating Officer and Senior Vice-President in 2010. He received a Bachelor of Science degree in Management, major in Legal Management and minor in Finance, from the Ateneo de Manila University in 2007. In 2012, he obtained a Master’s Degree in Real Estate Development from Columbia University in New York City. Prior to joining the Company, he was a project manager at Hewlett-Packard Asia Pacific (HK). Ltd. He is a founding member of the Global Shapers – Cebu Hub, an initiative of the World Economic Forum and is President of the Sacred Heart School – Ateneo de Cebu Alumni Association since 2014. Joanna Marie B. Soberano-Bergundthal has served as Director of the Company since 2010, and joined the Company as Vice President and Marketing Director in July 2016. She earned from the University of Asia and the Pacific both her Bachelor and Master of Arts in Communication, Major in Integrated Marketing Communication in 2008 and 2009 respectively. She was Top 1 of her Batch 2008. Prior to joining the Company, she was a Marketing Manager of the Global Team of Nestle based in Switzerland from June 2014 to August 2015 and was Marketing Project Manager based in Thailand from August 2015 to June 2016. In October 2013 to May 2014, she worked as a Marketing Manager of Nestle Philippines. Beauregard Grant L. Cheng is currently the Chief Finance Officer of Cebu Landmasters. Before joining CLI, he was a Senior Deal Manager with a rank of Vice-President at BDO Capital & Investment Corporation. He led his project teams in managing various complex capital market transactions and advised companies in a broad array of industries on corporate restructuring and reorganization. Previously, he was a private banker based in Singapore handling accounts for high net worth individuals and institutions. Grant is a registered CFA Charter holder and is a member of the CFA Philippines Society. He earned his Bachelor of Science in Manufacturing Engineering and Management as a Star Scholar from De La Salle University Manila and graduated Magna Cum Laude. He was awarded as one of the Top Ten Outstanding Students of the Philippines by the Philippine President. He earned his Masters of Science in Wealth Management with distinction from Singapore Management University and Swiss Finance Institute in Zurich. Stephen A. Tan is a Certified Public Accountant and a holder of Master in Business Administration, with distinction, from Kathlioke Universiteit te Leuven in Belgium and a Bachelor of Science in Management Engineering from Ateneo de Manila University. Stephen is also a Hubert H. Humphrey (Fulbright) Fellow in Agricultural Economics at the University of California, Davis. He earned his degree in Accounting from the University of San Carlos. Prior to retiring from CLI as Chief Finance Officer in May 2019, Stephen has also served as Chief Finance Officer/Treasurer at various companies engaged in real estate development, construction, food, and shipbuilding, among others. For more than 30 years, he has been a part-time MBA professor in leading universities in Cebu City. Atty. M. Jasmine S. Oporto joined the Board of Directors of Cebu Landmasters as an Independent Director in August 2018. She obtained her Bachelor of Laws (LLB) from the College of Law of the University of the Philippines, and Bachelor of Landscape Architecture from the same university. Atty. Oporto has also attended Comparative International and American Law Program of the Center for American and International Law. She is an experienced Chief Legal Officer, Chief Compliance Officer, and Corporate Secretary and has worked in said capacity with publicly listed companies like Aboitiz Equity Ventures, Inc. and Aboitiz Power Corporation. In her legal practice, Atty. Oporto has intensive experience in working with wide network of external and in-house legal counsels for labor, commercial litigation, securities law, power industry regulation, land, infrastructure capital, and general corporate law. Rufino Luis Manotok joined as one of the Company’s Independent Directors in February 2017. He finished Advanced Management Program of Harvard Business School in 1994. He earned his Master of Business Management degree from the Asian Institute of Management in 1973, and Bachelor of Arts, major in Economics by Ateneo de Manila University in 1971. He is currently an Independent Director of First Metro Investment Corporation and was the Chairman and President of Ayala Automotive Holdings Corporation from 2009 to 2012. From 2007 to 2009, he was Ayala Corporation’s Senior Managing Director, Chief Financial Officer and Chief Information Officer. He was Managing Director, heading Strategic Planning Group of Ayala Corporation from 1998 to 2006.
43
Ma. Aurora D Geotina-Garcia joined as one of the Company’s Independent Directors in February 2017. She received her Bachelor of Science in Business Administration and Accountancy degree from the University of the Philippines in 1973. She completed her Master of Business Administration from the same university in 1978. She headed SGV & Co.’s Global Corporate Finance Division from 1992 until her retirement from the partnership in 2001. She was a Senior Adviser to SGV & Co from the time of her retirement until September 2006. She has served as a consultant to businesses and the government for over 30 years in the area of corporate finance. She is presently the President of Mageo Consulting Inc. since March 2014 and CIBA Capital Philippines Inc. since December 2008. Executive Officers and Key Personnel
Name Age Position Citizenship
Jose R. Soberano III 65 President and CEO Filipino
Ma. Rosario B. Soberano 62 Treasurer and Executive Vice-President Filipino
Jose Franco B. Soberano 35 Chief Operating Officer and Executive Vice-President
Filipino
Joanna Marie Soberano-Bergundthal
33 Vice-President for Marketing Filipino
Mathias Ralf Bergundthal 39 Director of Assets for CLI Premier Hotels Swiss
Janella Mae B. Soberano 29 Corporate Communications and Customer Relations Head
Filipino
Beauregard Grant L. Cheng 39 Chief Financial Officer Filipino
Jessel M. Kabigting 51 Vice-President for Operations Filipino
Larri-Nil G. Veloso 42 Vice-President for Legal Filipino
Pedrito A. Capistrano, Jr. 57 Vice-President for Engineering Filipino
Connie N. Guieb 42 Vice-President for Accounting and Financial Comptroller
Filipino
Marie Rose C. Yulo 52 Vice-President for Sales Filipino
Sylvan John M. Monzon 45 Vice-President for Business Development
Filipino
Mark Leo Chang 42 Assistant Vice-President for Permits and Licenses, Registration and Strategic Landbanking
Filipino
Julieta R. Castanos 41 Assistant Vice-President for Business Development
Filipino
Janella Mae B. Soberano joined the Company as Corporate Communications and Customer Relations Head in January 2020. She obtained her Bachelor of Arts in Integrated Marketing Communications degree from the University of Asia and the Pacific, Manila in 2013 and completed her Master of Science in Strategic Communications at Columbia University, New York in 2020. Prior to graduate school, she worked for the Company as Marketing Manager from 2017 to 2018 and United Laboratories (UNILAB) as Brand Manager from 2013 to 2017. She is the daughter of Jose R. Soberano III and Ma. Rosario Soberano.
44
Mathias Ralf Bergundthal joined the company as Director of Assets for CLI Premier Hotels in April 2019. He obtained his Master’s degree at the Graduate Institute of International and Development studies in Geneva and completed his executive MBA in hospitality management at the Ecolière hôtel de Lausanne (EHL). Mr. Bergundthal previously held various functions at Nestle Switzerland, including Senior Public Affairs Manager from 2017 to 2019, Public Affairs Manager from 2014 to 2017, and Economist from 2009 to 2014. He is the husband of Dir. Joanna Marie B. Soberano-Bergundthal. Jessel M. Kabigting is the Vice-President for Operations of the Company. He finished Civil Engineering from the University of Santo Tomas and is the Gold Medalist in the Ateneo-Regis University MBA Program with a specialization in Marketing and Finance. Mr. Kabigting worked for 25 years in construction, real estate, and in outsourcing companies prior to joining the Company. He managed the planning, construction, procurement, and operations of various residential, office, retail, and mixed-use projects in the Philippines under Ayala Land and MDC. He also previously worked at Accenture for 6 years and served as Service Transition Executive and Solution Architect for the Philippines. During this time, he led outsourcing and sales engagements for Philippines and India and worked with clients from the USA and Europe. He used to manage day-to-day business operations for three firms before joining the Company. He is not related within the fourth civil degree either by consanguinity or affinity to any of the directors or fellow executive officers in the Company. Larri-Nil G. Veloso is the Vice-President for Legal and serves as the Company’s Assistant Corporate Secretary. An experienced practitioner in Corporate Law, he holds a Bachelor of Arts in Mass Communication from the University of the Philippines and earned his Bachelor of Laws from the University of Southern Philippines Foundation. While finishing law school, Atty. Veloso worked for print and online newspapers, occupying various positions in progression from correspondent, staff reporter, copy editor, copywriter, junior editor, group editor, to managing editor. Prior to joining the Company, he was the Corporate Legal Counsel of InfoWeapons Corporation, an American-owned software company specializing in networking appliances, and later promoted as General Manager. He is not related within the fourth civil degree either by consanguinity or affinity to any of the directors or fellow executive officers in the Company. Pedrito A. Capistrano Jr. is the Vice-President for Engineering of the Company. He is a licensed engineer in the field of Civil Engineering and Geodetic Engineering. He has been working with the Company since August 2011 when he was hired as Project Manager. His more than 34 years of experience has established for him solid foundation and credibility in the construction and allied fields. Some of the established companies he had worked for were Filinvest Land Inc., Robinsons Land Corporation, Cebu Industrial Park Developers, Inc., AboitizLand, Inc. and Aboitiz Construction Group, Inc. He finished his Bachelor of Science degree in Civil Engineering at Cebu Institute of Technology University in Cebu City and earned his Master of Science in Management Engineering from University of the Visayas also in Cebu City. He is not related within the fourth civil degree either by consanguinity or affinity to any of the directors or fellow executive officers in the Company. Connie N. Guieb is the Vice-President for Finance and Accounting. A Certified Public Accountant, she also serves as the Financial Comptroller. She has more than 15 years of accountancy and finance experience in various industries in both public and private sectors in the Philippines. She graduated cum laude with a Bachelor of Science in Accountancy degree from the University of San Carlos, and Bachelor of Laws from the University of Cebu. She is not related within the fourth civil degree either by consanguinity or affinity to any of the directors or fellow executive officers in the Company. Marie Rose C. Yulo, is the Company’s Vice-President for Sales. Prior to this, she was the Assistant Vice-President for both Sales and Marketing from March 2011 until August 2016 when the Company spun off its marketing unit as a separate department to provide focused attention to the equally challenging marketing and branding initiative of the Company. Ms. Yulo also has significant experience in the areas of travel and tours, and banking. She completed her Bachelor of Science degree in Business Administration at the University of San Carlos and earned units of Masters in Business Administration from the University of the Visayas. She is not related within the fourth civil degree either by consanguinity or affinity to any of the directors or fellow executive officers in the Company. Sylvan John M. Monzon joined the Company in August 2016. He is now Vice-President in-charge of business development for the Company’s projects in Mindanao. Prior to CLI, he held various positions in the real estate industry for more than 20 years such as Project Development Assistant Supervisor of
45
Cebu Holdings, Inc., Assistant Chief Operating Officer of Ortigas and Company Limited Partnership, and as Head of Business Development of Ortigas and Company Holdings Inc. Mr. Monzon graduated with a Bachelor of Science degree in Business Management from the University of Asia and the Pacific in Pasig City, Philippines. He also earned a Certificate in Business Economics from the same university. He is not related within the fourth civil degree either by consanguinity or affinity to any of the directors or fellow executive officers in the Company. Mark Leo M. Chang joined the Company as Senior Manager for Permits and Licenses in July 2018 and recently promoted as Assistant Vice-President for Strategic Landbanking and Permits & Licenses in February 2020. He is a graduate of Bachelor of Laws (Juris Doctor) from the University of San Carlos (USC) School of Law, Cebu City in 2009 and Bachelor in Business Management from the University of the Philippines (UP) – Cebu in 1999. In 1998, he was awarded as one of The Outstanding Student Leaders of UP Cebu by the Junior Jaycees of UP Cebu Chapter. He previously worked as Senior Manager for External Affairs of Cebu Holdings, Inc., a subsidiary of Ayala Land, Inc. from February 2015 to July 2017 (including as Consultant) and as Senior Manager for Permits with Countryside Water Services under Filinvest Development Corporation from August 2017 to June 2018. He held the position of Presidential Staff Officer V functioning as Executive Assistant and Political Officer under the Office of the Presidential Political Adviser Sec. Ronaldo M. Llamas of the Office of the President from April 2011 to December 2014. He also worked as an Intern (Researcher) at Sycip Salazar Hernandez Gatmaitan Law Office - Cebu Branch from September 2005 to March 2007. He used to be the National President of the Association of Law Students of the Philippines, a federation of law student councils in the country, for Academic Year (AY) 2008-2009 and President of USC Lex Circle (Law Student Council) for 2 terms in AY 2006-2008. Mr. Chang is one of the founders of Roco for President Youth Movement and Aksyon Kabataan, a youth arm of Aksyon Demokratiko, the political party of the late Sen. Raul S. Roco in 1998. He is not related within the fourth civil degree either by consanguinity or affinity to any of the directors or fellow executive officers in the Company. Julieta R. Castaños joined the Company as Business Unit Head for Cebu Residential Projects in March 2020. She obtained her Bachelor of Science in Accountancy from the University of San Carlos in 2000. She previously worked at Filinvest Land, Inc. for 14 years with various functions: from April 2005 to January 2009 as Branch Accountant; January 2009 to January 2012 as Branch Operations Head; from January 2012 to May 2013 and from September 2014 to April 2018 as Senior Manager for Project Development; and from April 2018 to February 2020 as Project Development Head for Visayas and North Mindanao. Prior to this, she was with Aboitizland, Inc. from 2002 to 2005 where she held positions in the Accounting Department and ultimately rising to the position of Business Development Manager in March 2013 before leaving the group in September 2014. She was also elected President of the Subdivision and Housing Developers Association, Central Visayas Chapter (SHDA-CV) from 2015 to 2017 and is currently one of the Board of Advisers of SHDA-CV. She is not related within the fourth civil degree either by consanguinity or affinity to any of the directors or fellow executive officers in the Company. ITEM 10. EXECUTIVE COMPENSATION
The following table sets out the Company’s President and CEO and the five most highly compensated senior officers:
Name Position
Jose R. Soberano III Chief Executive Officer
Ma. Rosario B. Soberano Executive Vice-President
Jose Franco B. Soberano Executive Vice-President & Chief Operating Officer
Beauregard Grant L. Cheng Chief Financial Officer
Joanna Marie B. Soberano-Bergundthal Vice-President for Marketing
The following table identifies and summarizes the aggregate compensation of the Company’s President CEO and the five most highly compensated executive officers, and all other officers and directors as a group, for the years ended December 31, 2020, 2019 and 2018.
46
Year Short-term benefits (₱ in millions)
Post-employment (₱ in millions)
2020 90,246,704 4,719,453
2019 83,006,173 4,650,089
2018 76,696,262 5,064,092
Each of the executive officers named above executed an employment contract with the Company and is entitled to receive retirement benefits in accordance with the terms and conditions of the Company’s retirement plan. No bonuses have been declared for the Board of Directors for the last two years. For the ensuing year, the amount of bonuses to be received by the members of the Board of Directors has yet to be approved by it. There is no plan or arrangement by which the executive officers will receive from the Company any form of compensation in case of a change in control of the Company or change in the officers’ responsibilities following such change in control. There are no outstanding warrants or options held by the Company’s chief executive officer, the named executive officers, and all officers and directors as a group. ITEM 11. SECURITY OWNERSHIP OF CERTAIN BENEFICIAL OWNERS AND MANAGEMENT
(a) Security Ownership of Record and Beneficial Owners of more than 5% as of December 31, 2020:
Title of Class
Name, Address of Record Ownership and Relationship with Issuer
Stockholder Name
No. of Common
Shares
Percentage (of
common shares)
Common Shares
AB Soberano Holdings Corp., 2877 v. rama avenue guadalupe cebu city
AB SOBERANO HOLDINGS CORP.
1,011,330,197 59.004%
Common Shares
PCD Nominee Corporation (Filipino) PCD NOMINEE
CORP. (FILIPINO) 675,436,329 39.407%
G/F MSE Bdlg. Ayala Ave. Makati City
(b) Security Ownership of Directors and Management (Executive Officers) as of December 31, 2020:
Directors
Name Direct Indirect Total direct &
indirect shares
% to Total Outstandin
g Shares
Jose R. Soberano 75,625,000 488,522,496 564,147,496 32.91%
Ma. Rosario B. Soberano 59,125,000 488,522,496 547,647,496 31.95%
Jose Franco B. Soberano 8,991,700 10,177,552 19,169,252 1.12%
Joanna Marie B. Soberano 7,481,700 10,177,552 17,659,252 1.03%
Beauregard Grant L. Cheng 1,000,000 - 1,000,000 0.06%
Stephen A. Tan 5,000 - 5,000 0.00%
M. Jasmine S. Oporto 4,000 - 4,000 0.00%
47
Name Direct Indirect Total direct &
indirect shares
% to Total Outstandin
g Shares
Rufino Luis T. Manotok 1 - 1 0.00%
Ma. Aurora Geotina-Garcia 1 - 1 0.00%
152,232,402 997,400,097 1,149,632,499 67.07%
Officers
Name Direct Indirect Total direct &
indirect shares
% to Total Outstandin
g Shares
Larri-Nil G. Veloso 6,000 - 6,000 0.00%
Marie Rose C. Yulo - 120,000 120,000 0.00%
Sylvan John M. Monzon 38,000 12,000 50,000 0.00%
ITEM 12. CERTAIN RELATIONSHIPS AND RELATED TRANSACTIONS
The Company and its subsidiaries (the “Group”), in their regular conduct of business, have entered into transactions with associates and other related parties principally consisting of advances and reimbursement of expenses, purchase and sale of real estate properties, construction contracts, and development, management, underwriting, marketing, leasing and administrative service agreements. Sales and purchases of goods and services to and from related parties are made on an arm’s length basis and at current market prices at the time of the transactions. However, no other transaction, without proper disclosure, was undertaken by the Group. CLI employees are also required to promptly disclose any business and family-related transactions with the Company to ensure that potential conflicts of interest are surfaced and brought to the attention of management.
PART IV – CORPORATE GOVERNANCE
ITEM 13. CORPORATE GOVERNANCE Corporate Governance The Company is committed to doing business in accordance with the highest professional standards, business conduct and ethics and all applicable laws, rules, and regulations in the Philippines. The Company, its directors, officers, and employees are dedicated to promote and adhere to the principles of good corporate governance by observing and maintaining its core business principles of accountability, integrity, fairness, and transparency. The evaluation system established by the Company to measure or determine the level of compliance with its Manual of Corporate Governance includes the roll-out of Board and Committee Assessments which were accomplished by the Board of Directors and the respective Committee members. The duly accomplished Assessment Forms were then submitted to the Compliance Officer for review and collation. A summary of the results of the board and committee assessments, including the various performance ratings and comments of the directors and committee members, were then discussed during the Company’s board meeting and copies of which were uploaded to the Company’s Diligent Boards.
48
CLI has undertaken measures to comply with the adopted leading practices on good corporate governance. The Board of Directors and management team of CLI have promoted and implemented various principles and recommendations under SEC Memorandum Circular No. 19, series of 2016 (otherwise, the Code of Corporate Governance for Publicly-Listed Companies), PSE CG Guidelines, as well as recommended practices under the ASEAN Corporate Governance Scorecard. Further thereto, the Company also rolled out and cascaded various policies and programs to its employees and personnel for proper awareness, understanding, and implementation of CLI’s good corporate governance practices. This included the roll-out of CLI’s Strategic Plan for 2021-2025, 3CLI-A in Action (CLI Core Values In Action Rollout), Ethics and Excellence Workshops, New Policies Training, as well as various refresher training on existing policies. There are no deviations from the Company’s Manual on Corporate Governance. Recognizing and understanding that good corporate governance is essential to sound strategic business management and sustainable growth and development, the Company fully commits and undertakes to improve and enhance its corporate governance, not only through its continued and consistent compliance with laws, rules, regulations, and corporate best practices, but also by improving and strengthening the Company’s internal controls, risk management, investor and other stakeholder relations, checks and balances, and policies and procedures, with the objective of rising to the level at par with the exemplary corporate governance performers and secure a corporate governance award within the next five (5) years. Independent Directors Per SEC Memorandum Circular No. 24, Series of 2019, the Company is required to have at least two independent directors in its Board of Directors, or such number as to constitute at least one-third of the members of the Board, whichever is higher. The Company’s Board of Directors is composed of nine members, six of whom are regular directors and three are independent directors. The Company’s independent directors are Mr. Rufino Luis Manotok, Ms. Ma. Aurora D. Geotina-Garcia, and Atty. M. Jasmine Oporto. Independent directors must hold no interests or relationships with the Company that may hinder their independence from the Company or its management, or which would interfere with the exercise of independent judgment in carrying out the responsibilities of a director. Under the SEC Revised Code of Corporate Governance, independent directors should always attend Board meetings. Unless otherwise provided in the by-laws, their absence shall not affect the quorum requirement. The By-Laws of the Company do not provide for such quorum requirement. However, pursuant to the Company’s Manual, to promote transparency, the Board requires the presence of at least one independent director in all its meetings. Compliance Officer
CLI has a formal compliance function in place. This is subject to regular review and evaluation as spearheaded by CLI’s Compliance Officer, the person in charge of the compliance function. CLI, through its Compliance Officer, monitors, reviews, evaluates, and ensures the compliance by CLI, its officers and directors with relevant laws, the pertinent Corporate Governance Codes, rules and regulations and all governance issuances of regulatory agencies. Moreover, the Compliance Officer shall have the following duties and responsibilities:
1. Ensure proper onboarding of new directors (i.e., orientation on the Company’s business,
charter, articles of incorporation and by-laws, among others);
2. Monitor, review, evaluate and ensure the compliance by the Company, its officers and directors with the relevant laws, this Code, rules and regulations and all governance issuances of regulatory agencies;
3. Report the matter to the Board if violations are found and recommend the imposition of appropriate disciplinary action;
4. Ensure the integrity and accuracy of all documentary submissions to regulators;
49
5. Appear before the SEC when summoned in relation to compliance with this Code;
6. Collaborate with other departments to properly address compliance issues, which may be subject to investigation;
7. Identify possible areas of compliance issues and work towards the resolution of the same;
8. Ensure the attendance of board members and key officers to relevant trainings; and
9. Perform such other duties and responsibilities as may be provided by the SEC.
During its organization meeting on 03 June 2020, the Board appointed Atty. John Edmar G. Garde as CLI’s Compliance Officer who shall be in charge of the compliance function. In keeping with SEC Memorandum Circular No. 19, series of 2016 (otherwise, the CG Code for PLCs) and pertinent issuances, Atty. Garde is not a member of the Board and is different from the Corporate Secretary. He is primarily liable to the Company and its shareholders, and not to its Chairman or President. Prior to joining CLI as Legal Counsel-Corporate Finance, Atty. Garde, 32, served as Manager/Director- Business Tax Services of SGV & Co. / Ernst & Young- Philippines. He graduated cum laude from the University of San Carlos (Bachelor of Science in Management Accounting). He also received his law degree from the University of San Carlos. He is not related within the fourth civil degree either by consanguinity or affinity to any of the directors or officers of CLI. CLI’s Compliance Officer attended various corporate governance training during FY2020.
Corporate Secretary
The CLI Board is assisted by a Corporate Secretary and an Assistant Corporate Secretary, who are both separate individuals from the Compliance Officer. The Corporate Secretary and Asst. Corporate Secretary are not members of the CLI Board. Materials for board and committee meetings are distributed by the Secretariat to the directors and respective committee members prior to the meeting date. CLI uses the Diligent Board books which allows each director and committee member to access and review the meeting materials online through a secure portal.
During the regular meeting of the CLI Board of Directors on November 24, 2020, the Board accepted the retirement of Judge Jose P. Soberano Jr., and in his stead, elected Atty. Alan C. Fontanosa as CLI’s new Corporate Secretary. Atty. Fontanosa is the partner-in-charge and Cebu Branch Head of SyCip Salazar Hernandez & Gatmaitan. His areas of practice include industrial relations and labor litigation, civil and land cases, real estate transactions, corporate services, and special projects. He is not related within the fourth civil degree either by consanguinity or affinity to any of the directors or officers of CLI.
CLI’s Assistant Corporate Secretary is Atty. Larri-Nil G. Veloso. Atty. Veloso is also CLI’s Vice-President for Legal. He is not related within the fourth civil degree either by consanguinity or affinity to any of the directors or officers of CLI.
CLI’s Corporate Secretary and Asst. Corporate Secretary both attended corporate governance training during FY2020. Chief Audit Officer The Chief Audit Officer, who is appointed by the Board, directly reports functionally to the Audit Committee and administratively to the Chief Executive Officer. He shall oversee and be responsible for the internal audit activity of the Company, including that portion that is outsourced to a third-party service provider. Resolving Stockholders’ Disputes Stockholders who have matters for discussion or concerns directly resulting to the business of the Company may initially elevate such matters or concerns to: (a) the Corporate Secretary; (b) the Investor Relations Officer; (c) Management; or (d) the Board.
50
Committees of the Board The Board of Directors has constituted certain committees to effectively manage the operations of the Company. The Company’s principal committees include the Audit Committee, Related Party Transaction Committee, Risk Oversight Committee, and the Corporate Governance Committee. A brief description of the functions and responsibilities of the key committees are set out below:
A. Audit Committee
The Audit Committee shall be composed of at least three board members, preferably with accounting and finance background, one of whom shall be an independent director and another should have related audit experience. The Chairman of this Committee should be an independent director. He should be responsible for inculcating in the minds of the Board Members the importance of management responsibilities in maintaining a sound system of internal control and the Board’s oversight responsibility.
The Audit Committee shall perform the following functions:
1) Assist the Board in the performance of its oversight responsibility for the financial reporting
process, system of internal control, internal and external audit process, and monitoring of compliance with applicable laws, rules and regulations.
2) Recommend the approval the Internal Audit Charter (“IA Charter”), which formally defines the
role of Internal Audit and the audit plan as well as oversees the implementation of the IA Charter;
3) Through the Internal Audit (“IA”) Department, monitor and evaluate the adequacy and
effectiveness of the Company’s internal control system, integrity of financial reporting, and security of physical and information assets.
4) Oversee the Internal Audit Department, and recommends the appointment and/or grounds for
approval of an internal audit head or Chief Audit Officer. The Audit Committee should also approve the terms and conditions for outsourcing internal audit services;
5) Establish and identify the reporting line of the internal auditor to enable him to properly fulfill his
duties and responsibilities. For this purpose, he should directly report to the Audit Committee;
6) Review and monitor management’s responsiveness to the internal auditor’s findings and recommendations;
7) Prior to the commencement of the audit, discuss with the external auditor the nature, scope
and expenses of the audit, and ensure the proper coordination if more than one audit firm is involved in the activity to secure proper coverage and minimize duplication of efforts;
8) Evaluate and determine the non-audit work, if any, of the external auditor, and periodically
review the non-audit fees paid to the external auditor in relation to the total fees paid to him and to the Company’s overall consultancy expenses. The committee should disallow any non-audit work that will conflict with his duties as an external auditor or may pose a threat to his independence.
9) Review and approves the interim and annual financial statements before their submission to
the Board, with particular focus on the following matters:
10) Review the disposition of the recommendations in the external auditor’s management letter;
11) Perform oversight functions over the Company’s internal and external auditors. It ensures the independence of internal and external auditors, and that both auditors are given unrestricted access to all records, properties and personnel to enable them to perform their respective audit functions, taking into consideration relevant Philippine professional and regulatory requirements;
51
12) Coordinate, monitor and facilitate compliance with laws, rules and regulations;
13) Recommend to the Board the appointment, reappointment, removal and fees of the external auditor, duly accredited by the SEC, who undertakes an independent audit of the Company, and provides an objective assurance on the manner by which the financial statements should be prepared and presented to the stockholders; and
14) Oversee the implementation of the risk management and related party strategies and policies,
including but not limited to the following:
i. Evaluate on an ongoing basis existing the relations between and among businesses and counterparties to ensure that all related parties are continuously identified, related party transactions (“RPTs”) are monitored, and subsequent changes in relationships with counter-parties (from non-related to related and vice versa) are captured.
ii. Evaluate all material RPTs to ensure that these are not undertaken on more favorable
economic terms (e.g., price, commissions, interest rates, fees, tenor, collateral requirement) to such related parties than similar transactions with nonrelated parties under similar circumstances and that no corporate or business resources of the Company are misappropriated or misapplied, and to determine any potential reputational risk issues that may arise as a result of or in connection with the transactions.
iii. Ensure that appropriate disclosure is made, and/or information is provided to regulating
and supervising authorities relating to the Company’s RPT exposures, and policies on conflicts of interest or potential conflicts of interest.
iv. Report to the Board of Directors on a regular basis, the status and aggregate exposures
to each related party, as well as the total amount of exposures to all related parties;
v. Ensure that transactions with related parties, including write-off of exposures are subject to a periodic independent review or audit process; and
vi. Oversee the implementation of the system for identifying, monitoring, measuring,
controlling, and reporting RPTs, including a periodic review of RPT policies and procedures.
B. Corporate Governance Committee
The Corporate Governance Committee shall consist of three directors, one of whom must be an independent director. Among other functions that may be delegated by the Board, the Committee shall be responsible for the following:
1) Overseeing the implementation of the corporate governance framework and periodically reviews the said framework to ensure that it remains appropriate in light of material changes to the Company’s size, complexity and business strategy, as well as its business and regulatory environments;
2) Overseeing the periodic performance evaluation of the Board and its committees as well as
executive management, and conducts an annual self-evaluation of its performance;
3) Ensuring that the results of the Board evaluation are shared, discussed, and that concrete action plans are developed and implemented to address the identified areas for improvement
4) Recommending continuing education/training programs for directors, assignment of
tasks/projects to board committees, succession plan for the board members and senior officers, and remuneration packages for corporate and individual performance;
5) Adopting corporate governance policies and ensure that these are reviewed and updated
regularly, and consistently implemented in form and substance;
52
6) Proposing and planning relevant trainings for the members of the Board;
7) Determining the nomination and election process for the Company’s directors and has the special duty of defining the general profile of board members that the Company may need and ensuring appropriate knowledge, competencies and expertise that complement the existing skills of the Board; and
8) Establishing a formal and transparent procedure to develop a policy for determining the
remuneration of directors and officers that is consistent with the Company’s culture and strategy as well as the business environment in which it operates.
9) The Corporate Government Committee is currently sitting as Nomination Committee.
Eventually, the Board shall create a Nomination Committee which shall have at least three members, one of whom shall be an independent director. The Nomination Committee shall review and evaluate the qualifications of all individuals nominated to the Board and other appointments that require Board approval, and to assess the effectiveness of the Board’s processes and procedures in the election or replacement of directors.
The nomination and election process also includes the review and evaluation of the qualifications of all persons nominated to the Board, including whether candidates: (1) possess the knowledge, skills, experience, and particularly in the case of non-executive directors, independence of mind given their responsibilities to the Board and in light of the entity’s business and risk profile; (2) have a record of integrity and good repute; (3) have sufficient time to carry out their responsibilities; and (4) have the ability to promote a smooth interaction between board members.
Only a stockholder of record entitled to notice and to vote at the regular or special meeting of the stockholders for the election of directors shall be qualified to be nominated and elected as a director of the Company.
C. Penalties for Non-compliance with the Manual on Corporate Governance
In case of violation of any of the provisions of the Manual on Corporate Governance, the following penalties shall be imposed, after due notice and hearing, on the Company’s directors, officers, and employees: 1) First Violation – reprimand; 2) Second Violation –suspension from office, the duration of which shall depend on the
gravity of the violation; and 3) Third Violation – removal from office.
The Compliance Officer shall be responsible for determining violation/s through notice and hearing and shall recommend to the Chairman of the Board the imposable penalty for such violation, for further review and approval of the Board.
PART V – EXHIBITS AND SCHEDULES
ITEM 14. EXHIBITS The schedules required by SRC Rule 68 be presented is included/shown in the related consolidated financial statements or in the notes thereto. ITEM 15. REPORTS ON SEC FORM 17-C The company has filed SEC Form 17-C last March 16 pursuant to the requirement by the Securities and Exchange Commission to appraise the public on the risks, business impact and mitigating measures the Company has implemented in light of the COVID-19 situation.
Punongbayan & Araullo 20th Floor, Tower 1 The Enterprise Center 6766 Ayala Avenue 1200 Makati City Philippines
T +63 2 8988 22 88
Certified Public Accountants Punongbayan & Araullo (P&A) is the Philippine member firm of Grant Thornton International Ltd (GTIL). Offices in Cavite, Cebu, Davao BOA/PRC Cert. of Reg. No. 0002 SEC Accreditation No. 0002-FR-5
grantthornton.com.ph
Report of Independent Auditors The Board of Directors and Stockholders Cebu Landmasters, Inc. and Subsidiaries (A Subsidiary of A B Soberano Holdings Corp.) 10th Floor, Park Centrale Tower Jose Ma. Del Mar St., B2 L3 Cebu I.T. Park, Brgy., Apas Cebu City Opinion We have audited the consolidated financial statements of Cebu Landmasters, Inc. and subsidiaries (collectively referred to herein as the Group), which comprise the consolidated statements of financial position as at December 31, 2020 and 2019, and the consolidated statements of profit or loss, consolidated statements of comprehensive income, consolidated statements of changes in equity and consolidated statements of cash flows for each of the three years in the period ended December 31, 2020, and notes to the consolidated financial statements, including a summary of significant accounting policies. In our opinion, the accompanying consolidated financial statements present fairly, in all material respects, the consolidated financial position of the Group as at December 31, 2020 and 2019, and its consolidated financial performance and its consolidated cash flows for each of the three years in the period ended December 31, 2020 in accordance with Philippine Financial Reporting Standards (PFRS). Basis for Opinion We conducted our audits in accordance with Philippine Standards on Auditing (PSA). Our responsibilities under those standards are further described in the Auditors’ Responsibilities for the Audit of the Consolidated Financial Statements section of our report. We are independent of the Group in accordance with the Code of Ethics for Professional Accountants in the Philippines (Code of Ethics) together with the ethical requirements that are relevant to our audits of the consolidated financial statements in the Philippines, and we have fulfilled our other ethical responsibilities in accordance with these requirements and the Code of Ethics. We believe that the audit evidence we have obtained is sufficient and appropriate to provide a basis for our opinion. Emphasis of Matter We draw attention to Note 34 to the consolidated financial statements, which describes management’s assessment of the continuing impact on the Group's financial condition and performance of the COVID-19 pandemic.
2288
Certified Public Accountants Punongbayan & Araullo (P&A) is the Philippine member firm of Grant Thornton International Ltd
- 2 –
Key Audit Matters Key audit matters are those matters that, in our professional judgment, were of most significance in our audit of the consolidated financial statements of the current period. These matters were addressed in the context of our audit of the consolidated financial statements as a whole, and in forming our opinion thereon, and we do not provide a separate opinion on these matters. (a) Revenue Recognition for Sale of Real Estates Description of the Matter We considered the Group’s recognition of revenue from sale of real estates a key audit matter because of the significant volume of transactions and amount of revenue from sale of real estates involved. In 2020, the Group’s revenue from sale of real estates amounted to P8.1 billion which accounts for 98% of the Group’s total revenues. It uses the percentage of completion (POC) method, which is determined using the input method, i.e., based on efforts or inputs to the satisfaction of a performance obligation, to determine the appropriate amount of contract revenues to be recognized for the reporting period. Thus, the complexity of the application of the revenue recognition standard in real estate sales contracts; and the application of significant management judgments in determining when to recognize revenue, particularly on the assessment of the probability of collecting the contract price, and in estimating the stage of project completion were also taken into consideration. An error in the application of the requirements of said standard, and of management judgment and estimate could cause a material misstatement in the consolidated financial statements. For this year’s audit, we have also considered the implications of the COVID-19 pandemic as it affects one major factor in the Company’s revenue recognition criteria which is the probability of collecting the contract price. The Group’s accounting policy on recognition of revenue from sale of real estates, and basis of significant judgment and estimates are disclosed in Notes 2 and 3 to the consolidated financial statements, respectively. In addition, the details of contract revenues, specifically the disaggregation of revenues are disclosed in Notes 17 to the consolidated financial statements. How the Matter was Addressed in the Audit To address the risk of material misstatements in revenue recognition, we have performed tests of design and operating effectiveness of internal controls, including information technology (IT) general controls, over processes relating to generation of contract revenue, and revenue recognition and measurement. In addition, we reviewed agreements, on a sampling basis, and the relevant facts and circumstances about the real estate transactions to determine compliance with a set of criteria for revenue recognition. We have also tested the reasonableness of management’s judgment in determining the probability of collection of the contract price which involves a historical analysis of customer payment pattern and behavior. To ascertain the reasonableness of the measurement of progress towards complete satisfaction of performance obligation using the input method, we have tested the progress reported for the year in reference to the actual costs incurred relative to the total budgeted project development costs. Our procedures include understanding of controls over recording of costs and direct examination of supporting documents. We have also performed physical inspection of selected projects under development to determine if the completion based on costs is consistent with the physical completion of the project. In testing the reasonableness of budgetary estimates, we have ascertained the qualification of project engineers who prepared the budgets and reviewed the actual performance of completed projects with reference to their budgeted costs.
Certified Public Accountants Punongbayan & Araullo (P&A) is the Philippine member firm of Grant Thornton International Ltd
- 3 –
(b) Existence and Valuation of Real Estate Inventories Description of the Matter Real estate inventories amount to P13.4 billion, which accounts for 49% of total current assets and 27% of total assets of the Group, as at December 31, 2020. Because of the asset’s material effect on the consolidated financial statements, we considered its valuation a key audit matter. Valuation of the Group’s real estate inventories, particularly construction-in-progress, involves determination and estimation of significant unbilled materials and project contractors’ services at the end of the reporting period. Management’s failure to consider such unbilled materials and services, and an error in estimating the same, could have a material impact on the carrying value of real estate inventories as well as POC and cost of real estate sales. The valuation of the real estate inventories is also hinged on their existence. Given that the Group’s real estate projects are located in various locations, which posed a significant challenge in conducting the necessary audit procedures because of restrictions due to the COVID-19 pandemic, and the varying stages of completion of the projects, which require significant judgement and estimation, we have also considered the existence of real estate inventories as a key audit matter. The Group’s policy on accounting for real estate inventories is disclosed in Notes 2 and 3 to the consolidated financial statements and an analysis of the assets’ components is presented in Note 7. How the Matter was Addressed in the Audit We have obtained an understanding, and performed tests of design and operating effectiveness of internal controls, including IT general controls, over processes relating to initiation and recording of purchases and allocation of cost to real estate inventories. We also performed ocular inspection of selected real estate projects on a date closest to the reporting date to confirm their existence and examined documents, such as land titles, progress reports, contractors’ accomplishment billings among others, to corroborate with other procedures as well as to ensure completeness of recorded costs. We tested the assumptions used by management in estimating the unbilled materials and services as well as the stage of completion of the projects which we used to further assess the reasonableness of the assets’ valuation. (c) Recognition of Right-of-Use Asset and Related Lease Liability Description of the Matter In 2020, the Group recognized a right-of-use asset of P818.5 million and corresponding lease liability of the same amount with a net carrying amount of P799.4 million and P706.8 million, respectively, as at December 31, 2020. This pertains to a lease contract for a period of 43 years covering a piece of land which will be the site of another real estate project of the Group. We considered the recognition of the right-of-use asset and lease liability for this lease as significant because of the amount involved, complexity of accounting for this type of lease and the significant judgements that go along with it, particularly in respect of the determination of the appropriate discount rate to be used because of the lease term. The Group’s accounting policy and judgment applied on accounting for leases are presented in Notes 2 and 3 to the consolidated financial statements, respectively, and the other related disclosures are presented in Note 12.
Certified Public Accountants Punongbayan & Araullo (P&A) is the Philippine member firm of Grant Thornton International Ltd
- 4 –
How the Matter was Addressed in the Audit To address this matter, we evaluated the reasonableness and appropriateness of the inputs and assumptions used, especially the discount rate applied in determining the lease liability. We verified the accuracy of the data used by tracing them to the original contracts and checked the mathematical accuracy of the calculations done by management to determine the amounts to be recognized. We also assessed the completeness of disclosures within the financial statements in accordance with the applicable standards. (d) Consolidation Process Description of the Matter The consolidated financial statements of the Group represent the financial statements of the Parent Company and its subsidiaries viewed as a single economic and reporting entity. We consider the Group’s consolidation process as a key audit matter because of the significant judgments made to determine whether control exists on subsidiaries where shareholdings of the Group is 50% and lower, and the complexity arising from the component entities with significant intercompany transactions that require elimination and valuation of non-controlling interests in net profit and net assets of the Group. The Group’s accounting policy and judgment applied on consolidation are presented in Notes 2 and 3 to the consolidated financial statements, respectively. How the Matter was Addressed in the Audit To address this matter, we obtained understanding of the Group’s structure and its consolidation process including the procedures for identifying intercompany transactions and reconciling intercompany balances. We tested significant consolidation adjustments which include elimination of intercompany revenues, expenses and investments, and recognition of equity transactions to measure non-controlling interest. In respect of subsidiaries where shareholdings of the Group is 50% and lower, we obtained documents supporting management’s judgment in respect of its assumed control over the entities and gained an understanding of how management is able to demonstrate control over the entities. Finally, we analyzed the operations of each of those subsidiaries to determine whether indeed, the parent company controls their operations. Other Information Management is responsible for the other information. The other information comprises the information included in the Group’s Securities and Exchange Commission (SEC) Form 20-IS (Definitive Information Statement), SEC Form 17-A and Annual Report for the year ended December 31, 2020, but does not include the consolidated financial statements and our auditors’ report thereon. The SEC Form 20-IS (Definitive Information Statement), SEC Form 17-A and Annual Report for the year ended December 31, 2020 are expected to be made available to us after the date of this auditors’ report. Our opinion on the consolidated financial statements does not cover the other information and we will not express any form of assurance conclusion thereon. In connection with our audits of the consolidated financial statements, our responsibility is to read the other information identified above when it becomes available and, in doing so, consider whether the other information is materially inconsistent with the consolidated financial statements or our knowledge obtained in the audits, or otherwise appears to be materially misstated.
Certified Public Accountants Punongbayan & Araullo (P&A) is the Philippine member firm of Grant Thornton International Ltd
- 5 –
Responsibilities of Management and Those Charged with Governance for the Consolidated Financial Statements Management is responsible for the preparation and fair presentation of the consolidated financial statements in accordance with PFRS, and for such internal control as management determines is necessary to enable the preparation of consolidated financial statements that are free from material misstatement, whether due to fraud or error. In preparing the consolidated financial statements, management is responsible for assessing the Group’s ability to continue as a going concern, disclosing, as applicable, matters related to going concern and using the going concern basis of accounting unless management either intends to liquidate the Group or to cease operations, or has no realistic alternative but to do so. Those charged with governance are responsible for overseeing the Group’s financial reporting process. Auditors’ Responsibilities for the Audit of the Consolidated Financial Statements Our objectives are to obtain reasonable assurance about whether the consolidated financial statements as a whole are free from material misstatement, whether due to fraud or error, and to issue an auditors’ report that includes our opinion. Reasonable assurance is a high level of assurance, but is not a guarantee that an audit conducted in accordance with PSA will always detect a material misstatement when it exists. Misstatements can arise from fraud or error and are considered material if, individually or in the aggregate, they could reasonably be expected to influence the economic decisions of users taken on the basis of these consolidated financial statements. As part of an audit in accordance with PSA, we exercise professional judgment and maintain professional skepticism throughout the audit. We also: • Identify and assess the risks of material misstatement of the consolidated financial
statements, whether due to fraud or error, design and perform audit procedures responsive to those risks, and obtain audit evidence that is sufficient and appropriate to provide a basis for our opinion. The risk of not detecting a material misstatement resulting from fraud is higher than for one resulting from error, as fraud may involve collusion, forgery, intentional omissions, misrepresentations, or the override of internal control.
• Obtain an understanding of internal control relevant to the audit in order to design audit procedures that are appropriate in the circumstances, but not for the purpose of expressing an opinion on the effectiveness of the Group’s internal control.
• Evaluate the appropriateness of accounting policies used and the reasonableness of accounting estimates and related disclosures made by management.
• Conclude on the appropriateness of management’s use of the going concern basis of accounting and, based on the audit evidence obtained, whether a material uncertainty exists related to events or conditions that may cast significant doubt on the Group’s ability to continue as a going concern. If we conclude that a material uncertainty exists, we are required to draw attention in our auditors’ report to the related disclosures in the consolidated financial statements or, if such disclosures are inadequate, to modify our opinion. Our conclusions are based on the audit evidence obtained up to the date of our auditors’ report. However, future events or conditions may cause the Group to cease to continue as a going concern.
• Evaluate the overall presentation, structure and content of the consolidated financial
statements, including the disclosures, and whether the consolidated financial statements represent the underlying transactions and events in a manner that achieves fair presentation.
Certified Public Accountants Punongbayan & Araullo (P&A) is the Philippine member firm of Grant Thornton International Ltd
- 6 –
• Obtain sufficient appropriate audit evidence regarding the financial information of the entities or business activities within the Group to express an opinion on the consolidated financial statements. We are responsible for the direction, supervision and performance of the group audit. We remain solely responsible for our audit opinion.
We communicate with those charged with governance regarding, among other matters, the planned scope and timing of the audit and significant audit findings, including any significant deficiencies in internal control that we identify during our audit. We also provide those charged with governance with a statement that we have complied with relevant ethical requirements regarding independence, and to communicate with them all relationships and other matters that may reasonably be thought to bear on our independence, and where applicable, related safeguards. From the matters communicated with those charged with governance, we determine those matters that were of most significance in the audit of the consolidated financial statements of the current period and are therefore the key audit matters. We describe these matters in our auditors’ report unless law or regulation precludes public disclosure about the matter or when, extremely rare circumstances, we determine that a matter should not be communicated in our report because the adverse consequences of doing so would reasonably be expected to outweigh the public interest benefits of such communication. The engagement partner on the audits resulting in this independent auditors’ report is Christopher M. Ferareza. PUNONGBAYAN & ARAULLO By: Christopher M. Ferareza Partner CPA Reg. No. 0097462 TIN 184-595-975 PTR No. 8533229, January 4, 2021, Makati City SEC Group A Accreditation Partner - No. 1185-AR-2 (until May 9, 2021) Firm - No. 0002 (until Dec. 31, 2024) BIR AN 08-002511-34-2020 (until Jun. 25, 2023) Firm’s BOA/PRC Cert. of Reg. No. 0002 (until Jul. 24, 2021)
March 24, 2021
got
(Amounts in Philippine Pesos)
Notes 2020 2019
CURRENT ASSETSCash and cash equivalents 5 797,184,790 P 917,170,651 P Receivables - net 6 6,020,754,434 5,204,137,996 Contract assets - net 17 3,642,591,056 3,799,666,118 Real estate inventories 7 13,398,181,847 9,446,952,918 Deposits on land for future development 8 699,772,860 1,289,398,997 Due from related parties 25 21,950,504 9,947,417 Prepayments and other current assets 9 3,019,869,681 2,265,504,406
Total Current Assets 27,600,305,172 22,932,778,503
NON-CURRENT ASSETSReceivables - net 6 121,204,328 671,924,942 Contract assets - net 17 10,214,059,439 5,092,843,910 Investments in associates 10 129,852,662 16,378,423 Property and equipment - net 11 643,387,606 355,120,980 Right-of-use assets 12 950,904,449 174,759,463 Investment properties - net 13 10,093,743,062 8,904,844,700 Post-employment defined benefit asset 23 - 5,923,584 Other non-current assets - net 14 337,044,725 128,867,731
Total Non-current Assets 22,490,196,271 15,350,663,733
TOTAL ASSETS 50,090,501,443 P 38,283,442,236 P
CURRENT LIABILITIESInterest-bearing loans and borrowings 15 3,434,542,160 P 2,627,759,378 P Trade and other payables 16 7,257,232,364 5,701,910,028 Contract liabilities 17 532,649,347 418,967,659 Customers' deposits 17 196,124,012 191,042,919 Lease liabilities 12 1,634,080 1,775,306 Income tax payable 31,196,933 29,726,619
Total Current Liabilities 11,453,378,896 8,971,181,909
NON-CURRENT LIABILITIESInterest-bearing loans and borrowings 15 20,359,441,551 14,218,997,199 Trade and other payables 16 226,434,433 81,616,966 Lease liabilities 12 833,099,895 138,501,152 Post-employment defined benefit obligation 23 621,184 - Deferred tax liabilities - net 24 1,690,284,026 1,124,886,722
Total Non-current Liabilities 23,109,881,089 15,564,002,039
Total Liabilities 34,563,259,985 24,535,183,948
EQUITYEquity attributable to shareholders of Parent Company 26
Capital stock 1,714,000,000 1,714,000,000 Additional paid-in capital 1,608,917,974 1,608,917,974 Treasury shares 732,851,016 )( 247,193,811 )( Revaluation reserves - net 12,883,375 )( 6,589,225 )( Retained earnings 6,054,418,178 4,623,093,445
TOTAL LIABILITIES AND EQUITY 50,090,501,443 P 38,283,442,236 P
LIABILITIES AND EQUITY
A S S E T S
See Notes to Consolidated Financial Statements.
CEBU LANDMASTERS, INC. AND SUBSIDIARIES(A Subsidiary of A B Soberano Holdings Corp.)
CONSOLIDATED STATEMENTS OF FINANCIAL POSITIONDECEMBER 31, 2020 AND 2019
CEBU LANDMASTERS, INC. AND SUBSIDIARIES(A Subsidiary of A B Soberano Holdings Corp.)
CONSOLIDATED STATEMENTS OF PROFIT OR LOSSFOR THE YEARS ENDED DECEMBER 31, 2020, 2019 AND 2018
(Amounts in Philippine Pesos)
Notes 2020 2019 2018
REVENUES 17Sale of real estates 8,146,432,329 P 8,390,526,495 P 6,692,537,760 P Rental 55,237,972 63,159,194 57,480,871 Hotel operations 54,558,131 8,524,756 - Management fees 42,591,886 36,837,490 12,920,716
8,298,820,318 8,499,047,935 6,762,939,347
COST OF SALES AND SERVICES 18 4,282,111,458 )( 4,300,684,977 )( 3,136,059,915 )(
NET PROFIT 2,075,727,321 P 2,437,937,509 P 2,168,925,313 P
Net profit attributable to:Parent Company's shareholders 27 1,846,119,733 P 2,012,289,616 P 1,667,369,943 P Non-controlling interests 229,607,588 425,647,893 501,555,370
2,075,727,321 P 2,437,937,509 P 2,168,925,313 P
Earnings per Share:Basic and diluted 27 1.15 P 1.21 P 0.98 P
See Notes to Consolidated Financial Statements.
2020 2019 2018
NET PROFIT 2,075,727,321 P 2,437,937,509 P 2,168,925,313 P
OTHER COMPREHENSIVE INCOME (LOSS) - Net of TaxItem that will not be reclassified
subsequently to profit or lossGain (loss) on remeasurements of
post-employment defined benefit plan 23 8,991,642 )( 8,341,738 2,562,785 )( Tax income (expense) 24 2,697,492 2,502,521 )( 768,836
6,294,150 )( 5,839,217 1,793,949 )(
TOTAL COMPREHENSIVE INCOME 2,069,433,171 P 2,443,776,726 P 2,167,131,364 P
Total comprehensive income attributable to:Parent Company's shareholders 1,839,825,583 P 2,018,128,833 P 1,665,575,994 P Non-controlling interests 229,607,588 425,647,893 501,555,370
2,069,433,171 P 2,443,776,726 P 2,167,131,364 P
See Notes to Consolidated Financial Statements.
CEBU LANDMASTERS, INC. AND SUBSIDIARIES(A Subsidiary of A B Soberano Holdings Corp.)
CONSOLIDATED STATEMENTS OF COMPREHENSIVE INCOMEFOR THE YEARS ENDED DECEMBER 31, 2020, 2019 AND 2018
(Amounts in Philippine Pesos)
(A Subsidiary of A B Soberano Holdings Corp.)CONSOLIDATED STATEMENTS OF CHANGES IN EQUITY
FOR THE YEARS ENDED DECEMBER 31, 2020, 2019 AND 2018(Amounts in Philippine Pesos)
Capital Additional Treasury Revaluation Non-controlling Stock Paid-in Capital Stock Reserves Interests
(See Note 26) (See Note 26) (See Note 26) (See Note 26) Appropriated Unappropriated Total Total (See Note 26) Total
Balance at January 1, 2020 1,714,000,000 P 1,608,917,974 P 247,193,811 )( P 6,589,225 )( P 3,050,000,000 P 1,573,093,445 P 4,623,093,445 P 7,692,228,383 P 6,056,029,905 P 13,748,258,288 P
Appropriation of retained earningsAppropriations during the year - - - - 3,300,000,000 3,300,000,000 )( - - - - Reversal during the year - - - - 2,400,495,377 )( 2,400,495,377 - - - -
- - - - 899,504,623 899,504,623 )( - - - -
Total comprehensive income for the yearNet profit for the year - - - - - 1,846,119,733 1,846,119,733 1,846,119,733 229,607,588 2,075,727,321 Other comprehensive loss - - - 6,294,150 )( - - - 6,294,150 )( - 6,294,150 )(
Balance at December 31, 2020 1,714,000,000 P 1,608,917,974 P 732,851,016 )( P 12,883,375 )( P 3,949,504,623 P 2,104,913,555 P 6,054,418,178 P 8,631,601,761 P 6,895,639,697 P 15,527,241,458 P
Balance at January 1, 2019 1,714,000,000 P 1,608,917,974 P 212,459,418 )( P 12,428,442 )( P - 2,943,393,829 P 2,943,393,829 P 6,041,423,943 P 5,280,557,011 P 11,321,980,954 P
Appropriation of retained earnings during the year - - - - 3,050,000,000 3,050,000,000 )( - - - -
Total comprehensive income for the yearNet profit for the year - - - - - 2,012,289,616 2,012,289,616 2,012,289,616 425,647,893 2,437,937,509 Other comprehensive gain - - - 5,839,217 - - - 5,839,217 - 5,839,217
Balance at December 31, 2019 1,714,000,000 P 1,608,917,974 P 247,193,811 )( P 6,589,225 )( P 3,050,000,000 P 1,573,093,445 P 4,623,093,445 P 7,692,228,383 P 6,056,029,905 P 13,748,258,288 P
Balance at January 1, 2018 1,714,000,000 P 1,608,917,974 P - 4,319,093 )( P - 1,526,583,486 P 1,526,583,486 P 4,845,182,367 P 593,558,141 P 5,438,740,508 P
Total comprehensive income for the yearNet profit for the year - - - - - 1,667,369,943 1,667,369,943 1,667,369,943 501,555,370 2,168,925,313 Derecognition of revaluation reserve due to
sale of financial asset at fair value throughother comprehensive income - - - 6,315,400 )( - 6,315,400 6,315,400 - - -
Balance at December 31, 2018 1,714,000,000 P 1,608,917,974 P 212,459,418 )( P 12,428,442 )( P - 2,943,393,829 P 2,943,393,829 P 6,041,423,943 P 5,280,557,011 P 11,321,980,954 P
See Notes to Consolidated Financial Statements.
Retained Earnings(See Note 26)
Attributable to Shareholders of Parent Company
CEBU LANDMASTERS, INC. AND SUBSIDIARIES
P
P
P
P
P
P
CEBU LANDMASTERS, INC. AND SUBSIDIARIES(A Subsidiary of A B Soberano Holdings Corp.)
CONSOLIDATED STATEMENTS OF CASH FLOWSFOR THE YEARS ENDED DECEMBER 31, 2020, 2019 AND 2018
(Amounts in Philippine Pesos)
Notes 2020 2019 2018
CASH FLOWS FROM OPERATING ACTIVITIESProfit before tax 2,791,580,908 P 3,181,493,724 P 2,607,534,387 P Adjustments for:
Depreciation and amortization 19 104,119,622 60,763,991 52,474,358 Interest expense on lease liabilities 21 57,127,820 10,847,248 - Interest income on bank deposits 22 8,701,101 )( 24,599,602 )( 18,861,865 )( Interest expense on interest-bearing loans 21 8,677,442 33,629,596 88,467,056 Share in net loss of associates 10 615,777 326,580 437,147 Recognition (reversal) of impairment loss on financial assets 6 252,478 69,492,639 )( 44,779,695
Operating profit before working capital changes 2,953,672,946 3,192,968,898 2,774,830,778 Decrease (increase) in receivables 266,148,302 )( 1,767,475,002 )( 497,817,254 Increase in contract assets 4,964,140,467 )( 3,450,384,035 )( 5,495,689,229 )( Increase in real estate inventories 563,703,631 )( 2,270,211,968 )( 2,072,705,365 )( Increase in deposits on land for future development 868,104,916 )( 679,394,084 )( 806,218,927 )( Increase in prepayments and other current assets 747,606,864 )( 1,401,362,497 )( 349,856,907 )( Increase (decrease) in other non-current assets 206,460,224 )( 32,255,180 )( 161,340,668 Increase in trade and other payables 993,330,034 3,380,558,499 362,028,572 Increase (decrease) in contract liabilities 113,681,688 38,959,953 )( 457,927,612 Increase (decrease) in customers' deposits 5,081,093 148,268,543 323,668,472 )( Decrease in post-employment defined benefit obligation 2,446,874 )( 3,549,540 )( 7,958,605 )(
Cash used in operations 3,552,845,517 )( 2,921,796,319 )( 4,802,152,621 )( Cash paid for taxes 151,023,857 )( 146,210,751 )( 78,391,701 )(
Net Cash Used in Operating Activities 3,703,869,374 )( 3,068,007,070 )( 4,880,544,322 )(
CASH FLOWS FROM INVESTING ACTIVITIESAcquisitions of investment properties 13 1,421,274,390 )( 2,180,931,208 )( 353,636,773 )( Acquisitions of property and equipment 11 235,693,169 )( 80,638,923 )( 183,934,845 )( Investments in associates 10 114,090,016 )( 5,500,000 )( - Advances to related parties 25 12,003,087 )( - 3,324,163 )( Acquisitions of computer software 14 8,960,023 )( 33,955,601 )( 1,620,697 )( Interest received 8,701,101 24,599,602 18,861,865 Collections of advances to related parties 25 - 11,206,772 11,925 Proceeds from transfer of financial assets at FVOCI - - 55,633,275
Net Cash Used in Investing Activities 1,783,319,584 )( 2,265,219,358 )( 468,009,413 )(
CASH FLOWS FROM FINANCING ACTIVITIESProceeds from availment of interest-bearing loans 15 12,583,999,063 10,453,706,073 7,303,922,875 Repayments of interest-bearing loans 15 5,672,248,772 )( 4,265,207,842 )( 1,766,308,093 )( Interest paid on interest-bearing loans 1,091,629,524 )( 819,196,691 )( 304,926,564 )( Additional investment from non-controlling shareholders 26 647,502,204 369,825,001 74,350,000 Acquisition of treasury stock 26 485,657,205 )( 34,734,393 )( 212,459,418 )( Cash dividends paid 26 452,295,000 )( 352,590,000 )( 256,875,000 )( Repayments of lease liabilities 12 105,339,849 )( 39,719,752 )( - Interest paid on lease liabilities 12 57,127,820 )( 10,847,248 )( -
Net Cash From Financing Activities 5,367,203,097 5,301,235,148 4,837,703,800
NET DECREASE IN CASH AND CASH EQUIVALENTS 119,985,861 )( 31,991,280 )( 510,849,935 )(
CASH AND CASH EQUIVALENTSAT BEGINNING OF YEAR 917,170,651 949,161,931 1,460,011,866
CASH AND CASH EQUIVALENTS AT END OF YEAR 797,184,790 P 917,170,651 P 949,161,931 P
Supplemental Information for Non-cash Operating, Investing and Financing Activities:
1) The Group recognized right-of-use assets and lease liabilities amounting to P818.5 million and P180.0 million in 2020 and 2019, respectively (see Notes 12 and 33).
2) In 2020, the Group reclassified assets from Investment Properties totaling P997.6 million and P86.1 million to Real Estate Inventories and Property and Equipment, respectively (see Notes 7, 11 and 13). In 2019, investment properties of P452.0 million were reclassified to Real Estate Inventories (see Notes 7 and 13).
3) In 2020, Deposits on Land for Future Development of P1.5 billion were reclassified to Real Estate Inventories, while in 2019, P4.6 billion and P1.1 billion were reclassified to Real Estate Inventories and Investment Properties, respectively (see Notes 7, 8 and 13).
4) In 2020 and 2019, the Group recognized unpaid construction costs of P666.7 million and P331.2 million, respectively, in Investment Properties (see Note 13).
5) In 2020 and 2019, borrowing costs that were capitalized as part of Real Estate Inventories and Investment Properties totalled to P1.1 billion and P820.5 million, respectively (see Notes 7, 13 and 15).
See Notes to Consolidated Financial Statements.
CEBU LANDMASTERS, INC. AND SUBSIDIARIES (A Subsidiary of A B Soberano Holdings Corp.)
NOTES TO CONSOLIDATED FINANCIAL STATEMENTS DECEMBER 31, 2020, 2019 AND 2018
(Amounts in Philippine Pesos)
1. CORPORATE INFORMATION 1.1 General Cebu Landmasters, Inc. (the Parent Company or CLI) was incorporated in the Philippines and registered with the Securities and Exchange Commission (SEC) on September 26, 2003. CLI is presently engaged in real estate-related activities which include real estate development, sales, leasing and property management. Its real estate portfolios include residential condominium units, subdivision house and lots, and townhouses as well as office projects, retail spaces and hotels. In 2016, A B Soberano Holdings Corp. (ABS), formerly A B Soberano International Corporation, one of CLI’s stockholders, assumed control of CLI by acquiring additional 400,000,000 shares of CLI and became the parent company of CLI. On January 6, 2017, the Board of Directors (BOD) approved CLI’s application for the registration of 1,714,000,000 of its common shares with the SEC and application for the listing thereof in the Philippine Stock Exchange (PSE). The BOD’s approval also covered the planned initial public offering (IPO) of 430,000,000 unissued common shares of CLI. CLI’s shares were listed in the PSE on June 2, 2017 (see also Note 26). ABS is a holding company, which is incorporated and domiciled in the Philippines. The registered office and principal place of business of ABS is located at 2nd Street Villa San Lorenzo, Quijada Street, Barangay Guadalupe, Cebu City. The registered office address of CLI, which is also its principal place of business, is located at 10th Floor, Park Centrale Tower, Jose Ma. Del Mar St., B2 L3, Cebu I.T. Park, Brgy. Apas, Cebu City, Philippines. 1.2 Subsidiaries and Associates CLI holds ownership interests in the following subsidiaries and associates: Effective Percentage of Ownership Entity Note 2020 2019 Subsidiaries CLI Premier Hotels Int’l. Inc. (CPH) (a) 100 100 Cebu Landmasters Property Management, Inc. (CPM) (b) 100 100 A.S. Fortuna Property Ventures, Inc. (ASF) (c) 100 100 BL CBP Ventures, Inc. (BL Ventures) (d) 50 50 Yuson Excellence Soberano, Inc. (YES) (e) 50 50 Yuson Huang Excellence Soberano, Inc. (YHES) (f) 50 50 YHEST Realty and Development Corporation (YHEST) (g) 50 50 Forward
- 2 -
Effective Percentage of Ownership Entity Note 2020 2019 Subsidiaries CCLI Premier Hotels, Inc. (CCLI) (h) 50 50 Cebu Homegrown Developers, Inc. (CHDI) (i) 50 50 YHES Premier Hotels Inc. (YHESPH) (j) 50 50 Cebu BL-Ramos Ventures Inc. (CBLRV) (k) 50 - Mivesa Garden Residences, Inc. (MGR) (l) 45 45 El Camino Developers Cebu, Inc. (El Camino) (m) 35 35 Associates ICOM Air Corporation (ICOM) (n) 33 - Magspeak Nature Park, Inc. (Magspeak) (o) 25 25 Ming-mori Development Corporation (MDC) (p) 20 20 CLI and its subsidiaries (collectively referred as “the Group”), and associates are all incorporated in the Philippines. The subsidiaries and associates, except CPM, CPH, CCLI and YHESPH, are in the same line of business with CLI. A brief description of these entities follows: (a) CPH was incorporated in 2016 as a wholly owned subsidiary of the CLI. CPH is
engaged in the real estate and hotel management business which started commercial operations on September 14, 2019. The principal place of business of CPH is located in Cebu City.
(b) CPM was incorporated in 2017 as a wholly owned subsidiary of the CLI. CPM is engaged in the management of condominium corporations and housing associations affiliated with CLI. CPM has started commercial operations on September 1, 2017. The principal place of business of CPH is located in Cebu City.
(c) ASF was incorporated in 2017 as a joint venture where CLI initially held 40% ownership interest. CLI acquired all the ownership interest of its business partners at the end of 2017 which made ASF its wholly owned subsidiary. The principal place of business of ASF is located in Cebu City.
(d) BL Ventures was formed by CLI and Borromeo Bros. Estate, Inc. (BBEI) to construct and operate Latitude Corporate Center. The principal place of business of BL Ventures is located at Cebu City.
(e) YES was formed by CLI and Yuson Comm. Investments, Inc. to construct and operate Messatiera Garden Residences in Davao. The principal place of business of YES is located in Davao City.
(f) YHES was incorporated in 2017 as an undertaking among CLI, Yuson Strategic
Holdings, Inc., and Davao Filandia Realty Corp. for the development of mixed-used real estate project, the Paragon Davao. The principal place of business of YHES is located in Davao City.
(g) YHEST was incorporated in 2018 as an undertaking among CLI and five corporations for the development of a central business district located at Matina, Davao. The principal place of business of YHEST is located in Davao City.
- 3 -
(h) CCLI was incorporated in 2018 as an undertaking between CLI and Capitaine, Inc.
for the development of Citadines hotel in Bacolod City. The principal place of business of CCLI is located in Bacolod City. As at December 31, 2019, CCLI has yet to start commercial operations.
(i) CHDI is an undertaking between CLI and Aboitiz Land, Inc. that will engage in the
development of a high-rise mixed-use condominium complex in Mandaue City, Cebu. CHDI was incorporated on December 5, 2019 and its principal place of business is located in Cebu City.
(j) YHESPH was incorporated on October 28, 2019 as a wholly owned subsidiary of YHES that will engage in hotel business. Its ultimate parent is CLI which owns 50% of YHES. As at December 31, 2020, YHESPH has yet to start commercial operations.
(k) CBLRV, a new subsidiary in 2020, was incorporated on February 21, 2020 as an
undertaking between CLI and BBEI and is engaged in the development of a mixed-use condominium tower in Cebu City. Its principal place of business also is located in Cebu City.
(l) MGR was incorporated in 2017 as an undertaking by CLI and three corporations
for the construction of buildings 6 and 7 of the Mivesa Garden Residences condominium. The principal place of business of MGR is located in Cebu City.
(m) El Camino was incorporated in 2016 as an undertaking between CLI and four other corporations for the development of 38 Park Avenue condominium project in Cebu City. The principal place of business of El Camino is located in Cebu City.
(n) ICOM, a new associate in 2020, was incorporated on December 7, 2020 as an
undertaking of CLI and various individual stockholders and corporations to import aircraft(s) and to operate a transportation business in the Philippines. ICOM’s principal place of business is located in Iloilo City.
(o) Magspeak was incorporated in 2011 as an undertaking among CLI and four other
corporations for the development of a mountain resort to be located in Balamban, Cebu. The principal place of business of Magspeak is located in Cebu City.
(p) MDC was incorporated in 2013 as an undertaking between CLI and four other entities for the development of an economic business district. The principal place of business of MDC is located in Cebu City.
On June 16, 2020, CLI acquired 50% ownership in GGTT Realty Corporation (GGTT) to obtain a controlling interest in the company. However, the transaction is accounted for by the Group as an asset acquisition since the transaction does not constitute an acquisition of a business (see Notes 2.4, 3 and 7). GGTT, which, like CLI and other subsidiaries, is also engaged in real estate business, was incorporated on March 26, 2003 with principal place of business located in Iloilo City.
- 4 -
1.3 Approval of Issuance of Consolidated Financial Statements The consolidated financial statements of the Group as at and for the year ended December 31, 2020 (including the comparative consolidated financial statements for the years ended December 31, 2019 and 2018, were authorized for issue by the BOD on March 24, 2021.
2. SUMMARY OF SIGNIFICANT ACCOUNTING POLICIES
The significant accounting policies that have been used in the preparation of these consolidated financial statements are summarized below. These policies have been consistently applied to all the years presented, unless otherwise stated. 2.1 Basis of Preparation of Consolidated Financial Statements (a) Statement of Compliance with Philippine Financial Reporting Standards
The consolidated financial statements of the Group have been prepared in accordance with Philippine Financial Reporting Standards (PFRS), which include the availment of the financial reporting reliefs issued and approved by the SEC, as discussed in Note 2.2 (d). PFRS are adopted by the Financial Reporting Standards Council (FRSC) from the pronouncements issued by the International Accounting Standards Board, and approved by the Philippine Board of Accountancy (BOA). The consolidated financial statements have been prepared using the measurement bases specified by PFRS for each type of asset, liability, income and expense. The measurement bases are more fully described in the accounting policies that follow.
(b) Presentation of Consolidated Financial Statements The consolidated financial statements are presented in accordance with Philippine Accounting Standard (PAS) 1, Presentation of Financial Statements. The Group presents consolidated statement of comprehensive income separate from the consolidated statement of profit or loss. The Group presents a third consolidated statement of financial position as at the beginning of the preceding period when it applies an accounting policy retrospectively, or makes a retrospective restatement or reclassification of items that has a material effect on the information in the consolidated statement of financial position at the beginning of the preceding period.
(c) Functional and Presentation Currency These consolidated financial statements are presented in Philippine pesos, the Group’s functional and presentation currency, and all values represent absolute amounts except when otherwise indicated.
Items included in the consolidated financial statements of the Group are measured using its functional currency. Functional currency is the currency of the primary economic environment in which the Group operates.
- 5 -
2.2 Adoption of New and Amended PFRS (a) Effective in 2020 that are Relevant to the Group
The Group adopted for the first time the following PFRS, amendments, interpretations and annual improvements to PFRS, which are mandatorily effective for annual periods beginning on or after January 1, 2020:
Conceptual Framework : Revised Conceptual Framework for Financial Reporting
PAS 1 and PAS 8 (Amendments) : Presentation of Financial Statements and Accounting Policies, Changes in Accounting Estimates and Errors – Definition of Material PFRS 3 (Amendments) : Business Combinations – Definition of a Business PFRS 7 and PFRS 9 (Amendments) : Financial Instruments: Disclosures and Financial Instruments – Interest Rate Benchmark Reform Operation
Discussed below are the relevant information about these new standard, amendments, interpretations and annual improvements. (i) Revised Conceptual Framework for Financial Reporting. The revised conceptual
framework will be used in standard-setting decisions with immediate effect. Key changes include (a) increasing the prominence of stewardship in the objective of financial reporting, (b) reinstating prudence as a component of neutrality, (c) defining a reporting entity, which may be a legal entity, or a portion of an entity, (d) revising the definitions of an asset and a liability, (e) removing the probability threshold for recognition and adding guidance on derecognition, (f) adding guidance on different measurement basis, and, (g) stating that profit or loss is the primary performance indicator and that, in principle, income and expenses in other comprehensive income should be recycled where this enhances the relevance or faithful representation of the financial statements. The application of the revised conceptual framework had no significant impact on the Group’s financial statements as these amendments merely clarify existing requirements.
(ii) PAS 1 (Amendments), Presentation of Financial Statements, and PAS 8 (Amendments), Accounting Policies, Changes in Accounting Estimates and Errors – Definition of Material (effective from January 1, 2020). The amendments provide a clearer definition of ‘material’ in PAS 1 by including the concept of ‘obscuring’ material information with immaterial information as part of the new definition, and clarifying the assessment threshold (i.e., misstatement of information is material if it could reasonably be expected to influence decisions made by primary users, which consider the characteristic of those users as well as the entity’s own circumstances).
- 6 -
The definition of material in PAS 8 has been accordingly replaced by reference to the new definition in PAS 1. In addition, amendment has also been made in other standards that contain definition of material or refer to the term ‘material’ to ensure consistency. The application of these amendments had no significant impact on the Group’s financial statements as these amendments merely expanded the definition of ‘material’ in existing standards.
(iii) PFRS 3 (Amendments), Business Combinations – Definition of a Business. The amended definition of a business requires an acquisition to include an input and a substantive process that together significantly contribute to the ability to create outputs. The definition of the term ‘outputs’ is amended to focus on goods and services provided to customers, generating investment income and other income, and it excludes returns in the form of lower costs and other economic benefits. Also, the amendments will likely result in more acquisitions being accounted for as asset acquisitions. The application of these amendments had no significant impact on the Group’s financial statements because there are no business combinations during the year.
(iv) PFRS 7 (Amendments), Financial Instruments: Disclosures, and PFRS 9
(Amendments), Financial Instruments – Interest Rate Benchmark Reform. The amendments clarify that an entity would continue to apply certain hedge accounting requirements assuming that the interest rate benchmark on which the hedged cash flows and cash flows from the hedging instrument are based will not be altered as a result of interest rate benchmark reform. The application of these amendments had no significant impact on the Group’s financial statements because there are no hedging transactions during the year.
(v) PFRS 16 (Amendments), Leases – COVID-19-Related Rent Concessions. The amendments permit lessees, as a practical expedient, not to assess whether particular rent concessions occurring as a direct consequence of the COVID-19 pandemic are lease modifications and instead to account for those rent concessions as if they are not lease modifications. The application of these amendments had no significant impact on the Group’s financial statements because there are no rent concessions received during the year.
(b) Effective Subsequent to 2020 but not Adopted Early
There are amendments to existing standards effective for annual periods subsequent to 2020, which are adopted by the FRSC. Management will adopt the following relevant pronouncements in accordance with their transitional provisions; and, unless otherwise stated, none of these are expected to have significant impact on the Group’s consolidated financial statements:
(i) PFRS 3 (Amendments), Business Combination – Reference to the Conceptual
Framework (effective from January 1, 2022). The amendments update an outdated reference to the Conceptual Framework in PFRS 3 without significantly changing the requirements in the standard.
- 7 -
(ii) PAS 16 (Amendments), Property, Plant and Equipment – Proceeds Before Intended
Use (effective from January 1, 2022). The amendments prohibit deducting from the cost of an item of property, plant and equipment any proceeds from selling items produced while bringing that asset to the location and condition necessary for it to be capable of operating in the manner intended by management. Instead, an entity recognizes the proceeds from selling such items, and the cost of producing those items, in profit or loss.
(iii) PAS 37 (Amendments), Provisions, Contingent Liabilities and Contingent Assets –
Onerous Contracts – Cost of Fulfilling a Contract (effective January 1, 2022). The amendments specify that the ‘cost of fulfilling’ a contract comprises the ‘costs that relate directly to the contract.’ Costs that relate directly to a contract can either be incremental costs of fulfilling that contract such as direct labor and materials, or an allocation of other costs that relate directly to fulfilling contracts such as the allocation of the depreciation charge for an item of property, plant and equipment used in fulfilling the contract.
(iv) Annual Improvements to PFRS 2018-2020 Cycle. Among the improvements, the following amendments, which are effective from January 1, 2022, are relevant to the Group:
PFRS 9 (Amendments), Financial Instruments – Fees in the ’10 per cent’ Test for Derecognition of Liabilities. The improvements clarify the fees that a company includes when assessing whether the terms of a new or modified financial liability are substantially different from the terms of the original financial liability.
Illustrative Examples Accompanying PFRS 16, Leases – Lease Incentives. The improvement merely removes potential for confusion regarding lease incentives.
(v) PAS 1 (Amendments), Presentation of Financial Statements – Classification of
Liabilities as Current or Non-current (effective January 1, 2023). The amendments aim to promote consistency in applying the requirements by helping companies determine whether, in the statement of financial position, debt and other liabilities with an uncertain settlement date should be classified as current (due or potentially due to be settled within one year) or non-current.
(vi) PFRS 10 (Amendments), Consolidated Financial Statements, and PAS 28
(Amendments), Investments in Associates and Joint Ventures – Sale or Contribution of Assets Between an Investor and its Associates or Joint Venture (effective date deferred indefinitely). The amendments to PFRS 10 require full recognition in the investor’s financial statements of gains or losses arising on the sale or contribution of assets that constitute a business as defined in PFRS 3 between an investor and its associate or joint venture. Accordingly, the partial recognition of gains or losses (i.e., to the extent of the unrelated investor’s interests in an associate or joint venture) only applies to those sale of contribution of assets that do not constitute a business. Corresponding amendments have been made to PAS 28 to reflect these changes. In addition, PAS 28 has been amended to clarify that when determining whether assets that are sold or contributed constitute a business, an entity shall consider whether the sale or contribution of those assets is part of multiple arrangements that should be accounted for as a single transaction.
- 8 -
(c) SEC Financial Reporting Reliefs Availed by the Group
The Group has availed of several financial reporting reliefs granted by the SEC under Memorandum Circular (MC) No. 14-2018, Philippine Interpretation Committee Question and Answer (PIC Q&A) No. 2018-12 Implementation Issues Affecting Real Estate Industry, MC No. 3-2019, PIC Q&A Nos. 2018-12-H and 2018-14, and MC No. 4-2020, Deferment of the Implementation of IFRS Interpretations Committee (IFRIC) Agenda Decision on Over Time Transfer of Constructed Goods (PAS 23, Borrowing Costs) for Real Estate Industry, relating to several implementation issues of PFRS 15, Revenue from Contracts with Customers, affecting the real estate industry. These MCs deferred the implementation of the relevant accounting pronouncements until December 31, 2020. In December 2020, the SEC issued MC No. 34-2020, Deferral of PIC Q&A No. 2018-12 and IFRIC Agenda Decision on Over Time Transfer of Constructed Goods (PAS 23) for Real Estate Industry, providing another relief by further deferral of the implementation until December 2023 of certain provisions of certain standards which are covered by MC No. 14-2018 and MC No. 4-2020. Said relief is primarily due to the effect of the COVID-19 pandemic on the real estate industry, which requested such additional period of deferral. Discussed below are the financial reporting reliefs availed of by the Group, including the descriptions of the implementation issues and their qualitative impacts to the financial statements. The Group has previously availed of the relief provided by MC No. 14-2018 and MC No. 4-2020 and has opted to apply the provisions of MC No. 34-2020 beginning January 1, 2021 until the end of the deferment period as provided under the MC.
Relief Description and Implication Deferral period
IFRIC Decision on Over Time Transfer of Constructed Goods (PAS 23) for Real Estate Industry
The IFRIC concluded that any inventory (work-in-progress) for unsold units under construction that the entity recognizes is not a qualifying asset, as the asset is ready for its intended sale in its current condition (i.e., the developer intends to sell the partially constructed units as soon as it finds suitable customers and, on signing a contract with a customer, will transfer control of any work-in-progress relating to that unit to the customer). Accordingly, no borrowing costs can be capitalized on such unsold real estate inventories.
Had the Group elected not to defer the IFRIC Agenda Decision, it would have the following impact in the financial statements: • interest expense would have been
higher; • cost of real estate inventories would
have been lower; • total comprehensive income would
have been lower;
Originally until December 31, 2020 under MC 4-2020; further deferred until December 31, 2023 under MC 34-2020, which as indicated above will be applied by the Group beginning January 1, 2021
- 9 -
Relief Description and Implication Deferral period
• retained earnings would have been lower; and,
• the carrying amount of real estate inventories would have been lower.
PIC Q&A No. 2018-12-D, Concept of the significant financing component in the contract to sell
PFRS 15 requires that in determining the transaction price, an entity shall adjust the promised amount of consideration for the effects of the time value of money if the timing of payments agreed to by the parties to the contract (either explicitly or implicitly) provides the customer or the entity with a significant benefit of financing the transfer of goods or services to the customer. In those circumstances, the contract contains a significant financing component. Had the Group elected not to defer this provision of the standard, there would have been a significant financing component when there is a difference between the percentage of completion (POC) of the real estate project and the right to the consideration based on the payment schedule stated in the contract. The Group would have recognized an interest income when the POC of the real estate project is greater than the right to the consideration and interest expense when lesser. Both interest income and expense will be calculated using the effective interest rate method. This will have a retrospective effect the retained earnings, real estate sales, and profit or loss in 2020, 2019 and 2018.
Originally until December 31, 2020 under MC 14-2018; further deferred until December 31, 2023 under MC No. 34-2020, which as indicated above will be applied by the Group beginning January 1, 2021
PIC Q&A No. 2018-12-E, Treatment of land and uninstalled materials in the determination of POC
Uninstalled materials delivered on-site such as steels and rebars, elevators and escalators, which are yet to be installed or attached to the main structure are excluded in the assessment of progress. Land on which the real estate development will be constructed shall also be excluded in the assessment of POC.
Exclusion of land in the determination of POC was adopted by the Group starting January 1, 2018.
Until December 31, 2020 under MC 14-2018 in relation to the exclusion of Uninstalled materials delivered on-site in the assessment of progress
- 10 -
Relief Description and Implication Deferral period Had the Group elected not to defer this
provision of the standard in respect of uninstalled materials, the following impact on the financial statements would have been observed: • real estate sales and cost of real
estate sales would have been lower; • total comprehensive income would
have been lower; and, • retained earnings would have been
lower.
SEC MC No. 34-2020 provides that, once the extension of the deferral is adopted and applied for financial reporting purposes, are not considered in accordance with PFRS and that real estate companies availing of the relief shall specify in the “Basis of Preparation of the Financial Statements” section of the financial statements that the financial statements is prepared in accordance with PFRS, as modified by the application of the financial reporting reliefs issued and approved by the SEC in response to the COVID-19 pandemic, which is considered as a compliance framework. Accordingly, once the Group has adopted and applied the provisions of SEC MC No. 34-2020, its financial reporting framework will transition from PFRS to the aforementioned compliance framework. SEC MC No. 34-2020 also provided the required disclosures in the notes to the financial statements should an entity decide to avail of the relief which include the following:
the accounting policies applied;
a discussion of the deferral of the subject implementation issues in the PIC Q&A;
a qualitative discussion of the impact on the financial statements had the concerned application guidelines in the PIC Q&A been adopted; and,
the corresponding required quantitative disclosures should any of the deferral options result into a change in accounting policy.
(d) PIC Q&As Relevant to the Real Estate Industry
In 2020, the PIC has issued four PIC Q&As which are relevant to the real estate
industry.
PIC Q&A No. 2020-02, Conclusion on PIC Q&A No. 2018-12-E: On the Treatment of Materials Delivered on Site but not yet Installed in Measuring the Progress of the Performance Obligation
- 11 -
In recognizing revenue using a cost-based input method, the cost incurred for customized materials not yet installed are to be included in the measurement of progress to properly capture the efforts expended by the Group in completing its performance obligation. In the case of uninstalled materials that are not customized, since the Group is not involved in their design and manufacture, revenue should only be recognized upon installation or use in construction. The adoption of this PIC Q&A will be consistent with PIC Q&A 2018-12-E as discussed in Note 2.2(c).
PIC Q&A No. 2020-03, Conclusion on PIC Q&A No. 2018-12-D: On the
Accounting Treatment for the Difference when the POC is Ahead of the Buyer’s Payment
The difference when the POC is ahead of the buyer’s payment can be accounted for either as a contract asset or receivable. The PIC has concluded that both views are acceptable as long as this is consistently applied in transactions of the same nature. The Group intends to continue its current treatment of accounting for the difference when the POC is ahead of the buyer’s payment as a contract asset.
Component Arising from Mismatch between the Percentage of Completion and Schedule of Payments
There is no significant financing component if the difference between the promised consideration and the cash selling price of the good or service arises for reasons other than the provision of finance to either the customer or the entity, and the difference between those amounts is proportional to the reason for the difference. Further, the Group do not need to adjust the promised amount of consideration for the effects of a significant financing component if the entity expects, at contract inception that the timing difference of the receipt of full payment of the contract price and that of the completion of the project, are expected within one year and significant financing component is not expected to be significant. The adoption of this PIC Q&A will be consistent with PIC Q&A 2018-12-D.
PIC Q&A No. 2020-05, Accounting for Cancellation of Real Estate Sales (PIC Q&A No. 2020-05 will supersede PIC Q&A No. 2018-14)
There are three acceptable approaches in accounting for sales cancellation and repossession of the property as follows:
repossessed property is recognized at fair value less cost to repossess; repossessed property is recognized at fair value plus repossession cost; or, cancellation is accounted for as a modification of the contract.
The Group accounts for cancellation of sales contract as modification of
contract, hence, the adoption of this PIC Q&A will not have significant impact in the financial statements of the Group.
- 12 -
2.3 Basis of Consolidation The Group’s consolidated financial statements comprise the accounts of the Parent Company, and its subsidiaries, after the elimination of material intercompany transactions. All intercompany assets and liabilities, equity, income, expenses and cash flows relating to transactions between entities under the Group are eliminated in full on consolidation. Unrealized profits and losses from intercompany transactions that are recognized in assets are also eliminated in full. Intercompany losses that indicate impairment are recognized in the consolidated financial statements. The financial statements of subsidiaries are prepared for the same reporting period as the Parent Company, using consistent accounting principles. The Parent Company accounts for its investments in subsidiaries and associates and non-controlling interests as shown below.
(a) Investments in Subsidiaries
Subsidiaries are entities (including structured entities) over which the Parent Company has control. The Parent Company controls an entity when it is exposed, or has rights to, variable returns from its involvement with the entity and has the ability to affect those returns through its power over the entity. Subsidiaries are consolidated from the date the Parent Company obtains control. The Parent Company reassesses whether or not it controls an entity if facts and circumstances indicate that there are changes to one or more of the three elements of controls indicated above. Accordingly, entities are deconsolidated from the date that control ceases. The acquisition method is applied to account for acquired subsidiaries. This requires recognizing and measuring the identifiable assets acquired, the liabilities assumed and any non-controlling interest in the acquiree. The consideration transferred for the acquisition of a subsidiary is the fair values of the assets transferred, the liabilities incurred to the former owners of the acquiree and the equity interests issued by the Group, if any. The consideration transferred also includes the fair value of any asset or liability resulting from a contingent consideration arrangement. Acquisition-related costs are expensed as incurred and subsequent change in the fair value of contingent consideration is recognized directly in profit or loss.
Identifiable assets acquired and liabilities and contingent liabilities assumed in a business combination are measured initially at their fair values at the acquisition date. On an acquisition-by-acquisition basis, the Group recognizes any non-controlling interest in the acquiree, either at fair value or at the non-controlling interest’s proportionate share of the recognized amounts of acquiree’s identifiable net assets.
The excess of the consideration transferred, the amount of any non-controlling interest in the acquiree and the acquisition-date fair value of any existing equity interest in the acquiree over the acquisition-date fair value of identifiable net assets acquired is recognized as goodwill. If the consideration transferred is less than the fair value of the net assets of the subsidiary acquired in the case of a bargain purchase, the difference is recognized directly as gain in profit or loss.
- 13 -
(b) Investments in Associates
Associates are those entities over which the Parent Company is able to exert significant influence but which are neither subsidiaries nor interests in a joint venture. Investments in associates are initially recognized at cost and subsequently accounted for using the equity method. Acquired investment in associate is subject to the purchase method. The purchase method involves the recognition of the acquiree’s identifiable assets and liabilities, including contingent liabilities, regardless of whether they were recorded in the consolidated financial statements prior to acquisition. Goodwill represents the excess of acquisition cost over the fair value of the Parent Company’s share of the identifiable net assets of the acquiree at the date of acquisition. Any goodwill or fair value adjustment attributable to the Parent Company’s share in the associate is included in the amount recognized as investment in an associate. All subsequent changes to the ownership interest in the equity of the associates are recognized in the Parent Company’s carrying amount of the investments. Changes resulting from the profit or loss generated by the associates are credited or charged against the share in net loss of associates in the consolidated statement of profit or loss. Impairment loss is provided when there is objective evidence that the investment in an associate will not be recovered. Changes resulting from other comprehensive income of the associate or items recognized directly in the associate’s equity are recognized in other comprehensive income or equity of the Parent Company, as applicable. However, when the Parent Company’s share of losses in an associate equals or exceeds its interest in the associate, including any other unsecured receivables, the Parent Company does not recognize further losses, unless it has incurred obligations or made payments on behalf of the associate. If the associate subsequently reports profits, the investor resumes recognizing its share of those profits only after its share of the profits exceeds the accumulated share of losses that has previously not been recognized. Distributions received from the associates are accounted for as a reduction of the carrying value of the investment.
(c) Transactions with Non-controlling Interests The Group’s transactions with non-controlling interests that do not result in loss of control are accounted for as equity transactions–that is, as transaction with the owners of the Group in their capacity as owners. The difference between the fair value of any consideration paid and the relevant share acquired of the carrying value of the net assets of the subsidiary is recognized in equity. Disposals of equity investments to non-controlling interests result in gains and losses for the Group that are also recognized in equity.
- 14 -
When the Group ceases to have control over a subsidiary, any retained interest in the entity is remeasured to its fair value at the date when control is lost, with the change in carrying amount recognized in profit or loss. The fair value is the initial carrying amount for the purposes of subsequently accounting for the retained interest as an associate or financial asset. In addition, any amounts previously recognized in other comprehensive income in respect of that entity are accounted for as if the Group had directly disposed of the related assets or liabilities. This may mean that amounts previously recognized in other comprehensive income are reclassified to profit or loss.
2.4 Business Combination Business acquisitions are accounted for using the acquisition method of accounting. Goodwill represents the excess of the cost of an acquisition over the fair value of the Group’s share of the net identifiable assets of the acquired subsidiary at the date of acquisition. Subsequent to initial recognition, goodwill is measured at cost less any accumulated impairment losses. Goodwill is tested annually for impairment and carried at cost less accumulated impairment losses. Impairment losses on goodwill are not reversed. Negative goodwill which is the excess of the Group’s interest in the net fair value of net identifiable assets acquired over acquisition cost is charged directly to income. For the purpose of impairment testing, goodwill is allocated to cash-generating units or groups of cash-generating units that are expected to benefit from the business combination in which the goodwill arose. The cash-generating units or groups of cash-generating units are identified according to operating segment. Gains and losses on the disposal of an interest in a subsidiary include the carrying amount of goodwill relating to it. If the business combination is achieved in stages, the acquirer is required to remeasure its previously held equity interest in the acquiree at its acquisition-date fair value and recognize the resulting gain or loss, if any, in the profit or loss or other comprehensive income, as appropriate. Any contingent consideration to be transferred by the Group is recognized at fair value at the acquisition date. Subsequent changes to the fair value of the contingent consideration that is deemed to be an asset or liability is recognized in accordance with PAS 37, Provisions, Contingent Liabilities and Contingent Assets, either in profit or loss, or as a charge to other comprehensive income. Contingent consideration that is classified as equity is not remeasured, and its subsequent settlement is accounted for within equity. Acquisition of interest in an entity which does not constitute a business is accounted for as an asset acquisition. A business is an integrated set of activities and assets that is capable of being conducted and managed for the purpose of providing goods or services to customers, generating investment income (such as dividends or interest) or generating other income from ordinary activities. In order to meet the definition of a business, the acquired set of activities and assets must have inputs and substantive processes that can collectively significantly contribute to the creation of outputs. A business usually consists of the three elements as follows: (a) inputs, which is an economic resource that creates outputs or can contribute to the
creation of outputs when processes are applied to it;
- 15 -
(b) processes, which a system, standard, protocol, convention or rule that when applied
to an input, creates outputs or can contribute to the creation of outputs; and,
(c) outputs, which are the result of inputs and processes applied to those inputs that provide goods or services to customers, generate investment income (such as dividends or interest) or generate other income from ordinary activities.
Under the asset purchased accounting, the purchase costs are allocated to identifiable assets and liabilities based on relative fair values of individual items; goodwill or gain on bargain purchase is not recognized; and, transaction costs are capitalized.
2.5 Financial Instruments Financial assets and financial liabilities are recognized when the Group becomes a party to the contractual terms of the financial instrument. (a) Financial assets For purposes of classifying financial assets, an instrument is considered as an
equity instrument if it is non-derivative and meets the definition of equity for the issuer in accordance with the criteria of PAS 32, Financial Instruments: Presentation. All other non-derivative financial instruments are treated as debt instruments.
(i) Classification, Measurement and Reclassification of Financial Assets
The classification and measurement of financial assets is driven by the entity’s business model for managing the financial assets and the contractual cash flow characteristics of the financial assets. Currently, the Group’s financial assets are all categorized as financial assets at amortized cost.
Financial assets are measured at amortized cost if both of the following conditions are met: the asset is held within the Group’s business model whose objective is to
hold financial assets in order to collect contractual cash flows (“hold to collect”); and,
the contractual terms of the instrument give rise, on specified dates, to
cash flows that are SPPI on the principal amount outstanding. Except for trade receivables that do not contain a significant financing component and are measured at the transaction price in accordance with PFRS 15, all financial assets meeting these criteria are measured initially at fair value plus transaction costs. These are subsequently measured at amortized cost using the effective interest method, less any impairment in value. The Group’s financial assets at amortized cost are presented in the consolidated statement of financial position as Cash and Cash Equivalents, Receivables (excluding Advances to officers and employees), Due from Related Parties and Other Non-current Assets in respect of the refundable deposits included therein.
- 16 -
Financial assets measured at amortized cost are included in current assets, except for those with maturities greater than 12 months after the end of reporting period, which are classified as non-current assets. For purposes of cash flows reporting and presentation, cash and cash equivalents comprise accounts with original maturities of three months or less, including cash. These generally include cash on hand, demand deposits and short-term, highly liquid investments readily convertible to known amounts of cash and which are subject to insignificant risk of changes in value. Interest income is calculated by applying the effective interest rate to the gross carrying amount of the financial assets except for those that are subsequently identified as credit-impaired. For credit-impaired financial assets at amortized cost, the effective interest rate is applied to the net carrying amount of the financial assets (after deduction of the loss allowance). The interest earned is recognized in the statement of profit or loss as part of Finance Income.
(ii) Impairment of Financial Assets
The Group assesses and recognizes an allowance for expected credit losses (ECL) on its financial assets measured at amortized cost. The measurement of the ECL involves consideration of broader range of information in assessing credit risk, including past events (e.g., historical credit loss experience) and current conditions, adjusted for forward-looking factors specific to the counterparty or debtor and the economic environment that affect the collectability of the future cash flows of the financial assets. ECL is determined by a probability-weighted estimate of credit losses over the expected life of the financial assets.
The amount of allowance for ECL is updated at the end of each reporting period to reflect the changes in credit risk of the financial asset since initial recognition. In assessing the credit quality of a financial asset, the Group assesses whether there has been a significant increase in credit risk for financial asset since initial recognition by comparing the risk of default occurring over the expected life of the financial asset between the reporting date and the date of the initial recognition. In determining whether the financial asset is in default, which is aligned with the definition of credit-impaired, the Group considers both quantitative and qualitative criteria as further discussed in Note 30.2(b). The amount of allowance for ECL is based on the difference between the contractual cash flows due in accordance with the contract and all the cash flows that the Group expects to receive, discounted at an approximation of the original effective interest rate. The expected cash flows include cash flows from the sale of any collateral held or other credit enhancements that are integral to the contractual terms.
- 17 -
The Group assesses impairment of receivables and contract assets on a collective basis based on shared credit risk characteristics of financial assets. The Group determines the ECL for receivables and contract assets by applying a method that evaluates the credit quality of a portfolio of receivables and contract assets and the cumulative loss rates by analyzing historical net charge-offs arising from cancellations and back-out sale for homogenous accounts that share the same origination period.
For other credit exposures such as due from related parties and refundable deposit, ECLs are recognized in two stages. If the credit risk on a financial asset has not increased significantly since initial recognition, the Group measures and provides for credit losses that are expected to result from default events that are possible within the next 12-months (12-month ECL). When there has been a significant increase in credit risk on a financial asset since initial recognition, a loss allowance is required for credit losses expected over the remaining life of the exposure, irrespective of the timing of the default (lifetime ECL). For deposits in cash and cash equivalents, the Group applies the low credit risk simplification and measures the ECL on the financial assets based on a 12-month basis unless there has been a significant increase in credit risk since origination, in that case, the loss allowance will be based on the lifetime ECL. The key elements used in the calculation of ECL are as follows:
Probability of Default – it is an estimate of likelihood of a counterparty
defaulting at its financial obligation over a given time horizon, either over the next 12 months or the remaining lifetime of the obligation.
Loss Given Default – it is an estimate of loss related to the amount that may
not be recovered after the default occurs. It is based on the difference between the contractual cash flows due in accordance with the terms of the instrument and all the cash flows that the Group expects to receive. For receivables and contract assets, this include cash flows from resale of repossessed real estate properties, net of direct costs of obtaining and selling the properties such as commission, refurbishment, and refund payment under Republic Act (RA) 6552, Realty Installment Buyer Protection Act or Maceda law.
Exposure at Default – It represents the gross carrying amount of the
financial instruments in the event of default which pertains to its amortized cost.
The Group recognizes an impairment loss in profit or loss for all financial instruments subjected to impairment assessment with a corresponding adjustment to their carrying amount through a loss allowance account.
- 18 -
(iii) Derecognition of Financial Assets
The financial assets (or where applicable, a part of a financial asset or part of a group of financial assets) are derecognized when the contractual rights to receive cash flows from the financial instruments expire, or when the financial assets and all substantial risks and rewards of ownership have been transferred to another party. If the Group neither transfers nor retains substantially all the risks and rewards of ownership and continues to control the transferred asset, the Group recognizes its retained interest in the asset and an associated liability for amounts it may have to pay. If the Group retains substantially all the risks and rewards of ownership of a transferred financial asset, the Group continues to recognize the financial asset and also recognizes a collateralized borrowing for the proceeds received.
(b) Financial liabilities
Financial liabilities, which include interest-bearing loans and borrowings and trade and other payables [except government-related obligations, advance rental and output value-added tax (VAT)], are recognized initially at their fair values and subsequently measured at amortized cost, using effective interest method for maturities beyond one year, less settlement payments. Financial liabilities are recognized when the Group becomes a party to the contractual terms of the instrument. Interest-bearing loans are raised for support of long-term funding of operations. Finance charges, including premiums payable on settlement or redemption and direct issue costs, are charged to profit or loss, except for capitalized borrowing cost, on an accrual basis using the effective interest method and are added to the carrying amount of the instrument to the extent that these are not settled in the period in which they arise. Dividend distributions to shareholders, if any, are recognized as financial liabilities when the dividends are approved by the BOD. Financial liabilities are classified as current liabilities if payment is due to be settled within one year or less after the end of the reporting period (or in the normal operating cycle of the business, if longer), or the Group does not have an unconditional right to defer settlement of the liability for at least twelve months after the end of the reporting period. Otherwise, these are presented as non-current liabilities. All interest-related charges are recognized as expense in profit or loss under the caption Finance and Other Charges account in the statement of comprehensive income. Financial liabilities are derecognized from the statement of financial position only when the obligations are extinguished either through discharge, cancellation or expiration. The difference between the carrying amount of the financial liability derecognized and the consideration paid or payable is recognized in profit or loss.
- 19 -
(c) Offsetting Financial Instruments Financial assets and financial liabilities are offset and the resulting net amount,
considered as a single financial asset or financial liability, is reported in the statement of financial position when the Group currently has legally enforceable right to set-off the recognized amounts and there is an intention to settle on a net basis, or realize the asset and settle the liability simultaneously. The right of set-off must be available at the end of the reporting period, that is, it is not contingent on future event. It must also be enforceable in the normal course of business, in the event of default, and in the event of insolvency or bankruptcy; and must be legally enforceable for both entity and all counterparties to the financial instruments.
2.6 Real Estate Inventories Cost of real estate inventories includes acquisition costs of raw land intended for future development, including other costs and expenses incurred to effect the transfer of the property to the Group; related property development costs; and borrowing costs on certain loans incurred during the development of the real estate properties are also capitalized by the Group (see Note 2.14). All costs relating to the real estate property sold are recognized as expense as the work to which they relate is performed. Costs of real estate inventories are assigned using specific identification of their individual costs. These properties and projects are valued at the lower of cost and net realizable value. Net realizable value is the estimated selling price in the ordinary course of business, less estimated costs to complete and the estimated costs necessary to make the sale.
The Company recognizes the effect of revisions in the total project cost estimates in the year in which these changes become known. Any impairment loss from a real estate project is charged to operations during the period in which the loss is determined.
Repossessed property arising from sales cancellation is recognized at cost. The difference between the carrying amount of the receivable or Contract Asset to be derecognized and the cost of the repossessed property is recognized in the statement of comprehensive income
2.7 Deposits on Land for Future Development Deposits on land for future development pertain to advance cash payments made to sellers of properties purchased by the Group but title over the properties have not yet been transferred to the Group. Once sale is consummated, which is usually within 12 months from the date the deposit is made, such advance payments are applied to the full amount of the contract price and debited to either Real Estate Inventory or Investment Property account depending on the intended use of the property acquired. The Group present deposit on land for future development that are intended for real estate inventories under current assets while those that are intended for investment properties as non-current assets in the consolidated statement of financial position.
- 20 -
2.8 Prepayments and Other Assets Prepayments and other assets pertain to other resources controlled by the Group as a result of past events. They are recognized in the consolidated financial statements when it is probable that the future economic benefits will flow to the Group and the asset has a cost or value that can be measured reliably. Other recognized assets of similar nature, where future economic benefits are expected to flow to the Group beyond one year after the end of the reporting period are classified as part of non-current assets. 2.9 Property and Equipment Property and equipment are carried at acquisition or construction cost less subsequent depreciation, amortization and any impairment losses. As no finite useful life for land can be determined, related carrying amounts are not depreciated. The cost of an asset comprises its purchase price and directly attributable costs of bringing the asset to working condition for its intended use. Expenditures for additions, major improvements and renewals are capitalized while expenditures for repairs and maintenance are charged to expense as incurred. Cost also includes capitalized borrowing costs (see Note 2.14). Depreciation is computed on the straight-line basis over the estimated useful lives of the assets as follows: Buildings 20 years Transportation equipment 5 years Office equipment 3-5 years Furniture and fixtures 2-5 years Leasehold improvements are amortized over the useful life of the improvements of 10 years or the lease term, whichever is shorter. Construction-in-progress is not depreciated until the completion of the constructed asset. Fully depreciated and amortized assets are retained in the accounts until they are no longer in use and no further charge for depreciation and depreciation is made in respect of those assets. An asset’s carrying amount is written down immediately to its recoverable amount if the asset’s carrying amount is greater than its estimated recoverable amount (see Note 2.16). The residual values, estimated useful lives, and method of depreciation and amortization of property and equipment are reviewed, and adjusted if appropriate, at the end of each reporting period. An item of property and equipment, including the related accumulated depreciation and amortization, and impairment losses, if any, is derecognized upon disposal or when no future economic benefits are expected to arise from the continued use of the asset. Any gain or loss arising on derecognition of the asset (calculated as the difference between the net disposal proceeds and the carrying amount of the item) is included in profit or loss in the year the item is derecognized.
- 21 -
2.10 Investment Properties Investment properties are completed and under construction or development properties that are held to earn rental income, but not for sale in the ordinary course of business, use in the production or supply of goods or services or for administrative purposes. Cost of the asset includes cost of construction and capitalized borrowing costs (see Note 2.14).
Investment properties are carried at cost, net of accumulated depreciation, except for land which is not subjected to depreciation, and any impairment in value. Depreciation of investment properties that are subject to depreciation is computed using the straight-line method over the estimated useful lives of the assets of 20 to 50 years.
Construction in progress represents properties under construction and is stated at cost. This includes costs of construction, applicable borrowing costs (see Note 2.14) and other direct costs. The account is not depreciated until such time that the assets are completed and available for use. Transfers are made to investment properties when, and only when, there is a change in use evidenced by ending of owner occupation, commencement of an operating lease to another party or ending of construction or development. Transfers are made from investment properties when, and only when, there is a change in use evidenced by commencement of owner occupation or commencement of development with a view to sale. In isolation, a change in management’s intentions for the use of a property does not provide evidence of a change in use. An asset’s carrying amount is written down immediately to its recoverable amount if the asset’s carrying amount is greater than its recoverable amount (Note 2.16). Investment properties are derecognized upon disposal or when permanently withdrawn from use and no future economic benefit is expected from their disposal. 2.11 Offsetting Financial Instruments Financial assets and financial liabilities are offset and the resulting net amount, considered as a single financial asset or financial liability, is reported in the consolidated statement of financial position when the Group currently has a legally enforceable right to set off the recognized amounts and there is an intention to settle on a net basis, or realize the asset and settle the liability simultaneously. The right of set-off must be available at the end of the reporting period, that is, it is not contingent on future event. It must also be enforceable in the normal course of business, in the event of default, and in the event of insolvency or bankruptcy; and must be legally enforceable for both entity and all counterparties to the financial instruments.
2.12 Provisions and Contingencies Provisions are recognized when present obligations will probably lead to an outflow of economic resources and they can be estimated reliably even if the timing or amount of the outflow may still be uncertain. A present obligation arises from the presence of a legal or constructive obligation that has resulted from past events. Provisions are measured at the estimated expenditure required to settle the present obligation, based on the most reliable evidence available at the end of the reporting period, including the risks and uncertainties associated with the present obligation.
- 22 -
Where there are a number of similar obligations, the likelihood that an outflow will be required in settlement is determined by considering the class of obligations as a whole. When time value of money is material, long-term provisions are discounted to their present values using a pretax rate that reflects market assessments and the risks specific to the obligation. The increase in the provision due to passage of time is recognized as interest expense. Provisions are reviewed at the end of each reporting period and adjusted to reflect the current best estimate.
In those cases where the possible outflow of economic resource as a result of present obligations is considered improbable or remote, or the amount to be provided for cannot be measured reliably, no liability is recognized in the consolidated financial statements. Similarly, possible inflows of economic benefits to the Group that do not yet meet the recognition criteria of an asset are considered contingent assets, hence, are not recognized in the consolidated financial statements. On the other hand, any reimbursement that the Group can be virtually certain to collect from a third party with respect to the obligation is recognized as a separate asset not exceeding the amount of the related provision. 2.13 Revenue and Expense Recognition Revenue of the Group arises mainly from the sale of real estate units, lease of property, rendering of management services and hotel operations. However, lease of property is accounted for separately (see Note 2.15). The Group follows the five-step process below to when it recognizes revenue. (1) identifying the contract with a customer;
(2) identifying the performance obligation;
(3) determining the transaction price;
(4) allocating the transaction price to the performance obligations; and,
(5) recognizing revenue when/as performance obligations are satisfied. A contract with a customer is identified when the following five gating criteria are present: (i) the parties to the contract have approved the contract either in writing or in
accordance with the customary business practices;
(ii) each party’s rights regarding the goods or services to be transferred or performed can be identified;
(iii) the payment terms for the goods or services to be transferred or performed can be identified;
(iv) the contract has commercial substance (i.e., the risk, timing or amount of the future cash flows is expected to change as a result of the contract); and,
(v) collection of the consideration in exchange of the goods and services is probable. Revenue is recognized only when (or as) the Group satisfies a performance obligation by transferring control of the promised goods or services to a customer. The transfer of control can occur over time or at a point in time.
- 23 -
A performance obligation is satisfied at a point in time unless it meets one of the following criteria, in which case it is satisfied over time: (i) the customer simultaneously receives and consumes the benefits provided by the
Group’s performance as the Group performs;
(ii) the Group’s performance creates or enhances an asset that the customer controls as the asset is created or enhanced; and,
(iii) the Group’s performance does not create an asset with an alternative use to the Group and the entity has an enforceable right to payment for performance completed to date.
The transaction price allocated to performance obligations satisfied at a point in time is recognized as revenue when control of the goods or services transfers to the customer. If the performance obligation is satisfied over time, the transaction price allocated to that performance obligation is recognized as revenue as the performance obligation is satisfied. The Company uses the practical expedient in PFRS 15 with respect to non-disclosure of the aggregate amount of the transaction price allocated to unsatisfied or partially satisfied performance obligations as of the end of the reporting period and the explanation of when such amount will be recognized. In addition, the following specific recognition criteria must also be met before revenue is recognized [significant judgments in determining the timing of satisfaction of the following performance obligations are disclosed in Note 3.1(c)]: (a) Sale of real estate units – Revenue from the sale of real estate units are recognized as
the control transfers at either over time for units sold under pre-completed contracts or at a point in time for ready for occupancy (RFO) units, provided that the collectability of the contract price is reasonably assured. Invoicing for real estate sales are based on the agreed amortization schedule by the Group and the buyer. When the price gating criteria of the revenue recognition has not been met, including assessment that collectability of the contract price is not yet assured, the consideration received from buyers are accounted as Customers’ Deposits which is presented under current liabilities in the consolidated statement of financial position. Subsequent cancellations of prior year sales are deducted from real estate sales and the related costs in the year in which such cancellations are made. For tax reporting purposes, the taxable income for the year is based on the provisions of Section 49 of the National Internal Revenue Code (NIRC), as amended, which governs installment sales. Under the NIRC, revenue on sale and cost of real estate sold are recognized in full when the initial payments collected in the year of sale exceed 25% of the selling price; otherwise, revenue and cost of real estate sold are recognized based on the collections.
(b) Rendering of management services – Revenue from the rendering of management services
is recognized over time as the services are provided to the client entities, which consume the benefit as the Group performs. The client entities are invoiced monthly as work progresses, which are also due upon receipt by them. Any amounts remaining unbilled at the end of a reporting period are presented in the consolidated statement of financial position as part of contract receivables as only the passage of time is required before payment of these amounts will be due.
- 24 -
(c) Hotel operations – Revenues are recognized over time during the occupancy of hotel
guest and ends when the scheduled hotel room accommodation has lapsed (i.e., the related room services have been rendered). As applicable, invoices for hotel accommodations are due upon receipt by the customer.
Contract assets pertain to rights to consideration in exchange for goods or services that the Company has transferred to a customer that is conditioned on something other than passage of time. Under its contracts with customers, the Company will receive an unconditional right to payment for the total consideration upon the completion of the development of the property sold. Any rights to consideration recognized by the Company as it develops the property are presented as Contract Assets in the statement of financial position. Contract assets are subsequently tested for impairment in the same manner as the Company assesses impairment of its financial assets [see Note 2.5(a)(ii)].
Any consideration received by the Company in excess of the amount for which the Company is entitled is presented as Contract Liabilities in the statement of financial position. A contract liability is the Company’s obligation to transfer goods or services to a customer for which the Company has received consideration (or an amount of consideration is due) from the customer. Incremental costs of obtaining a contract to sell real property to customers, such as broker’s commissions, are recognized as part of Prepayments and Other Current Assets and is subsequently amortized over the duration of the contract on the same basis as revenue from such contract is recognized. Other costs and expenses are recognized in profit or loss upon utilization of services or receipt of goods or at the date they are incurred. Finance costs are reported on an accrual basis, except capitalized borrowing costs (see Note 2.14). 2.14 Borrowing Costs Borrowing costs are recognized in the period in which they are incurred, except to the extent that they are capitalized. Borrowing costs that are directly attributable to the acquisition, construction or production of a qualifying asset (i.e., an asset that takes a substantial period of time to get ready for its intended use or sale) are capitalized as part of cost of such asset. The capitalization of borrowing costs commences when expenditures for the asset and borrowing costs are being incurred and activities that are necessary to prepare the asset for its intended use or sale are in progress. Capitalization ceases when substantially all such activities are complete. Investment income earned on the temporary investment of specific borrowings pending their expenditure on qualifying assets is deducted from the borrowing costs eligible for capitalization.
2.15 Leases The Group accounts for its leases as follows: (a) Group as Lessee
The Group considers whether a contract is, or contains, a lease. A lease is defined as a contract, or part of a contract, that conveys the right to use an asset (the underlying asset) for a period of time in exchange for consideration. To apply this definition, the Group assesses whether the contract meets three key evaluations which are whether:
- 25 -
the contract contains an identified asset, which is either explicitly identified in the contract or implicitly specified by being identified at the time the asset is made available to the Group;
the Group has the right to obtain substantially all of the economic benefits from use of the identified asset throughout the period of use, considering its rights within the defined scope of the contract; and,
the Group has the right to direct the use of the identified asset throughout the period of use. The Group assess whether it has the right to direct ‘how and for what purpose’ the asset is used throughout the period of use.
At lease commencement date, the Group recognizes a right-of-use asset and a lease liability in the consolidated statement of financial position. The right-of-use asset is measured at cost, which is made up of the initial measurement of the lease liability, any initial direct costs incurred by the Group, an estimate of any costs to dismantle and remove the asset at the end of the lease, and any lease payments made in advance of the lease commencement date (net of any incentives received). Subsequently, the Group depreciates the right-of-use asset on a straight-line basis from the lease commencement date to the earlier of the end of the useful life of the right-of-use asset or the end of the lease term. The Group also assesses the right-of-use asset for impairment when such indicators exist (see Note 2.16).
On the other hand, the Group measures the lease liability at the present value of the lease payments unpaid at the commencement date, discounted using the interest rate implicit in the lease if that rate is readily available or the Group’s incremental borrowing rate. Lease payments include fixed payments (including in-substance fixed) less lease incentives receivable, if any, variable lease payments based on an index or rate, amounts expected to be payable under a residual value guarantee, and payments arising from options (either renewal or termination) reasonably certain to be exercised. Subsequent to initial measurement, the liability will be reduced for payments made and increased for interest. It is remeasured to reflect any reassessment or modification, or if there are changes in in-substance fixed payments. When the lease liability is remeasured, the corresponding adjustment is reflected in the right-of-use asset, or profit and loss if the right-of-use asset is already reduced to zero. The Group has elected to account for short-term leases and leases of low-value assets using the practical expedients. Instead of recognizing a right-of-use asset and lease liability, the payments in relation to these are recognized as an expense in profit or loss on a straight-line basis over the lease term.
On the consolidated statement of financial position, right-of-use assets and lease liabilities have been presented separately from property and equipment and other liabilities, respectively.
(b) Group as Lessor Leases which do not transfer to the lessee substantially all the risks and benefits of ownership of the asset are classified as operating leases. Lease income from operating leases is recognized in profit or loss on a straight-line basis over the lease term.
- 26 -
2.16 Impairment of Non-financial Assets The Group’s property and equipment, right-of-use assets, investment properties, investment in associates and other non-financial assets are subject to impairment testing. All other individual assets are tested for impairment whenever events or changes in circumstances indicate that the carrying amount of those assets may not be recoverable. For purposes of assessing impairment, assets are grouped at the lowest levels for which there are separately identifiable cash flows (cash-generating units). As a result, assets are tested for impairment either individually or at the cash-generating unit level. Impairment loss is recognized in profit or loss for the amount by which the asset’s or cash-generating unit’s carrying amount exceeds its recoverable amounts which is the higher of its fair value less costs to sell and its value in use. In determining value in use, management estimates the expected future cash flows from each cash-generating unit and determines the suitable interest rate in order to calculate the present value of those cash flows. The data used for impairment testing procedures are directly linked to the Group’s latest approved budget, adjusted as necessary to exclude the effects of asset enhancements. Discount factors are determined individually for each cash-generating unit and reflect management’s assessment of respective risk profiles, such as market and asset-specific risk factors. All assets are subsequently reassessed for indications that an impairment loss previously recognized may no longer exist. An impairment loss is reversed if the asset’s or cash-generating unit’s recoverable amount exceeds its carrying amount. 2.17 Employee Benefits The Group provides post-employment benefits to employees through a defined benefit plan and defined contribution plans, and other employee benefits which are recognized as follows: (a) Post-employment Defined Benefit Plan
A defined benefit plan is a post-employment plan that defines an amount of post-employment benefit that an employee will receive on retirement, usually dependent on one or more factors such as age, years of service and salary. The legal obligation for any benefits from this kind of post-employment plan remains with the Group, even if plan assets for funding the defined benefit plan have been acquired. Plan assets may include assets specifically designated to a long-term benefit fund, as well as qualifying insurance policies. The Group’s defined benefit post-employment plan, which became effective on January 1, 2015, covers all regular full-time employees. The pension plan is noncontributory and administered by a trustee.
- 27 -
The liability recognized in the consolidated statement of financial position for a defined benefit plan is the present value of the defined benefit obligation at the end of the reporting period less the fair value of plan assets. The defined benefit obligation is calculated annually by independent actuaries using the projected unit credit method. The present value of the defined benefit obligation is determined by discounting the estimated future cash outflows for expected benefit payments using a discount rate derived from the interest rates of a zero coupon government bonds using the reference rates published by Bloomberg using its valuation technology, Bloomberg valuation (BVAL), that are denominated in the currency in which the benefits will be paid and that have terms to maturity approximating to the terms of the related post-employment liability. BVAL provides evaluated prices that are based on market observations from contributed sources. Remeasurements, comprising of actuarial gains and losses arising from experience adjustments and changes in actuarial assumptions and the return on plan assets (excluding amount included in net interest) are reflected immediately in the consolidated statement of financial position with a charge or credit recognized in other comprehensive income in the period in which they arise. Net interest is calculated by applying the discount rate at the beginning of the period, unless there is a plan amendment, curtailment or settlement during the reporting period. The calculation takes into account any changes in the net defined benefit liability or asset during the period as a result of contributions to the plan or benefit payments. Net interest is reported as part of Finance Costs or Finance Income in the consolidated statement of profit or loss. Past-service costs are recognized immediately in profit or loss in the period of a plan amendment and curtailment, if any.
(b) Post-Employment Defined Contribution Plans A defined contribution plan is a post-employment plan under which the Group pays fixed contributions into an independent entity (i.e., Social Security System). The Group has no legal or constructive obligations to pay further contributions after payment of the fixed contribution. The contributions recognized in respect of defined contribution plans are expensed as they fall due. Liabilities or assets may be recognized if underpayment or prepayment has occurred and are included in current liabilities or current assets as they are normally of a short-term nature.
(c) Termination Benefits Termination benefits are payable when employment is terminated by the Group before the normal retirement date, or whenever an employee accepts voluntary redundancy in exchange for these benefits. The Group recognizes termination benefits at the earlier of when it can no longer withdraw the offer of such benefits and when it recognizes costs for a restructuring that is within the scope of PAS 37 and involves the payment of termination benefits. In the case of an offer made to encourage voluntary redundancy, the termination benefits are measured based on the number of employees expected to accept the offer. Benefits falling due more than 12 months after the reporting period are discounted to their present value.
(d) Performance Bonus
The Group recognizes a liability and an expense for bonuses. The Group recognizes a provision where it is contractually obliged to pay the benefits, or where there is a past practice that has created a constructive obligation.
- 28 -
(e) Compensated Absences
Compensated absences are recognized for the number of paid leave days (including holiday entitlement) remaining at the end of each reporting period. They are included in the Trade and Other Payables account in the consolidated statement of financial position at the undiscounted amount that the Group expects to pay as a result of the unused entitlement.
2.18 Income Taxes Tax expense recognized in profit or loss comprises the sum of current tax and deferred tax not recognized in other comprehensive income or directly in equity, if any. Current tax assets or liabilities comprise those claims from, or obligations to, fiscal authorities relating to the current or prior reporting period, that are uncollected or unpaid at the end of the reporting period. They are calculated using the tax rates and tax laws applicable to the fiscal periods to which they relate, based on the taxable profit for the year. All changes to current tax assets or liabilities are recognized as a component of tax expense in profit or loss. Deferred tax is accounted for using the liability method, on temporary differences at the end of each reporting period between the tax base of assets and liabilities and their carrying amounts for financial reporting purposes. Under the liability method, with certain exceptions, deferred tax liabilities are recognized for all taxable temporary differences and deferred tax assets are recognized for all deductible temporary differences and the carry-forward of unused tax losses and unused tax credits to the extent that it is probable that taxable profit will be available against which the deductible temporary differences can be utilized. Unrecognized deferred tax assets are reassessed at the end of each reporting period and are recognized to the extent that it has become probable that future taxable profit will be available to allow such deferred tax assets to be recovered. Deferred tax assets and liabilities are measured at the tax rates that are expected to apply in the period when the asset is realized or the liability is settled provided such tax rates have been enacted or substantively enacted at the end of the reporting period. The carrying amount of deferred tax assets is reviewed at the end of each reporting period and reduced to the extent that it is probable that sufficient taxable profit will be available to allow all or part of the deferred tax asset to be utilized. The measurement of deferred tax liabilities and assets reflects the tax consequences that would follow from the manner in which the Group expects, at the end of the reporting period, to recover or settle the carrying amount of its assets and liabilities. Most changes in deferred tax assets or liabilities are recognized as a component of tax expense in profit or loss, except to the extent that it relates to items recognized in other comprehensive income or directly in equity. In this case, the tax is also recognized in other comprehensive income or directly in equity, respectively. Deferred tax assets and deferred tax liabilities are offset if the Group has a legally enforceable right to set off current tax assets against current tax liabilities and the deferred taxes relate to the same entity within the Group.
- 29 -
2.19 Related Party Transactions and Relationships Related party transactions are transfers of resources, services or obligations between the Group and its related parties, regardless whether a price is charged. Parties are considered to be related if one party has the ability to control the other party or exercise significant influence over the other party in making financial and operating decisions. These parties include: (a) individuals owning, directly or indirectly through one or more intermediaries, control or are controlled by, or under common control with the Group; (b) associates; (c) individuals owning, directly or indirectly, an interest in the voting power of the Group that gives them significant influence over the Group and close members of the family of any such individual; and, (d) the Group’s funded retirement plan. In considering each possible related party relationship, attention is directed to the substance of the relationship and not merely on the legal form.
For purposes of reporting material related party transactions of publicly-listed companies to the SEC, transactions amounting to 10% or more of the total assets based on the latest audited consolidated financial statements that were entered into with the related parties are considered material. All individual material related party transactions shall be approved by at least two-thirds vote of the BOD, with at least a majority of the independent directors voting to approve the material related party transactions. In case that a majority of the independent directors’ vote to approve the material related party transactions may be ratified by the vote of the stockholders representing at least two-thirds of the outstanding capital stock. For aggregate related party transactions within a 12-month period that breaches the materiality threshold of ten 10% of the Group’s total assets based on the latest audited consolidated financial statements, the same board approval would be required for the transactions that meets and exceeds the materiality threshold covering the same related party. 2.20 Segment Reporting Operating segments are reported in a manner consistent with the internal reporting provided to the Group’s executive committee, its chief operating decision maker. The executive committee is responsible for allocating resources and assessing performance of the operating segments. In identifying its operating segments, management generally follows the Group’s geographical location, which represent the main products and services provided by the Group. The measurement policies the Group uses for segment reporting under PFRS 8, Operating Segments, are the same as those used in its consolidated financial statements, except post-employment benefit expenses in arriving at the operating profit of the operating segments. In addition, corporate assets which are not directly attributable to the business activities of any operating segment are not allocated to a segment.
- 30 -
2.21 Equity Capital stock represents the nominal value of shares that have been issued. Additional paid-in capital represents the proceeds in excess of the par value of shares issued less directly attributable costs in relation to the issuance of the shares. Treasury shares represent the shares that are reacquired by the Parent Company at cost but are not cancelled shares. Revaluation reserves comprise gains and losses arising from remeasurements of post-employment defined benefit plan. Retained earnings represent all current and prior period results of operations as reported in the consolidated statement of profit or loss, reduced by the amounts of dividends declared. Appropriated retained earnings are retained earnings that have been set aside by the Group for specific purpose and are not available for dividend declarations. Non-controlling interest (NCI) represents equity in consolidated entities that are not attributable, directly or indirectly to the Parent Company. This increases by equity investments from non-controlling shareholders, share in profit or loss and share in each component of other comprehensive income in the consolidated entities. This decreases by dividends declared to non-controlling shareholders. The Group adjusts the carrying amount of NCI to reflect the changes in their relative interests in the consolidated entities when the proportion of the equity held by NCI changes. The Group directly recognize in equity any difference between the amount by which the NCI are adjusted and the fair value of the consideration paid or received, and attribute it to the shareholders of the Parent Company. 2.22 Earnings Per Share Basic earnings per share (EPS) is computed by dividing net profit attributable to equity holders of the Parent Company by the weighted average number of shares issued and outstanding, adjusted retroactively for any stock dividend, stock split or reverse stock split declared during the current period. Diluted EPS is computed by adjusting the weighted average number of ordinary shares outstanding to assume conversion of dilutive potential shares. Currently, the Group does not have dilutive potential shares outstanding, hence, the diluted earnings per share is equal to the basic earnings per share. 2.23 Events After the End of the Reporting Period Any post-year-end event that provides additional information about the Group’s consolidated financial position at the end of the reporting period (adjusting event) is reflected in the consolidated financial statements. Post-year-end events that are not adjusting events, if any, are disclosed when material to the consolidated financial statements.
- 31 -
3. SIGNIFICANT ACCOUNTING JUDGMENTS AND ESTIMATES
The preparation of the Group’s consolidated financial statements in accordance with PFRS requires management to make judgments and estimates that affect the amounts reported in the consolidated financial statements and related notes. Judgments and estimates are continually evaluated and are based on historical experience and other factors, including expectations of future events that are believed to be reasonable under the circumstances. Actual results may ultimately differ from these estimates. 3.1 Critical Management Judgments in Applying Accounting Policies In the process of applying the Group’s accounting policies, management has made the following judgments, apart from those involving estimation, which have the most significant effect on the amounts recognized in the consolidated financial statements. (a) Determining Existence of a Contract with Customer
In a sale of real estate properties, the Group’s primary document for a contract with a customer is a signed contract to sell which is executed when the real estate property sold is completed and ready for use by customer. In rare cases wherein contract to sell are not executed by both parties, management has determined that the combination of other signed documentations with the customers such as reservation agreement, official receipts, computation sheets and invoices, would contain all the elements to qualify as contract with the customer (i.e., approval of the contract by the parties, which has commercial substance, identification of each party’s rights regarding the goods or services and the related payment terms). Moreover, as part of the evaluation, the Group assesses the probability that the Group will collect the consideration to which it will be entitled in exchange for the real estate property that will be transferred to the customer. In evaluating whether collectability of an amount of consideration is probable, the Group considers the significance of the customer’s downpayment in relation to the total contract price [see Note 3.1(d)]. Collectability is also assessed by considering factors such as past history with the customer and pricing of the property. Management regularly evaluates the historical cancellations and back-outs if it would still support its current threshold of customers’ equity before commencing revenue recognition.
(b) Evaluation of Timing of Satisfaction of Performance Obligations The Group exercises critical judgment in determining whether each performance obligation to develop properties promised in its contracts with customers is satisfied over time or at a point in time. In making this judgment, the Group considers the following: any asset created or enhanced as the Group performs;
the ability of the customer to control such asset as it is being created or enhanced;
the timing of receipt and consumption of benefits by the customer; and,
the Group’s enforceable right for payment for performance completed to date.
- 32 -
The Group determined that its performance obligation is satisfied over time since it does not have an alternative use of the specific property sold as it is precluded by its contract from redirecting the use of the property for a different purpose. Further, the Group has rights over payment for development completed to date as the Group can choose to complete the development and enforce its rights to full payment under its contracts even if the customer defaults on amortization payments. On the other hand, performance obligation for completed real estate properties is satisfied at a point in time when the control over the real estate property is transferred to the buyer.
(c) Determination of Collection Threshold for Revenue Recognition
The Group uses judgment in evaluating the probability of collection of transaction price on real estate sales as a criterion for revenue recognition. The Group uses historical payment pattern of customers and number of sales cancellation in establishing a percentage of collection threshold over which the Group determines that collection of the transaction price is reasonably assured. Reaching this level of collection is an indication of buyer’s continuing commitment and the probability that economic benefits will flow to the Group. The Group considers that the initial and continuing investments by the buyer when reaching the set collection threshold would demonstrate the buyer’s commitment to pay the total contract price. Management is confident that when the collections received from the buyers exceed a certain threshold, it would be remote that the buyer will default and the contract will be cancelled. Accordingly, as discussed in Note 2.13 under identification of contract, the Group will not recognize the whole contract and no revenue will be recognized when the threshold is not yet reached.
(d) Assessment Involving Right of Return
The Group’s sale of real estate under pre-completed contracts has variable consideration, which is the right of return when a buyer defaulted the equity payments. Moreover, Republic Act No. 6552, Realty Installment Buyer Act or, which is popularly known in the Philippines as the Maceda Law, provides a statutory obligation to the Group to refund the buyer the cash surrender value of the collections received on the property equivalent to fifty percent of the total collected amount, and, after five years of installments, an additional five percent every year but not to exceed 90% of the total collections received.
(e) Determination of ECL on Receivables and Contract Assets
The Group uses the cumulative loss rate approach to calculate ECL for receivables and contract assets. This approach considers and includes reasonable approximation of probable and estimable future losses determined by applying historical gross charge-off information (arising from cancellations and back-out sales) to forward-looking qualitative information (i.e., forecast of economic condition). While there may be an assessed default occurring in these receivables over the term of the instrument, the amount of required allowance for ECL is minimized since the legal title related to the unit sold will only be transferred once the contract receivable has been paid in full, and the Group has the right to recover the real estate properties covered by the contract with customer through repossession, and to resell the asset at an amount sufficient to cover the unpaid outstanding obligations.
- 33 -
On the other hand, additional ECL may be calculated for certain pool of trade receivables specifically determined to have expected cash shortfall based on outstanding exposures. These generally arise from receivables which were charged-off at an earlier term of the instrument since origination period.
Details about the ECL on the Group’s trade and other receivables and contract assets are disclosed in Note 30.2.
(f) Distinction Between Investment Properties and Owner-managed Properties The Group determines whether a property qualifies as investment property. In making its judgment, the Group considers whether the property generates cash flows largely independent of the other assets held by an entity. Owner-occupied properties generate cash flows that are attributable not only to the property but also to other assets used in the operations.
(g) Distinction Between Operating and Finance Leases for Contracts where the Group is the Lessor The Group has entered into various lease agreements. Critical judgment was exercised by management to distinguish each lease agreement as either an operating or a finance lease by looking at the transfer or retention of significant risk and rewards of ownership of the properties covered by the agreements. Failure to make the right judgment will result in either overstatement or understatement of assets and liabilities. Currently, its leases are all operating leases.
(h) Determination of Lease Term of Contracts with Renewal and Termination Options
In determining the lease term, management considers all relevant factors and circumstances that create an economic incentive to exercise a renewal option or not exercise a termination option. Renewal options and/or periods after termination options are only included in the lease term if the lease is reasonably certain to be extended or not terminated. For leases of land and office space, the factors that are normally the most relevant are (a) if there are significant penalties should the Group pre-terminate the contract, and (b) if any leasehold improvements are expected to have a significant remaining value, the Group is reasonably certain not to terminate the lease contract. Otherwise, the Group considers other factors including historical lease durations and the costs and business disruption required to replace the leased asset.
The lease term is reassessed if an option is actually exercised or not exercised or the Group becomes obliged to exercise or not exercise it. The assessment of reasonable certainty is only revised if a significant event or a significant change in circumstances occurs, which affects this assessment, and that is within the control of the Group.
- 34 -
(i) Accounting for Equity Ownership Interest in Subsidiaries and Associates
In classifying its equity acquisitions as an investment in a subsidiary or associates, the Group evaluates whether control or significant influence exists. Control is present when the Group is exposed, or has rights, to variable returns from its involvement with the investee and has the ability to affect those returns through its power over the investee. Significant influence is the power to participate in the financial and operating policy decisions of the investee but is not control or joint control of those policy decisions. The Parent Company was able to demonstrate control over the operations of CBLRV (since 2020), CHDI and YHESPH (since 2019), YHEST and CCLI (since 2018), MGR and YHES (since 2017), and BL Ventures, El Camino and YES (since 2016), from the time of their incorporation, as indicated in Note 1.2. It had been able to demonstrate control over the operations of the foregoing investees despite having 50% or less equity ownership interest in them by virtue of a formal agreement with the respective other shareholders of the investees and the Parent Company’s actual role in the investees’ operations. Accordingly, said entities are accounted for as subsidiaries.
(j) Distinguishing Between Business Combination and Asset Acquisition The Parent Company determines whether an acquisition of an entity constitutes a business combination or an asset acquisition. The accounting treatment for the acquisition is determined by assessing whether the transaction involved a purchase of a business taking into consideration the substance of the transaction. The Group evaluates whether an acquired entity is capable of being conducted and managed as a business by assessing the integrated set of activities and assets based on at least two essential elements – inputs and processes applied to those inputs, which together are or will be used to create outputs. Otherwise, the transaction is accounted for as an asset acquisition. Failure to make the right judgment will result in misstatement of assets and other accounts that could have been affected by the transaction. Management assessed that the acquisition of the outstanding shares of GGTT in 2020, as discussed in Note 1.2, does not qualify as business acquisition under PFRS 3, but is rather a mere acquisition of assets.
(k) Recognition of Provisions and Contingencies Judgment is exercised by management to distinguish between provisions and contingencies. Policies on recognition of provisions and contingencies are discussed in Note 2.12 and disclosures on relevant contingencies are presented in Note 28.
- 35 -
3.2 Key Sources of Estimation Uncertainty The following are the key assumptions concerning the future, and other key sources of estimation uncertainty at the end of the reporting period, that have a significant risk of causing a material adjustment to the carrying amounts of assets and liabilities within the next reporting period: (a) Revenue Recognition for Performance Obligations Satisfied Over Time
In determining the amount of revenue to be recognized for performance obligations satisfied over time, the Group measures progress on the basis of actual costs incurred relative to the total expected costs to complete such performance obligation. Specifically, the Group estimates the total development costs with reference to the project development plan and any agreement with customers. Management regularly monitors its estimates and apply changes as necessary. A significant change in estimated costs would result in a significant change in the amount of revenue recognized in the year of change.
(b) Determination of Appropriate Discount Rate in Measuring Lease Liabilities
The Group measures its lease liabilities at present value of the lease payments that are not paid at the commencement date of the lease contract. The lease payments were discounted using a reasonable rate deemed by management equal to the Group’s incremental borrowing rate. In determining a reasonable discount rate, management considers the term of the leases, the underlying asset and the economic environment. Actual results, however, may vary due to changes in estimates brought about by changes in such factors.
(c) Estimation of Allowance for ECL
The measurement of the allowance for ECL on financial assets at amortized cost is an area that requires the use of significant assumptions about the future economic conditions and credit behavior (e.g., likelihood of customers defaulting and the resulting losses). Management also applies judgement in the estimation of the contractual cash flows due from counterparties that the Group would expect to receive from the realization of any credit enhancements, including the discounting factor for recoveries beyond one year. Explanation of the inputs, assumptions and estimation used in measuring ECL is further detailed in Note 30.2(b).
(d) Determination of Net Realizable Value of Real Estate Inventories In determining the net realizable value of real estate inventories, management takes into account the most reliable evidence available at the dates the estimates are made. The future realization of the carrying amounts of real estate inventory as presented in Note 7, is affected by price changes in the different market segments as well as the trends in the real estate industry. These are considered key sources of estimation uncertainty and may cause significant adjustments to the Group’s real estate inventories within the next financial reporting period. Considering the Group’s pricing policy, the net realizable values of real estate inventories for sale are determined to be higher than their related costs.
- 36 -
(e) Estimation of Useful Lives of Property and Equipment, Investment Properties and Right-of-
use Assets The Group estimates the useful lives of property and equipment, investment properties and right-of-use assets based on the period over which the assets are expected to be available for use. The estimated useful lives of these assets are reviewed periodically and are updated if expectations differ from previous estimates due to physical wear and tear, technical or commercial obsolescence and legal or other limits on the use of the assets. The carrying amounts of property and equipment, right-of use assets and investment properties are analyzed in Notes 11, 12 and 13, respectively. Based on management’s assessment as at December 31, 2020 and 2019, there is no change in estimated useful lives of these assets during those periods. Actual results, however, may vary due to changes in estimates brought about by changes in factors mentioned.
(f) Impairment of Non-financial Assets
In assessing impairment, management estimates the recoverable amount of each asset or a cash-generating unit based on expected future cash flows and uses an interest rate to calculate the present value of those cash flows. Estimation uncertainty relates to assumptions about future operating results and the determination of a suitable discount rate (see Note 2.16). Though management believes that the assumptions used in the estimation of fair values reflected in the consolidated financial statements are appropriate and reasonable, significant changes in those assumptions may materially affect the assessment of recoverable values and any resulting impairment loss could have a material adverse effect on the results of operations. Management assessed that no impairment loss is required to be provided on its significant non-financial assets, particularly property and equipment, right-of-use assets and investment properties, as at December 31, 2020, 2019 and 2018.
(g) Valuation of Post-employment Defined Benefit Obligation
The determination of the Group’s obligation and cost of post-employment defined benefit is dependent on the selection of certain assumptions used by actuaries in calculating such amounts. Those assumptions include, among others, discount rates and salary rate increase. A significant change in any of these actuarial assumptions may generally affect the recognized expense and the carrying amount of the post-employment defined benefit obligation in the next reporting period. The amounts of post-employment defined benefit obligation and expense and an analysis of the movements in the estimated present value of post-employment defined benefit as well as the significant assumptions used in estimating such obligation are presented in Note 23.2.
- 37 -
(h) Fair Value Measurement for Investment Properties
Investment properties are measured using the cost model. The fair value of investment property held for capital appreciation and to earn rental income disclosed in the consolidated financial statements is determined by the Group based on the appraisal reports of a professional and independent appraiser. The fair value is determined by reference to market-based evidence, which is the price that would be received to sell an asset or paid to transfer a liability in an orderly transaction between market participants at the measurement date. Such amount is influenced by different factors including the location and specific characteristics of the property, quantity of comparable properties in the market, and economic condition and behavior of the buying parties. A significant change in these elements may affect prices and the value of the assets being disclosed. The fair value the Group’s investment properties as at December 31, 2020 and 2019 is disclosed in Notes 13 and 31.3.
4. SEGMENT INFORMATION 4.1 Business Segments The Group’s operating segments are organized and managed separately according to the nature of products and services provided, with each segment representing a strategic business unit that offers different products and serves different markets. The Group’s real estate segment covers the development and sale of residential and office units to individual and corporate buyers. The rental segment includes leasing of office and commercial spaces to corporate organizations. The management services segment focuses on the management of real estate projects and upkeep services to condominium corporations and housing associations. The hotel operations segment relates to the management of hotel business operations that caters hotel guest. Segment accounting policies are the same as the policies described in Note 2.20. The Group generally accounts for intersegment sales and transfers as if the sales or transfers were to third parties at current market prices. 4.2 Segment Assets and Liabilities Segment assets are allocated based on their physical location and use or direct association with a specific segment and they include all operating assets used by a segment and consist principally of operating cash, receivables, real estate inventories, property and equipment, and investment properties, net of allowances and provisions. Similar to segment assets, segment liabilities are also allocated based on their use or direct association with a specific segment. Segment liabilities include all operating liabilities and consist principally of accounts, wages, taxes currently payable and accrued liabilities. Segment assets and segment liabilities do not include deferred taxes. 4.3 Intersegment Transactions
Segment revenues, expenses and performance include sales and purchases between business segments. Such sales and purchases are eliminated in consolidation, if any.
- 38 -
4.4 Analysis of Segment Information
The following tables present revenue and profit information regarding industry segments for the years ended December 31, 2020, 2019 and 2018 and certain assets and liabilities information regarding segments as at December 31, 2020 and 2019:
2020 Management Hotel Real Estate Rental Services Operations Total
REVENUES
Sale to external customer P 8,146,432,329 P 55,237,972 P 42,591,886 P 54,558,131 P 8,298,820,318
BEFORE TAX P 2,723,628,436 P 6,637,902 P 76,396,006 ( P 57,040,969 ) P 2,749,621,375
ASSETS AND LIABILITIES
Segment assets P 40,383,454,972 P 10,109,861,036 P 26,525,944 P 397,946,646 P 50,917,788,598 Segment liabilities 33,012,060,943 29,854,341 5,536,745 186,205,150 33,233,657,179
2019 Management Hotel Real Estate Rental Services Operations Total
REVENUES
Sale to external customer P 8,390,526,495 P 63,159,194 P 36,837,490 P 8,524,756 P 8,499,047,935
Total revenues 6,807,159,656 57,480,871 36,637,343 - 6,901,277,870
COSTS AND EXPENSES
Costs of sales and services
excluding depreciation
and amortization 3,110,027,278 717,228 7,217,628 - 3,117,962,134
Operating expenses excluding depreciation
and amortization 902,417,409 557,804 125,383 - 903,100,596
Depreciation and amortization 34,376,577 18,097,781 - - 52,474,358
Impairment losses 44,779,695 - - - 44,779,695
Total costs and expenses 4,091,600,959 19,372,813 7,343,011 - 4,118,316,783
FINANCE COST (INCOME) Interest expense on:
Loans P 88,467,056 P - P - P - P 88,467,056
Post-employment defined
benefit obligation 310,716 - - - 310,716 Amortization of day one loss on
non-current contract
receivables – net 42,964,142 - - - 42,964,142
Interest income on banks ( 18,861,865 ) - - - ( 18,861,865 )
Total finance cost (income) 112,880,049 - - - 112,880,049
SEGMENT PROFIT BEFORE TAX P 2,602,678,648 P 38,108,058 P 29,294,332 P - P 2,670,081,038
The real estate segment is further analyzed based on their geographical location as shown in Note 17.1. Both rental and management services segments are located in Cebu City.
Sales to any of the Group’s major customers did not exceed 10% of the Group’s revenues in all of the years presented.
- 40 -
4.5 Reconciliation
Following is a reconciliation of the Group’s segment information to the key financial information presented in its financial statements.
2020 2019 2018 Revenues Total segment revenues P 8,388,569,028 P 8,607,247,206 P 6,901,277,870 Elimination of intersegment revenues ( 89,748,710 ) ( 108,199,271) ( 138,338,523 ) Revenues as reported in profit or loss P 8,298,820,318 P 8,499,047,935 P 6,762,939,347 Profit or loss Segment profit before tax P 2,749,621,375 P 3,145,332,597 P 2,670,081,038 Elimination of intersegment accounts ( 25,428,578 ) ( 16,033,381) ( 94,782,904 ) Other operating income 68,597,820 53,133,383 33,530,390 Share in net loss in associates ( 615,777 ) ( 326,580) ( 437,147 ) Other losses - net ( 593,932 ) ( 612,295) ( 856,990 ) Profit before tax as reported in profit or loss P 2,791,580,908 P 3,181,493,724 P 2,607,534,387 Assets Segment assets and total assets reported in statements of financial position P50,917,788,598 P 38,838,742,745 Elimination of intercompany accounts ( 827,287,155 ) ( 555,300,509) Total assets as reported in statements of financial position P50,090,501,443 P 38,283,442,236 Liabilities Segment liabilities P33,233,657,179 P 23,888,306,050 Deferred tax liabilities 1,707,563,195 1,124,886,722 Elimination of intercompany accounts ( 377,960,389 ) ( 478,008,824) Total liabilities as reported in statements of financial position P34,563,259,985 P 24,535,183,948
5. CASH AND CASH EQUIVALENTS
Cash and cash equivalents include the following components as at December 31: 2020 2019 Cash on hand P 3,929,500 P 3,915,691 Cash in banks 751,514,323 749,160,824 Short-term placements 41,740,967 164,094,136 P 797,184,790 P 917,170,651
- 41 -
Cash in banks (savings and demand deposits) generally earn interest based on daily bank deposit rates. Short-term placements are made for varying period from 10 to 90 days and earn effective interest ranging from 1.19% to 2.20%, 1.74% to 6.00% and 3.18% to 4.52% per annum in 2020, 2019 and 2018, respectively. Interest income earned from cash and cash equivalents amounted to P8,701,101, P24,599,602 and P18,861,865 in 2020, 2019 and 2018, respectively, and are presented as part of Finance Income in the consolidated statements of profit or loss (see Note 22).
6. RECEIVABLES This account includes the following: Notes 2020 2019 Contract receivables: Third parties P5,550,553,929 P 5,389,904,540 Related parties 25.3, 25.4 257,432,271 166,101,518 Rent receivable 66,636,064 68,073,716 Retention receivable 57,707,728 24,261,678 Management fee receivable 27,506,262 13,465,493 Advances to officers and employees 16,558,780 50,467,948 Other receivables 166,164,422 164,136,262 6,142,559,456 5,876,411,155 Allowance for impairment 30.2(c) ( 600,694 ) ( 348,217 ) P 6,141,958,762 P 5,876,062,938 Receivables are presented in the consolidated statements of financial position as follows. 2020 2019 Current P6,020,754,434 P 5,204,137,996 Non-current 121,204,328 671,924,942 P6,141,958,762 P 5,876,062,938 Buyers of real estate properties are given two to four years to complete the equity amortization which ranges from 10% to 30% of the contract price of the real estate being purchased. Contract receivables, which are all covered by postdated checks, are only recognized when the collection of total transaction price is reasonably assured and the corresponding revenue is recognized. Generally, full payment by buyers of their equity amortization is followed by full settlement by the buyer’s chosen financing institution of the buyer’s account within 12 months. Title to real estate properties are transferred to the buyers once full payment has been made. Hence, Contracts receivables are fully secured by the real properties acquired by buyers.
- 42 -
Long-term contract receivables, which are noninterest-bearing, are receivables from buyers whose equity payments are expected to be fully paid after 12 months following the end of the reporting period. These are measured at amortized cost which is determined by discounting future cash flows using the applicable rates of similar types of instruments. The aggregate unamortized discount on noninterest-bearing contract receivables amounts to P2,461,014 and P33,222,449 as at December 31, 2020 and 2019, respectively. Amortization of day one gain of noninterest-bearing contract receivables, net of day one loss of P2,406,895 and P31,437,731 recognized in those years, respectively, amounted to P30,761,435 and P26,971,237 in 2020 and 2019, respectively, and presented as part of Finance Income in the consolidated statements of profit or loss (see Note 22). On the other hand, in 2018, the Group has day one loss on noninterest-bearing contract receivables, net of amortization of day one gain of P15,993,069, amounting to P42,964,142, and is presented as part of Finance Costs in the 2018 consolidated statement of profit or loss (see Note 21). Retention receivable represents amounts retained by Home Development Mutual Fund (HDMF) from the proceeds of loans availed by real estate buyers in accordance with HDMF Circular No. 182-A to pay off their obligations to the Group, which will be received three to four months after release of loan. The Group assesses an ECL when the receivables from contract with customers and other counterparties are initially recognized and update the assessment at each reporting date based on the analysis determined by management. A reconciliation of the allowance for impairment at the beginning and end of 2020 and 2019 is shown below. 2020 2019 Balance at beginning of year P 348,217 P 20,352,667 Impairment losses 252,478 - Reversal of impairment losses - ( 20,004,450 ) Balance at end of year P 600,695 P 348,217
7. REAL ESTATE INVENTORIES
This account includes the following inventories, which are all at cost. Note 2020 2019 Subdivision units P 419,174,144 P 876,676,564 Condominium units 696,385,131 811,662,344 1,115,559,275 1,688,338,908 Construction-in-progress (CIP): Land development costs 4,549,275,173 2,883,486,160 Condominium building costs 2,391,243,922 2,393,465,506 Housing costs 1,096,020,640 369,214,409 8,036,539,735 5,646,166,075 Raw land inventory 8 4,246,082,837 2,128,727,220 P 13,398,181,847 P 9,463,232,203
- 43 -
An analysis of the cost of real estate inventory included in cost of sales is presented in Note 18. Land development costs pertain to the cost of land acquisition, and site development costs of horizontal projects and other future site projects of the Group. Condominium building costs consist of the cost of land and the cost to construct the units of the vertical projects of the Group. Housing costs pertain to the cost of house construction for the horizontal projects of the Group. Raw land inventory consists of parcels of land owned by the Group in various locations. These are expected to be developed into saleable condominium or subdivision units. In 2020 and 2019, the Group reclassified deposits on land for future development amounting to P1,457,731,053 and P4,664,764,665, respectively, to raw land inventory, i.e., applied as part of the payment for the land acquisitions that were consummated during the reporting period (see Note 8). On July 16, 2020, CLI entered into a subscription contact with GGTT, whereby CLI agreed to subscribe to 500,000 shares of GGTT after SEC’s approval of GGTT’s application for increase in authorized capital stock, for a subscription price of P177,730,000 or P355.46 per share. Prior to and at the time of subscription of CLI, substantially all of the fair value of the gross assets of GGTT is concentrated in a single identifiable asset, which is a parcel of land. After its subscription to the shares of GGTT, CLI now holds 50% ownership interest in GGTT. However, in accordance with the Group’s policy (see Notes 2.4 and 3), the transaction is accounted for by the Group as an asset acquisition since the transaction does not constitute an acquisition of a business (see also Note 1.2). As such the total purchase price at acquisition date amounting to P177,730,000 was allocated to the land and is included as part of raw land inventory as of December 31, 2020. Borrowing costs that are capitalized as part of real estate inventory amounted to P898,039,007 and P642,126,984 in 2020 and 2019, respectively, which represents the general and specific borrowing costs incurred on loans and corporate notes obtained to fund the construction projects (see Note 15). Capitalization rate used for general borrowings ranges from 1.98% to 6.25% and 3.72% to 6.50% for the years ended December 31, 2020 and 2019, respectively. In 2020 and 2019, the Group reclassified investment properties totaling P997,649,685 and P100,474,287, respectively, to real estate inventories (see Note 13). As at December 31, 2020 and 2019, real estate inventories totaling to P6,313,953,917 and P9,119,780,130, respectively, are used as collateral for certain interest-bearing loans and borrowings of the Parent Company (see Note 15.1).
- 44 -
8. DEPOSITS ON LAND FOR FUTURE DEVELOPMENT
Currently, this account includes only advance payments for acquisitions of certain parcels of land which are intended for future development into saleable real estate projects (see Note 2.7). A reconciliation of the deposits on land for future development is presented below. Notes 2020 2019 Balance at the beginning of year P1,289,398,997 P 1,754,763,446 Additions 868,104,916 5,324,158,749 Transferred to raw land inventory 7 ( 1,457,731,053 ) ( 4,644,764,665 ) Transferred to investment properties 13 - ( 1,144,758,533 ) Balance at end of year P 699,772,860 P 1,289,398,997
The deposits on land for future development is presented as current assets in the consolidated statements of financial position.
9. PREPAYMENTS AND OTHER CURRENT ASSETS
This account includes the following: 2020 2019 Advances to subcontractors P1,087,635,323 P 698,243,154 Prepaid commissions 862,373,242 546,134,504 Input VAT and deferred input VAT 684,996,056 518,266,344 Advances to suppliers 288,283,971 353,197,037 Prepaid expenses 64,561,537 131,725,809 Others 32,019,552 17,937,558 P 3,019,869,681 P 2,265,504,406 Advances to subcontractors include advance payments for materials, payment of labor and overhead expenses for on-going construction of subdivision and condominium units for sale. These are applied against the progress billings of subcontractors. In 2020, 2019 and 2018, the Group expensed prepaid commissions of P429,725,150, P301,751,479 and P264,860,997, respectively, based on the POC of its related real estate project and is presented as Commissions under Operating Expenses in the consolidated statements of profit or loss (see Note 19) Prepaid expenses include advance payment for insurance and rent.
- 45 -
10. INVESTMENTS IN ASSOCIATES
A reconciliation of the carrying amounts of investments in associates at the beginning and end of 2020 and 2019 is shown below.
2020 2019
Balance at beginning of year P 16,378,423 P 11,205,003 New and additional investments 114,090,016 5,500,000 Share in net loss during the year ( 615,777 ) ( 326,580 )
Balance at end of year P 129,852,662 P 16,378,423 An analysis of the carrying amount of the Parent Company’s investments in associates as at December 31, 2020 is shown below.
Magspeak MDC ICOM Total Cost Balance at beginning of year P 10,635,096 P 11,600,000 P - P 22,235,096 Additional investment 7,600,000 10,000,000 96,490,016 114,090,016 Balance at end of year 18,235,096 21,600,000 96,490,016 136,325,112 Accumulated equity in net losses Balance at beginning of year ( 542,354 ) ( 5,314,319 ) - ( 5,856,673 ) Equity in net loss during the year ( 307,343 ) ( ______227,363 ) ( 81,071 ) ( 615,777 ) Balance at end of year ( 849,697 ) ( 5,541,682 ) ( 81,071 ) ( 6,472,450 ) Net carrying amount P 17,385,399 P 16,058,318 P 96,408,945 P 129,852,662
An analysis of the carrying amount of the Parent Company’s investments in associates as at December 31, 2019 is shown below.
Magspeak MDC Total Cost Balance at beginning of year P 5,135,096 P 11,600,000 P 16,735,096 Additional investment 5,500,000 - 5,500,000 Balance at end of year 10,635,096 11,600,000 22,235,096 Accumulated equity in net losses Balance at beginning of year ( 130,765 ) ( 5,399,328 ) ( 5,530,093) Equity in net profit (loss) during the year ( 411,589 ) 85,009 ( 326,580) Balance at end of year ( 542,354 ) ( 5,314,319 ) ( 5,856,673) Net carrying amount P 10,092,742 P 6,285,681 P 16,378,423
- 46 -
(a) Magspeak
Significant information on the financial position and financial performance of Magspeak as at and for the year ended December 31, 2020 and 2019 are as follows: 2020 2019 Current assets P 33,657,703 P 23,553,459 Non-current assets 16,828,516 16,828,516 Total assets P 50,486,219 P 40,381,975 Current liabilities P 7,696,167 P 11,000 Non-current liabilities - - Total liabilities P 7,696,167 P 11,000 Revenues P - P -
Net loss ( P 1,233,204 ) ( P 240,780 ) Other comprehensive income - - Total comprehensive loss ( P 1,233,204 ) ( P 240,780 ) The Parent Company’s share in the net assets of Magspeak as of December 31, 2020 and 2019 which agrees with the carrying amount of the investment in CPH is shown below.
2020 2019 Net assets of Magspeak P 43,258,879 P 30,429,032 Proportion of equity interest by the Parent Company 25% 25% Parent Company’s share in the net assets of Magspeak 10,814,720 10,092,742 Other stockholders unpaid subscription 6,570,679 -
Carrying amount of investment P 17,385,399 P 10,092,742
(b) MDC
Significant information on the financial position and financial performance of MDC as at and for the year ended December 31, 2020 and 2019 are as follows: 2020 2019
Current assets P 65,955,938 P 30,519,382 Non-current assets - - Total assets P 65,955,938 P 30,519,382
- 47 -
2020 2019 Current liabilities P 1,664,545 P 90,975 Non-current liabilities - - Total liabilities P 1,664,545 P 90,975
Revenues P - P - Net loss ( P 1,137,438 ) ( P 425,045 ) Other comprehensive income - - Total comprehensive loss ( P 1,137,438 ) ( P 425,045 )
The Parent Company’s share in the net assets of MDC as of December 31, 2020 and 2019 which agrees with the carrying amount of the investment in CPH is shown below. 2020 2019 Net assets of MDC P 64,291,393 P 30,429,032 Proportion of equity interest by the Parent Company 20% 20% Parent Company’s share in the net assets of MDC 12,858,279 6,085,806 Other stockholders unpaid subscription 3,200,040 199,875
Carrying amount of investment P 16,058,318 P 10,092,742
(c) ICOM AIR Significant information on the financial position and financial performance of ICOM as at and for the year ended December 31, 2020 are as follows: Current assets P 10,814,980 Non-current assets 282,680,639 Total assets P 293,495,619 Current liabilities P 28,292,126 Non-current liabilities - Total liabilities P 28,292,126 Revenues P - Net loss ( P 243,207 ) Other comprehensive income - Total comprehensive loss ( P 243,207 )
- 48 -
The Parent Company’s share in the net assets of ICOM as of December 31, 2020 which agrees with the carrying amount of the investment in ICOM is shown below.
Net assets of ICOM P 265,203,493 Proportion of equity interest by the Parent Company 33% Parent Company’s share in the net assets of ICOM 88,401,164
Other stockholders unpaid subscription 8,007,781
Carrying value of investment P 96,408,945
Shares in net losses of associates totaling P678,066, P326,580 and P437,147 were recognized in 2020, 2019 and 2018, respectively, in the consolidated statements of profit or loss. There were no dividends received from the Group’s associates in 2020, 2019 and 2018.
11. PROPERTY AND EQUIPMENT The gross carrying amounts and accumulated depreciation and amortization of property and equipment at the beginning and end of 2020 and 2019 are shown below. Office Transportation Furniture Leasehold Construction Land Building Equipment Equipment and Fixture Improvements in Progress Total December 31, 2020 Cost P 140,896,820 P 255,033,535 P 70,755,434 P 46,189,920 P 28,848,061 P 4,585,537 P 269,748,169 P 816,057,476 Accumulated depreciation and amortization - ( 84,445,236 ) ( 31,271,468 ) ( 33,586,991) ( 19,911,373 ) ( 3,454,802 ) - ( 172,669,870 ) Net carrying amount P 140,896,820 P 170,588,299 P 39,483,966 P 12,602,929 P 8,936,688 P 1,130,735 P 269,748,169 P 643,387,606 December 31, 2019 Cost P 139,794,060 P 150,489,580 P 62,468,842 P 41,012,216 P 26,085,688 P 2,330,639 P 72,079,085 P 494,260,110 Accumulated depreciation and amortization - ( 67,413,259 ) ( 23,635,550 ) ( 29,791,432 ) ( 16,065,951 ) ( 2,232,938 ) - ( 139,139,130 ) Net carrying amount P 139,794,060 P 83,076,321 P 38,833,292 P 11,220,784 P 10,019,737 P 97,701 P 72,079,085 P 355,120,980
January 1, 2019 Cost P 139,198,121 P 147,503,733 P 52,750,891 P 50,638,536 P 21,833,195 P 2,355,282 P 16,673,810 P 430,953,568 Accumulated depreciation and amortization - ( 46,341,468 ) ( 17,125,820 ) ( 26,982,786 ) ( 12,790,293 ) ( 1,992,481 ) - ( 105,232,848 ) Net carrying amount P 139,198,121 P 101,162,265 P 35,625,071 P 23,655,750 P 9,042,902 P 362,801 P 16,673,810 P 325,720,720
A reconciliation of the carrying amounts of property and equipment at the beginning and end of 2020 and 2019 is shown below. Office Transportation Furniture Leasehold Construction Land Building Equipment Equipment and Fixture Improvements in Progress Total Balance at January 1, 2020 net of accumulated depreciation and amortization P 139,794,060 P 83,076,321 P 38,833,292 P 11,220,784 P 10,019,737 P 97,701 P 72,079,085 P 355,120,980 Additions - 19,542,518 8,286,592 5,177,704 2,762,373 2,254,898 197,669,084 235,693,169 Reclassification 1,102,760 85,001,437 - - - - 86,104,197 Depreciation and amortization for the year - ( 17,031,977 ) ( 7,635,918) ( 3,795,559 ) ( 3,845,422 ) ( 1,221,864 ) - ( 33,530,740 ) Net carrying amount P 140,896,820 P 170,588,299 P 39,483,966 P 12,602,929 P 8,936,688 P 1,130,735 P 269,748,169 P 643,387,606
- 49 -
Office Transportation Furniture Leasehold Construction Land Building Equipment Equipment and Fixture Improvements in Progress Total
Balance at January 1, 2019 net of accumulated depreciation and amortization P 139,198,121 P 101,162,265 P 35,625,071 P 23,655,750 P 9,042,902 P 362,801 P 16,673,810 P 325,720,720 Additions 595,939 2,985,847 9,964,093 7,152,251 4,535,518 - 55,405,275 80,638,923 Reclassification - - ( 246,142 ) ( 16,778,571 ) ( 144,982 ) ( 24,643 ) - ( 17,194,338 ) Depreciation and amortization for the year - ( 21,071,791 ) ( 6,509,730 ) ( 2,808,646 ) ( 3,413,701 ) ( 240,457 ) - ( 34,044,325 ) Net carrying amount P 139,794,060 P 83,076,321 P 38,833,292 P 11,220,784 P 10,019,737 P 97,701 P 72,079,085 P 355,120,980 Balance at January 1, 2018 net of accumulated depreciation and amortization P - P 119,673,564 P 35,611,815 P 8,523,765 P 10,005,903 P 550,686 P 603,709 P 174,969,442 Additions 139,198,121 3,579,103 5,674,806 16,907,688 2,455,740 49,286 16,070,101 183,934,845 Depreciation and amortization for the year - ( 22,090,402 ) ( 5,661,550 ) ( 1,775,703 ) ( 3,418,741 ) ( 237,171 ) - ( 33,183,567 ) Net carrying amount P 139,198,121 P 101,162,265 P 35,625,071 P 23,655,750 P 9,042,902 P 362,801 P 16,673,810 P 325,720,720
Depreciation and amortization expense on property and equipment is presented as part of Operating Expenses (see Note 19).
In 2020, the Group reclassified certain retail building previously presented as Investment Properties with an aggregate amount of P86,104,197 to property and equipment (see Note 13) because CLI used these units as one of its offices starting 2020. Certain building, office equipment, furniture and fixtures and leasehold improvements with a total carrying amount of P64,404,721 and P70,260,964 as at December 31, 2020 and 2019, respectively, are used as collateral for certain interest-bearing loans and borrowings of the Parent Company (see Note 15.1). As at December 31, 2020 and 2019, the cost of the Group’s fully depreciated property and equipment that are still used in operations amounts to P80,220,251 and P67,434,959, respectively.
12. LEASES In 2020 and 2019, the Group entered into lease contracts, as lessee, for leases of land and an office space. With the exception of short-term leases and leases of low-value underlying assets, each lease is presented in the consolidated statements of financial position as Right-of-use Assets and the corresponding obligation, as Lease Liabilities. Variable lease payments which do not depend on an index or a rate are excluded from the initial measurement of the lease liability and asset. Each lease generally imposes a restriction that, unless there is a contractual right for the Group to sublease the asset to another party, the right-of-use asset can only be used by the Group. Leases are either non-cancellable or may only be cancelled by incurring a substantive termination fee. Some leases contain an option to purchase the underlying lease asset outright at the end of the lease, or to extend the lease for a further term. Under the lease contracts, the Group is prohibited from selling or pledging the underlying leased assets as security. For the lease of an office space, the Group must keep the related property in a good state of repair and return the property in good state at the end of the lease. For the lease on the land, the Group must insure all the improvements made on the property.
- 50 -
The table below describes the nature of the Group’s leasing activities by type of right-of-use asset recognized in the 2020 and 2019 consolidated statement of financial position.
Number of Number of Number of right Number of leases with leases with of-use assets Lease leases with purchase termination leased term extension option option options
Land 2 40 - 43 years - - -
Office space 1 3 years 1 - 1
12.1 Right-of-use Assets
The carrying amounts of the Group’s right-of-use assets as at December 31, 2020 and 2019 and the movements during the year are shown below.
Land Office Space Total
December 31, 2020 Cost Balance at beginning of year P 171,439,329 P 8,556,881 P 179,996,210 Additions 818,482,704 - 818,482,704 Amendment of lease contract ( 18,685,338 ) - ( 18,685,338 ) Balance at end of year 971,236,695 8,556,881 979,793,576 Accumulated amortization Balance at beginning of year 4,285,983 950,764 5,236,747 Amortization 22,022,497 1,629,883 23,652,380 Balance at end of year 26,308,480 2,580,647 23,652,380
Carrying amount at December 31, 2020 P 944,928,215 P 5,976,234 P950,904,449 December 31, 2019 Cost Balance at beginning of year P - P - P - Additions 171,439,329 8,556,881 179,996,210 Balance at end of year 171,439,329 8,556,881 179,996,210 Accumulated amortization Balance at beginning of year - - - Amortization 4,285,983 950,764 5,236,747 Balance at end of year
Carrying amount at December 31, 2019 P 167,153,346 P 7,606,117 P 174,759,463 The additional right-of-use assets in 2020 pertains to a lease contract for a period of 43 years covering a piece of land which will be the site of another real estate project (leasing and hotel operations) of the Group.
- 51 -
12.2 Lease Liabilities
Lease liabilities presented in the consolidated statement of financial position as follows:
2020 2019 Current P 1,634,080 P 1,775,306 Non-current 833,099,895 138,501,152 P 834,733,975 P 140,276,458
The Group is fully liable for the rentals on the remaining term of the lease of office space, including any interest, penalties, utility charges and damages for termination prior to expiration of the contract. The contract of lease on land does not provide for any future lease termination and extension options. The Group paid an advanced rental of P100,944,000 and P50,000,000 in 2020 and 2019, respectively, at the start of the lease of land and will be applied to the first three to five years of the lease term. This amount was deducted to the lease liabilities as at December 31, 2020 and 2019. The lease liabilities are secured by the related underlying assets. The undiscounted maturity analysis of lease liabilities are as follows:
Within 1 to 2 2 to 3 3 to 4 4 to 5 More than 1 year years years years years 5 years Total December 31, 2020 Lease payments P 38,469,635 P 20,241,703 P 37,437,295 P 37,880,948 P 37,189,895 P3,178,713,559 P 3,349,933,035 Finance charges ( 36,835,555 ) ( 81,689,153 ) ( 62,378,791 ) ( 64,316,641 ) ( 66,399,267 ) ( 2,203,579,653 ) ( 2,515,199,060 ) Net present values P 1,634,080 P 39,986,155 P 24,941,496 P 26,435,693 P 29,209,372 P 975,133,906 P 834,733,975 December 31, 2019 Lease payments P 2,175,863 P 1,838,143 P 1,930,050 P 3,027,053 P 13,410,229 P 699,967,572 P 722,348,910 Finance charges ( 400,557 ) ( 321,592 ) ( 233,053 ) ( 134,141 ) ( 1,035,489 ) ( 579,947,620 ) ( 582,072,452 ) Net present values P 1,775,306 P 1,516,551 P 1,696,997 P 1,892,412 P 12,374,740 P 121,020,452 P 140,276,458
12.3 Lease Payments Not Recognized as Liabilities
The Group has elected not to recognize a lease liability for short-term leases or for leases of low-value assets. Payments made under such leases are expensed on a straight-line basis. In addition, certain variable lease payments are not permitted to be recognized as lease liabilities and are expensed as incurred. The expense relating to short-term leases and low-value assets has an aggregate amount of P18,441,626, P33,941,185 and P15,275,105 in 2020, 2019 and 2018, respectively, and is presented as Rent under Operating Expenses in the consolidated statements of profit of loss (see Note 19).
12.4 Additional Profit or Loss and Cash Flow Information
The total cash outflow in respect of leases amounted to P162,467,669 and P50,567,000 in 2020 and 2019, respectively. These include the interest expense in relation to the lease liabilities amounting to P57,127,820 and P10,847,248, respectively, for the same periods ended, and is presented as part of Interest expense on lease liabilities under Finance Costs in the consolidated statement of profit or loss (see Note 21).
- 52 -
13. INVESTMENT PROPERTIES
The Group’s investment properties include parcels of land held for development of properties, condominium units and retail building for lease. The gross carrying amounts and accumulated depreciation of investment properties at the beginning and end of 2020 and 2019 are shown below.
Retail Condominium Parking Construction Building Units Units Land in Progress Total
December 31, 2020 Costs P 595,061,927 P 551,960,802 P 31,371,804 P 5,742,622,708 P 3,287,906,544 P10,208,923,785 Accumulated depreciation ( 33,635,295) ( 75,583,112) ( 5,962,316) - - ( 115,180,723 ) Carrying amount P 561,426,632 P 476,377,690 P 25,409,488 P 5,742,622,708 P 3,287,906,544 P10,093,743,062 December 31, 2019 Costs P 100,228,005 P 285,413,555 P 31,371,804 P 5,742,274,541 P 2,821,044,269 P 8,980,332,174 Accumulated depreciation ( 15,112,259) ( 55,981,489) ( 4,393,726) - - ( 75,487,474 ) Carrying amount P 85,115,746 P 229,432,066 P 26,978,078 P 5,742,274,541 P 2,821,044,269 P 8,904,844,700 January 1, 2019 Costs P 45,228,005 P 285,413,555 P 31,371,804 P 4,576,694,945 P 816,408,411 P 5,755,116,720 Accumulated depreciation ( 11,475,859) ( 41,710,811) ( 2,825,136) - - ( 56,011,806 ) Carrying amount P 33,752,146 P 243,702,744 P 28,546,668 P 4,576,694,945 P 816,408,411 P 5,699,104,914
A reconciliation of the carrying amounts of investment properties at the beginning and end of year 2020 and 2019 is shown below.
Retail Condominium Parking Construction Building Units Units Land in Progress Total Balance at January 1, 2020 net of accumulated depreciation P 85,115,746 P 229,432,066 P 26,978,078 P 5,742,274,541 P 2,821,044,269 P 8,904,844,700 Additions - - 348,167 2,311,995,526 2,312,343,693 Reclassifications 494,833,922 266,547,247 - - ( 1,845,133,252) ( 1,083,752,083 ) Depreciation during the year ( 18,523,036) ( 19,601,623) ( 1,568,590) - - ( 39,693,249)
Balance at December 31, 2020 net of accumulated depreciation P 561,426,632 P 476,377,690 P 25,409,488 P 5,742,622,708 P 3,287,906,544 P10,093,743,062 Balance at January 1, 2019 net of accumulated depreciation P 33,752,146 P 243,702,744 P 28,546,668 P 4,576,694,945 P 816,408,411 P 5,699,104,914 Additions 55,000,000 - - 20,821,063 2,456,595,714 2,532,416,777 Reclassifications - - - 1,144,758,533 ( 451,959,856) 692,798,677 Depreciation during the year ( 3,636,400) ( 14,270,678) ( 1,568,590) - - ( 19,475,668 )
Balance at December 31, 2019 net of accumulated depreciation P 85,115,746 P 229,432,066 P 26,978,078 P 5,742,274,541 P 2,821,044,269 P 8,904,844,700
In 2020, the Group reclassified investment properties totaling P997,649,685 and P86,104,197 to real estate inventories and property and equipment, respectively (see Note 7). In 2019, deposits on land for future development of 1,144,758,533 were transferred to investment properties (see Note 8) and investment properties of P451,959,856 were reclassified to real estate inventories (see Notes 7). Borrowing costs that are capitalized as part of investment property amounted to P224,350,878 and P160,418,146 in 2020 and 2019, respectively, which represents the general and specific borrowing costs incurred on loans and corporate notes obtained to fund the construction projects (see Note 15).
Income and expenses from investment properties for the years ended December 31, 2020, 2019 and 2018 are presented below.
- 53 -
Notes 2020 2019 2018 Rental income: 17.1 Retail building P 52,925,898 P 32,594,457 P 21,801,714 Condominium units 1,837,157 29,929,142 35,062,970 Parking units 474,917 635,595 616,187 P 55,237,972 P 63,159,194 P 57,480,871 Expenses: Depreciation P 39,693,249 P 19,475,668 P 18,097,781 Real property taxes - 179,375 717,228 18 P 39,693,249 P 19,655,043 P 18,815,009 The expenses are included as part of Cost of Sales and Services in the consolidated statements of profit or loss in 2020, 2019 and 2018 (see Note 18).
Investment properties have a total fair value of P11,943,650,421 and P10,242,045,810 as at December 31, 2020 and 2019, respectively, based on the appraisal done by an independent expert [see Note 31.3(c)]. On the basis primarily of the foregoing valuations, management has assessed that no impairment loss is required to be provided on the Group’s investment properties as at December 31, 2020 and 2019 [see also Note 3.2(f)].
Investment property with a total carrying amount of P1,798,577,632 and P1,041,408,890 as at December 31, 2020 and 2019, respectively, are used as collateral for certain interest-bearing loans and borrowings of the Parent Company (see Note 15.1).
14. OTHER NON-CURRENT ASSETS
This account includes the following: 2020 2019 Advances to subcontractors P 209,505,401 P - Refundable deposits 78,003,269 66,028,148 Deposits on Computer software – net of accumulated amortization of P14,162,057 and P6,918,804, respectively 35,869,967 34,153,195 Advance payment for future investment in equity securities 5,468,752 5,468,752 Deferred input VAT 5,549,979 4,624,926 Others 2,647,358 2,313,425 P 337,044,725 P 112,588,446 Advances to subcontractors include advance payments for materials, payment of labor and overhead expenses for on-going construction of investment properties. These are applied against the progress billings of subcontractors.
- 54 -
Refundable deposits pertain to recoverable payments, which are expected to be realized at the termination of the contract, to lessors and various payees. These are measured at amortized cost. The total additions to computer software amounted to P8,960,023, P33,955,601 and P1,620,697 in 2020, 2019 and 2018, respectively. The amortization expense on the computer software amounted to P7,243,253, P2,007,251 and P1,193,010 in 2020, 2019 and 2018, respectively, and is presented as part of Depreciation and amortization under Operating Expenses (see Note 19).
15. INTEREST-BEARING LOANS AND BORROWINGS
The outstanding balance of interest-bearing loans and corporate notes are presented in the consolidated statements of financial position as follows: Note 2020 2019 Current Bank loans 15.1 P 1,416,685,017 P 2,627,759,378 Corporate notes 15.2 2,017,857,143 - 3,434,542,160 2,627,759,378 Non-current Bank loans 15.1 7,533,149,676 7,295,952,571 Corporate notes 15.2 12,826,291,875 6,923,044,628 20,359,441,551 14,218,997,199
P23,793,983,711 P16,846,756,577
15.1 Bank Loans
An analysis of the movements in the balance of interest-bearing loans is presented below.
2020 2019
Balance at beginning of year P 9,923,711,949 P 7,695,350,556 Proceeds and drawdowns – net 4,692,123,374 6,487,770,230 Repayments ( 5,672,248,77 ) ( 4,265,207,842 ) Amortization of debt issue costs 6,248,142 5,799,005
Balance at end of year P 8,949,834,693 P 9,923,711,949
The unamortized debt issue cost as at December 31, 2020 and 2019 amounts to P22,600,198 and P 22,038,714, respectively. A reconciliation of the unamortized debt issue cost at the beginning and end of 2020 and 2019 is shown below.
2020 2019 Balance at beginning of year P 22,038,714 P 7,145,451 Debt issue costs from new loans 6,809,626 20,692,268 Amortization of debt issue cost ( 6,248,142 ) ( 5,799,005 ) Balance at end of the year P 22,600,198 P 22,038,714
- 55 -
The loans bear interest rates per annum ranging from 1.84% to 7.13% in 2020, 3.71% to 7.75% in 2019 and 2.75% to 7.37% in 2018. Certain loans are collateralized by the specific projects and developments and certain property and equipment for which the loans were obtained. The cost of such projects aggregating to P8,176,936,270 and P10,231,449,984 as at December 31, 2020 and 2019, respectively, are included in the Real Estate Inventory, Property and Equipment and Investment Properties accounts in the consolidated statements of financial position (see Notes 7, 11 and 13). In 2020, the Group availed of new bank loans totaling P4,692,123,374, net of debt issuance cost, which bear interest ranging from 4.00% to 6.25% and have maturity dates ranging from 2021 to 2027. Loans obtained in 2019 from various commercial banks totaling P6,487,770,230, net of debt issuance cost, bear interest ranging from 4.18% to 6.50% and have maturity dates ranging from 2020 to 2034. The total interest incurred from the foregoing loans, including amortization of debt issuance cost, amounted to P475,802,271, P469,894,618 and P290,309,916 in 2020, 2019 and 2018, respectively, and of which P473,363,035, P436,265,022 and P221,240,157 were capitalized as part of construction costs (see Notes 7 and 13).
15.2 Corporate Notes The Parent Company and various financial institutions executed a Notes Facility Agreement (NFA) for the issuance of long-term corporate notes (LTCN) and short-dated note (SDN) amounting to P13,000,000,000 and P2,000,000,000, respectively. 2020 2019 Balance at beginning of year P6,923,044,628 P 2,945,929,755 Proceeds and drawdowns – net 7,891,875,689 3,965,935,843 Amortization of debt issue cost 29,228,701 11,179,030 Balance at end of the year P14,844,149,018 P 6,923,044,628
The NFA is composed of the following tranches: Date Principal NFA Executed Tranche Tenor Amount
LTCN 03/05/2020 Series D Five years P 1,300,000,000 Series E Seven years 5,700,000,000 Series F Ten years 1,000,000,000 07/20/2018 Series A Seven years 2,500,000,000 Series B Ten years 1,000,000,000 Series C Ten years with repricing on the interest rate re-setting date 1,500,000,000 P13,000,000,000
SDN 10/25/2019 18 months from drawdown date P 2,000,000,000
- 56 -
The Parent Company made the following drawdowns from the NFA. Interest Year Tranche Rate Maturity Dates Amount 2020 Series D 3.46% September 2025 P 1,300,000,000 Series E 4.00% - 4.66% April 2027 5,700,000,000 Series F 4.23% - 5.23% March 2030 1,000,000,000 P 8,000,000,000 2019 Series A 7.25% January 2026 P 2,000,000,000 SDN 4.75% April 2021 2,000,000,000 P 4,000,000,000 2018 Series A 7.25% December 2025 P 500,000,000 Series B 6.63% August – September 2028 1,000,000,000 Series C 6.75% October – December 2028 1,500,000,000
P 3,000,000,000 In 2020 and 2019, the Parent Company recognized debt issuance costs for new NFA amounting to P108,124,311 and P34,064,157, respectively, which has a carrying amount of P185,079,683 and P76,955,372 as at December 31, 2020 and 2019, respectively, in relation to the drawdowns from the NFA. The debt issuance cost amortization in 2020 and 2019 amounted to P29,228,701 and P11,179,030 , respectively. The debt issuance costs are deducted from the fair value or issue price of the note. The total interest incurred related to the NFA, including amortization of debt issuance cost, amounted to P655,265,056 and P366,280,108 in 2020 and 2019, respectively, of which P649,026,850 and P366,280,108 was capitalized as part of real estate inventories and investment properties in 2020 and 2019, respectively (see Notes 7 and 13).
The Parent Company is required to maintain the financial ratios with respect to (a) maximum debt to equity ratio of 2.5:1; (b) minimum current ratio of 1:1; and, (c) minimum interest coverage ratio of 3:1. As of December 31, 2020 and 2019, the Parent Company is compliant with the requirements.
The total interest expense related to the above loans, which are included as part of Finance Costs in the consolidated statements of profit or loss, amounted to P8,677,442, P33,629,596 and P88,467,056 in 2020, 2019 and 2018, respectively (see Note 21). The accrued interest on these loans amounts to P125,799,424 and P77,568,113 as of December 31, 2020 and 2019, respectively, and is presented as part of Accrued expenses under the Trade and Other Payables account in the consolidated statements of financial position (see Note 16).
- 57 -
16. TRADE AND OTHER PAYABLES
This account is composed of the following: Note 2020 2019
Current: Unbilled construction costs P 3,444,486,727 P 1,739,034,574 Trade payables 1,717,167,163 2,255,668,095 Sales commissions payable 1,251,685,699 903,229,455 Retention payable 320,853,275 343,069,374 Accrued expenses 15 153,204,848 116,222,019 Output VAT 99,119,283 28,736,523 Government-related obligations 28,764,646 76,456,523 Advances from NCI for future stock subscription in subsidiaries - 20,000,000 Other payables 241,950,723 219,493,465 7,257,232,364 5,701,910,028 Non-current: Retention payable 209,603,913 67,508,171 Advance rental 14,493,616 10,006,362 Other payables 2,336,904 4,102,433 226,434,433 81,616,966 P 7,483,666,797 P 5,783,526,994 Trade payables mainly represent outstanding obligations to owners of parcels of land acquired, subcontractors and suppliers of construction materials. Unbilled construction costs pertain to estimated obligations to contractors for services already performed but not yet billed to the Group. Retention payable pertains to amount withheld from payments made to contractors to ensure compliance and completion of contracted projects equivalent to 10% of every billing made by the contractor. Portion of the amount retained that is not expected to be paid within 12 months from the end of the reporting period is presented as part of non-current liabilities in the consolidated statements of financial position.
Accrued expenses pertain to accruals for interest, contracted services, security services, professional fees and other recurring accruals in the Group’s operations. Current portion of the other payables are mostly construction bonds from various subcontractors.
- 58 -
17. REVENUE FROM CONTRACTS WITH CUSTOMERS AND CONTRACT
BALANCES 17.1 Disaggregation of Contract Revenues The Group derives revenue from the transfer of goods and services over time and at a point in time. Presented below are revenues from its major product lines and geographical areas for the year ended December 31, 2020. Cebu Visayas Mindanao Luzon Total Sale of real estate units Over time P 3,930,384,286 P 1,910,041,689 P 1,781,112,311 P - P 7,621,538,286 At a point in time 387,048,809 - 99,985,234 37,860,000 524,894,043 4,317,433,095 1,910,041,689 1,881,097,545 37,860,000 8,146,432,329 Lease of properties Over time 55,237,972 - - - 55,237,972 Hotel operations Over time 54,558,131 - - - 54,558,131 Render of management services Over time 29,162,597 - 6,709,289 6,720,000 42,591,886 P 4,456,391,795 P 1,910,041,689 P 1,887,806,834 P 44,580,000 P 8,298,820,318
Presented below are revenues from its major product lines and geographical areas for the year ended December 31, 2019.
Cebu Visayas Mindanao Luzon Total Sale of real estate units Over time P 3,275,592,365 P 1,682,132,713 P 1,659,000,384 P - P 6,616,725,462 At a point in time 1,523,021,590 - 228,159,443 22,620,000 1,773,801,033 4,798,613,955 1,682,132,713 1,887,159,827 22,620,000 8,390,526,495 Lease of properties Over time 63,159,194 - - - 63,159,194 Hotel operations Over time 8,524,756 - - - 8,524,756 Render of management services Over time 34,635,393 - 2,202,097 - 36,837,490 P 4,904,933,298 P 1,682,132,713 P 1,889,361,924 P 22,620,000 P 8,499,047,935
Below is the revenue of its major product lines and in geographical areas for the year ended December 31, 2018: Cebu Mindanao Bacolod Dumaguete Total Sale of real estate units Over time P 4,117,685,634 P 1,588,688,880 P 584,933,339 P 197,151,812 P 6,488,459,665 At a point in time 204,078,095 - - - 204,078,095 4,321,763,729 1,588,688,880 584,933,339 197,151,812 6,692,537,760 Lease of properties Over time 57,480,871 - - - 57,480,871 Render of management services Over time 12,920,716 - - - 12,920,716 P 4,392,165,316 P 1,588,688,880 P 584,933,339 P 197,151,812 P 6,762,939,347
- 59 -
17.2 Contract Balance The breakdown of contract balances is as follows: 2020 2019 Contract assets – net P 13,856,650,495 P 8,892,510,028 Contract liabilities ( 532,649,347 ) ( 418,967,659 ) Contract assets – net P 13,324,001,148 P 8,473,542,369 A reconciliation of the opening and closing balance of Contract Assets is shown below. 2020 2019 Balance at beginning of year P 8,892,510,028 P 5,442,125,993 Performance of property development 7,311,316,565 5,317,763,752 Transfers to contract receivables ( 2,104,784,396 ) ( 1,513,281,842 ) Collections ( 242,391,701 ) ( 403,586,064 ) Reversal of impairment losses - ( 49,488,189 ) Balance at end of year P13,856,650,495 P 8,892,510,028
The Group recognizes contract assets, due to timing difference of payment and satisfaction of performance obligation, to the extent of satisfied performance obligation on all open contracts as of the end of the reporting period. Its classification and presentation in the statement of financial position is based on the Group’s estimate of project completion, hence, any change in estimated completion period affects transfers to contracts receivables. The Group’s contract assets as at December 31, 2020 and 2019 are presented in the consolidated statements of the financial position as follows: 2020 2019 Current P 3,642,591,056 P 3,799,666,118 Non-current 10,214,059,439 5,092,843,910 P13,856,650,495 P 8,892,510,028 A reconciliation of the opening and closing balance of Contract Liabilities is shown in below. 2020 2019 Balance at beginning of year P 418,967,659 P 457,927,612 Revenue recognized that was included in contract liability at the beginning of year ( 218,652,268 ) ( 310,669,774 ) Increase due to cash received excluding amount recognized as revenue during the year 332,333,956 271,709,821 Balance at end of year P 532,649,347 P 418,967,659
- 60 -
Contract liabilities pertains collections from buyers that are ahead of the stage of completion of the real estate units sold. Collections from buyers on sale of real estate units where the gating criteria for recognition of sales contract have yet to be met are accounted for and presented as Customers’ Deposits in the consolidated statements of financial position. The balance of Customers’ Deposits amounts to P196,124,012 and P191,042,919 as at December 31, 2020 and 2019, respectively.
Changes in the contract assets and contract liabilities are recognized by the Group when a right to receive payment is already established and upon performance of unsatisfied performance obligation, respectively.
18. COST OF SALES AND SERVICES
Components of costs of sales and services are analyzed below (see Note 19). Note 2020 2019 2018
Cost of real estate sales P 4,208,259,774 P 4,264,594,712 P 3,110,027,278 Cost of rental services: Depreciation 39,693,249 19,475,668 18,097,781 Real property taxes - 179,375 717,228 13 39,693,249 19,655,043 18,815,009 Cost of management services: Salaries and wages 14,537,862 11,005,552 7,217,628 Materials and supplies - 25,532 -
14,537,862 11,031,084 7,217,628 Cost of hotel operations: Salaries and wages 5,971,450 3,302,116 - Materials and supplies 6,030,712 1,094,126 - Advertising and promotion 2,532,464 389,946 - Utilities 2,535,861 354,126 - Others 2,550,086 263,824 - 19,620,573 5,404,138 - P 4,282,111,458 P 4,300,684,977 P 3,136,059,915 Cost of real estate sales are further broken down as follows:
Details of operating expenses by nature are shown below. Notes 2020 2019 2018 Contracted services 18 P 3,463,826,643 P 3,428,692,309 P 2,430,807,113 Commissions 9 429,725,150 301,751,479 264,860,997 Borrowing costs 7, 18 394,329,036 135,900,814 88,478,442 Salaries and employee benefits 23.1 367,286,580 310,036,149 220,794,631 Land 18 201,523,220 661,053,922 579,191,014 Taxes and licenses 166,834,481 142,468,633 141,431,621 Professional and legal fees 115,756,965 37,301,481 28,883,240 Depreciation and 11, 12, amortization 13, 14 104,119,622 60,763,991 52,474,358 Advertising 44,096,688 66,026,270 53,594,172 Utilities 34,342,361 20,107,148 21,803,010 Hotel operations 31,545,278 5,404,138 - Repairs and maintenance 20,918,624 75,141,734 12,027,943 Transportation and travel 20,397,177 26,073,764 26,839,560 Rent 12.3, 28.2 18,441,626 33,941,185 15,275,105 Representation and entertainment 17,119,169 11,703,055 12,367,064 Supplies 16,205,708 10,106,696 6,387,294 Donations 15,427,666 2,611,027 8,170,000 Security services 14,995,988 14,783,785 9,727,211 Insurance 12,209,359 9,198,360 12,034,422 Communications 8,931,604 5,574,538 6,154,359 Subscription and membership dues 8,845,166 12,868,161 5,619,552 Trainings and seminars 453,611 1,405,783 1,488,291 Others 42,045,139 72,971,563 31,542,070 P 5,548,032,317 P 5,445,885,985 P 4,029,951,469
Borrowing costs pertains to those interest that were capitalized as part of real estate inventory but expensed when the related asset was sold. The expenses are classified in the consolidated statements of profit or loss as follows: Note 2020 2019 2018 Cost of sales and services 18 P 4,282,111,458 P 4,300,684,977 P 3,136,059,915 Operating expenses 1,265,920,859 1,145,201,008 893,891,554
P 5,548,032,317 P 5,445,885,985 P 4,029,951,469
- 62 -
20. OTHER OPERATING INCOME
This account is composed of the following: 2020 2019 2018 Administrative charges P 21,381,617 P 7,655,208 P 5,139,183 Water service fee 9,019,740 4,519,195 - Reservation fees foregone 8,460,301 182,922 22,090,887 Documentation fee 7,591,518 3,718,750 287,857 Reversal of payables 6,486,587 7,475,576 3,520,559 Late payment penalties charged to customers 5,718,465 4,804,671 721,961 Utilities charged to tenants 3,647,996 4,654,457 - Foreign exchange gains 2,484,376 1,023,843 38,457 Concession income 1,803,088 - - Referral incentive 75,728 34,644 202,845 Refund from lot acquisitions - 17,135,227 - Others 1,928,404 1,928,890 1,498,641
P 68,597,820 P 53,133,383 P 33,500,390 Refund from lot acquisitions pertain to the refund from seller of property for overpayments made. Reversal of payables pertains to recoveries from cancelled contracts with certain building contractors. Administrative charges pertain to standard fees charged to the buyers when they withdraw from the sale.
21. FINANCE COSTS
This is composed of the following: Notes 2020 2019 2018 Interest expense on: Lease liabilities 12.4 P 57,127,820 P 10,847,248 P - Loans 15.1, 15.2 8,677,442 33,629,596 88,467,056 Post-employment defined benefit obligation 23.2 - 449,368 310,716 Day one loss, net of amortization of non-current contracts receivables 6 - - 42,964,142 Bank charges - - 830,408 P 65,805,262 P 44,926,212 P 132,572,322
Interest expense on loans is the portion not capitalized as part of real estate inventory (see Notes 7 and 15).
- 63 -
22. FINANCE INCOME
This is composed of the following: Notes 2020 2019 2018 Amortization of day one loss on non-current contract receivables - net 6 P 30,761,435 P 26,971,237 P - Interest income on banks 5 8,701,101 24,599,602 18,861,865 Others 245,725 349,906 - P 39,708,261 P 51,920,745 P 18,861,865
23. EMPLOYEE BENEFITS 23.1 Salaries and Employee Benefits Expenses recognized for salaries and employee benefits are presented below. Notes 2020 2019 2018 Short-term employee benefits P 369,487,729 P 303,543,435 P 217,063,952 Post-employment defined benefit expense (income) 23.2 ( 2,201,149 ) 6,492,714 3,730,679 19 P 367,286,580 P 310,036,149 P 220,794,631
23.2 Post-Employment Benefit Plan (a) Characteristics of the Defined Benefit Plan
The Group maintains a funded and non-contributory post-employment benefit plan that is being administered by a trustee bank that is legally separated from the Group. The trustee bank manages the fund in coordination with the Group’s top management who acts in the best interest of the plan assets and is responsible for setting the investment policies. The post-employment plan covers all regular full-time employees. The normal retirement age is 60 with a minimum of five years of credited service. The plan also provides for an early retirement at age 50 with a minimum of five years of credited service and late retirement after age 60, both subject to the approval of the Group’s BOD. Normal retirement benefit is an amount equivalent to 50% of the final monthly covered compensation (average monthly basic salary during the last 12 months of credited service) for every year of credited service.
(b) Explanation of Amounts Presented in the Consolidated Financial Statements
Actuarial valuations are made annually to update the post-employment defined benefit costs and the amount of contributions. All amounts presented in the succeeding pages are based on the actuarial valuation reports obtained from an independent actuary in 2020 and 2019.
- 64 -
The amounts of post-employment defined benefit asset (obligation) recognized in the consolidated statements of financial position are determined as follows: 2020 2019 Present value of the obligation P 35,484,952 P 30,455,692 Fair value of plan assets ( 34,863,768 ) ( 36,379,276 ) ( P 621,184 ) P 5,923,584 The movements in the present value of the post-employment defined benefit obligation recognized in the books are presented below.
2020 2019
Balance at beginning of year P 30,455,692 P 30,075,774 Current service cost 4,478,160 6,492,714 Past service cost ( 6,679,309 ) - Interest cost 1,565,423 2,264,706 Benefits paid ( 2,285,872 ) ( 83,772 ) Remeasurements – actuarial losses (gains) arising from: Experience adjustments 44,456,648 ( 26,927,039 ) Changes in financial assumptions 2,395,087 16,523,250 Changes in demographic assumptions ( 38,900,877 ) 2,110,059 Balance at end of year P 35,484,952 P 30,455,692
The movements in the fair value of plan assets are presented below. 2020 2019 Balance at beginning of year P 36,379,276 P 24,108,080 Contributions to the plan - 10,491,622 Interest income 1,811,148 1,815,338 Benefits paid ( 2,285,872 ) ( 83,772) Return on plan assets (excluding amounts included in net interest) ( 1,040,784 ) 48,008 Balance at end of year P 34,863,768 P 36,379,276
The composition of the fair value of plan assets at the end of the reporting period by category and risk characteristics is shown below.
2020 2019 Cash and cash equivalents P 32,505 P 4,019,910 Receivables 1,355,672 - Financial assets at FVTPL Unitized investment funds 27,521,395 20,707,084 Government securities 5,954,196 11,652,282 P 34,863,768 P 36,379,276
- 65 -
The fair values of the above unitized investment funds are determined based on quoted market prices in active markets (classified as Level 1 of the fair value hierarchy). Plan assets do not comprise any of the Group’s own financial instruments or any of its assets occupied and/or used in its operations. The plan assets recognized a losses of P1,040,784 in 2020 and P1,055,359 in 2018, and income of P48,008 in 2019. The components of amounts recognized in profit or loss and other comprehensive income in respect of the defined benefit post-employment plan are as follows:
2020 2019 2018 Recognized in profit or loss Current service cost - net (P 2,201,149 ) P 6,492,714 P 3,730,679 Net interest expense (income) on defined benefit obligation ( 245,725 ) 449,368 310,716
( P 2,446,874 ) P 6,942,082 P 4,041,395
Recognized in other comprehensive income Actuarial losses (gains) arising from changes in: Experience adjustments P 44,456,648 (P 26,927,039 ) P 8,791,265 Financial assumptions 2,395,087 16,523,250 - Demographic assumptions ( 38,900,877) 2,110,059 ( 7,283,839 ) Loss (return) on plan assets (excluding amounts included in net interest expense) 1,040,784 ( 48,008 ) 1,055,359 P 8,991,642 ( P 8,341,738 ) P 2,562,785 The net interest expense (income) is included in Finance Costs (Income) in profit or loss (see Note 21). Amounts recognized in other comprehensive income (loss) were included within items that will not be reclassified subsequently to profit or loss.
In determining the amounts of the defined benefit post-employment obligation, the following significant actuarial assumptions were used:
2020 2019 2018 Discount rates 3.95% 5.14% 7.53% Salary increase rates 7.00% 7.00% 8.00% Assumptions regarding future mortality experience are based on published statistics and mortality tables. The average remaining working lives of an individual retiring at the age of 60 is 26 both for males and females. These assumptions were developed by management with the assistance of an independent actuary. Discount factors are determined close to the end of each reporting period by reference to the interest rates of zero-coupon government bonds with terms to maturity approximating to the terms of the post-employment obligation. Other assumptions are based on current actuarial benchmarks and management’s historical experience.
- 66 -
(c) Risks Associated with the Retirement Plan
The plan exposes the Group to actuarial risks such as investment risk, interest rate risk, longevity risk and salary risk. (i) Investment and Interest Risks
The present value of the defined benefit obligation is calculated using a discount rate determined by reference to market yields of government bonds. Generally, a decrease in the interest rate of a reference government bonds will increase the plan obligation. However, this will be partially offset by an increase in the return on the plan’s investments in debt securities and if the return on plan asset falls below this rate, it will create a deficit in the plan. Due to the long-term nature of the plan obligation, a level of continuing equity investments is an appropriate element of the Group’s long-term strategy to manage the plan efficiently.
(ii) Longevity and Salary Risks
The present value of the defined benefit obligation is calculated by reference to the best estimate of the mortality of the plan participants both during and after their employment, and to their future salaries. Consequently, increases in the life expectancy and salary of the plan participants will result in an increase in the plan obligation.
(d) Other Information The information on the sensitivity analysis for certain significant actuarial assumptions, the Group’s asset-liability matching strategy, and the timing and uncertainty of future cash flows related to the retirement plan are as follows.
(i) Sensitivity Analysis
The following table summarizes the effects of changes in the significant actuarial assumptions used in the determination of the post-employment defined benefit obligation:
Impact on Post-employment Defined Benefit Obligation Changes in Increase in Decrease in Assumption Assumption Assumption December 31, 2020 Discount rate +/-1.0% ( P 1,279,317 ) P 1,482,791 Salary increase rate +/-1.0% 1,422,980 ( 1,256,261 ) December 31, 2019 Discount rate +/-1.0% ( P 6,221,517 ) P 4,857,534 Salary increase rate +/-1.0% 6,035,484 ( 4,818,369 )
In addition, assuming there are no attrition rates, the increase in post-employment defined benefit obligation would be P85,790,062 and P26,485,966 for the years ended December 31, 2020 and 2019, respectively.
- 67 -
The foregoing sensitivity analysis is based on a change in an assumption while holding all other assumptions constant. This analysis may not be representative of the actual change in the defined benefit obligation as it is unlikely that the change in assumptions would occur in isolation of one another as some of the assumptions may be correlated. Furthermore, in presenting the above sensitivity analysis, the present value of the defined benefit obligation has been calculated using the projected unit credit method at the end of the reporting period, which is the same as that applied in calculating the defined benefit obligation recognized in the consolidated statements of financial position. The methods and types of assumptions used in preparing the sensitivity analysis did not change compared to the previous years.
(ii) Asset-Liability Matching Strategies
To efficiently manage the retirement plan, the Group, through its Retirement Plan Committee, ensures that the investment positions are managed in accordance with its asset-liability matching strategy to achieve that long-term investments are in line with the obligations under the retirement scheme. This strategy aims to match the plan assets to the post-employment obligations by investing in long-term fixed interest securities (i.e., government or corporate bonds) with maturities that match the benefit payments as they fall due and in the appropriate currency. The Group actively monitors how the duration and the expected yield of the investments are matching the expected cash outflows arising from the post-employment obligations. There has been no change in the Group’s strategies to manage its risks from previous periods.
(iii) Funding Arrangements and Expected Contributions The Group does not expect to make a contribution during the next reporting period. The maturity profile of undiscounted expected benefit payments from the plan follows (2020 is only for 10-year projection):
2020 2019 Within one year P 20,796,005 P 2,544,053 More than one year to five years 3,731,788 3,667,551 More than five years to ten years 5,403,336 8,516,813 More than ten years to 15 years - 8,838,609 More than 15 years to 20 years - 22,797,570 More than 20 years - 251,295,697 P 29,931,129 P 297,660,293 The weighted average duration of the defined benefit obligation at the end of the reporting period is 3.9 years.
- 68 -
24. CURRENT AND DEFERRED TAXES
The Group was registered with the Board of Investments (BOI) as a developer of various economic and low-cost housing projects. Accordingly, the Group enjoys an income tax holiday on the BOI registered projects within three to four taxable years from its registration. The Group has 17 and 15 registered projects with BOI as of December 31, 2020 and 2019, respectively. The components of tax expense relating to profit or loss and other comprehensive loss (income) are as shown below. 2020 2019 2018 Reported in profit or loss: Current tax expense: Regular corporate income tax (RCIT) at 30% P 147,796,447 P 153,290,028 P 92,981,634 Minimum corporate income Tax (MCIT) at 2% 874,408 - - Final income tax 1,785,428 4,918,642 3,033,301 150,456,283 158,208,670 96,014,935
Deferred tax expense relating to origination and reversal of temporary differences 565,397,304 585,347,545 342,594,139
P 715,853,587 P 743,556,215 P 438,609,074
Reported in other comprehensive income: Deferred tax expense (income) relating to origination and reversal of temporary differences (P 2,697,493) P 2,502,521 (P 768,836 )
A reconciliation of tax on pretax profit computed at the applicable statutory rates to tax expense reported in the consolidated statements of profit or loss is presented below.
2020 2019 2018
Tax on pretax profit at 30% P 837,474,272 P 954,448,117 P 782,260,316 Adjustments for income subject to lower tax rate ( 823,490) 1,215,137 ( 2,473,694 ) Tax effects of: Timing difference from tax exempt real estate sales ( 78,609,778) ( 713,862,517 ) ( 319,785,609 ) Tax-exempt sales ( 48,431,740) ( 120,095,181 ) ( 67,889,306) Non-deductible expenses 4,867,412 620,344,359 25,754,052 Changes in unrecognized deferred tax assets 1,376,911 1,506,300 20,743,315 Tax expense P 715,853,587 P 743,556,215 P 438,609,074
- 69 -
The net deferred tax liabilities relate to the following as of December 31: 2020 2019
Deferred tax liabilities: Difference between tax reporting base and financial reporting base used in sales recognition P 1,818,028,603 P 1,159,960,387 Rental income 3,329,479 3,063,592 Post-employment defined benefit asset 212,884 1,777,075 Allowance for impairment 30,610 - Others 385,320 - 1,821,986,896 1,164,801,054 Deferred tax assets: Sales commissions ( 117,331,396 ) ( 38,454,339 ) Unamortized past service cost ( 2,935,601 ) - Net lease liabilities ( 10,102,687 ) ( 1,459,993 ) Net operating loss carry-over (NOLCO) ( 1,333,186 ) - ( 131,702,870 ) ( 39,914,332 )
P 1,690,284,026 P 1,124,886,722 The components of deferred tax expense (income) are as follows: Consolidated Statements Consolidated Statements of Profit or Loss of Comprehensive Income 2019 2019 2018 2020 2019 2018 Deferred tax liabilities: Difference between tax reporting base and financial reporting base used in sales recognition P 658,068,216 P 565,160,568 P 340,811,420 P - P - P - Post-employment defined benefit asset ( 1,564,191) 1,777,075 - - - - Rental income 265,887 156,696 2,906,896 - - - Allowance for impairment 30,610 13,694,142 ( 9,791,087 ) - - - Others 385,320 - - - - - Deferred tax assets: Sales commissions ( 78,877,057) ( 2,481,910 ) 3,613,823 - - - Net lease liabilities ( 8,642,694) ( 1,459,99 3 ) - - - - Unamortized past service cost ( 2,935,601) - - - - - NOLCO ( 1,333,186) 9,213,180 2,665,506 - - - Post-employment defined benefit obligation - ( 712,213 ) 2,387,581 ( 2,697,493) 2,502,521 ( 768,836 ) Deferred tax expense (income) P 565,397,304 P 585,347,545 P 342,594,139 (P 2,697,493) P 2,502,521 ( P 768,836 )
NOLCO can be claimed as deduction from future taxable income within three and five years from the year the taxable loss was incurred. In accordance with Bayanihan to Recover as One Act 2, NOLCO incurred in 2020 by certain subsidiaries can be claimed as deduction from the gross income until 2020. Details of the Group’s NOLCO are shown below.
Inception Year Amount Utilized Expired Balance Expiry Year 2020 P 22,918,739 P - P - P 22,918,739 2025 2019 52,655,489 - - 52,655,489 2022 2018 86,238,765 14,927,620 - 71,401,145 2021 2017 3,780,948 - 3,780,948 - - P 165,593,941 P 14,927,620 P 3,780,948 P 146,885,373
- 70 -
The Group has deferred tax assets related to NOLCO of 42,732,426 and P42,829,561 as at December 31, 2020 and 2019, respectively, which were not recognized because the subsidiaries to which such are attributable may not be able to generate enough taxable profit yet within the validity period of NOLCO for the assets to be recovered. As of December 31, 2020 and 2019, only the Parent Company, CPH, BL Ventures and El Camino are subject to the minimum corporate income tax (MCIT) which is computed at 2% of gross income net of allowable deductions, as defined under the tax regulations or to RCIT, whichever is higher. Other components of the Group are not yet subject to MCIT as those have not operated beyond four taxable years yet. A subsidiary reported MCIT in 2020 amounting to P874,409. No MCIT was reported in 2019 and 2018 because RCIT was higher than MCIT in both years. The Group opted to treat the capitalized borrowing costs as capital expenditure in accordance with Section 34(b) of the NIRC; hence, there are no deferred taxes related to the transaction. Furthermore, it opted to claim itemized deductions in computing its income tax due for the years ended December 31, 2020, 2019 and 2018.
25. RELATED PARTY TRANSACTIONS The Group’s related parties include its ultimate parent or ABS, entities under common ownership, associates, shareholders, the Group’s key management personnel, its retirement fund and others as described in Note 2.19. A summary of the Group’s transactions and outstanding balances with related parties is presented below. Amount of Transaction Outstanding Balance Notes 2020 2019 2018 2020 2019 Ultimate Parent Company Sale of real estate 25.3 P 41,538,000 P 26,047,495 P 15,886,745 P 214,172,636 P 158,920,838 Other Stockholders Sale and transfer of property 25.2 - - 55,633,275 - - Entities under Common Ownership Net advances (collections) 25.1 11,953,583 ( 11,206,772) 3,324,163 21,901,000 9,947,417 Associates Net advances (collections) 25.1 49,504 - ( 11,925 ) 49,504 -
Key Management Personnel Sale of real estate 25.4 39,075,750 - 8,501,882 43,259,635 7,180,680 Compensation 25.5 94,066,157 87,656,262 81,760,354 - - Based on management’s assessment, no impairment loss is required to be provided on the Group’s receivables from related parties as at December 31, 2020 and 2019. The cash advances to related parties are noninterest-bearing, unsecured, due on demand and are expected to be settled in cash or through offsetting of accounts within one year from end of the reporting period. In respect of contract receivables, it is fully secured by the units purchased, expected to be settled in cash and due based on the contract terms.
Details of the foregoing transactions follows.
- 71 -
25.1 Advances to Related Parties The Group grants cash advances to shareholders, entities under common ownership and associates. An analysis of such advances in 2020 and 2019 is presented below. Entities Under Common Ownership Associates Total Balance at January 1, 2020 P 9,947,417 P - P 9,947,417 Additional advances 11,953,583 49,504 12,003,087 Balance at December 31, 2020 P 21,901,000 P 49,504 P 21,950,504 Balance at January 1, 2019 P 21,154,189 P - P 21,154,189 Collections ( 11,206,772 ) - ( 11,206,772 ) Balance at December 31, 2019 P 9,947,417 P - P 9,947,417 25.2 Sale and Transfer of Property
In 2018, the Parent Company transferred all its financial assets at FVOCI to one of its shareholders at market price as of January 1, 2018 of P55,633,275, which was paid by the shareholder in cash. There is no similar transaction in 2020 and 2019.
25.3 Sale of Real Estate to Ultimate Parent Company In 2020, 2019 and 2018, CLI sold condominium units to ABS totaling P41,538,000, P24,410,000 and nil, respectively. The outstanding balance related to these transactions amounted to P214,172,636 and P158,920,838 as at December 31, 2020 and 2019, respectively, and is presented as part of Contract Receivables under the Receivables account in the consolidated statements of financial position (see Note 6). 25.4 Sale of Real Estate to Key Management Personnel In 2020, 2019 and 2018, CLI sold condominium units totaling P39,075,750, nil and P8,501,882, respectively, to key management personnel. Outstanding balance related to these transactions amounts to P43,259,635 and P7,180,680 as at December 31, 2020 and 2019, respectively. These are presented as part of Contract Receivables under the Receivables account in the consolidated statements of financial position (see Note 6).
25.5 Key Management Personnel Compensation The composition of key management personnel compensation for the years ended December 31, 2020, 2019 and 2018 is shown below. 2020 2019 2018 Short-term benefits P 90,246,704 P 83,006,173 P 76,696,262 Post-employment benefits 4,719,453 4,650,089 5,064,092 P 94,966,157 P 87,656,262 P 81,760,354
- 72 -
25.6 Retirement Fund CLI’s retirement fund for its defined post-employment plan is administered and managed by a trustee bank. The fair value of plan assets in 2020 and 2019 consists of the contributions to the plan and interest earned (see Note 23.2). The plan assets do not comprise investment in any of the Group’s own financial instruments or any of its assets occupied and/or used in its operations.
26. EQUITY 26.1 Capital Stock Details of the authorized capital stock as of December 31, 2020 and 2019 are as follows: Shares Par Value Shares Amount Common stock P 1.00 2,400,000,000 P 2,400,000,000 Preferred stock 0.10 1,000,000,000 100,000,000 As of December 30, 2020 and 2019, common shares issued and outstanding is 1,714,000,000 which amounts to P1,714,000,000. There is no issued preferred stock as of December 31, 2020 and 2019. As disclosed in Note 1.1, the Parent Company had a successful IPO of 430,000,000 unissued common shares at an offer price of P5 per share, which is equivalent to P2,150,000,000 on June 2, 2017. Accordingly, the Parent Company recognized additional paid-in capital of P1,608,917,974 in the consolidated statements of financial position after deducting the related share issuance costs of P111,082,026. The share price of the Parent Company’s common stock closed at P5.05 and P4.83 and per share on December 29, 2020 and December 27, 2019, respectively, the last trading day in the PSE for 2020 and 2019. The Group has no other listed securities as at December 31, 2020 and 2019.
On November 24, 2020, the Parent Company’s BOD approved the proposed increase in its authorized common stock from P2,400,000,000, divided into 2,400,000,000 common shares with a par value of P1.00 per share to P10,000,000,000, divided into 10,000,000,000 common shares with a par value of P1.00 per share. Relative to the increase in authorized common stock, on the same date, the Parent Company’s BOD approved to declare stock dividends, subject to the approval of the stockholders, of at least 1,900,000,000 or such number of common shares as sufficient to pay the required subscription to the increase in the authorized common stock and as necessary to avoid fractional shares, to be issued to stockholders of record as of the record date fixed and approved by the SEC, and to be paid on such payment date as shall be fixed by the BOD after the determination of the record date. The increase in the authorized common stock and declaration of stock dividends were approved by the Parent Company’s stockholders on February 26, 2021 (see Note 29.1).
- 73 -
26.2 Treasury Shares An analysis of treasury shares as of December 31, 2020 and 2019, respectively is shown below. Shares Amounts 2020 2019 2020 2019 Balance at beginning of year 54,820,000 46,500,000 P 247,193,811 P 212,459,418 Reacquired during the year 104,180,400 8,320,000 485,657,205 34,734,393 Balance at end of year 159,000,400 54,820,000 P 732,851,016 P 247,193,811
On February 27, 2018, the BOD of the Parent Company approved a P250,000,000 budget for a share buy-back program and employee stock option plan. As of December 31, 2019, the employee stock option plan has not yet been implemented. However, in relation to this program, the Parent Company reacquired 104,180,400 shares and 8,320,000 shares of its common stock in 2020 and 2019, respectively, for P485,657,205 and P34,734,393, respectively, and presented them as Treasury Stock in the consolidated statement of financial position. As at December 31, 2020 and 2019, total reacquired shares totals 159,000,400 and 54,820,000, respectively, which amounts to P732,851,016 and P247,193,811, respectively. The common stock of the Parent Company that is held under nominee accounts totaled 680,864,750 shares and 697,799,750 shares as of December 31, 2020 and 2019, respectively. This represents 40% and 41% of the Parent Company’s outstanding shares as of December 31, 2020 and 2019, respectively.
26.3 Revaluation Reserves
The components and reconciliation of items of other comprehensive income (loss) presented in the consolidated statement of changes in equity at their aggregate amount under the Revaluation Reserves account are shown below. Post-employment Defined Benefit Financial Asset Notes Obligation at FVOCI Total Balance as of January 1, 2020 ( P 6,589,225 ) P - ( P 6,589,225 ) Other comprehensive income: Loss on remeasurement of post-employment defined benefit obligation 23.2 ( 8,991,642 ) - ( 8,991,642 ) Tax income 24 2,697,492 - 2,697,492 ( 6,294,150 ) - ( 6,294,150 ) Balance as of December 31, 2020 ( P 12,883,375 ) P - ( P 12,883,375 ) Balance as of January 1, 2019 ( P 12,428,442 ) P - ( P 12,428,442 ) Other comprehensive income: Gain on remeasurement of post-employment defined benefit obligation 23.2 8,341,738 - 8,341,738 Tax expense 24 ( 2,502,521 ) - ( 2,502,521 ) 5,839,217 - 5,839,217 Balance as of December 31, 2019 ( P 6,589,225 ) P - ( P 6,589,225 ) Balance as of January 1, 2018 ( P 10,634,493 ) P 6,315,400 ( P 4,319,093 ) Other comprehensive income: Loss on remeasurement of post-employment defined benefit obligation 23.2 ( 2,562,785 ) - ( 2,562,785 ) Sale of financial asset at FVOCI - ( 6,315,400 ) ( 6,315,400 ) ( 2,562,785 ) ( 6,315,400 ) ( 8,878,185 ) Tax income 768,836 - 768,836 ( 1,793,949 ) ( 6,315,400 ) ( 8,109,349 ) Balance as of December 31, 2018 ( P 12,428,442 ) P - ( P 12,428,442 )
- 74 -
26.4 Retained Earnings (a) Dividends On February 19, 2020, the BOD declared cash dividend of P0.25 per share totaling P414,795,000 to stockholders on record as of April 3, 2020 and was paid on April 30, 2020. On February 26, 2019, the Parent Company’s BOD declared cash dividend of P0.20 per share or a total amount of P352,590,000 to stockholders on record as of March 26, 2019 and was paid on April 24, 2019.
On February 27, 2018, the BOD declared cash dividend of P0.15 per share or a total amount of P256,875,000 to stockholders on record as of March 23, 2018 and was paid on April 23, 2018. (b) Appropriations
Below is the summary of the appropriations of retained earnings. January 1, December 31, Purpose 2020 Releases Additions 2020 Funding of CLI’s Projects
Mivela Garden Residences P 400,000,000 ( P 400,000,000 ) P 500,000,000 P 500,000,000 Casa Mira Towers Mandaue 300,000,000 ( 300,000,000 ) 500,000,000 500,000,000 Casa Mira and Velmiro Homes Davao 500,000,000 ( 500,000,000 ) 400,000,000 400,000,000 Cebu Business Park Office/ Hotel Tower 600,000,000 ( 235,730,893 ) - 364,269,107 Abaca Resort Mactan 400,000,000 ( 251,790,399 ) - 148,209,601 Mactan Lowaii Project 600,000,000 ( 527,783,450 ) - 72,216,550 Velmiro Heights Teakwood 250,000,000 ( 185,190,635 ) - 64,809,365 P 3,050,000,000 P 2,400,495,377 P 1,400,000,000 P 2,049,504,623
In 2020, appropriated retained earnings for certain projects totaling P2,400,495,377 in 2019 were released to unrestricted retained earnings after full and/or partial fulfillment of the intended purposes. On November 24, 2020, the BOD approved the appropriation of P3,300,000,000 retained earnings for various projects and . Details of the appropriation are as follows: • P1,900,000,000 is intended for the Parent Company’s proposed increase in
authorized common stock and of which portion will be issued through stock dividend (see Note 26.1).
• P1,400,000,000 for the capital expenditures, financing costs, and other related
development costs of certain projects that the Parent Company expects to incur in 2021 with details below:
i. P400,000,000 for the on-going development of the Casa Mira and Velmiro
Homes Davao projects. Project developments commenced in December 2019 and are expected to be completed by fourth quarter of 2023.
- 75 -
ii. P500,000,000 for the on-going development of Mivela Garden Residences.
Project development commenced in September 2019 and is expected to be completed by fourth quarter of 2023.
iii. P500,000,000 for the on-going development of Casa Mira Towers Mandaue.
Project development commenced in September 2019 and is expected to be completed by fourth quarter of 2023.
On October 24, 2019, the Board of Directors approved the appropriation of P3,050,000,000 from the Parent Company’s retained earnings for purposes of funding certain projects. The appropriated amount is specifically intended and allocated for the capital expenditures, financing costs, and other related development costs that the Parent Company expects to incur in the next five years for those certain projects. Details of the appropriation are as follows: • P400,000,000 for the on-going development of Mivela Garden Residences, a
modern garden residential community and condominium project located in Banilad, Cebu City. Project development commenced in September 2019 and is expected to be completed by second quarter of 2023.
• P600,000,000 for the development of Cebu Business Park Office / Hotel Tower,
an office and hotel building located at the Cebu Business Park, Cebu City. Project development commenced in November 2019 and is expected to be completed by first quarter of 2024.
• P500,000,000 for the on-going development of the Casa Mira and Velmiro Homes
projects, which are subdivision projects (house and lots) located in Magtuod, Davao City. Project developments commenced in December 2019 and are expected to be completed by first quarter of 2023.
• P400,000,000 for the redevelopment of the Abaca Resort Mactan, a resort in Punta
Engaño, Mactan Island, Cebu. Redevelopment commenced in November 2019 and is expected to be completed by second quarter of 2024.
• P600,000,000 for the redevelopment of the Mactan Lowaii Project, a resort in Mactan Island, Cebu. Development was commenced on November 2019 and is expected to be completed by second quarter of 2023.
• P300,000,000 for the on-going development of Casa Mira Mandaue, a
condominium project with four towers located in Alang-alang, Mandaue City. Project development was commenced on September 2019 and is expected to be completed by second quarter of 2023.
• P250,000,000 for the on-going development of the Velmiro Heights Taekwoord, a
subdivision project located in Cagayan de Oro. Project development commenced in December 2019 and is expected to be completed by fourth quarter of 2022.
A portion of the Group’s retained earnings, equivalent of the cost of treasury shares is legally restricted in accordance with Section 40 of the Revised Corporation Code.
- 76 -
26.5 Non-controlling Interests The subsidiaries of the Group with significant NCI as at December 31, 2020 and 2019 are as follows. NCI Ownership % NCI Equity in Subsidiaries Subsidiaries 2020 2019 2020 2019 YHEST 50% 50% P 3,715,725,255 P 3,719,661,270 El Camino 65% 65% 1,060,345,832 773,607,627 CHDI 50% 50% 654,584,882 226,673,963 YHES 50% 50% 540,728,657 471,210,883 YES 50% 50% 294,725,960 318,011,562 MGR 55% 55% 279,378,963 310,217,791 BL Ventures 50% 50% 145,666,074 150,788,415 CCLI 50% 50% 105,051,470 85,858,394 CBLRV 50% - 99,432,604 - P 6,895,639,697 P 6,056,029,905
The analysis of the movement of NCI as at December 31, 2020 and 2019 are as follows.
2020 2019
Balance at beginning of year P6,056,029,905 P 5,280,557,011 New and additional investments 647,502,204 369,825,001 Dividends ( 37,500,000 ) ( 20,000,000 ) Share in net profit during the year 229,607,588 425,647,893
Balance at end of year P6,895,639,697 P 6,056,029,905 In 2020, CBLRV was incorporated with paid-in capital from non-controlling
stockholders amounting to P100,002,200. Other significant activities of the Group’s NCI in 2020 are as follows:
• CHDI’s non-controlling shareholders contributed cash of P430,000,000 as paid-in
capital.
• CCLI’s deposits for future share subscription from non-controlling shareholders amounting to P20,000,001 was transferred to capital stock after compliance of SEC requirements of the reclassification.
• El Camino’s non-controlling shareholders contributed cash amounting to P97,500,002 as additional capital; and,
• YES declared a cash dividend of P20,000,000 in September 2020 and of which P10,000,000 was paid to non-controlling shareholders.
In 2019, CHDI was incorporated with paid-in capital from non-controlling shareholders amounting to P230,000,003. In the same year, YHESPH was incorporated as a wholly-owned subsidiary of YHES. The share of non-controlling shareholders of YHES in the paid-in capital of YHESPH amounted to P1,250,000. Moreover, non-controlling shareholders of El Camino, CCPH and YES contributed cash of P87,749,999, P15,574,999 and P6,250,000 into these entities, respectively. Deposits for future stock subscription from non-controlling shareholders of MGR amounting to P30,250,000 were also transferred to equity after compliance of SEC requirements of the reclassification.
- 77 -
In 2019, YES declared cash dividends totalling P40,000,000 of which P20,000,000 is the share of non-controlling shareholders. There was no similar transaction in 2020 and 2018.
Significant information on the financial position and financial performance of YHEST as at and for the year ended December 31, 2020 and 2019 are as follows:
2020 2019 Current assets P 986,071,764 P 42,486,068 Non-current assets 4,563,949,145 5,300,467,319 Total assets P5,550,020,909 P 5,342,953,387 Current liabilities P 49,580,036 P 19,894,182 Non-current liabilities - - Total liabilities P 49,580,036 P 19,894,182 Revenues P - P - Net loss (P 7,872,029 ) ( P 37,433,073 ) Other comprehensive income - - Total comprehensive loss (P 7,872,029 ) (P 37,433,073 )
The profit or loss is allocated between the Parent Company and NCI as follows. 2020 2019
Parent Company's shareholders ( P 3,936,014 ) ( P 18,716,537 ) Non-controlling interests ( 3,936,014 ) ( 18,716,536 ) Net loss (P 7,872,028 ) ( P 37,433,073 )
Significant information on the financial position and financial performance of El Camino as at and for the year ended December 31, 2020 and 2019 are as follows:
2020 2019 Current assets P4,390,330,221 P 2,947,087,029 Non-current Assets 816,631,511 1,246,556,090 Total assets P5,206,961,732 P 4,193,643,119 Current liabilities P1,050,759,365 P 766,532,996 Non-current liabilities 2,524,361,091 2,236,404,543 Total liabilities P3,575,120,456 P 3,002,937,539 Revenues P 1,012,563,946 P 1,454,219,295 Net profit P 291,135,695 P 328,487,695 Other comprehensive income - - Total comprehensive income P 291,135,695 P 328,487,695
- 78 -
The profit or loss is allocated between the Parent Company and NCI as follows.
2020 2019
Parent Company's shareholders P 101,897,493 P 114,970,693 Non-controlling interests 189,238,202 213,517,002 Net profit P 291,135,695 P 328,487,695
Significant information on the financial position and financial performance of YHES as at and for the year ended December 31, 2020 and 2019 are as follows:
2020 2019
Current assets P1,224,207,804 P 734,967,923 Non-current Assets 877,546,920 266,909,463
Total assets P 2,101,754,724 P 1,001,877,386
Current liabilities P 821,564,723 P 252,707,237 Non-current liabilities 198,595,785 30,985,381
Total liabilities P 1,020,160,508 P 283,692,618
Revenues P 401,985,057 P 200,059,620
Net profit P 139,172,448 P 59,969,229 Other comprehensive income - -
Total comprehensive P 139,172,448 P 59,969,229
The profit or loss is allocated between the Parent Company and NCI as follows.
2020 2019
Parent Company's shareholders P 69,586,224 P 29,984,615 Non-controlling interests 69,586,224 29,984,614 Net profit (loss) P 139,172,448 P 59,969,229
Significant information on the financial position and financial performance of YES as at and for the year ended December 31, 2020 and 2019 are as follows:
2020 2019 Current assets P1,568,598,367 P 1,387,657,167 Non-current Assets 100,824,806 147,691,392 Total assets P 1,669,423,173 P 1,535,348,559
Current liabilities P 466,338,638 P 314,987,300 Non-current liabilities 613,632,609 584,257,940 Total liabilities P 1,079,971,247 P 899,245,240
- 79 -
2020 2019 Revenues P 178,773,834 P 499,698,122
Net profit (loss) ( P 26,651,393 ) P 207,306,736 Other comprehensive income - - Total comprehensive income ( P 26,651,393 ) P 207,306,736
The profit or loss (loss) is allocated between the Parent Company and NCI as follows. 2020 2019
Parent Company's shareholders ( P 13,325,697 ) P 103,653,368 Non-controlling interests ( 13,325,696 ) 103,653,368 Net profit ( P 26,651,393 ) P 207,306,736
Significant information on the financial position and financial performance of MGR as at and for the year ended December 31, 2020 and 2019 are as follows: 2020 2019 Current assets P 1,124,238,632 P 1,262,460,627 Non-current Assets - - Total assets P 1,124,238,632 P 1,262,460,627 Current liabilities P 302,802,916 P 280,589,748 Non-current liabilities 310,098,965 414,463,533 Total liabilities P 612,901,881 P 695,053,281 Revenues P 35,413,304 P 475,975,791
Net profit ( P 6,070,595 ) P 158,202,773 Other comprehensive income - -
Total comprehensive income ( P 6,070,595 ) P 158,202,773
The profit or loss is allocated between the Parent Company and NCI as follows.
2020 2019
Parent Company's shareholders ( P 2,731,768 ) P 71,191,248 Non-controlling interests ( 3,338,827 ) 87,011,525
Net profit ( P 6,070,595 ) P 158,202,773
- 80 -
Significant information on the financial position and financial performance of BL Ventures as at and for the year ended December 31, 2020 and 2019 are as follows:
2020 2019 Current assets P 754,032,940 P 718,672,694 Non-current Assets 717,205,879 657,309,937 Total assets P 1,471,238,819 P 1,375,982,631 Current liabilities P 255,951,972 P 319,724,150 Non-current liabilities 923,981,441 754,708,394 Total liabilities P 1,179,933,413 P 1,074,432,544 Revenues P 31,118,154 P 159,598,289 Net profit (loss) ( P 10,244,682 ) P 33,082,308 Other comprehensive income - - Total comprehensive income ( P 10,244,682 ) P 33,082,308
The profit or loss is allocated between the Parent Company and NCI as follows.
2020 2019
Parent Company's shareholders ( P 5,122,341 ) P 16,541,154 Non-controlling interests ( 5,122,341 ) 16,541,154 Net profit (P 10,244,682 ) P 33,082,308
Significant information on the financial position and financial performance of CCLI as at and for the year ended December 31, 2020 and 2019 are as follows:
2020 2019 Current assets P 67,407,471 P 63,630,125 Non-current Assets 294,957,552 187,818,054 Total assets P 362,365,023 P 251,448,179 Current liabilities P 26,262,082 P 79,731,390 Non-current liabilities 126,000,000 - Total liabilities P 152,262,082 P 79,731,390 Revenues P - P - Net loss ( P 1,613,850 ) ( P 5,954,202 ) Other comprehensive income - - Total comprehensive loss (P 1,613,850 ) ( P 5,954,202 )
- 81 -
The profit or loss is allocated between the Parent Company and NCI as follows.
2020 2019
Parent Company's shareholders ( P 806,925 ) ( P 2,977,101 ) Non-controlling interests ( 806,925 ) ( 2,977,101 ) Net loss ( P 1,613,850 ) ( P 5,954,202 )
Significant information on the financial position and financial performance of CHDI as at and for the year ended December 31, 2019 are as follows:
2020 2019 Current assets P 1,350,240,310 P 922,628,670 Non-current Assets 5,598,604 98,464,752 Total assets P 1,355,838,914 P 1,021,093,422 Current liabilities P 46,669,156 P 567,745,501 Non-current liabilities - - Total liabilities P 46,669,156 P 567,745,501 Revenues P - P - Net loss ( P 4,178,162 ) ( P 6,652,080) Other comprehensive income - - Total comprehensive loss (P 4,178,162 ) ( P 6,652,080 )
The 2019 profit or loss is allocated between the Parent Company and NCI as follows.
2020 2019
Parent Company's shareholders ( P 2,089,081 ) ( P 3,326,040 ) Non-controlling interests ( 2,089,081 ) ( 3,326,040 ) Net loss ( P 4,178,162 ) ( P 6,652,080 )
Significant information on the financial position and financial performance of CBLRV as at and for the year ended December 31, 2020 are as follows:
Current assets P 413,572,897 Non-current Assets 491,339 Total assets P 414,064,236 Current liabilities P 214,800,417 Non-current liabilities 403,011 Total liabilities P 215,203,428 Revenues P -
- 82 -
Net loss ( P 1,139,192 ) Other comprehensive income - Total comprehensive income ( P 1,139,192 )
The profit or loss is allocated between the Parent Company and NCI as follows.
2020
Parent Company's shareholders ( P 569,596 ) Non-controlling interests ( 569,596 ) Net profit (P 1,139,192 )
27. EARNINGS PER SHARE EPS is computed as follows: 2020 2019 2018 Income available to common stockholders P 1,846,119,733 P 2,012,289,616 P 1,667,369,943 Divided by weighted average number of outstanding common stock 1,605,279,067 1,662,917,500 1,693,132,500 Basic and diluted EPS P 1.15 P 1.21 P 0.98 There were no instruments that could potentially dilute basic earnings per share for years ended December 31, 2020, 2019 and 2018; hence, basic EPS is the same as diluted EPS.
28. COMMITMENTS AND CONTINGENCIES 28.1 Operating Lease Commitments – Group as Lessor The Group is a lessor under several operating leases covering certain condominium and parking units and retail building space (see Note 13). To manage its risks over these operating leases, the Group retains its legal title over the underlying assets and requiring its lessee to pay security deposits at the start of the lease. The leases have terms ranging from one to five years, with renewal options, and include annual escalation from 5.00% to 10.00%. The future minimum lease receivables under these agreements are presented below. 2020 2019 2018 Within one year P 53,712,626 P 59,467,774 P 53,665,650 After one year but not more than five years 71,468,344 91,924,899 108,046,002 More than five years 118,400,559 132,301,010 147,761,404 P 243,581,529 P 283,693,683 P 309,473,056
- 83 -
Rental income amounted to P55,237,972, P63,159,194 and P57,480,871 in 2020, 2019 and 2018, respectively (see Note 13). None of the rental income in 2020, 2019 and 2018 are relating to variable lease payments. 28.2 Operating Lease Commitments – Group as Lessee The Group entered into several short-term cancellable leases for its billboards, warehouse and staff house. Rent expense incurred from the short-term cancellable leases amounted to P18,441,626, P33,941,185 and P15,275,105 in 2020, 2019 and 2018, respectively, and is shown as rent under Operating Expenses in the consolidated statements of profit or loss (see Notes 19). As at December 31, 2020 and 2019, the expected future rentals is expected to be more or less the same with the annual rent expense recognized because of the terms of the leases, which are less than 12 months. 28.3 Completion of Sold Units The Group is obligated to finish the sold units that are at a certain stage of completion at the time of sale. The Group recognized a contract liability, which amounts to P532,649,347 and P418,967,659 as at December 31, 2020 and 2019, respectively, when it collects more than it is entitled to base on the stage of completion of the project development.
28.4 Purchase of Land As at December 31, 2020 and 2019, the Group had agreed in principle with multiple sellers of real estate properties in various locations in Visayas and Mindanao for the acquisition of parcels of land for about P122,412,000 and P519,370,669, respectively.
28.5 Capital Commitments for Construction Cost As at December 31, 2020 and 2019, the Group has capital commitments of about P7,492,397,005 and P10,431,516,500, respectively, for the construction of real estate inventories, property and equipment and investment properties.
28.6 Others There are other commitments and contingent liabilities that arise in the normal course of the Group’s operations that are not reflected in the consolidated financial statements. As at December 31, 2020 and 2019, management is of the opinion that losses, if any, from these items will not have a material effect on the Group’s consolidated financial statements.
29. EVENTS AFTER THE REPORTING PERIOD
29.1 Increase in Authorized Common Stock and Declaration of Stock Dividends
On February 26, 2021, the stockholders of the Parent Company representing at least two-thirds of the outstanding capital stock approved the following matters previously approved by the BOD (see also Note 26.1):
- 84 -
the increase of the authorized common stock from P2,400,000,000, divided into 2,400,000,000 common shares with a par value of P1.00 per share to P10,000,000,000, divided into 10,000,000,000 common shares with a par value of P1.00 per share; and,
the declaration of stock dividends of at least 1,900,000,000 common shares or
such number as sufficiently required for the increase in the authorized capital stock. The stock dividend record date and payment date are yet to be determined upon the approval of the SEC.
The Parent Company also applied for the amendment of Article VII of its Articles of Incorporation (AI) to reflect the increase in the authorized common stock. As at the issuance date of the 2020 consolidated financial statements of the Group, the approval of the SEC of the Parent Company’s application for such amendment in its AI is still pending.
29.2 Cash Dividends Declared On March 15, 2021, the BOD declared cash dividends of P0.25 per share totalling P388,749,900 to stockholders on record as of April 16, 2021. Such dividends will be paid on May 10, 2021.
29.3 New Joint Venture
In March 2021, CLI announced the signing of a P360,000,000 new joint venture agreement with an individual for a construction of a project named Sugbu Prime Estate Inc, which is a mixed-use property with retail space, dormitory rooms and a self-storage facility.
30. RISK MANAGEMENT OBJECTIVES AND POLICIES
The Group is exposed to certain financial risks in relation to financial instruments. The Group’s financial assets and liabilities by category are summarized in Note 31. The main types of risks are market risk, credit risk and liquidity risk. The Group’s risk management focuses on actively securing the Group’s short-to-medium term cash flows by minimizing the exposure to financial markets. Long-term financial investments are managed to generate lasting returns. It does not actively engage in the trading of financial assets for speculative purposes nor does it write options. The most significant financial risks to which the Group is exposed to are described as follows.
30.1 Market Risk The Group is exposed to market risk through its use of financial instruments and specifically to foreign currency risk and interest rate risk which result from its operating, investing, and financing activities. It has no significant foreign currency exposure risks as most of its transactions are carried out in Philippine pesos, its functional currency.
- 85 -
30.2 Credit Risk Credit risk is the risk of financial loss to the Group if the counterparty to a financial instrument fails to meet its contractual obligation. To manage credit risk, the Group maintains credit policies and monitors its exposure to credit risk on a continuous basis. Receivables balances are being monitored on a regular basis to ensure timely execution of necessary collection intervention efforts. In addition, the credit risk for trade receivables is mitigated as the Group transfers the corresponding title of the subdivision lots, house and lot units, condominium units and parking spaces only upon full payment of the contract price. (a) Maximum exposure to credit risk
The maximum credit risk exposure of financial assets is the carrying amount of the financial assets (including contract assets), as summarized below.
Notes 2020 2019 Cash and cash equivalents 5 P 797,184,790 P 917,170,651 Receivables1 6 6,125,399,982 5,825,594,990 Contract assets 17.2 13,856,650,495 8,892,510,028 Due from related parties 25.1 21,950,504 9,947,417 Refundable deposits 14 78,003,269 66,028,148 P 20,879,189,040 P 15,711,251,234
1 Receivables - net excludes advances to officers and employees.
The estimated fair value of collateral and other security enhancements held against contract receivables and contract assets are presented below.
Gross Fair Maximum Value of Net Exposure Collaterals Exposure
2020 Contract receivables P 5,807,986,200 P 10,147,922,434 P - Contract assets 13,856,650,495 26,384,721,070 - P 19,664,636,695 P36,532,643,504 P - 2019 Contract receivables P 5,556,006,058 P 9,183,650,125 P - Contract assets 8,892,510,028 14,593,100,548 - P 14,448,516,086 P 23,776,750,673 P -
- 86 -
(b) Credit risk concentration
Concentrations arise when a number of counterparties are engaged in similar business activities, or activities in the same geographic region, or have similar economic features that would cause their ability to meet contractual obligations to be similarly affected by changes in economic, political or other conditions. Concentrations indicate the relative sensitivity of the Group’s performance to developments affecting a particular industry or geographic location. In order to avoid excessive concentrations of risk, the Group’s policies and procedures include specific guidelines to focus on maintaining a diversified portfolio. Identified concentrations of credit risks are controlled and managed accordingly. An analysis of concentration of credit risk by location of the Group’s receivables and contract assets, net of allowance for impairment, is shown below.
2020 2019 Cebu P 11,173,348,620 P 9,117,063,839 Mindanao 4,782,102,029 3,434,208,473 Visayas 3,851,443,187 2,213,961,680 Luzon 645,199 3,338,974 P 19,807,539,035 P 14,768,572,966 (c) Credit quality
The Group classifies cash in banks as high grade as these are deposited with reputable banks.
Other receivables and refundable deposits are considered to be unrated and are neither past due nor impaired. For trade receivables, standard grade pertains to receivables with no default in payments and are effectively collateralized by the real estate inventories which can be subject to repossession upon non-payment of customers after reasonable collection effort has been exerted by the Group.
2020 Neither past due not impaired Past due but Individually High grade Standard grade Unrated not impaired impaired Total
Cash P 797,184,790 P - P - P - P - P 797,184,790 Receivables Contract - 5,807,986,200 - - - 5,807,986,200 Others - - 317,413,782 - 600,694 316,813,088 Contract assets - 13,856,650,495 - - - 13,856,650,495 Due from related parties - - 21,950,504 - - 21,950,504 Refundable deposits - - 78,003,269 - - 78,003,269 P 797,184,790 P19,664,636,695 P 417,367,555 P - P 600,694 P20,879,189,040
2019 Neither past due not impaired Past due but Individually High grade Standard grade Unrated not impaired impaired Total
Cash P 917,170,651 P - P - P - P - P 917,170,651 Receivables Contract - 5,556,006,058 - - - 5,556,006,058 Others - - 269,240,715 - 348,217 269,588,932 Contract assets - 8,892,510,028 - - 8,892,510,028 Due from related parties - - 9,947,417 - - 9,947,417 Refundable deposits - - 66,028,148 - - 66,028,148 P 917,170,651 P14,448,516,086 P 345,216,280 P - P 348,217 P 15,711,251,234
- 87 -
30.3 Liquidity Risk The Group manages its liquidity needs by carefully monitoring scheduled debt servicing payments for long-term financial liabilities as well as cash outflows due in a day-to-day business. Liquidity needs are monitored on a week-to-week basis, as well as on the basis of a rolling 30-day projection. Long-term liquidity needs for a six-month and one-year period are identified monthly. It maintains cash to meet its liquidity. Excess cash are invested in short-term placements. As at December 31, 2020 and 2019, the Group’s financial liabilities have contractual maturities which are presented below.
Current Non-current
Within 6 to 12 1 to 5 More than 6 Months Months Years 5 Years December 31, 2020 Interest-bearing loans and borrowings P 3,248,858,810 P 1,225,240,146 P 14,589,097,481 P 9,754,201,145 Trade and other payables2 4,269,010,584 2,177,862,221 894,416,447 - P 7,517,869,394 P 3,403,102,367 P15,483,513,928 P 9,754,201,145 December 31, 2019 Interest-bearing loans and borrowings P 2,439,386,519 P 1,096,521,437 P 10,534,354,238 P7,001,356,049 Trade and other payables2 4,402,542,794 1,194,174,188 71,610,604 - P 6,841,929,313 P2,290,695,625 P 10,605,964,842 P 7,001,356,049 2 Trade and other payables excludes output VAT, government-related obligations and advance rental. The contractual maturities reflect the gross cash flows, which may differ from the carrying values of the liabilities at the end of the reporting periods.
31. CATEGORIES AND OFFSETTING OF FINANCIAL ASSETS AND
FINANCIAL LIABILITIES AND FAIR VALUE MEASUREMENTS AND DISCLOSURES 31.1 Carrying Amounts and Fair Values by Category The carrying amounts and fair values of the categories of financial assets and financial liabilities presented in the consolidated statements of financial position are shown below. 2020 2019 Notes Carrying Value Fair Value Carrying Value Fair Value Financial Assets at amortized cost: Cash and cash equivalents 5 P 797,184,790 P 797,184,790 P 917,170,651 P 917,170,651 Receivables - net1 6 6,125,399,982 6,125,399,982 5,825,594,990 5,825,594,990 Due from related parties 25.1 21,950,504 21,950,504 9,947,417 9,947,417 Refundable deposits 14 78,003,269 78,003,269 66,028,148 66,028,148 P 7,022,538,545 P 7,022,538,545 P 6,841,532,888 P 6,841,532,888
Financial Liabilities at amortized cost: Interest-bearing loans and borrowings 15 P 23,793,983,711 P 23,757,633,171 P 16,846,756,577 P 16,811,221,475 Trade and other payables2 16 7,341,289,252 7,341,289,252 5,668,327,586 5,668,327,586 P 31,135,272,963 P 31,098,922,423 P 22,515,084,163 P 22,479,549,061 1 Receivables - net excludes advances to officers and employees. 2 Trade and other payables excludes output VAT, government-related obligations and advance rental.
- 88 -
See Note 2.5 for a description of the accounting policies for each category of financial instrument. A description of the Group’s risk management objectives and policies for financial instruments is provided in Note 30. 31.2 Offsetting of Financial Assets and Financial Liabilities The following financial assets with net amounts presented in the consolidated statements of financial position are subject to offsetting, enforceable master netting arrangements and similar agreements: Gross amounts recognized Net amount Related amounts not set-off in the consolidated presented in in the consolidated statements of financial position the consolidated statements of financial position Financial statements Cash Financial liabilities of financial Financial collateral assets set off position instruments received Net amount
December 31, 2020 Cash and cash equivalents P 797,184,790 P - P 797,184,790 P 793,255,290 P - P 3,929,500 December 31, 2019 Cash and cash equivalents P 917,170,651 P - P 917,170,651 P 749,160,824 P - P 168,009,827
The following financial liabilities with net amounts presented in the consolidated statements of financial position are subject to offsetting, enforceable master netting arrangements and similar agreements:
Net amount
Gross amounts recognized presented in Related amounts not set-off in the consolidated the consolidated in the consolidated statements of financial position statements statements of financial position Financial Financial of financial Financial Cash collateral liabilities assets set off position instruments received Net amount December 31, 2020 Interest-bearing loans and borrowings P 23,793,983,711 P - P 23,793,983,711 P 793,255,290 P - P 23,000,728,421 December 31, 2019 Interest-bearing loans and borrowings P 16,846,756,577 P - P 16,846,756,577 P 749,160,824 P - P 16,097,595,753
For financial assets and financial liabilities subject to enforceable master netting agreements or similar arrangements above, each agreement between the Group and counterparties (i.e., banks) allows for net settlement of the relevant financial assets and liabilities when both elect to settle on a net basis. In the absence of such an election, financial assets and liabilities will be settled on a gross basis, however, each party to the master netting agreement or similar agreement will have the option to settle all such amounts on a net basis in the event of default of the other party.
31.3 Fair Value Measurements and Disclosures (a) Fair Value Hierarchy
In accordance with PFRS 13, Fair Value Measurement, the fair value of financial assets and financial liabilities and non-financial assets which are measured at fair value on a recurring or non-recurring basis and those assets and liabilities not measured at fair value but for which fair value is disclosed in accordance with other relevant PFRS, are categorized into three levels based on the significance of inputs used to measure the fair value. The fair value hierarchy has the following levels: (a) Level 1: quoted prices (unadjusted) in active markets for identical assets or
liabilities that an entity can access at the measurement date;
- 89 -
(b) Level 2: inputs other than quoted prices included within Level 1 that are
observable for the asset or liability, either directly (i.e., as prices) or indirectly (i.e., derived from prices); and,
(c) Level 3: inputs for the asset or liability that are not based on observable market
data (unobservable inputs). The level within which the financial asset or liability is classified is determined based on the lowest level of significant input to the fair value measurement.
For purposes of determining the market value at Level 1, a market is regarded as active if quoted prices are readily and regularly available from an exchange, dealer, broker, industry group, pricing service, or regulatory agency, and those prices represent actual and regularly occurring market transactions on an arm’s length basis. For investments which do not have quoted market price, the fair value is determined by using generally acceptable pricing models and valuation techniques or by reference to the current market value of another instrument which is substantially the same after taking into account the related credit risk of counterparties, or is calculated based on the expected cash flows of the underlying net asset base of the instrument. When the Group uses valuation technique, it maximizes the use of observable market data where it is available and relies as little as possible on entity specific estimates. If all significant inputs required to determine the fair value of an instrument are observable, the instrument is included in Level 2. Otherwise, it is included in Level 3.
(b) Financial Instruments Measured at Amortized Cost for which Fair Value is
Disclosed The table below summarizes the fair value hierarchy of the Group’s financial assets and financial liabilities, which are not measured at fair value in the 2020 and 2019 consolidated statements of financial position, but for which fair value is disclosed (see Note 31.1). 2020 Level 1 Level 2 Level 3 Total Financial assets Cash and cash equivalents P 797,184,790 P - P - P 797,184,790 Receivables – net1 - - 6,125,399,982 6,125,399,982 Due from related parties - - 21,950,504 21,950,504 Refundable deposits - - 78,003,269 78,003,269 P 797,184,790 P - P 6,225,353,755 P 7,022,538,545 Financial liabilities Interest-bearing loans and borrowings P - P - P 23,757,633,171 P 23,757,633,171 Trade and other payables2 - - 7,341,289,252 7,341,289,252 P - P - P 31,098,922,423 P 31,098,922,423
1 Receivables - net excludes advances to officers and employees. 2 Trade and other payables excludes output VAT, government-related obligations and advance rental.
- 90 -
2019 Level 1 Level 2 Level 3 Total Financial assets Cash and cash equivalents P 917,170,651 P - P - P 917,170,651 Receivables – net1 - - 5,825,594,990 5,825,594,990 Due from related parties - - 9,947,417 9,947,417 Refundable deposits - - 66,028,148 66,028,148 P 917,170,651 P - P 5,901,570,555 P 6,818,741,206 Financial liabilities Interest-bearing loans and borrowings P - P - P 16,811,221,475 P 16,811,221,475 Trade and other payables2 - - 5,668,327,586 5,668,327,586 P - P - P 22,479,549,061 P 22,479,549,061
1 Receivables - net excludes advances to officers and employees. 2 Trade and other payables excludes output VAT, government-related obligations and advance rental.
For the Group’s financial assets and financial liabilities, which are measured at amortized cost, management has determined that their carrying amounts are equal to or approximate their fair values, except for interest-bearing loans and borrowings, because of their short-term nature.
(c) Fair Value Measurement for Non-financial Assets
The Group has no non-financial assets measured at fair value as at December 31, 2020 and 2019. However, the fair values of its investment properties are required to be disclosed, as shown in Note 13.
The table below shows the Levels within the hierarchy of non-financial assets (investment property), which are not carried at fair value but whose fair value are required to be disclosed on a recurring basis as at December 31, 2020 and 2019. Level 1 Level 2 Level 3 Total December 31, 2020 Investment property P - P - P 11,943,650,421 P11,943,650,421 December 31, 2019 Investment property P - P - P10,242,045,810 P10,242,045,810
In 2020 and 2019, the fair value of the Group’s Investment Properties is determined on the basis of the appraisals performed by an independent external appraiser with appropriate qualifications and recent experience in the valuation of similar properties in the relevant locations. To some extent, the valuation process was conducted by the appraiser in discussion with the Group’s management with respect to the determination of the inputs such as the size, age, and condition of the parcels of land and buildings, and the comparable prices in the corresponding property location. The fair value of these parcels of land, condominium units and retail building were determined based on the following approaches: (a) Fair Value Measurement for Land, Condominium Units and Retail Buildings
The Level 3 fair value of the parcels of land, condominium units, retail building and parking slots under Investment Properties account was determined using the market approach, adjusted for differences in key attributes such as properties size, zoning and accessibility.
- 91 -
Under the market approach, when comparable lease offerings of similar properties and sales prices of comparable land properties in close proximity are used in the valuation of the subject property with insignificant adjustment on the price, fair value is included in Level 2. Consequently, if the observable recent prices of the reference properties were adjusted significantly for differences in key attributes such as properties size, zoning and accessibility, the fair value is included in Level 3. The most significant input into this valuation approach is the price per square foot; hence, the higher the price per square foot, the higher the fair value.
(b) Fair Value Measurement for Improvements under Retail Buildings
The Level 3 fair value of building improvements presented as part of retail buildings under Investment Properties account was determined using the cost approach that reflects the cost to a market participant to construct an asset of comparable usage, construction standards, design and layout, adjusted for obsolescence. The more significant inputs used in the valuation include direct and indirect costs of construction such as but not limited to, labor and contractor’s profit, materials and equipment, surveying and permit costs, electricity and utility costs, architectural and engineering fees, insurance and legal fees. These inputs were derived from various suppliers and contractor’s quotes, price catalogues, and construction price indices. Under this approach, higher estimated costs used in the valuation will result in higher fair value of the properties. There has been no change on the valuation techniques used by the Group, except as indicated above, during the period for its investment properties. Also, there were no transfers into or out of Level 2 fair value hierarchy for the years ended December 31, 2020 and 2019.
32. CAPITAL MANAGEMENT OBJECTIVES, POLICIES AND PROCEDURES
The Group’s capital management objectives are to ensure the Group’s ability to continue as a going concern and to provide an adequate return to shareholders by pricing products and services commensurate with the level of risk.
The Group monitors capital on the basis of the carrying amount of equity as presented in the consolidated statements of financial position. Capital for the reporting periods under review is summarized as follows: 2020 2019 Total liabilities P34,563,259,985 P 24,535,183,948 Total equity 15,527,241,458 13,748,258,288 Debt-to-equity ratio 2.23:1.00 1.78:1.00 The Group’s goal in capital management is to limit a maximum debt-to-equity structure ratio of 75:25 on a monthly basis. The Parent Company is required to certain financial ratios in relation with its borrowings (see Note 15.2). The Group has complied with its covenant obligations for both years ended December 31, 2020 and 2019.
- 92 -
The Group sets the amount of capital in proportion to its overall financing structure, i.e., equity and financial liabilities. The Group manages the capital structure and makes adjustments to it in the light of changes in economic conditions and the risk characteristics of the underlying assets. In order to maintain or adjust the capital structure, the Group may adjust the amount of dividends paid to shareholders, issue new shares or sell assets to reduce debt.
33. RECONCILIATION OF LIABILITIES ARISING FROM FINANCING
ACTIVITIES
Presented below is the reconciliation of the Company’s liabilities arising from financing activities, which includes both cash and non-cash changes. Lease Bank Loans Liabilities (see Note 15) (see Note 12) Total
Balance as of January 1, 2020 P 16,846,756,577 P 140,276,458 16,987,033,035 Cash flows from financing activities Additional borrowings 12,583,999,063 - 12,583,999,063 Repayment of borrowings ( 5,672,248,772 ) ( 105,339,849 ) ( 5,777,588,621 )
Balance at December 31, 2020 P23,793,983,711 P 834,733,975 P24,628,717,686
Balance as of January 1, 2019 P 10,641,280,311 P - P 10,641,280,311 Cash flows from financing activities Additional borrowings 10,453,706,073 - 10,453,706,073 Repayment of borrowings ( 4,265,207,842 ) ( 39,719,752 ) ( 4,304,927,594 )
Balance at December 31, 2019 P 16,846,756,577 P 140,276,458 P 16,987,033,035
34. OTHER MATTERS 34.1 Continuing Impact of COVID-19 Pandemic In late December 2019, the number of coronavirus (COVID-19) cases in Wuhan, China increased and has grown rapidly and has even reached other countries already by late January 2020. On March 11, 2020, the World Health Organization declared COVID-19 to be a global pandemic. This turn of events has forced the national government to place the Philippines on March 16, 2020 under a State of Calamity with the rising COVID-19 cases in the country.
- 93 -
The COVID-19 pandemic’s unprecedented impact and the government’s stringent quarantine measures to ease the spread of the virus has affected the Visayas and Mindanao (VisMin) regions where the Group operates causing reduced business operation in terms of the following:
Reduced construction site operations to an average of 70% capacity due to travel and transportation restrictions;
Lowered business efficiency caused by work from home arrangement;
Delayed permit approvals for new project launches;
Increased, though slight, contract cancellations and delinquency due to increase in local and OFW unemployment rate;
Decreased in revenue from hotel operations of P21,452,978 as compared to budget due to travel restrictions;
Decreased rental revenue by P7,921,222 due to lower foot traffic, temporary closure of businesses, and lease concessions such as rent discounts, rent holidays or pre-termination; and,
Incurred extra costs amounting to P19,716,105 to promote health and safety protocols for both customers and employees to lessen the spread of the virus, cash assistance given to Group employees and third party contractors workers and support or donation to frontliners and local government units.
The overall impact of the foregoing is a decline in the Group and Parent Company’s year on year net profit by 15% and 8%, respectively.
To mitigate the risks, the Group has implemented the following action plans:
Operated construction site and branches as allowed by the government and quarantine guidelines amidst the enhanced community quarantine and as majority of materials and labor are being sourced locally. By fourth quarter of 2020, the Group ramped up to 90% operations with the easing of the community quarantine restrictions;
Focused in launching economic and middle market segments to address the resilient demand for quality housing despite the pandemic;
Offered promotions to new buyers by stretching equity installment terms to boost reservation sales;
Granted payment deferrals and grace period to buyers on their equity installments upon request;
Implemented and observed heightened safety and health standards, for customers and employees, and provided flexible work from home arrangements and employees transportation to reduce transmission of COVID-19 within the workplace;
Strengthened digitalization and innovation across all business segments. During the year, the Group launched several digital platforms such as:
a. Buy-A-Home microsite to provide sales partners quick access to new project inventories and promotions;
b. Masters Portal application for homeowners to track their payment status, get CLI construction updates and promos; and,
c. Facebook chatbot for 24/7 response to general inquiries.
- 94 -
Based on the above actions and measures taken by management to mitigate the adverse effect of the COVID-19 pandemic, management expects that the Group would continue to report positive results of operations and would remain liquid to meet current obligations as it falls due. Accordingly, management has not determined material uncertainty that may adversely affect the Group’s financial stability and profitability.
34.2 Corporate Recovery and Tax Incentives for Enterprises (CREATE) Bill As at the issuance date of the 2020 consolidated financial statements of the Group, the CREATE Bill is yet to be enacted into a law. The CREATE Bill aims to lower certain corporate taxes and rationalize tax incentives given to certain taxpayers. Based on the current draft, the effective of CREATE Bill for the new corporate income tax is July 1, 2020. When enacted, based on the Bicameral Committee’s approved version, the effective regular corporate income tax rate applicable to the Company from January 1, 2020 to June 30, 2020 and July 1, 2020 to December 31, 2020 will be 30% and 25%, respectively. Pending the enactment of the CREATE Bill, the Group used the prevailing regular corporate income tax rate of 30% as of December 31, 2020 in determining its current and deferred taxes in its 2020 financial statements (see Note 24). Nevertheless, once enacted, the Group’s current and deferred taxes are expected to decrease proportionate to the decrease in tax rate.
Punongbayan & Araullo 20th Floor, Tower 1 The Enterprise Center 6766 Ayala Avenue 1200 Makati City Philippines
T +63 2 8988 22 88
Certified Public Accountants Punongbayan & Araullo (P&A) is the Philippine member firm of Grant Thornton International Ltd (GTIL). Offices in Cavite, Cebu, Davao BOA/PRC Cert. of Reg. No. 0002 SEC Accreditation No. 0002-FR-5
grantthornton.com.ph
Report of Independent Auditors to Accompany Supplementary Information Required by the Securities and Exchange Commission Filed Separately from the Basic Consolidated Financial Statements The Board of Directors and Stockholders Cebu Landmasters, Inc. and Subsidiaries (A Subsidiary of A B Soberano Holdings Corp.) 10th Floor, Park Centrale Tower Jose Ma. Del Mar St., B2 L3 Cebu I.T. Park, Brgy., Apas Cebu City We have audited in accordance with Philippine Standards on Auditing, the consolidated financial statements of Cebu Landmasters, Inc. and subsidiaries (the Group) for the year ended December 31, 2020, on which we have rendered our report dated March 24, 2021. Our audit was made for the purpose of forming an opinion on the basic consolidated financial statements taken as a whole. The applicable supplementary information (see List of Supplementary Information) is presented for purposes of additional analysis in compliance with the requirements of the Revised Securities Regulation Code Rule 68 and is not a required part of the basic financial statements prepared in accordance with Philippine Financial Reporting Standards. Such supplementary information is the responsibility of management. The supplementary information has been subjected to the auditing procedures applied in the audit of the basic consolidated financial statements and, in our opinion, is fairly stated in all material respects in relation to the basic consolidated financial statements taken as a whole. PUNONGBAYAN & ARAULLO By: Christopher M. Ferareza Partner CPA Reg. No. 0097462 TIN 184-595-975 PTR No. 8533229, January 4, 2021, Makati City SEC Group A Accreditation Partner - No. 1185-AR-2 (until May 9, 2021) Firm - No. 0002 (until Dec. 31, 2024) BIR AN 08-002511-34-2020 (until Jun. 25, 2023) Firm’s BOA/PRC Cert. of Reg. No. 0002 (until Jul. 24, 2021) March 24, 2021
got
2288
Table of Contents
Schedule Description Page
Schedules Required under Annex 68-J of the Revised Securities Regulation Code Rule 68
A Financial Assets 1
B Amounts Receivable from Directors, Officers, Employees, Related Parties,and Principal Stockholders (Other than Affiliates) 2
C Amounts Receivable from Related Parties which are eliminated during theconsolidation of financial statements 3
D Long-Term Debt 4
E Indebtedness to Related Parties 5
F Guarantees of Securities of Other Issuers 6
G Capital Stock 7
Other Required Information
Map Showing the Relationship Between and Among the Company andIts Ultimate Parent, Subsidiaries and Associates 8
Reconciliation of Retained Earnings Available for Dividend Declarationas of December 31, 2020 9
Cebu Landmasters, Inc. and Subsidiaries(A Subsidiary of A B Soberano Holdings Corp.)
List of Supplementary InformationDecember 31, 2020
Amount Shown in the Statement of Financial
Position Income Received
and Accrued
Financial Assets at Amortized CostCash and Cash Equivalents
Cash in banks 751,514,323 P 2,625,116 P Short-term placements 41,740,967 6,075,985 Cash on hand 3,929,500 -
176,048,936 P 109,300,763 P - 5,966,924 )( P - 279,382,775 P - 279,382,775 P
*Due within one year**Due beyond one year
Name and designation of debtor
Cebu Landmasters, Inc. and SubsidiariesSchedule B - Amounts Receivable from Directors, Officers, Employees, Related Parties and Principal Stockholders (Other than Affiliates)
December 31, 2020
Deductions Ending Balance
P PP
P P P
P
2
Name and Designation of debtorBalance at
beginning of period
Additions Reclassification Amounts collected
Amounts written off Current* Non-current** Balance at
end of period
CLI Premier Hotels Int’l. Inc. 1,610,883 P 15,806,420 P - - - 17,417,303 P - 17,417,303 P Cebu Landmasters Property Management, Inc. 2,060,710 11,366,513 - 6,018,626 )( - 7,408,596 - 7,408,596 A.S. Fortuna Property Ventures, Inc. - - 59,610,753 )( - - (59,610,753) - 59,610,753 )( BL CBP Ventures, Inc. 174,600 10,644,131 - 8,654,605 )( - 2,164,126 - 2,164,126 Yuson Excellence Soberano, Inc. 73,567 48,292,946 - 2,825,071 )( - 45,541,442 - 45,541,442 CCLI Premier Hotels Int’l. Inc. 6,227,795 12,608 - - - 6,240,403 - 6,240,403 Mivesa Garden Residences, Inc. 1,230,635 9,984,594 - 5,812,094 )( - 5,403,136 - 5,403,136 El Camino Developers Cebu, Inc. 4,476,285 - 803,149 )( 8,675,903 )( - (5,002,768) - 5,002,768 )( Yuson Huang Excellence Soberano, Inc. 80,077 5,892,625 - 4,116,057 )( - 1,856,645 - 1,856,645 YHEST Realty and Development Corporation 37,785 172,037 - - - 209,822 - 209,822
15,972,337 P 312,252,797 P 60,413,906 )( P 36,102,356 )( P - 231,708,872 P - 231,708,872 P
*Due within one year**Due beyond one year
Cebu Landmasters, Inc. and SubsidiariesSchedule C - Amounts Receivable from Related Parties which are eliminated during the consolidation of financial statements
December 31, 2020
Deductions
P P
P PP P
3
Title of issue and type of obligation
Amount shown under caption"Current portion of long-term debt" in related
Statement of Financial Position
Amount shown under caption"Long-Term Debt" in related Statement of Financial
Position
Interest Rate No. of Periodic Installments Maturity Date
Promissory notesBank of the Philippine Islands 593,009,670 P 3,215,021,654 P 4.0000% to 7.1250% Various 01/20/21 to 09/24/28Land Bank of the Philippines 225,727,433 1,687,028,009 4.0310% to 5.2500% Various 05/30/28 to 08/30/29BDO, Unibank 76,933,015 829,901,483 1.8400% to 6.000% Various 07/25/27Bank of Commerce 100,000,000 - 4.750% Various 01/20/21Development Bank of the Philippines - 374,996,428 4.2010% to 5.0000% Various 09/30/26 to 05/30/34China Banking Corporation 174,189,899 267,737,374 5.2500% to 6.2500% Various 03/08/23 to 06/26/23Rizal Commercial Banking Corporation - 436,123,058 4.8000% to 5.5500% Various 06/28/26 to 12/23/30Philippine National Bank 246,825,000 722,341,671 4.0000% to 6.5000% Various 12/06/21 to 07/12/24
1,416,685,017 7,533,149,676
Corporate notesBDO Unibank Inc. - 990,072,253 7.25% 17 12/20/25Bank of the Philippine Islands - 1,681,813,017 3.5370% to 7.2500% 17 12/20/25China Banking Corporation - 3,950,626,226 3.4610% to 7.2500% 13 to 29 09/04/25 to 10/20/28Development Bank of the Philippines - 1,974,560,914 3.5370% to 4.6553% 17 04/28/27Land Bank of the Philippines 17,857,143 1,958,791,935 4.2323% to 6.6300% 29 08/02/28 to 03/10/30Rizal Commercial Banking Corporation - 1,974,175,349 3.5370% to 4.6553% 13-17 09/04/25 to 04/28/27Social Security System - 296,252,181 3.461% 12 09/04/25ALFM 2,000,000,000 - 4.75% 1 04/30/21
2,017,857,143 12,826,291,875
3,434,542,160 P 20,359,441,551 P
Cebu Landmasters, Inc. and SubsidiariesSchedule D - Long-Term Debt
December 31, 2020
4
Name of related party Balance at beginning of period
Balance at end of period
Cebu Landmasters, Inc. and SubsidiariesSchedule E - Indebtedness to Related Parties
December 31, 2020
NOT APPLICABLE
5
Name of issuing entity of securities guaranteed by the company for which this statement is filed
Title of issue of each class of securities
guaranteed
Total amount guaranteed and
outstanding
Amount owned by person for which statement is filed
Nature of guarantee
Cebu Landmasters, Inc. and SubsidiariesSchedule F - Guarantees of Securities of Other Issuers
December 31, 2020
NOT APPLICABLE
6
Title of Issue Number of shares authorized
Number of shares issued and outstanding as
shown under the related Statement of Financial
Position caption
Number of shares reserved for options,
warrants, coversion and other rights
Related parties Directors, officers and employees Others
Common shares - P1 par value Authorized 2,400,000,000 Issued and outstanding 1,554,999,600 159,000,400 994,395,197 21,750,003 538,854,400
Preferred Shares - P0.10 par value Authorized 1,000,000,000 Issued and outstanding - - - - -
Cebu Landmasters, Inc. and SubsidiariesSchedule G - Capital Stock
December 31, 2020
Number of shares held by
7
8
CEBU LANDMASTERS, INC. AND SUBSIDIARIES Map Showing the Relationship Between and Among the Company and its Ultimate Parent, Subsidiaries, and Associates December 31, 2020
Subsidiary
A B Soberano Holdings Corp.
Ultimate Parent Company
50% 50% 50%
Yuson Huang Excellence Soberano, Inc.
Subsidiary
YHEST Realty and Development Corporation
Subsidiary
CCLI Premier Hotels Int’l. Inc.
Subsidiary
Cebu Landmasters, Inc.
CLI Premier Hotels Int’l. Inc.
Subsidiary
Cebu Landmasters Property Management, Inc.
Subsidiary
Yuson Excellence Soberano, Inc.
Subsidiary
A.S. Fortuna Property Ventures, Inc.
Subsidiary
BL CBP Ventures, Inc.
Subsidiary
100% 50% 50% 100% 100%
58.02%
Parent Company
Cebu Homegrown Developers, Inc.
Subsidiary
50%
Mivesa Garden Residences, Inc.
Subsidiary
45%
25% 20% 33%
Magspeak Nature Park, Inc.
Associate
Ming-mori Development Corporation
Associate
ICOM Air Corporation
Associate
35% 50%
El Camino Developers Cebu, Inc.
Subsidiary
Cebu BL-Ramos Ventures, Inc.
Subsidiary
YHES Premier Hotels, Inc.
Subsidiary
Unappropriated Retained Earnings at Beginning of Year 1,645,542,496 P
Prior Year's Outstanding Reconciling Items, net of taxShare in profit of subsidiaries and associates 684,385,868 )( Treasury stock, at cost 247,193,811 )(
Unappropriated Retained Earnings Available for Dividend declaration at beginning of Year, as Adjusted 713,962,817
Net Profit Realized during the Year 1,865,522,967 P Share in profit of subsidiaries and associates 149,343,091 )( 1,716,179,876
Other Transactions During the YearAppropriation of retained earnings 3,300,000,000 )( Release of appropriated retained earnings 2,400,495,377 Dividend declared 414,795,000 )( Acquisition of treasury stock during the year 485,657,205 )( 1,799,956,828 )(
Unappropriated Retained Earnings Available for Dividend declaration at end of Year 630,185,865 P
(Amounts in Philippine Pesos)
CEBU LANDMASTERS, INC.(A Subsidiary of A B Soberano Holdings Corp.)
Reconciliation of Retained Earnings Available for Dividend Declaration10th Floor, Park Centrale Tower, Jose Ma. Del Mar St., B2 L3, Cebu I.T. Park, Brgy. Apas, Cebu City
as of December 31, 2020
9
,
Punongbayan & Araullo 20th Floor, Tower 1 The Enterprise Center 6766 Ayala Avenue 1200 Makati City Philippines
T +63 2 8988 22 88
Certified Public Accountants Punongbayan & Araullo (P&A) is the Philippine member firm of Grant Thornton International Ltd (GTIL). Offices in Cavite, Cebu, Davao BOA/PRC Cert. of Reg. No. 0002 SEC Accreditation No. 0002-FR-5
grantthornton.com.ph
Report of Independent Auditors on Components of Financial Soundness Indicators The Board of Directors and Stockholders Cebu Landmasters, Inc. and Subsidiaries (A Subsidiary of A B Soberano Holdings Corp.) 10th Floor, Park Centrale Tower Jose Ma. Del Mar St., B2 L3 Cebu I.T. Park, Brgy., Apas Cebu City We have audited, in accordance with Philippine Standards on Auditing, the consolidated financial statements of Cebu Landmasters, Inc. and subsidiaries (the Group) as at December 31, 2020 and 2019 and for each of the three years in the period ended December 31, 2020, and have issued our report thereon dated March 24, 2021. Our audits were made for the purpose of forming an opinion on the basic consolidated financial statements taken as a whole. The Supplementary Schedule on Financial Soundness Indicators, including their definitions, formulas, calculation, and their appropriateness or usefulness to the intended users, are the responsibility of the Group’s management. These financial soundness indicators are not measures of operating performance defined by Philippine Financial Reporting Standards (PFRS) and may not be comparable to similarly titled measures presented by other companies. This schedule is presented for the purpose of complying with the Revised Securities Regulation Code Rule 68 issued by the Securities and Exchange Commission, and is not a required part of the basic consolidated financial statements prepared in accordance with PFRS. The components of these financial soundness indicators have been traced to the Group’s consolidated financial statements as at December 31, 2020 and 2019 and for each of the three years in the period ended December 31, 2020 and no material exceptions were noted. PUNONGBAYAN & ARAULLO By: Christopher M. Ferareza Partner CPA Reg. No. 0097462 TIN 184-595-975 PTR No. 8533229, January 4, 2021, Makati City SEC Group A Accreditation Partner - No. 1185-AR-2 (until May 9, 2021) Firm - No. 0002 (until Dec. 31, 2024) BIR AN 08-002511-34-2020 (until Jun. 25, 2023) Firm’s BOA/PRC Cert. of Reg. No. 0002 (until Jul. 24, 2021) March 24, 2021
got
2288
CEBU LANDMASTERS, INC. AND SUBSIDIARIES(A Subsidiary of A B Soberano Holdings Corp.)
Supplemental Schedule of Financial Soundness IndicatorsDecember 31, 2020 and 2019
(Amounts in Philippine Pesos)
2020 2019Total Current Assets divided by Total Current 2.41 Total Current Assets divided by Total Current 2.56Liabilities Liabilities
Total Current Assets 27,600,305,172 Total Current Assets 22,932,778,503 Divide by: Total Current Divide by: Total Current Liabilities 11,453,378,896 Liabilities 8,971,181,909 Current Ratio 2.41 Current Ratio 2.56
0.92 1.11
Csah and cash equivalents 797,184,790 Csah and cash equivalents 917,170,651 Add: Current Receivables 6,020,754,434 Add: Current Receivables 5,204,137,996 Current Contract Current Contract Assets 3,642,591,056 Assets 3,799,666,118 Due from Related Due from Related Parties 21,950,504 Parties 9,947,417 Quick Assets 10,482,480,784 Quick Assets 9,930,922,182 Divide by: Total Current Divide by: Total Current Liabilities 11,453,378,896 Liabilities 8,971,181,909 Acid test ratio 0.92 Acid test ratio 1.11
Total Liabilities divided by Total Assets 0.69 Total Liabilities divided by Total Assets 0.64
Total Liabilities 34,563,259,985 Total Liabilities 24,535,183,948 Divide by: Total Assets 50,090,501,443 Divide by: Total Assets 38,283,442,236 Solvency ratio 0.69 Solvency ratio 0.64
Total Liabilities divided by Total Equity 2.23 Total Liabilities divided by Total Equity 1.78
Total Liabilities 34,563,259,985 Total Liabilities 24,535,183,948 Divide by: Total Equity 15,527,241,458 Divide by: Total Equity 13,748,258,288 Debt-to-equity ratio 2.23 Debt-to-equity ratio 1.78
Total Assets divided by Total Equity 3.23 Total Assets divided by Total Equity 2.78
Total Assets 50,090,501,443 Total Assets 38,283,442,236 Divide by: Total Equity 15,527,241,458 Divide by: Total Equity 13,748,258,288 Assets-to-equity ratio 3.23 Assets-to-equity ratio 2.78
2.83 4.01
Profit before tax 2,791,580,908 Profit before tax 3,181,493,724 Add: Interest charged to: Add: Interest charged to: Cost of Sales 394,329,036 Cost of Sales 135,900,814 Finance cost 2,439,236 Finance cost 33,629,596 EBIT 3,188,349,180 EBIT 3,351,024,134
Divide by: Interest Expense* 1,124,829,121 Divide by: Interest Expense* 836,174,726 Interest rate coverage ratio 2.83 Interest rate coverage ratio 4.01
*Includes 1,122,389,885 interest capitalized as part *Includes 802,545,130 interest capitalized as partof real estate inventory and investment property of real estate inventory and investment property
Return on Net Profit divided by Total Ave. Equity 14% Net Profit divided by Total Ave. Equity 19%equity
Net Profit 2,075,727,321 Net Profit 2,437,937,509 Divide by: Total Ave. Equity 14,637,749,873 Divide by: Total Ave. Equity 12,548,692,033 Return on equity 14% Return on equity 19%
Return on Net Profit divided by Total Ave. Assets 5% Net Profit divided by Total Ave. Assets 6%assets
Net Profit 2,075,727,321 Net Profit 2,437,937,509 Divide by: Total Ave. Asssets 44,186,971,840 Divide by: Total Ave. Asssets 38,151,600,629 Return on assets 5% Return on assets 6%
Net profit Net Profit divided by Revenues 25% Net Profit Divided by Revenues 29%margin
Net Profit 2,075,727,321 Net Profit 2,437,937,509 Divide by: Total Revenue 8,298,820,318 Divide by: Total Revenue 8,499,047,935 Return on assets 25% Return on assets 29%
Other ratioGross Gross Profit divided by Total Revenue 48% Gross Profit divided by Total Revenue 49%profitmargin Gross Profit 4,016,708,860 Gross Profit 4,198,362,958
Divide by: Total Revenue 8,298,820,318 Divide by: Total Revenue 8,499,047,935 Gross profit margin 48% Gross profit margin 49%
Earnings before interest and taxes (EBIT) divided by Interest expense
Ratio Formula FormulaCurrent ratio
Acid test ratio Quick assets (Cash and cash equivalents plus Current Receivables and Current Receivables and Due from Related Parties) divided by Total Current Liabilities
Quick assets (Cash and cash equivalents plus Current Receivables and Current Receivables and Due from Related Parties) divided by Total Current Liabilities
Solvency ratio
Debt-to-equity ratio
Assets-to-equity ratio
Interest ratecoverageratio
Earnings before interest and taxes (EBIT) divided by Interest expense