63
Copyright @ 2020 McKinsey & Company. All rights reserved. Updated: April 24, 2020 Global health and crisis response COVID-19: Briefing materials

Copyright @ 2020 McKinsey & Company. All rights reserved.
Updated: April 24, 2020
Global health and crisis response
COVID-19:Briefing materials

COVID-19 is, first and foremost, a global humanitarian challenge. Thousands of health professionals are heroically battling the virus, putting their own lives at risk. Governments and industry are working together to understand and address the challenge, support victims and their families and communities, and search for treatments and a vaccine.
Companies around the world need to act promptly. This document is meant to help senior leaders understand the COVID-19 situation and how it may unfold, and take steps to protect their employees, customers, supply chains, and financial results.
Read more on McKinsey.com
Current as of April 24, 2020
McKinsey & Company 2

McKinsey & Company 3
At the time of writing, COVID-19 cases have exceeded 2.6 million and are increasing quickly around the world, with concerns that a 15% hospitalization rate could drive hospital system overload.
To reduce growth in cases, governments have moved to stricter social distancing, with “shelter in place” orders in many areas in the U.S., Europe, India, and other countries. This has driven rapid demand declines and fears of recessions, which governments are trying to meet through bailouts and other fiscal measures.
Some Asian countries, such as China, have kept incremental cases low, and are restarting economies. So far, there is little evidence of a resurgence in infections, though reinfection from travel abroad is being reported.
How the situation may evolve
3McKinsey & Company
Executive summary
Actions that institutions can takeHaving invested in setting up a basic structure to drive basic Resolve and Resilience planning, public and private sector institutions around the world are engaged in continuing protection of people (including workforce and customers), stabilizing supply chain (esp. PPE), as well as ensuring adequate cash and liquidity on hand.
For many governments and companies, focus is now shifting to what a gradual reopening and Return to work may look like with the end of shelter-in-place provisions.
Re-openings are being proposed in a wide variety of contexts, with some geographies considering opening after cases have plateaued, while others are seeking additional verifications, such as adequate hospital and testing capacity.
An effective Return depends on a number of factors – from ensuring that the local region has adequate readiness for a restart from a public health standpoint, to estimating timing for a return of demand, and other factors.
The situation now
There is a limited window for governments to drive adequate public-health responses and meet demand drawdowns with proportionate economic interventions. Without this, the possibility of a deeper effect on lives and livelihoods is more likely.
Scaled-up testing could clarify the extent and distribution of spread in the U.S., and Europe. There continues to be concern about the extent of spread and its consequences in countries with large populations and higher population densities.
Learnings from other countries and recent innovations (strict social distancing rules, drive through testing, off-the-shelf drugs that can address mild cases, telemedicine enabled home care) could provide basis for a restart.

Contents
McKinsey & Company 4
COVID-19:The situation now
01Scenarios and path forward
02Sector-specific impact
03Planning and managing COVID-19 responses
04

McKinsey & Company 5Source: World Health Organization, John Hopkins University, CDC, news reports
The global spread is accelerating with more reports of local transmissionLatest as of April 24 2020
1.Previously counted only countries; now aligned with WHO reports to include territories and dependencies; excluding cruise ship2.Previously noted as community transmission in McKinsey documents; now aligned with WHO definition
Impactto date
81Countries or territories with more than 1000 reported cases1
>184,600Deaths
Africa share of new reported cases April 16 – April 22
<1%
Countries or territories with reported cases1
>212
Europe share of new reported cases April 16 – April 22
~43%US share of new reported cases April 16 – April 22
~36%
>180Countries or territories with evidence of local transmission2
Reported confirmed cases
>2.64M
South America share of new reported cases April 16 – April 22
~6%
Current as of April 24, 2020

McKinsey & Company 6
Current as of April 24, 2020
The virushas spread worldwide despite containment efforts
Source: World Health Organization, Johns Hopkins University, McKinsey analysis
1. Johns Hopkins data used for U.S., all other North America countries reporting from WHO2. Includes Western Pacific and South–East Asia WHO regions; excludes China; note that South Korea incremental cases are declining, however other countries are increasing3. Eastern-Mediterranean WHO region4. Includes Australia, New Zealand, Fiji, French Polynesia, New Caledonia, Papua New Guinea5. Increasing: > 5% average daily case increase over 7 days; stabilizing: -5% ~ 5% average daily case increase over 7 days; decreasing: < -5% average daily case increase over 7 days
250-999
<50
50-250
Propagation trend5
1,000-9,999 reported cases
10,000-99,999 reported cases
>100,000 reported cases
Asia (excl. China)2
Total casesTotal deaths
>78,000>2,00
Middle East3
Total casesTotal deaths
>139,300>6,300
EuropeTotal casesTotal deaths
>1,219,400>109,900
South AmericaTotal casesTotal deaths
>86,900>4,000
Oceania4
Total casesTotal deaths
>7,800>80
North and Central America1
Total casesTotal deaths
>901,00>49,600
ChinaTotal casesTotal deaths
>84,200>4,600
AfricaTotal casesTotal deaths
>16,100>700
McKinsey & Company 7
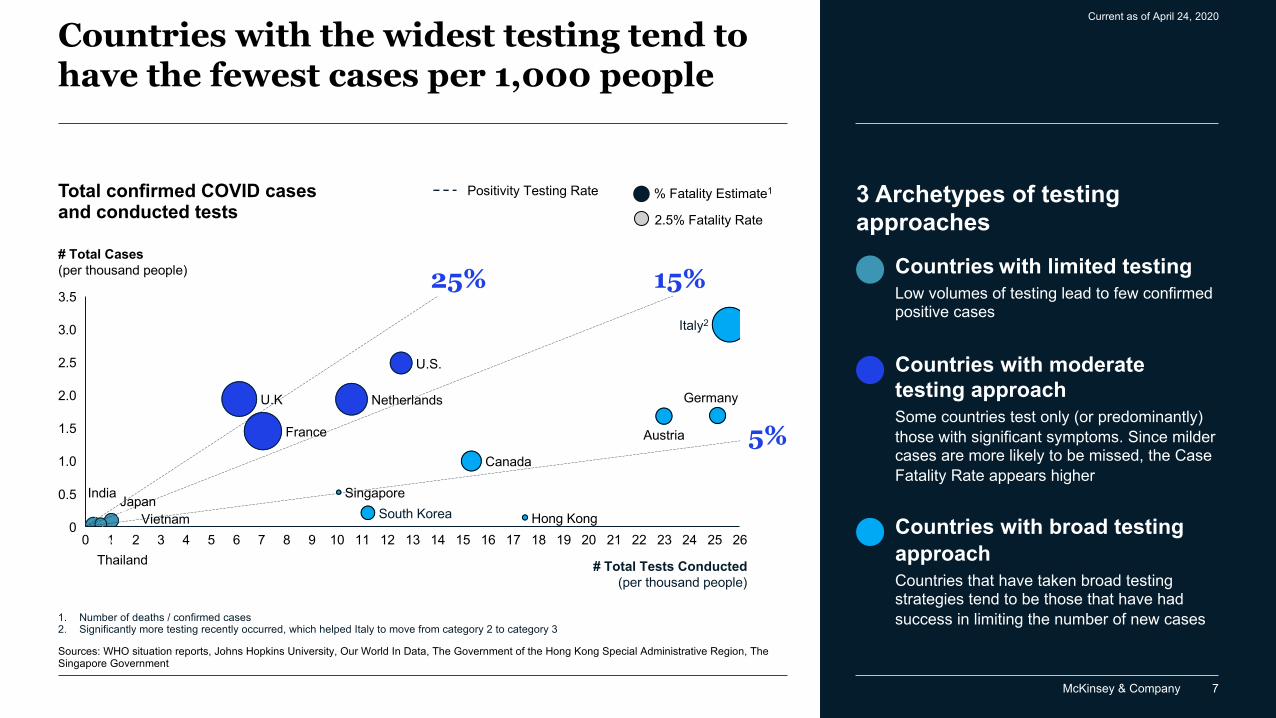
Total confirmed COVID casesand conducted tests
Countries with the widest testing tend to have the fewest cases per 1,000 people
Current as of April 24, 2020
185
1.5
2 230 31 4
3.5
6
2.5
217 8 25 2624
0.5
90
10 11 12
2.0
13 14 15 16 17 19
3.0
20 22
1.0
Germany
Austria
South Korea
# Total Cases (per thousand people)
Singapore
Canada
Japan
Italy2
U.S.
U.K
India
Thailand
Netherlands
France
Hong Kong
# Total Tests Conducted(per thousand people)
Vietnam
% Fatality Estimate1Positivity Testing Rate
2.5% Fatality Rate
1. Number of deaths / confirmed cases2. Significantly more testing recently occurred, which helped Italy to move from category 2 to category 3
25% 15%
5%
Sources: WHO situation reports, Johns Hopkins University, Our World In Data, The Government of the Hong Kong Special Administrative Region, The Singapore Government
3 Archetypes of testing approaches
Countries with limited testingLow volumes of testing lead to few confirmed positive cases
Countries with moderate testing approachSome countries test only (or predominantly) those with significant symptoms. Since milder cases are more likely to be missed, the Case Fatality Rate appears higher
Countries with broad testing approachCountries that have taken broad testing strategies tend to be those that have had success in limiting the number of new cases

McKinsey & Company 8
Sweden seems to be pursuing accelerated herd immunity but it is too early to say if this strategy will be successful
Current as of April 24, 2020
Most countries are trying to minimize new cases through packages of strict public health measures…� Implement travel restriction to prevent
resurgence
� Plan selective/phased approach to cautiously reopen parts of economy
� Establish legal measures (e.g., fines) to enforce new regulations
…however few locations are trying to manage infections with the goal of early herd immunity, with relaxed measures focused on� Preventing health systems being
overwhelmed
� Providing special attention to protect high-risk groups
Sweden Incremental COVID-19 cases and deathsCounts per day
300
0100200
100500400
700600
800
0
50
150
200
03/3103/01 04/19Number of deaths reported per dayNumber of new cases reported per day
Cases Deaths
Source: Bloomberg, Forbes, NPR, WHO Situation Reports, nydailynews
To date, COVID-19 deaths per million people in Sweden are mid-pack relative to other European countries. Other countries are watching the Swedish experience closely
Sweden
We are starting to see so many immune people in the population in Stockholm that it is starting to have an effect on the spread of the infection. […]
Our models point to sometime in May– Anders Tegnell, current state epidemiologist of Sweden,Apr. 19th 2020
� Kept its businesses open throughout the spreadof pandemic, while urging individual responsibility
� Maintained surplus of medical equipmentand hospital capacity
� No border control measures were implemented

McKinsey & Company 9
Current as of April 24, 2020
Pillars of non-pharmaceutical public health interventions:Latest evidence on COVID-19
Source: https://www.nejm.org/doi/full/10.1056/NEJMc2004973, https://www.nytimes.com/2020/03/17/health/coronavirus-surfaces-aerosols.html?auth=login-email&login=email; CDC
CA BTesting and trackingDistancing Travel restrictions PPE & cleaningBroad early testing has enabled some regions to contain the spread of COVID-19
Contact tracing for those tested positive is a key lever being used across regions; however its impact on transmission in high-prevalence settings is unproven
Antibody testing has the potential to identify individuals previously exposed; however widespread access to accurate tests will take time and we do not yet know to what extent exposure to the virus confers long term immunity
Syndromic surveillance (i.e. real-time or near real-time collection and analysis of health-related data, such as wastewater analysis, to identify potential health threats) can enable public health officials to take proactive measures to contain the spread of the virus
Physical distancing measures have had a significant impact on reducing the transmission of COVID-19There is a correlation between mobility reduction during a lockdown and reduction of transmission
Other methods of distancing –e.g., temporal distancing – are also used by regions to complement physical distancing measures
Some regions are seeing resurgence of cases driven by imported cases (people traveling in)Regions use a variety of measures to contain spread from contact tracing and ensuring self isolation of travelers to reinstituting travel restrictions
Early evidence in recent studies suggest surgical masks catch both large and small droplets (coughed, sneezed, or exhaled by an infected individual), suggesting widespread use of masks is a worthwhile toolCurrent evidence suggests that SARS-CoV-2 may remain viable for hours to days on surfaces and hours in the air
Cleaning of surfaces and disinfection is a best practice measure for prevention of COVID-19 and requires to consider factors such as the size of the room and the ventilation system design
D

McKinsey & Company 10
80600 20
1.0
2.5
40
2.0
100
1.5
0
0.5
Ohio (US)
New York (US)
Decrease in Rt (transmission rate)1
Austria
Canada-Quebec
New Jersey (US)
Finland
Czech Republic
Denmark
Italy (Lombardy)
Spain
Tennessee (US)
Iceland
South Korea
Sweden
New Zealand
% mobility reduction from baseline (retail & entertainment)
Germany
Norway
A. Mobility reduction during lockdownsis roughly correlated with reductionsin transmission
Current as of April 24, 2020
Norway: Geographical and environmental factors contribute to naturally low rates of spread, despite limited control measures. The seemingly low drop in Rt corresponds to a 40% decrease from baseline
1,000 daily new cases
South Korea: Primarily relied on robust testing and tracing rather than reduction in mobility. Targeted city- and region-wide lockdowns implemented as needed
Lombardy, Italy: Large portion of population was infected before lockdown measures were enforced, making transmission more difficult to control even after lockdown
Source: Google mobility reports, JHU COVID-19 tracking tool, USA facts
In general, implementation of public health measures leading to reduced mobility (e.g., closure of public spaces, lock downs, closure of schools) have successfully reduced COVID-19 transmission In select geographies, other factors have led to higher or lower than expected changes in transmission
1. Disease spread parameters are determined from confirmed case volume by fitting a simulation to the empirical data using a sum of least squares

McKinsey & Company 11
B. Some Asian countries implemented targetedtravel restrictions to counter case resurgence
Source: WHO, KCDC, Singapore Government, The Government of the Hong Kong Special Administrative Region
400
200
600
003 0902 21 040401 05 06 07 1408 0110 1311 0612 13 15 282016 17 18 19 2622 160823 24 25 27 29 30 31 02 03 05 07 09 10 11 12 1514
400
600
0
200
0901 04 080802 12 032603 051105 1606 07 10 13 1214 15 0217 3018 19 20 2921 062422 23 25 27 28 31 0401 07 09 10 11 13 14 15 16
200
600
0
400
100601 2304 1107 12020302 05 191508 09 2012 13 14 16 2917 18 1421 22 24 0425 2726 28 30 1331 1101 03 05 06 07 08 09 10 15 16
Imposed new travel restrictions, including requiring overseas visitors to self-quarantine supplemented by track-and trace programs as cases rise from foreign travelers
Implemented strong border control policies (limiting int’l flights, closing down land borders) to reduce the number of imported cases
Targeted travel restriction and quarantine measures to counter increase in cases from foreign travelers and workers
As cases continue rise, implemented stricter stay-at-home rules
March April
March April
March April
South Korea Incremental cases per day
China Incremental cases per day
Singapore Incremental cases per day
Mar 29, Significantly reduced the number of international flights (1 flight per week for
international routes)
By April 8, it had fully closed the land border between Russia and China
Mar 28 Required arrivals from overseas take diagnostic test and self-quarantine for 2 weeks
Resurgence
Resurgence
Apr 6 Quarantine residents within foreign worker dormitoriesMar 16
New 14-day quarantine
mandated for most incoming travelers
Apr 3 Implemented stay at home guidance
Apr 12.Implemented fine for breaking stay-at-home measures
Resurgence
Countries acted to contain imported cases via travel restrictions without national shutdown.
However, incremental cases were not contained after initial travel restrictions and resulted in more widespread measures
McKinsey & Company 11
Current as of April 23, 2020

McKinsey & Company 12
C. Early testing and tracking capacityhas enabled some countries to contain incremental cases
7 1210 2 6
100
3
20
134 5
80
8 9 10 11 14 15 16 170
40
60
120
140
Total tests conducted (per thousand people)
Incremental cases per day (per million people)
South Korea
AustriaItaly
U.S.New Zealand
ObservationsIncremental COVID cases and conducted tests
US & ItalySteep rate of growth followed by plateau (then decline in the case of Italy) as countries expand testing access
Current as of April 24, 2020
Source: WHO Situation Reports, Johns Hopkins University COVID-19 Data, Our World In Data
AustriaRapid shift to downward trend in incremental cases as the country expanded to a mass testing approach
South Korea & New ZealandAggressive early testing contained the rate of new infections; testing capacity continuously expanded as incremental cases are contained

McKinsey & Company 13
Current as of April 24, 2020
C. Contact tracing involves the identification of individuals withpotential exposure for targeted quarantining or other interventions
Source: WHO
Although elements of contact tracing are consistent, specific approaches to contact tracing differ significantly in terms of technological sophistication (e.g., traditional contact tracing via phone and in-person contact vs. tech-based tracing through GPS or Bluetooth-enabled apps)
Contact identification Contact listing Contact follow-up
Once an individual is diagnosed, contacts are identified by determining the person’s activities and the activities and roles of the people around them since onset of illness
All individuals who have been potentially exposed to the infected person are listed as contactsContacts are notified of their status, implications, and next steps (e.g., how to find care) In some cases, quarantining or isolation is required for high risk contacts
Regular follow-up conducted with all contacts to monitor for symptoms and continue to test for infection This information is used to determine most appropriate intervention for contact (e.g., quarantining)

McKinsey & Company 14
C. Countries have used varying approaches for contact tracingEvidence of effectiveness is limited for COVID in high prevalence settings
1. Ministry of Land, Infrastructure, and Transportation (MOLIT) and Ministry of Science and ICT (MSIT)
Source: Path; WHO; Tech Crunch; MLex Market Insight
Emerging tech example:Nigeria leveraged its existing National Emergency Operations Centers, originally developed to deal with previous outbreaks
1,000+ Surveillance Officers conduct manual contact tracing(e.g., interviewing individuals to determine who may have been exposed), utilizing existing surveillance and outbreak monitoring system that allows individuals conducting surveillance to capture information about contacts in a common mobile app platform
Types of high techtracing systems
Apple and Google have announced updates to their smartphone operating systems that will use Bluetooth signals to track potential cases
While a centralized approach can raise data privacy concerns, a decentralized system anonymizes users using random IDs, thus limiting privacy risks, as well as potential re-appropriation of data for other purposes.However, not all solutions are appropriate for all contexts; McKinsey does not endorse any specific approach
Current as of April 24, 2020
Higher tech example:The Korea Centers for Disease Control and Prevention, in collaboration with other government agencies1 and 3 telecommunications and 22 credit card companies, launched a COVID-19 data platform
With automatic data-sharing of both location data and purchasing data, the platform has shortened the time to complete contact tracing from 1 day to 10 minutes
Decentralized system –Bluetooth:
No location data are captured. Instead, devices detect proximity to each other within a certain range. If an individual is diagnosed, a list of their recent contacts is generated
Decentralized system – GPS:
GPS location tracking data are stored and processed locally (on the phone of the user); only location data for diagnosed patients are shared
Centralized system:
Location tracking data are stored and processed centrally; data of all users is shared

McKinsey & Company 15
C. Leveraging serological testing to determine immunitywill require a full understanding of immunity
Current as of April 24, 2020
Source: Politico; Kaiser Health News; Germany Federal Ministry of Education and Research ; CNN; MedRxiv; WIR IN NRW; Reuters
Examples of serological testing to date
Details on next page
Serological testing: Assessment of community exposure and immunity based on antibody detection
In California, serological test of ~3k people suggests prevalence of 50-85-fold more than the number of confirmed cases
In Colorado (US), United Biomedical provided testing for 6K residents of San Miguel County
Challenges associated with widespread roll-out and use of serological testing
Randomized sample of 1,000 residents in Gangelt showed 14% of population were carrying antibodies against COVID-19 while 2% of residents currently had the virusThe Helmholtz Centre for Infection Research (HZI) has begun a study of 100K individuals evaluating the level of antibodies over time
Netherlands began >10k blood donation samples weekly, where preliminary evidence suggests 3% of donors have developed antibodies Challenging logistics: Serological testing will need to be significantly scaled
up and broadly administered to significant portions of the population, creating major logistical hurdles
Limited regulatory approvals: Only 3 serological tests are currently approved by the FDA for emergency use
Unclear immunity profile: Even if sensitivity/specificity and logistical challenges are overcome, the degree to which serological testing is clinically (as a result of duration of immunity) useful remains unclear
Variable sensitivity/specificity: There is significant variation in methodology and sensitivity/specificity of serological tests currently available(90+ available in the US). High rates of false negatives or positives could limit usefulness of testing as a tool to assess immunity and facilitate reopening

McKinsey & Company 16
C. Immunity to COVID-19 is a major driverfor the “next normal”, yet it largelyremains unknown
Current as of April 24, 2020
While some early studies suggest potential longer term immunity similar to SARS-CoV1….
…Specific incidents of patients retesting positive could suggest shorter term immunity
Accelerated transition is possible based on serological testing providing criteria for economic restarts
Supporting Data
Implications Transition to “new normal” is contingent upon vaccine developmentVaccines may not work or require frequent booster-shots
Implications
Durable immunity following exposure or immunization is a pre-requisite for herd immunity
Serologic testing will be an impactful lever if immunityis of longer duration
Required frequency of vaccines / booster shots required will depend on duration of immunity
Source: Lancet, Journal of Immunology, Journal of Infectious Disease, Scientific American, BioRxiv, MedRxiv, NYTimes, Epidemiology & Infection
Indirect evidence
Immunity to SARS-CoV1, which shares 79% genetic identity, persists for 1-3 years in recovered patients
Reported reinfection may be described by flare-up of old infection that had temporarily subsided and then re-emerged
South Korean patients tested positive again for those who had been infected with SARS-CoV-2 and tested negative (may represent reactivation rather than reinfection)
Immunity to seasonal coronaviruses (e.g., common colds) starts declining a couple of weeks after infection
No reinfection observed in primate animal model A Chinese study reports immune response to S-protein in 100% patients (n=16) > 14 days post-symptom onset
SARS-CoV2 evidence
A Chinese study reports 30% of patients (n=175) with mild symptoms developed low or no detectable antibody response

McKinsey & Company 17
C. Syndromic surveillance has the potential to serveas an early warning sign of COVID resurgence
Source: International Journal of Infectious Diseases ; CNBC; CDC NSSP; J Public Health Manag Pract; gov.uk; CDC NSSP overview; ; MedRxiv; Nature
A research team at the Netherlands National Institute for Public Health and the Environment detected traces of SARS-CoV-2 in wastewater at Schiphol Airport 4 days after the Netherlands confirmed its first case of COVID-19 using clinical testing. It also found genetic material in the city of Amersfoort before clinically diagnosed infections had been reportedThe team plans to expand sampling to the capitals of all 12 provinces in the Netherlands and 12 other sites that have not had any confirmed cases
The US has leveraged national infrastructure to conduct real-time monitoring of influenza-like illness (ILI) tracking non-individual data flows such as flu-like symptoms reported in US hospitals
These symptoms may also provide leading indicators of COVID-19
Examples of syndromic surveillance for COVID
Syndromic surveillanceReal-time or near real-time collection, analysis, interpretation, and dissemination of non-individualized data for the early identification of potential health threats (before confirmed diagnosis) within the jurisdictional laws
Current as of April 24, 2020
Benefits and drawbacks of syndromic surveillance
Efficiency depends on pathogens and patient characteristics
Lack of human and technological resources can affect data collection, management, timeliness, and sharing
Low specificity
Rapid to implement, and can serve as an early warning sign for potential outbreaks
Informs allocation of resources to high priority areas(e.g., rapid diagnostic testing)
High sensitivity because laboratory confirmation is not needed
Possible deployment in low-income / low-resource countries
Does not fringe patient privacy as it utilizes non-individualized health data

McKinsey & Company 18
There is robust evidence to support the use of masks in healthcare settings to reduce transmission rates1
For other respiratory viruses (e.g. H1N1) there is evidence of reduced transmission rates in enclosed setting like airplanes2
There is indirect evidence that the masks reduce transmissions in the community setting
• One meta-analyses on community based usages of masks showed reduced viral transmission3, however others site a lack of high quality studies to draw from1
• There are very few high quality trials and only one randomized control trial
D. Early evidence suggests use of masks reduce transmission
Current as of April 24, 2020
Reduced transmissionExperimental evidence suggests surgical masks can reduce the spread of both larger droplets and small aerosols of COVID-194 which are thought to be the main drivers of transmission5
• This evidence drives both the CDC and the WHO support the use of masks for infected individuals1,5
In locations with large scale testing such as Iceland,S. Korea and the Diamond Princess have shown significant rates of asymptomatic COVID-19 cases suggesting decreasing rate of droplet productionfrom the general public will reduce the number of infected particles in the environment capable of spreading infection
Evidence for reduced droplets
Key TakeawayGiven the evidence of reduced transmission in controlled settings for respiratory viruses and the evidence of significant rates of asymptomatic infection, general community mask wearing in combination with other measures can be an effective tool to reduce transmission
Wearing a medical mask is oneof the prevention measures that can limit the spread of certain respiratory viral diseases, including COVID-19– WHO, Apr. 6th 2020
As of now, there is weak evidence masks are effective in the community setting; proper evidence is a good topic to be researched1 CEBM, 2 Emerging Infectious Diseases, 3 BMJ, 4 Nature Medicine, 5 CDC

Contents
McKinsey & Company 19
COVID-19:The situation now
01Scenarios and path forward
02Sector-specific impact
03Planningand managing COVID-19 responses
04

McKinsey & Company 20
The Imperative of our Time“Timeboxing” the Virus and the Economic Shock
Safeguard our lives1a. Suppress the virus as fast as possible1b. Expand testing, quarantining and treatment capacity1c. Find “cures”; treatment, drugs, vaccines
Impe
rati
ves
2Safeguard our livelihoods2a. Support people and businesses affected by lockdowns2b. Prepare to get back to work safely when the virus abates2c. Prepare to scale the recovery away from a -8 to -13% trough
1
Source: McKinsey analysis, in partnership with Oxford Economics
~ -8 to -13% Economic
Shock
1a1b
1c
2a2b
2c

McKinsey & Company 21
Scenarios for the Economic Impact of the COVID-19 CrisisGDP Impact of COVID-19 Spread, Public Health Response, and Economic Policies
Virus Spread & Public Health ResponseEffectiveness of the public health responsein controlling the spread and human impactof COVID-19
Effective response, but (regional) virus recurrenceInitial response succeeds but is insufficient to prevent localized recurrences; local social distancing restrictions are periodically reintroduced
Broad failure of public health interventions
Rapid and effective control of virus spreadStrong public health response succeeds in controlling spread in each country within 2-3 months
Public health response failsto control the spread of the virusfor an extended period of time(e.g., until vaccines are available)
Knock-on Effects & Economic Policy ResponseSpeed and strength of recovery depends on whether policy moves can mitigate self-reinforcing recessionary dynamics (e.g., corporate defaults, credit crunch)
Policy responses partially offset economic damage; banking crisisis avoided; recovery levels muted
Self-reinforcing recession dynamics kick-in; widespread bankruptcies and credit defaults; potential banking crisis
Strong policy responses prevent structural damage; recovery to pre-crisis fundamentals and momentum
Ineffective interventions
Partially effective interventions
Highly effective interventions
Virus recurrence; slow long-term growthwith muted world recovery
Virus contained; growth returnsVirus contained, but sector damage; lower long-term trend growth
Virus recurrence; slow long-term growth insufficient to deliver full recovery
Pandemic escalation; prolonged downturn without economic recovery
Pandemic escalation; slow progression towards economic recovery
Virus contained; strong growth rebound
Virus recurrence; return to trend growthwith strong world rebound
Pandemic escalation; delayed but full economic recovery
A3
A1 A2
A4B1
B2
B3 B4 B5
Source: “Safeguarding our lives and our livelihoods: The imperative of our time,”; available online at https://www.mckinsey.com/business-functions/strategy-and-corporate-finance/our-insights/safeguarding-our-lives-and-our-livelihoods-the-imperative-of-our-time
Current as of April 24, 2020

McKinsey & Company 22Source: “In the tunnel: Executive expectations about the shape of the coronavirus crisis”; available online at https://www.mckinsey.com/business-functions/strategy-and-corporate-finance/our-insights/in-the-tunnel-executive-expectations-about-the-shape-of-the-coronavirus-crisis; McKinsey survey of global executives, April 2–April 10, 2020, N=2,079
Executive expectations about the shape of coronaviruscrisis in the WorldSurvey of 2,079 global executives; % of respondents
Virus spread and public health response
Effective response, but (regional) virus resurgence
Broad failure of public health interventions
Rapid and effective controlof virus spread
Knock-on effects and economic policy response
Ineffective interventions
Partially effective interventions
Highly effective interventions
A3
A1 A2
A4B1
B2
B3 B4 B5
15%
11%
3%
16%
31%
9%
6%
6%
2%
Most likely scenario
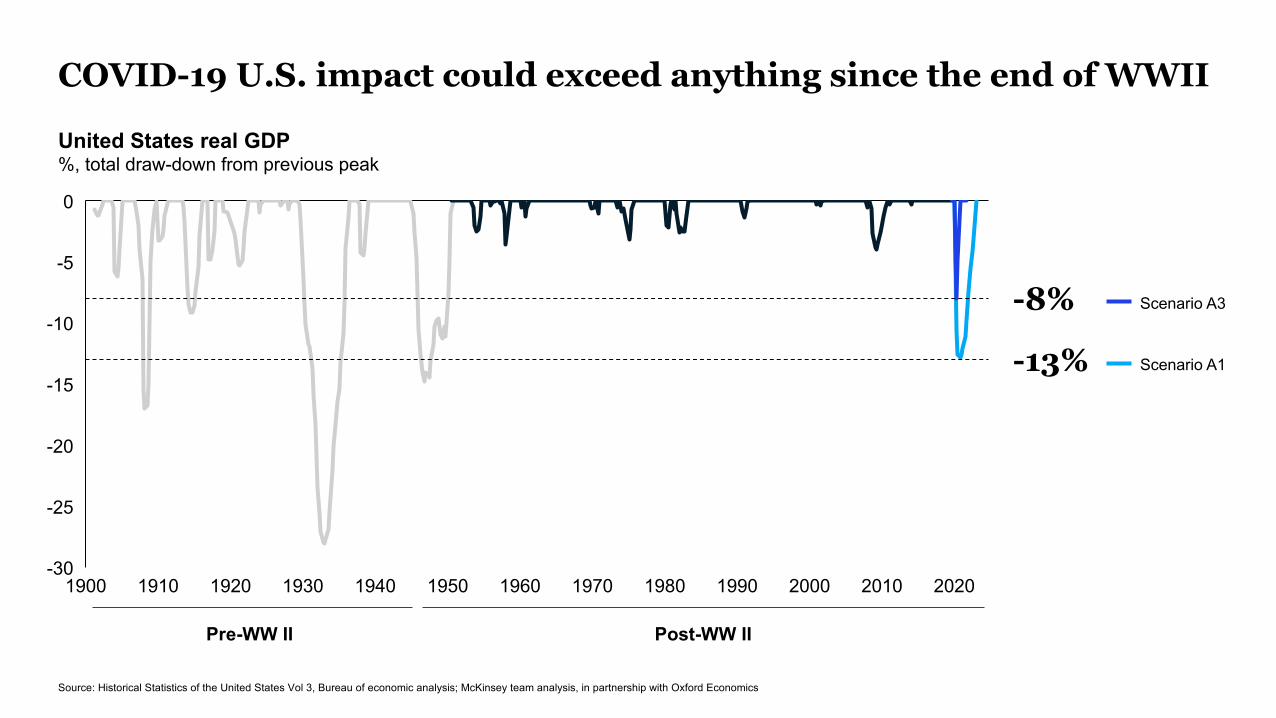
COVID-19 U.S. impact could exceed anything since the end of WWII
-15
-30
-5
-25
-20
-10
0
1900
-8%
20101910 20001920 1930 1940 1950 1960
-13%
1970 1980 1990 2020
United States real GDP %, total draw-down from previous peak
Pre-WW II Post-WW II
Source: Historical Statistics of the United States Vol 3, Bureau of economic analysis; McKinsey team analysis, in partnership with Oxford Economics
Scenario A1
Scenario A3

McKinsey & Company 24
Scenario A3:Virus containedThe virus continuesto spread across the Middle East, Europe and the U.S. until mid Q2, when virus seasonality combined with a stronger public health response drives case load reduction
Epidemiological scenarioChina and East Asian countries continue their current recovery and control the virus by early Q2 2020
Virus in Europe and the United States would be controlled effectively with between two to three months of economic shutdown; new case counts peak by end April and declines by June with stronger public health response and seasonality of virus
Economic impactsChina will undergo a sharp but brief slowdown and relatively quickly rebound to pre-crisis levels of activity. China’s annual GDP growth for 2020 would end up roughly flat
In Europe and the U.S., monetary and fiscal policy would mitigate some of the economic damage with some delays in transmission, so that a strong rebound could begin after the virus was contained at the end of Q2 2020
Most countries are expected to experience sharp GDP declines in Q2, which would be unprecedented in the post WWII era

McKinsey & Company 25
95
90
85
100
110
105
Q1 Q2 Q3 Q4 Q1 Q2 Q3 Q4 Q1 Q2 Q3 Q4
Scenario A3: virus contained, growth returnsLarge economies
Real GDP, indexedLocal Currency Units, 2019 Q4=100
China1
United StatesEurozoneWorld
2019 2020 2021
Source: McKinsey analysis, in partnership with Oxford Economics
1. Seasonally adjusted by Oxford Economics
-4.9% 2020 Q4-2.0%China
-8.1% 2020 Q4-2.5%United States
-11.0% 2021 Q1-5.2%Eurozone
-6.5% 2021 Q1-2.7%World
Real GDP Drop 2019Q4-2020Q2 % Change
2020 GDP Growth% Change
Return to Pre-Crisis LevelQuarter (+/- 1Q)
Current as of April 24, 2020

McKinsey & Company 26
Scenario A1:Muted world recoveryThe virus spreads globally without a seasonal decline. Health systems are overwhelmed in many countries, especially the poorest, with large-scale human and economic impact
Epidemiological scenarioChina would need to clamp down on regional recurrences of the virus
The United States and Europe would fail to contain the virus within one quarter and be forced to implement some form of physical distancing and quarantines throughout the summer
Economic impactsChina would recover more slowly and would also be hurt by falling exports to the rest of the world. Its economy could face a potentially unprecedented contraction
The United States and Europe would face a GDP decline of 35 to 40 percent at an annualized rate in Q2, with major economies in Europe registering similar performance. Economic policy would fail to prevent a huge spike in unemployment and business closures, creating a far slower recovery even after the virus is contained
Most countries would take more than two years to recover to pre-virus levels of GDP

McKinsey & Company 27
Scenario A1: virus recurrence, with muted recoveryLarge economies
90
110
85
95
100
105
Q1Q2Q1 Q3 Q4 Q2 Q3 Q4 Q1 Q2 Q3 Q4
Real GDP, indexedLocal Currency Units, 2019 Q4=100
China1
United StatesEurozoneWorld
2019 2020 2021
Source: McKinsey analysis, in partnership with Oxford Economics
1. Seasonally adjusted by Oxford Economics
-5.7% 2021 Q4-4.4%China
-11.2% 2023 Q1-8.1%United States
-14.6% 2023 Q3-11.1%Eurozone
-8.4% 2022 Q3-6.5%World
Real GDP Drop 2019Q4-2020Q2 % Change
2020 GDP Growth% Change
Return to Pre-Crisis LevelQuarter (+/- 1Q)
Current as of April 24, 2020

McKinsey & Company 28
What business leaders should look for in coming weeksThere are three questions business leaders are asking, and a small number of indicators that can give clues
Depth of disruptionHow deep are the demand reductions?
• Time to implement social distancing after community transmission confirmed
• Number of cases – absolute (expect surge as testing expands)
• Geographic distribution of cases relative to economic contribution
Length of disruptionHow long could the disruption last?
• Rate of change of cases• Evidence of virus seasonality• Test count per million people• % of cases treated at home• % utilization of hospital beds (overstretched
system recovers slower)• Availability of therapies• Case fatality ratio vs. other countries
Shape of recoveryWhat shape could recovery take?
• Effective integration of public health measures with economic activity (e.g. rapid testing as pre-requisite for flying)
• Potential for different disease characteristics over time (e.g. mutation, reinfection)
Epid
emio
logi
cal
• Bounce-back in economic activity in countries that were exposed early in pandemic
• Early private and public sector actions during the pandemic to ensure economic restart
• Late payments/credit defaults• Stock market & volatility indexes• Purchasing managers index• Initial claims for unemployment
• Cuts in spending on durable goods (e.g., cars, appliances)
• Extent of behavior shift (e.g., restaurant spend, gym activity)
• Extent of travel reduction (% flight cancellations, travel bans)
Econ
omic
Indi
cato
rs

Contents
McKinsey & Company 29
COVID-19:The situation now
01Scenarios and path forward
02Sector-specific impact
03Planning and managing COVID-19 responses
04

McKinsey & Company 30
The phase of Return is in sightBut rapid Return comes with higher risk, and a new reality
Weeks of shelter-in-place provisions globally have caused a deep economic challenge, straining governments’ ability to save lives while safeguarding livelihoods
Governments are now considering options and timing for a gradual re-opening, with the US being the most recent announcement.
Many of these re-openings are occurring in very different environments. Some geographies are considering opening after they have plateaued, while others are seeking to return after additional verifications are complete (e.g., hospital capacity,testing capacity, other)
These variations are driving concerns within businesses around risks associated with a return-to-work, and whether these risks can be adequately managed
Additionally, COVID-19 has changed many realities for businesses. Remote first may be a goal achievable in months, consumers have structurally adopted digital channels, and the prospect of the largest economic recession since the second World War could quickly challenge the business
Current as of April 24, 2020

McKinsey & Company 31
Phases of ReturnEpidemiological uncertainty could contribute to lack of pre COVID-19 demand
Post-Plateau Pre-Vaccine/ ImmunityActive Growth
• Case plateau • Cases low vs. peak• Widespread testing• Contact tracing• High hospital availability
• Vaccine available OR• Herd immunity reached
Public health risk1
Econ. demand (discretionary)
Uncertain Initial recovery High growthDecline
1. Chances of a resurgence remain elevated until the post-Vaccine phase
Return for different regions will vary across these phases, driving differences in ingoing risks for businesses
Post-Vaccine/ ImmunityPhase
Current as of April 24, 2020

McKinsey & Company 32
Questions that businesses are asking now
What Who When Howcan post plateau
look like?
My near-term demand may move to digital. How do I pivot quickly?
I am facing a deep financial trough. How do I preserve the business?
should return & in what way?
Many in my workforce like working from home, and productivity is up. Why come back?
should return occur?
I know I can bring the business back, but how do I know when it’s safe to do so, and how might the business be affected if something goes wrong?
should return occur?
What would high-restriction operations look like in reality?
What measures have other companies taken that have worked (versus measures that cause disruption without proportionate benefit)?
McKinsey & Company 32
Current as of April 24, 2020

McKinsey & Company 33
AACT now: the four dimensions of Return planning
Acceleratestructural workforce shifts by segment
Adaptthe business to a post-plateau world
Timethe transition given the local environment
Craftstage-based return plans that protect workforce and customers
Current as of April 24, 2020

McKinsey & Company 34
AACT: Four dimensions of effective Return planning
Adapt the business to a post-plateau world
1
Onsite critical Onsite flexible Virtual OtherAcceleratestructural workforce shifts by segment
2
Post vaccine availabilityShortly after S-i-P lifts Post low risk verificationTimethe transition given local environment
4
High Restriction Ops Next Normal OpsPartial Restriction OpsCraft operational plans for workforce safety
3
Deep recessionary impact
Little fundamental change
Structural shift to digital
Multi-front disruption
Current as of April 24, 2020

McKinsey & Company 35
Adaptthe business to a post-plateau restart
COVID-19 will leave business leaders, workers and customers uncertain about how the world will step back into normalcy in a scenario where the number of cases is not known accurately, where people across age-groups appear to be getting more severe forms of the virus, and where virus-free environments cannot reliably be created
Vaccines that can lay many of these fears to rest are unlikely to be available before 2021
Few businesses that seek to re-open in this world, especially ones that rely on discretionary spend, can simply carry on as they did in the pre-COVID normal
Customers may defer spending, either because they are conserving finances in a recessionary environment, or because they are worried about health
Business therefore need to refresh their assumptions about what demand may look like, and define ways to boost it. In many cases, they may amount to a near-term reshaping of the business (e.g., shifting consumer interfaces to digital)
Current as of April 24, 2020

McKinsey & Company 36
Outlook – to Adapt successfully, consider a Plan Ahead team
Nerve Center focus shift
Present focus
Plan Ahead team1
Economic scenario in post-plateau Return environment
Structural business shifts needed in near-term to drive demand or protect workforce
Detailed plan for Return
New strategy for the ‘next normal’ -Reimagination & Reform
Employee protection
Customer management
Supply chain
Cash
1. https://www.mckinsey.com/business-functions/strategy-and-corporate-finance/our-insights/getting-ahead-of-the-next-stage-of-the-coronavirus-crisis
Current as of April 21, 2020

McKinsey & Company 37
Adapting the business to a post-plateau restart phase
Fast moving epidemiological & shelter-at-home provisions
Evolving changes in economic outlook
Capture the full scope of the uncertaintythrough issue maps that emphasize future evolution, not just facts about the past
Shifts in customer preferences & consumption patterns
Issue maps w/ evolution
1 Bound the uncertainty through tangible scenarios that include 2nd order effects
2Stress-test the portfolio across multiple scenarios & ensure delivery teams have appropriate planning assumptions
3
Cross-team plan assumptions
Stress-test across scenarios
Build basis for rapid yet thoughtful actions by building a leading indicator dashboard & portfolio of strategic actions
4
Portfolio of strategic actions
Leading indicator dashboard
Current as of April 24, 2020

McKinsey & Company 38
Acceleratestructural workforce shifts by segment
COVID-19 related shutdowns have meant a new experience of working from home for many in the workforce who are able to, and an updated working environment for those in the workforce who are on-site critical.
Businesses have experienced that many people who are experiencing work from home are demonstrating higher productivity
Many CHROs and other executives, therefore, are asking the question whether it would make sense to continue current remote work arrangements, and whether such arrangements are compatible with the need to maintain a sense of belonging to the organization.
Another alternative being explored is whether a move to a more hybrid team model where remote work is mixed with in-person interactions could provide the most optimal balance of productivity, morale, and connectivity
Finally, companies are also exploring what the impact of a changed economic scenario means for the workforce, and the right way to provide alternative opportunities or reskilling while preserving the company’s future
Current as of April 24, 2020

McKinsey & Company 39
Who to consider transitioning: Four categories of workforce for the immediate post-shelter-at-home environment
VIRTUAL/ REMOTEMaintain remote work, while increasing flexibility
� Focus on remote support, productivity, connectivity, health
� Shift contracts where needed & possible towards flexible arrangements
ONSITE FLEXIBLEDefine plan for staged return based on local context
� Identify milestones for starting a safe return to work process (e.g., local public health system readiness, government return to work guidelines)
� Develop detailed plan for return to work based on key considerations: virus spread, guidance from public health authorities, workforce readiness to return to work, legal liability
ONSITE CRITICALReturn to work with increased work flexibility
� Define plan for return to work, including staggered shifts and slower ramp-ups
� Re-train to move to more flexible skill sets
� Shift contracts where needed & towards flexible arrangements
OTHERTransparency, reskilling, preserve company’s future
� Provide transparency into reality of situation facing company
� Re-train or seek opportunities to shift focus
� Other actions to preserve future of company
Current as of April 24, 2020

McKinsey & Company 40
COVID risk factors need to be considered during segmentation
High
Low
Level of risk Segmentation of roles
Adjustments required to mitigate Covid-19 risk factors (not exhaustive) Risk factors
aggregate across levels of riskRoles with the highest level of risk should only restart where critical to deliver near term back-to-work prioritiesCertain workforce protection protocols should apply workforce-wide until Covid-19 risk factors are largely eliminated (per CDC guidance), e.g., hygiene practices, sanitization, checks
COVID risk factorsMay spread infection, could impact multiple points in system
In-person floating: Physical interaction with more than one team or stakeholder groupE.g., Plant supervisor, medical practitioner, general manager
Adapt ways of working to minimize the number of human interactions required (e.g., certain stakeholder groups to only engage virtually)
Eliminate communal spaces (e.g., break or supply rooms) to reduce cross-contamination
In-person collaborative: Physical work, completed within / with close proximity to one stakeholder group
E.g., Pilot, assembly-line worker
May infect team-members, likely will not spread infection through system
Structure teams into discrete “pods”
In-person isolated: Physical work, completed in isolationE.g., Artisan, switcher, landscaper
May become infected in transit, may infect external parties
Mandate the use of PPEPhysically isolate team member in dedicated space (e.g., no desk-sharing)
Remote: Work is not reliant on a physical space and may be effectively completed remotely
E.g., Call center operator, computer programmer
Minimal Adhere to CDC and applicable public health guidelines, together with workforce-wide protocols
Delay return to in-person work to maximize safety
Detail follows
Current as of April 24, 2020

McKinsey & Company 41
Understanding the availability and limitations of yourworkforce is the next step in determining your approach
1. Availability and accuracy of tests continue to evolve, so testing may or may not be possible, additionally employees may choose not to be tested or not to disclose their results, in these cases employees should be treated as a negative test result tominimize potential risk 2.Due to the evolving nature of COVID 19 and the availability of testing and supplies recommended approaches are subject to change and should be checked against the latest CDC guidelines
COVID-19 positive
Employee not tested / test is pending / test is negative
Understand any limitations (e.g., high-risk dependents, personal risk factors)
If possible, test employee for virus and/or antibodies1
Monitor recovery of employee
Quarantine employee and proximate contacts per CDC guidelines
Provide testing to all employees who made contact with infected individual
Quarantine employee and proximate contacts per CDC guidelines
Antibody positive
Determine the most critical role(s) that employee is currently qualified for / can be quickly trained to fill
Without limitations
With limitations
Follow CDC guidelines to confirm recovery and ability to return to work. Once recovered, employee can be considered immune and deployed accordingly
Consider immune and deploy accordingly
Deploy only to in-person isolated or remote roles
Deploy in remote roles ONLY or utilize PPE until virus cleared; then consider immune
Prioritize deployment to isolated orremote rolesDeploy with caution to collaborative roles
Avoid deployment to floating roles
Prioritize deployment to higher risk in-person roles
ImmuneConfirmed immune via antibody testing or recovered post positive COVID-19 testing
Symptomatic or exposedEmployee is or is caring for someone who is exhibiting symptoms of COVID 19
AsymptomaticHave not had and are not currently exhibiting symptoms of COVID-19
ActionsWorkforce segment Approach for deployment 2
Source: https://www.cdc.gov/coronavirus/2019-ncov/hcp/return-to-work.html; https://www.cdc.gov/coronavirus/2019-ncov/community/guidance-business-response.html; https://www.osha.gov/Publications/OSHA3990.pdf
Ass
ess
indi
vidu
al c
apac
ity a
nd w
illin
gnes
s
Current as of April 24, 2020

McKinsey & Company 42
Demand segments and supply segments can then be matched based on risk compatibility
Workforce supply – demand compatibility
HighLow
Supply1
Active
Recovered
COVID-19 Positive
Antibody positive
Immune
Symp-tomatic
Asymp-tomatic
Demand
Quarantine
Quarantine
IsolatedFloating RemoteCollaborative
Without limitations
With limitations
1. Post assessment of individual capacity and willingness to join workforce
Current as of April 24, 2020

McKinsey & Company 43
Isolation can be a persistent challenge in a remote environment
Certain personality traits (e.g., conscientiousness, agreeableness) can contribute to positive outcomes in a remote work environment
Personality
Any complex task that requires > 1 hour to complete causes a sense of isolationTime to complete
The further an employee is physically from the “center of gravity”, the more likely they are to experience isolation
Physical distance
Managers that are good at communicating clear expectations have teams that are less likely to experience isolation
Clarity of communicating
Very few workers (~25%) share how they feel regarding isolationExpressiveness
Employees hired directly into a remote work environment are more mentally prepared than employees whose work arrangements shift after the fact
Employee expectations
Current as of April 24, 2020

McKinsey & Company 44
Craftstage-based return plans that protect workforce and customers
Federal governments around the world are starting to give guidance around what a return to work may look like as shelter-at-home provisions start to get lifted, with more specific guidance also coming from regulators as well as local governments
These operational plans are likely to vary significantly by region, as differences in local COVID-19 situation, pre-existing practices (e.g., use of public transportation), healthcare capacity, and other factors impact these plans
In addition to complying with such provisions, companies are trying to craft operating best practices around return to work that are informed by experiences of companies that are operating in similar environments around the world
Current as of April 24, 2020

McKinsey & Company 45
How to consider transition – Ensuring protection across workforce journey
Pre-entry� Pre-return comms
and screening� Public, employer-
sponsored and individual transport
� Entrance controls
At work� Manufacturing
environment� Office environment� Retail environment� Field environment
Common spaces� Meeting rooms� Break rooms� Hallways� Restrooms� Other
Upgrade equipment
Post-infection� Isolation� Tracing & isolation� Facility response� Insurance� Liability
Separate in space & time
Drive safe behavior norms
Use protective equipment
Test & isolate
Increase awareness
Clean & disinfect
Insure & respond

McKinsey & Company 46
Sample journey: Manufacturing environmentTravel to work and pre-entry At Work Common space use
Temperature checks
Separated lunch seating with dividers on dining tables
Use of non-reusable dishes at cafeterias
Modularized spaces, with
limited interaction across spaces
Masks and other appropriate PPE
required at all times
High-frequency cleaning of high-touch surfaces
and spaces
Improved air filtration/
ventilation
Clear posters on safety
guidance and sickness protocols
Use of masks required during employee commutes
Source: Expert interviews, press search, client surveysDoes not reflect McKinsey guidance customized to individual client needs - should be vetted against applicable legal and business requirements before application to a specific client

McKinsey & Company 47
Sample journey: Office environmentTravel to work and pre-entry At Work Common space use
Limited entrance for non-employees
Separated lunch seating
Increased frequency cleaning with visibly monitored cleaning schedules
Reorganized seating
(6 feet apart)
Headcount limited below fire code limit (e.g. limiting number of entries by shifts)
Masks required at all times (Except when working individually
more than6 feet apart)
Increased frequency of cleaning of high-
touch surfaces
Masks required and provided for employees
Source: Expert interviews, press search, client surveysDoes not reflect McKinsey guidance customized to individual client needs - should be vetted against applicable legal and business requirements before application to a specific client

McKinsey & Company 48
Travel to work and pre-entry At Work
Sample journey: Retail environmentCommon space use
Staggered entry and work shifts Guidance on no-questions-asked sick leave
Increased cleaning of high-touch surfaces and spaces (e.g., Bathrooms)Plexiglass shields installed at cash registers Upgraded PPE encouraged, required and/or provided
Source: Expert interviews, press search, client surveysDoes not reflect McKinsey guidance customized to individual client needs - should be vetted against applicable legal and business requirements before application to a specific client

McKinsey & Company 49
Example: Use prominent displays highlighting new processes and policies
Description of potential interventionDisplay large format posters or digital displays providing prominent, frequent reminders to employees of the new workplace situation, protocols and (crucially) the rationale behind it
Leverage media and advertising to create awareness among employees and customers
Where this has been doneSeveral multinational retail brands have used advertising to promote social distancing
Informational materials in displays and advertising
Increase awareness
Office Manufacturing Retail
At Work Common areasPre-entry Post-infection
Source: Expert interviews, press search, client surveys
Does not reflect McKinsey guidance customized to individual client needs - should be vetted against applicable legal and business requirements before application to a specific client

McKinsey & Company 50
Example: Improve air filtration / ventilation to remove aerial antigens
Improved air filtration and ventilation systems
HEPA (high-efficiency particulate air)-rated filter
Ensure airflow does not aid transmission through droplets
Upgrade equipment
At Work Common areasPre-entry Post-infection
Office Manufacturing Retail
Source: Expert interviews, press search, client surveys
Description of potential interventionInstall high-efficiency air filters and increase ventilation rates in the work environment
Avoid using central air conditioning and heating systems where possible
Where this has been doneMultinational automotive manufacturer in S. Korea heightened ventilation requirements beyond government guidelines
Does not reflect McKinsey guidance customized to individual client needs - should be vetted against applicable legal and business requirements before application to a specific client

McKinsey & Company 51
Most businesses will be considering a stage-based returnMany governments, including the US, have drafted a template for what this could look like
Stage 2 Stage 3Stage 1Partial Restriction Operations
Next Normal OperationsHigh Restriction Operations
Special accommodation No restrictionsSpecial accommodation
Encourage telework, but scale up return to work
Encourage telework, but begin return to work
Close common areas; follow moderate social distancing
Close common areas; follow strict social distancing
Resume non-essentialMinimize non-essential
Vulnerable populations
Virtual or site flexible
Site critical workforce
Travel
Example staging based on US1 plan
1. Based on the White House, Guidelines for Opening Up America Again approach
Current as of April 24, 2020

McKinsey & Company 52
Timethe transition given the local environment
As different regions enter the return phase, there will be significant differences between them. Some of them will enter the return phase with high levels of hospital capacity (ICU, Medical, Surgical), widespread testing and contact tracing sophistication, and with case count that is far below the peak. Others will enter the phase with cases plateauing, but with continued uncertainty on the extent of transmission in the local environment.
Given such uncertainties, businesses are still evaluating the right timing for a return. Specifically, they will need to balance considerations on extent of impact on the business, pace of demand rebound, workforce safety, customer safety, insurance coverage, legal liability and other considerations.
Current as of April 24, 2020

McKinsey & Company 53
When to consider transition
For major markets
For remote-possible workforce locations
For on-site critical workforce locations
Shelter at home provisions are
removed
Local public health situation recovers
Local public health situation recovers
Demand within region is starting to return (in case
the region is a market)
Shelter at home provisions are
removed
Transition can occur at self-determined timeline
Leading indicators are an important tool to ensure timing around transition is
picked correctly
Current as of April 24, 2020

McKinsey & Company 54
When to transition: An effective leading indicator dashboard can help determine timing of recoveryILLUSTRATIVE DASHBOARD
Indicates progress toward recovery

McKinsey & Company 55
Approach for effective return planning
� Use issue maps & scenarios to define the major strategic shifts that could occur in the post-plateau & pre-vaccine periods. Ensure that this includes any major market shifts (e.g., consumer behavior changes) that could reveal themselves
� Stress-test the financials to assess extent of impact on P&L, balance sheet and cash flow
� Define portfolio of strategic actions with appropriate trigger points
Adapt
� Segment employees into multiple categories based on whether they can remain remote, whether they may need special accommodation, and other factors
� Examine benefits and costs of each structural change that may be needed (e.g., raid shift to virtual)
� Survey each part of the workforce to use as input to planning
Accelerate
� Define what each stage of the return will look like for each operating region and employee segment (from high restriction to next normal operations)
� Define interventions and performance management to improve safety and reduce transmission potential
Craft
� Define milestones and leading indicators for the restarting return
� Define key stages of operations, with the milestones and external conditions that will separate each
Timethe business structural workforce shifts stage-based return plan the transition

McKinsey & Company 56
Contents
McKinsey & Company 56
COVID-19:The situation now
01Scenarios and path forward
02Sector-specific impact
0403Planning and managing COVID-19 responses

McKinsey & Company 57
Market capitalization has declined across sectors, with significant variation to the extent of the declineWeighted average year-to-date local currency shareholder returns by industry in percent1. Width of bars is starting market cap in $
5
-5
-10
-15
-30
-35
-40
-20
-45
-25
0
Source: Corporate Performance Analytics, S&CF Insights, S&P
1. Data set includes global top 5000 companies by market cap in 2019, excluding some subsidiaries, holding companies and companies who have delisted since
Pharmaceuticals
Retail
Healthcare Supplies & Distribution
Oil & Gas
Air & Travel
Commercial Aerospace
Banks
Auto-motive & Assembly
Medical Technology
HealthcarePayors
Electric Power & Natural Gas Media
Business Services
Advanced ElectronicsInsurance
Other Financial ServicesConsumer Durables
Chemicals & Agriculture
Basic Materials
Apparel, Fashion, & Luxury
Transport & Infrastructure
Real Estate
Conglo-merates
Healthcare Facilities & Services
Logistics & Trading
Telecom
Food & Beverage
Personal & Office Goods
Consumer Services
DefenseHigh Tech
Current as of April 24, 2020

McKinsey & Company 58
And there is significant variance within each industryDistribution of year-to-date total shareholder returns by industry percent1
Source: Corporate Performance Analytics, S&CF Insights, S&P
-70
-60
-50
-40
-30
-20
-10
0
10
20
30
40
50
60
Insu
ranc
e
Com
mer
cial
Aer
ospa
ce
Med
ical
Tec
hnol
ogy
Air &
Tra
vel
Appa
rel,
Fash
ion,
& L
uxur
y
Hea
lthca
re P
ayor
s
Oil
& G
as
Bank
s
Che
mic
als
& Ag
ricul
ture
Rea
l Est
ate
Auto
mot
ive
& As
sem
bly
Food
& B
ever
age
Con
glom
erat
es
Tran
spor
t & In
frast
ruct
ure
Basi
c M
ater
ials
Elec
tric
Pow
er &
Nat
ural
Gas
Hea
lthca
re F
acilit
ies
& Se
rvic
es
Busi
ness
Ser
vice
s
Con
sum
er D
urab
les
Logi
stic
s &
Trad
ing
Oth
er F
inan
cial
Ser
vice
s
Adva
nced
Ele
ctro
nics
Tele
com
Hea
lthca
re S
uppl
ies
& D
istri
butio
n
Med
ia
Def
ense
Pers
onal
& O
ffice
Goo
ds
Con
sum
er S
ervi
ces
Ret
ail
Hig
h Te
ch
Phar
mac
eutic
als
1. Data set includes global top 5000 companies by market cap in 2019, excluding some subsidiaries, holding companies and companies who have delisted since
Inter-quartile range 90% percentile range Median x Weighted AverageAS OF APRIL 22 2020
Current as of April 24, 2020
McKinsey & Company 59
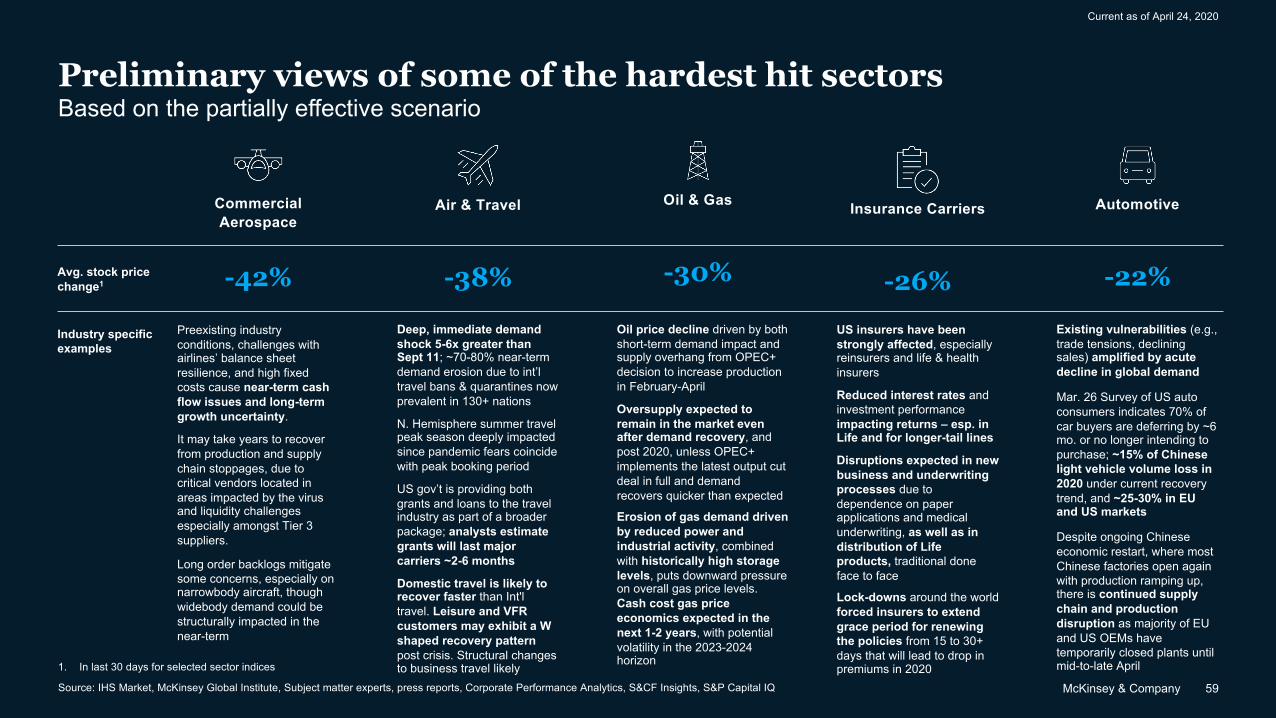
Preliminary views of some of the hardest hit sectorsBased on the partially effective scenario
Source: IHS Market, McKinsey Global Institute, Subject matter experts, press reports, Corporate Performance Analytics, S&CF Insights, S&P Capital IQ
1. In last 30 days for selected sector indices
Industry specific examples
Avg. stock price change1
Insurance Carriers
US insurers have been strongly affected, especially reinsurers and life & health insurers
Reduced interest rates and investment performance impacting returns – esp. in Life and for longer-tail lines
Disruptions expected in new business and underwriting processes due to dependence on paper applications and medical underwriting, as well as in distribution of Life products, traditional done face to face
Lock-downs around the world forced insurers to extend grace period for renewing the policies from 15 to 30+ days that will lead to drop in premiums in 2020
-26%
Air & Travel
Deep, immediate demand shock 5-6x greater than Sept 11; ~70-80% near-term demand erosion due to int’l travel bans & quarantines now prevalent in 130+ nations
N. Hemisphere summer travel peak season deeply impacted since pandemic fears coincide with peak booking period
US gov’t is providing both grants and loans to the travel industry as part of a broader package; analysts estimate grants will last major carriers ~2-6 months
Domestic travel is likely to recover faster than Int'l travel. Leisure and VFR customers may exhibit a W shaped recovery pattern post crisis. Structural changes to business travel likely
-38%
Commercial Aerospace
Preexisting industry conditions, challenges with airlines’ balance sheet resilience, and high fixed costs cause near-term cash flow issues and long-term growth uncertainty.
It may take years to recover from production and supply chain stoppages, due to critical vendors located in areas impacted by the virus and liquidity challenges especially amongst Tier 3 suppliers.
Long order backlogs mitigate some concerns, especially on narrowbody aircraft, though widebody demand could be structurally impacted in the near-term
-42%
Oil & Gas
Oil price decline driven by both short-term demand impact and supply overhang from OPEC+ decision to increase production in February-April
Oversupply expected to remain in the market even after demand recovery, and post 2020, unless OPEC+ implements the latest output cut deal in full and demand recovers quicker than expected
Erosion of gas demand driven by reduced power and industrial activity, combined with historically high storage levels, puts downward pressure on overall gas price levels. Cash cost gas price economics expected in the next 1-2 years, with potential volatility in the 2023-2024 horizon
-30%
Automotive
Existing vulnerabilities (e.g., trade tensions, declining sales) amplified by acute decline in global demand
Mar. 26 Survey of US auto consumers indicates 70% of car buyers are deferring by ~6 mo. or no longer intending to purchase; ~15% of Chinese light vehicle volume loss in 2020 under current recovery trend, and ~25-30% in EU and US markets
Despite ongoing Chinese economic restart, where most Chinese factories open again with production ramping up, there is continued supply chain and production disruption as majority of EU and US OEMs have temporarily closed plants until mid-to-late April
-22%
Current as of April 24, 2020

McKinsey & Company 60
Commercial Aerospace
Current as of April 24, 2020
Current Impact
Source: Cirium
Net orders1
Backlog
Deliveries
3,000
0-1,000
1,0002,000
192018 2020 YTD2
1,858 1,306
235
Gross orders Cancelled orders
# aircraft
# aircraft
# aircraft
10,000
20,000
0 0
10
5
2018 19 2020 YTD3, 4, 5
14,134 14,002 13,946
Years
~10 year backlog 6
2,000
0
1,000
2018 19 2020(F)
1,1881,582
?
Years: Narrow bodyYears: Wide bodyNarrow body aircraftWide body aircraft
~10 year backlog 6
737 Max impacted deliveries
The underlying drivers for commercial aircraft equipment and services is driven by airlines; Airlines have significantly reduced capacity and grounded fleets
Airlines
After-market
OEMs & Suppliers
Demand for parts
Demand for maint. parts & services
Demand for new aircraft
1. Narrow body orders declined 21% and wide body orders declined 18% from 2017 – 19. Narrow body cancellations grew 4% and wide body cancellations grew 5% during the same period
2. Boeing reported 18 gross wide body orders in Feb. and 43 737 MAX (narrow body) cancellations. Airbus reported 287 total gross orders and 13 cancellations as of 3/15
3. Assumes 2020 YTD backlog = ‘19 backlog – ‘20 cancellations YTD (56 cancellations YTD from Boeing and Airbus)
4. 2020 backlog years figures assume 2020 deliveries remain at 2019 levels
5. Calculates backlog years assuming no dip in 2019 and 2020 deliveries (deliveries remain at 2018 levels)
6. Actual backlog is 14.6 years (backlog shown in chart assumes no dip to deliveries in 2019)
Government intervention may mitigate near-term risk of employee furloughs and supply chain insolvencies
Low fuel price expectations for the short-term could extend life of older assets, but not into major heavy maintenance check cycles
Intrinsic demand for aircraft likely disappears in 2020
Airline balance sheet concerns will lead to restructuring of order books; cash conservation efforts at airlines constrain capital set aside for delivery payments
Early thoughts on evolution post-COVID
19-20YTD commercial aircraft orders, backlog, backlog years & deliveries
Medium-term expectations (through 2020)

McKinsey & Company 61
Air & Travel
Source: STR, Airlines Reporting Corporation, Baidu Map, Ctrip, ShijiGroup
Current as of April 24, 2020
Current Impact
Early thoughts on evolution post-COVID
Medium-term expectations
49%-64% reduction in airline travel demand is estimated in the two most likely scenarios, returning to pre-crisis status quo over a 1-3 year period
Given low oil price expectations for the short-term, operating costs may be reduced but could also impact aircraft leading market
Government intervention though a stimulus package, to ensure there is not a liquidity crisis, may have implications for industry structure as increasingly involved interventions may impact strategy and operations (e.g. equity stakes, conditions for support)
Convergence of remote work technologies, biosecurity issues, and sustainability concerns could structurally shift demand curves downward
A3Virus contained, slow recovery
Virus Contained
A1Virus resurgence; slow long-term growth
Muted World Recovery
Four efforts will drive return of demand
1. Travel restrictions: government issued shelter-in-place and travel bans at an unprecedented level
2. Economic downturn: significant downturn reducing business activity and discretionary consumer spending
3. Emotional reluctance to travel: emotional / fear based reaction to the virus, reducing willingness /excitement to travel for some time
4. Structural changes to travel: fundamental shifts tin travel behavior (e.g., video-conferencing)
1. Tourist attractions
4
3
2
1
02/01 03/01 04/010
-28%
Total attractions opened pre crisis
2. City transportFirst tier cities commute index1
4
2
0
6
8
01/07 02/04 03/03 03/31
20192020
1. Commute index is calculated based on the population commute and total working population in that city. Shanghai used as representative of first tier cities in China, 7-day trailing average shown
There are promising signs of a recovery in China, as the government has opened up a majority of major tourist attractions. Urban transit use returning to pre-crisis levels
Travellers below 30 are leading the recovery trend and hotel booking lead time is shortening
43%
60%
52%
30%
5%
10%
2019
2020
30-50
100%
Over 50Below 30
100%
3. Holiday travel by ageTomb Sweep Day, bookings by age, %
8.6
4.4
9.6
202019
8.9
21 22 2023
9.9-49% p.a.
-49% 3% 11% 15%0%
Airline travel demand estimates, Trillions RPKs
8.6
3.15.0
20 20232019 21 22
7.8 8.7
-64% p.a.
0% -64% -42% -9% 1%
US Hotel RevPAR, nominal US dollars
$87
$41
$83 $86 $87
2019 20 202321 22
-53% p.a.
-53% -4% -1% 0%
$87
$29 $33
$68$80
2019 2220 21 2023
-66% p.a.
-66% -62% -21% -8%
A3 scenario estimates recovery in 2021; more conservative A1 scenario estimates near-recovery by 2023
70%
90%
25%
5% 5%
5%
100%
Jan 6-10, 2020
30+
Mar 22-28, 2020
8-300-7
100%
4. Hotel booking lead timeDays between booking date and arrival date, %

McKinsey & Company 62
Oil & Gas
Current as of April 24, 2020
Source: Bloomberg, press search, McKinsey Energy Insights Global Energy Perspective, McKinsey analysis
Oversupply expected to remain in the market even after demand recovery, which could keep a lid on prices through to 2022-23
Following the sharp oversupply, volatility in the market in the 2023-2025 horizon with sporadic tightness, followed by a period of oversupply (given 80+mtpa LNG capacity taking FID in the last 2 years)
Oil demand, Mbd
Road Transport
Aviation
48.7
36.644.0
2019
7.1
44.4
2020 Pre-COVID-19
7.3
49.1 47.6
40.5
5.0
2020 Virus Contained (A3)
4.4
46.0
2020 Muted Recovery (A1)
99.8
86.9
100.893.1
-6.7 -12.8
Early thoughts on evolution post-COVID
Based on our global COVID-19 scenarios, LNG demand will decline by 3-10% compared with pre-COVID-19 case to 320-350mtpa (compared with 380mtpa supply capacity). Near-term LNG prices will be driven by cash cost economics (with gas prices in Europe and Asia at $1-2/mmbtu premium to US gas prices)
Global oil demand substantially reduced due to restrictions in road transport and capacity declines in airlines across the world through Q3 2020
Low short-term oil prices are expected to continue for most of 2020 even if OPEC+ implements the latest output deal in full. Production shut-ins could start to materialize in 2020 and help to balance the market as inventory storage levels approach maximum levels
Medium-term expectations (through 2020)Current Impact
LNG
Oil
COVID-19 has affected regions that account for over 80% of global LNG demand; Chinese LNG imports (17% of global imports) fell by 7% yoy Jan-Mar 2020; buyers have triggered Force Majeure, cancelled cargoes and engage in contract renegotiations
Demand decline due to COVID-19 (6.7-13mbd for 2020 under A3 & A1 scenarios) and OPEC+ increase in production in February-April pushed oil prices under $30/ bbl.
Short term demand destruction (potential to be 20mbd for April) started to result in storage constraints and regional prices to fall even sharper, while US drilling activity has already been cut >25%.
20 23 242018 220
350
400
450
202519 21
-3%-10%
LNG demand, mt Orig. 2020 ProjectionA1A3


