44
COVID-19: projected impact on Indian PE/VC How GPs will manage the crisis in 2020
COVID-19: projected impact on Indian PE/VCHow GPs will manage the crisis in 2020

Why do uncertain times need the certainty of purpose?

PE/VC investments
Projected impact of COVID-19 on…
PE/VC investment strategies
PE/VC investments – a sectoral analysis
PE/VC exits, holding periods and returns
PE/VC fundraising
AppendicesAbout EY’s Private Equity Services
0612
38
1
2
3
4
5
222634

Eleven years ago, in the aftermath of the global financial crisis (GFC), Indian private equity (PE)/venture capital (VC) investments fell by 70% in 2009 from the peak seen in 2007. While each crisis is different, we looked at the GFC to get a sense of how private capital investors have reacted to an unforeseen, black swan event and the economic upheaval it brings in its wake. As of now, the Indian Government has extended the ‘lockdown’ to May 3 and has indicated its inclination to permit resumption of some economic activity under strict guidelines in ‘green’ zones. However, there is still a lot of uncertainty around: 1) the future trajectory of COVID-19 in India, 2) a fuller understanding of its ramifications on the global and Indian economy; and 3) the near-term economic trajectory of the country. While these uncertainties may continue to linger for some more time, our hypothesis is that there will be a significant reduction in Indian PE/VC investment and exit activity in 2020 as compared to the preceding year.
As per our initial estimates, from the 2019 peak of US$48 billion of PE/VC investments (across all asset classes including infrastructure, real estate and credit), we expect Indian PE/VC investments in 2020 to be in the range of US$19 billion to US$26 billion; a reduction of ~45% -60% from 2019 levels. PE/VC exits in 2020 are also expected to shrink considerably from 2019 levels. As per our initial estimates, PE/VC exits will be 50%-67% lower than the 2019 level. Over the next two quarters, we expect more clarity to emerge on the spread/control of the epidemic, removal of restrictions, revival of demand and supply chains and government response by way of fiscal
and policy stimulus. As our estimates are highly sensitive to these factors, we will continue to monitor the situation and if required, recalibrate our outlook periodically.
Projected PE/VC investment activity - 2020
• • In the near-term, we expect most general partners (GPs) to remain focused on their current portfolios, helping their company managements in ensuring business continuity and be in ‘wait and watch’ mode on new investment activity. GPs will probably help their portfolio companies by way of additional equity infusions, bridge financings, providing additional bandwidth to their portfolio company CXO teams that are currently firefighting on multiple fronts.
• • As clarity emerges, in the near-term, we expect PE/VC investors to do more private investment in public equity (PIPE) deals relative to what was done in 2019. As valuations in the public markets have corrected significantly, PE funds should be able to move quickly as quality listed businesses attempt to shore up cash and as foreign portfolio investors (FPIs) look to reduce their positions as a result of redemption pressures in their home markets.
• • Growth capital strategy is expected to lead the charge and regain its historical position as the largest deal type by value (in 2019, buyouts had emerged as the largest deal type by value). The coming difficult
Executivesummary

Executivetimes will give PE/VC funds the opportunity to deploy much needed capital at attractive terms with quality businesses and allow them to grow fast by capturing market share.
• • We expect GPs to go slow on buyouts till they fully understand the ramifications and the fallout of the pandemic crisis on the future business potential of their targets. Our projection is that buyout activity may be muted till the end of 3Q2020/ beginning of 4Q2020. We expect buyout deals to primarily emanate from conglomerates (that will look to carve out/divest non-core businesses). Bolt-on acquisitions by existing portfolio companies of buyout funds is another theme that we expect to find favour in 2020.
• • Special situation funds and multi-strategy PE funds with private credit strategies are expected to find significant deal flow in 2020. Many quality businesses/owners of quality businesses are now expected to be open to raising what was historically seen as ‘expensive’ structured debt. Relative to 2019, we project an increase in usage of convertible instruments by PE/VC investors.
• • Although start-up investments have shown resilience in 1Q2020, going ahead we expect the going to be tough, especially for early-stage companies with nil revenue and those with negative unit economics and significant cash burn rates.
• • Sectoral themes that we project to be the first to find favour with PE/VC investors include defensive sectors like technology, consumer goods (packaged essentials, personal and healthcare, food processing and retail), pharmaceuticals and sub-sectors like medical supply and services, biotech, agricultural products, edtech, chemicals, and e-commerce.
• • Investment activity in sectors like financial services, fintech, infrastructure, real estate, healthcare, non-essential consumer goods and services (durables, apparel, mobility, restaurants), and consumer internet that till recently attracted significant amounts of PE/VC investments may take some time to find traction.
In our view, significant bias towards ‘quality assets/businesses’ will be an overarching theme in 2020.
Projected PE/VC exit activity, hold periods and returns - 2020
• • In 2020, exit activity is expected to see a significant slowdown till there is a meaningful recovery in asset prices and economic activity.
• • PE/VC funds are more likely to hold portfolio positions for longer, work through the crisis and sell in better times as opposed to selling at deeply discounted valuations that the current uncertain economic environment may warrant.
• • This may lead to significant increase in hold periods which shall impact Internal Rate of Returns (IRRs) negatively. Similar trends were also observed post the GFC.
• • Some funds, that are at the tail end of their lives may not have the ability to extend their hold periods and may be contractually forced to offer exits to their limited partners (LPs). This could lead to an increased incidence of portfolio sales to specialist secondary funds.
PE/VC fundraising – Outlook in 2020
• • Fresh fundraising in 2020 may slow down as LPs rebalance their asset allocations and gravitate towards tried and tested GPs with track record of delivering returns to LPs across cycles.
• • Nascent GPs, first-time fund managers, and spin-offs may find it difficult to raise capital in this environment.
• • Consolidation of the Indian PE/VC sector is expected to continue as GPs with multiple funds under their belt find better success at raising capital from LPs.
COVID-19: projected impact on Indian PE/VC 5

COVID-19: projected impact on Indian PE/VC6 6
1Projected impact on Indian PE/VC investments
Chapter
COVID-19: projected impact on Indian PE/VC 7
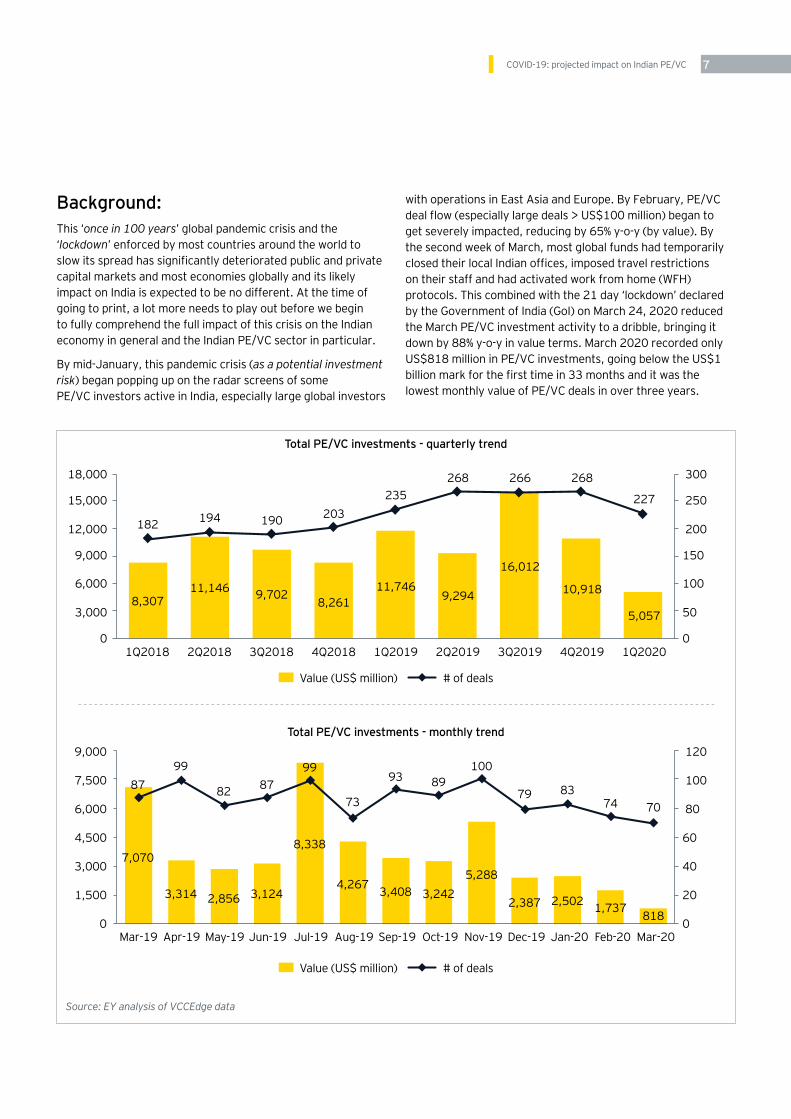
Background:This ‘once in 100 years’ global pandemic crisis and the ‘lockdown’ enforced by most countries around the world to slow its spread has significantly deteriorated public and private capital markets and most economies globally and its likely impact on India is expected to be no different. At the time of going to print, a lot more needs to play out before we begin to fully comprehend the full impact of this crisis on the Indian economy in general and the Indian PE/VC sector in particular.
By mid-January, this pandemic crisis (as a potential investment risk) began popping up on the radar screens of some PE/VC investors active in India, especially large global investors
with operations in East Asia and Europe. By February, PE/VC deal flow (especially large deals > US$100 million) began to get severely impacted, reducing by 65% y-o-y (by value). By the second week of March, most global funds had temporarily closed their local Indian offices, imposed travel restrictions on their staff and had activated work from home (WFH) protocols. This combined with the 21 day ‘lockdown’ declared by the Government of India (GoI) on March 24, 2020 reduced the March PE/VC investment activity to a dribble, bringing it down by 88% y-o-y in value terms. March 2020 recorded only US$818 million in PE/VC investments, going below the US$1 billion mark for the first time in 33 months and it was the lowest monthly value of PE/VC deals in over three years.
Total PE/VC investments - quarterly trend
Total PE/VC investments - monthly trend
Source: EY analysis of VCCEdge data
1Q2018
Mar-19 Jul-19 Nov-19May-19 Sep-19 Jan-20Apr-19 Aug-19 Dec-19Jun-19 Oct-19 Feb-20 Mar-20
1Q20193Q2018 3Q20192Q2018 2Q20194Q2018 4Q2019 1Q2020
8,307
182
18,000 300
12,000 200
3,000 50
15,000 250
6,000 100
9,000 150
0 0
Value (US$ million) # of deals
Value (US$ million) # of deals
11,746
235
9,702
190
16,012
266
11,146
194
9,294
268
8,261
203
10,918
268
5,057
227
9,000 120
6,000 80
1,500 20
7,500 100
3,000 40
4,500 60
0 0
7,0708,338
5,288
2,856 3,4082,5023,314
4,2672,387
3,124 3,2421,737
818
8799 100
8293
83
99
7379
87 89
74 70
COVID-19: projected impact on Indian PE/VC8 8
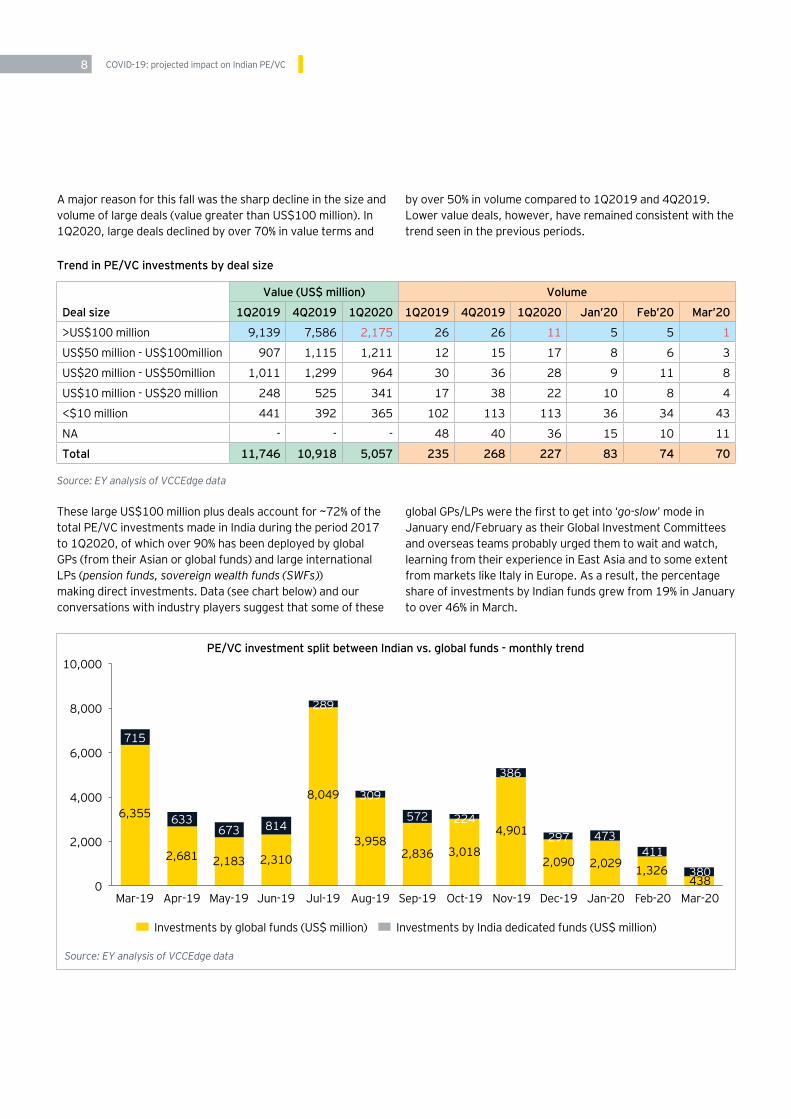
A major reason for this fall was the sharp decline in the size and volume of large deals (value greater than US$100 million). In 1Q2020, large deals declined by over 70% in value terms and
These large US$100 million plus deals account for ~72% of the total PE/VC investments made in India during the period 2017 to 1Q2020, of which over 90% has been deployed by global GPs (from their Asian or global funds) and large international LPs (pension funds, sovereign wealth funds (SWFs)) making direct investments. Data (see chart below) and our conversations with industry players suggest that some of these
Trend in PE/VC investments by deal size
PE/VC investment split between Indian vs. global funds - monthly trend
Source: EY analysis of VCCEdge data
Source: EY analysis of VCCEdge data
10,000
Mar-19 Jul-19 Nov-19May-19 Sep-19 Jan-20Apr-19 Aug-19 Dec-19Jun-19 Oct-19 Feb-20 Mar-20
8,000
6,000
4,000
2,000
0
by over 50% in volume compared to 1Q2019 and 4Q2019. Lower value deals, however, have remained consistent with the trend seen in the previous periods.
Deal size
Value (US$ million) Volume
1Q2019 4Q2019 1Q2020 1Q2019 4Q2019 1Q2020 Jan’20 Feb’20 Mar’20
>US$100 million 9,139 7,586 2,175 26 26 11 5 5 1
US$50 million - US$100million 907 1,115 1,211 12 15 17 8 6 3
US$20 million - US$50million 1,011 1,299 964 30 36 28 9 11 8
US$10 million - US$20 million 248 525 341 17 38 22 10 8 4
<$10 million 441 392 365 102 113 113 36 34 43
NA - - - 48 40 36 15 10 11
Total 11,746 10,918 5,057 235 268 227 83 74 70
global GPs/LPs were the first to get into ‘go-slow’ mode in January end/February as their Global Investment Committees and overseas teams probably urged them to wait and watch, learning from their experience in East Asia and to some extent from markets like Italy in Europe. As a result, the percentage share of investments by Indian funds grew from 19% in January to over 46% in March.
Investments by global funds (US$ million) Investments by India dedicated funds (US$ million)
6,355
715
8,049
289
4,901
386
2,183
673
2,836
572
2,029
473
2,681
633
3,958
309
2,090
297
2,310
814
3,018
224
1,326411
438380
COVID-19: projected impact on Indian PE/VC 9
Looking aheadMost of the deals that were announced in February and March were on the back of significant work done in the preceding 6-9 months. As it is in India, it takes time to satisfactorily complete due diligence and negotiate/close-down on valuation discussions and investment documents. Travel restrictions and the inability to have in-person meetings has significantly slowed down deals that are work-in-progress. These deals in all likelihood, will be revalued if not cancelled once the lockdown restrictions are lifted. On the whole, we expect PE/VC investors to price in the enhanced business risk by becoming more sceptical and stringent on due diligence and valuation of deals that are work-in-progress.
In the near-term, till the lockdown restrictions are completely lifted, travel resumes and there is more clarity on revenue projections and supply chain revival, we expect most GPs to remain focused on their current portfolios, helping their company managements in ensuring business continuity. GPs are helping their portfolio companies by way of additional equity infusions, bridge financings, and providing additional bandwidth to their portfolio company CXO teams that are currently firefighting on multiple fronts. On new investment deals, we think most PE/VC investors will be in ‘wait and watch mode’ and wait for more clarity to emerge.
In the medium-term, while a lot depends on the timing and extent of relaxation of lockdown and travel restrictions (in phases or otherwise) and India’s success in controlling the spread of this disease, subsequent relapses etc., we expect the following to play out in 2020:
• • Relatively speaking, we expect PE/VC investors to do more PIPE deals in the near-term, as valuations in the public markets have corrected significantly and opportunistic and nimble PE funds may be able to move quickly as quality listed businesses look to shore up cash and as FPIs look to reduce their positions as a result of redemption pressures in their home markets.
• • Growth capital strategy, which was replaced by buyouts as the largest PE/VC deal type in 2019 (by value), is expected to regain its historical position as the largest deal strategy. The coming difficult times and subdued economic growth will allow PE funds to deploy much needed capital at attractive terms with quality businesses, allowing them to grow faster than the underlying sector, by capturing market share from the smaller players and the unorganized sector.
• • We expect GPs to go-slow on buyouts till they fully understand the ramifications and fallout of the pandemic crisis on the future business potential of their targets. Buyout activity is expected to pick traction in the end of
3Q2020 / beginning of 4Q2020 and we expect buyout deal flow to primarily emanate from conglomerates (that will look to carve out/divest non-core businesses so that they can deleverage/focus capital resources on their core businesses). We expect buyout funds that have made significant bets in the last couple of years to help their existing portfolio companies make ‘bolt-on’ acquisitions.
• • Special situation funds and multi-strategy PE funds with private credit strategies are expected to find significant deal flow in 2020 as the stress caused by the pandemic permeates through corporate balance sheets. Many quality businesses/owners of quality businesses are now expected to be open to raising what was historically seen as ‘expensive’ structured debt to help capitalize other parts of their empire that are probably not doing as well. Relative to 2019, increased usage of convertible instruments by PE/VC investors is expected.
• • Although start-up investments have shown resilience, growing in March by 66% yoy (by value), looking ahead we expect the going to be tough, especially for early-stage companies with nil revenue and those with negative unit economics and significant cash burn rates. Fundraising is expected to get significantly tougher as VC investors are expected to focus on conserving capital for the winners in their portfolio as opposed to deploying on new growth-oriented opportunities. In general, we expect VC investors to become more sceptical on ‘growth projections’ and stringent on due diligence.
What can we learn from the pastWith COVID-19 causing a severe disruption in business operations, consumer behaviour, supply chains and growth prospects, many Indian businesses have seen a major portion of their revenue streams erode quickly and considerably. Without clarity on when these revenues and growth patterns will revive, business risk premium has gone up significantly, warranting a rerating of valuation multiples. As a result, all other things remaining the same, the same deals can happen with much lesser allocation of capital from PE/VC funds. Now, even if PE/VC investment activity picks-up in terms of volume, it would take some time before we return to the peak value of deal sizes and the record-breaking investment values witnessed over the past couple of years.
Although, each crisis is different with its own unique dynamics, fear of the uncertain and its impact according to behavioural finance theory is consistent. If we look at the PE/VC activity during the GFC, PE/VC investment value declined by 40% and 70% consecutively in the following two years after hitting a peak in 2007.
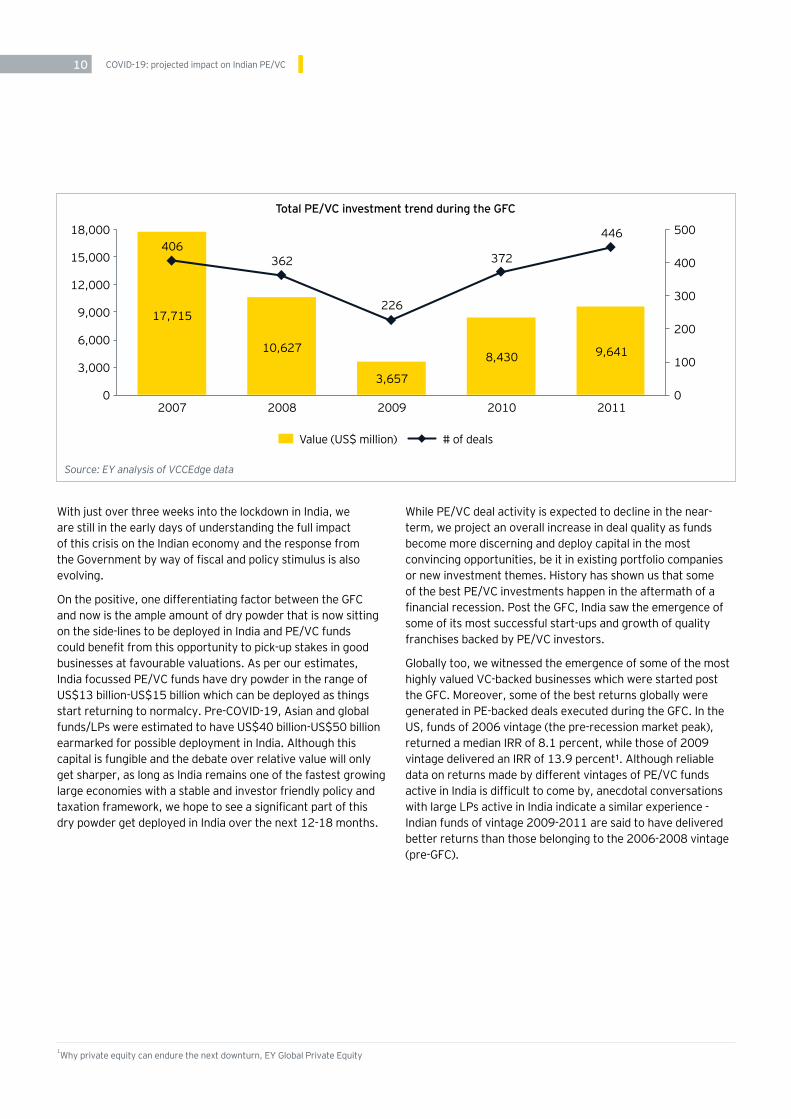
COVID-19: projected impact on Indian PE/VC1010
While PE/VC deal activity is expected to decline in the near-term, we project an overall increase in deal quality as funds become more discerning and deploy capital in the most convincing opportunities, be it in existing portfolio companies or new investment themes. History has shown us that some of the best PE/VC investments happen in the aftermath of a financial recession. Post the GFC, India saw the emergence of some of its most successful start-ups and growth of quality franchises backed by PE/VC investors.
Globally too, we witnessed the emergence of some of the most highly valued VC-backed businesses which were started post the GFC. Moreover, some of the best returns globally were generated in PE-backed deals executed during the GFC. In the US, funds of 2006 vintage (the pre-recession market peak), returned a median IRR of 8.1 percent, while those of 2009 vintage delivered an IRR of 13.9 percent¹. Although reliable data on returns made by different vintages of PE/VC funds active in India is difficult to come by, anecdotal conversations with large LPs active in India indicate a similar experience - Indian funds of vintage 2009-2011 are said to have delivered better returns than those belonging to the 2006-2008 vintage (pre-GFC).
Total PE/VC investment trend during the GFC
Source: EY analysis of VCCEdge data
18,000 500
2011
9,641
446
2007
17,715
406
2009
3,657
226
2008
10,627
362
2010
8,430
372
12,000300
15,000 400
9,000200
6,000
100 3,000
0 0
With just over three weeks into the lockdown in India, we are still in the early days of understanding the full impact of this crisis on the Indian economy and the response from the Government by way of fiscal and policy stimulus is also evolving.
On the positive, one differentiating factor between the GFC and now is the ample amount of dry powder that is now sitting on the side-lines to be deployed in India and PE/VC funds could benefit from this opportunity to pick-up stakes in good businesses at favourable valuations. As per our estimates, India focussed PE/VC funds have dry powder in the range of US$13 billion-US$15 billion which can be deployed as things start returning to normalcy. Pre-COVID-19, Asian and global funds/LPs were estimated to have US$40 billion-US$50 billion earmarked for possible deployment in India. Although this capital is fungible and the debate over relative value will only get sharper, as long as India remains one of the fastest growing large economies with a stable and investor friendly policy and taxation framework, we hope to see a significant part of this dry powder get deployed in India over the next 12-18 months.
1Why private equity can endure the next downturn, EY Global Private Equity
Value (US$ million) # of deals

COVID-19: projected impact on Indian PE/VC 11COVID-19: projected impact on Indian PE/VC 11

COVID-19: projected impact on Indian PE/VC1212
2Potential impact on PE/VC investment strategies
Chapter

COVID-19: projected impact on Indian PE/VC 13
Like the global markets, the Indian capital markets have been completely routed by the pandemic crisis. By mid April, the NIFTY50 was down YTD by 26%; the NIFTY Midcap 100 was down YTD by 25% and the NIFTY Smallcap 100 was down
Looking aheadGiven that the timing of the lifting of lockdown and the accompanying conditions around maintenance of social distancing and travel restrictions are still unclear and there is significant uncertainty over other aspects like rebooting of supply chains and revival of demand and revenues, the ability of PE/VC funds to conduct a stringent due diligence process on private companies is expected to remain tough for the short-term. With valuations of quality businesses in the listed space having corrected significantly, we believe that relative to the previous year, there is a possibility of an uptick in PIPE investment activity by PE/VC funds.
YTD by 32%. Consequently, it is fair to assume that most of the PIPE investments by PE funds in the recent past are significantly in the red at present.
PIPE investments - quarterly trend
PIPE investments - monthly trend
Source: EY analysis of VCCEdge data
1Q2018
Mar-19 Jul-19 Nov-19May-19 Sep-19 Jan-20Apr-19 Aug-19 Dec-19Jun-19 Oct-19 Feb-20 Mar-20
1Q20193Q2018 3Q20192Q2018 2Q20194Q2018 4Q2019 1Q2020
1,930
9
2,000 25
1,200 15
1,600 20
400 5
800 10
0 0
2,023
16
80
6927
13
1,103
20
988
13
635
11
1,322
19
643
19
1,600 10
800
8
2
1,200
4
400
6
0 0
1,589
590774
62 185 232588
153 266339 281 260 151
78
9
23
55
2
56
56
8
With many FPIs reducing their India exposure because of redemption and other pressures in their home markets, PE/VC funds could potentially find attractive opportunities to buy decent sized stakes in listed companies, which could also provide scope for quick sell down once things improve materially over the next 2-3 years. Similarly, qualified institutional placements (QIPs) and preference issues by quality listed players looking for capital to shore up business growth prospects could also offer potentially attractive PIPE opportunities to PE/VC investors.
PIPE investments
Value (US$ million) # of deals
Value (US$ million) # of deals
COVID-19: projected impact on Indian PE/VC1414
Growth capital investments - quarterly trend
Growth capital investments - monthly trend
Source: EY analysis of VCCEdge data
1Q2018
Mar-19 Jul-19 Nov-19May-19 Sep-19 Jan-20Apr-19 Aug-19 Dec-19Jun-19 Oct-19 Feb-20 Mar-20
1Q20193Q2018 3Q20192Q2018 2Q20194Q2018 4Q2019 1Q2020
1,897
625,000 70
60
3,000 40
4,00050
1,00020
10
2,000 30
0 0
4,337
61
4,269
63
3,454
62
4,719
62
3,003
52
3,298
42
4,671
57
1,831
39
2,000 30
1,000
25
10
5
1,500
15
500
20
0 0
1,867
1,317
1,849
950588
968505
1,5491,128
1,548 1,694
677187
27
2325
20 21
1315
18 171715 15
11
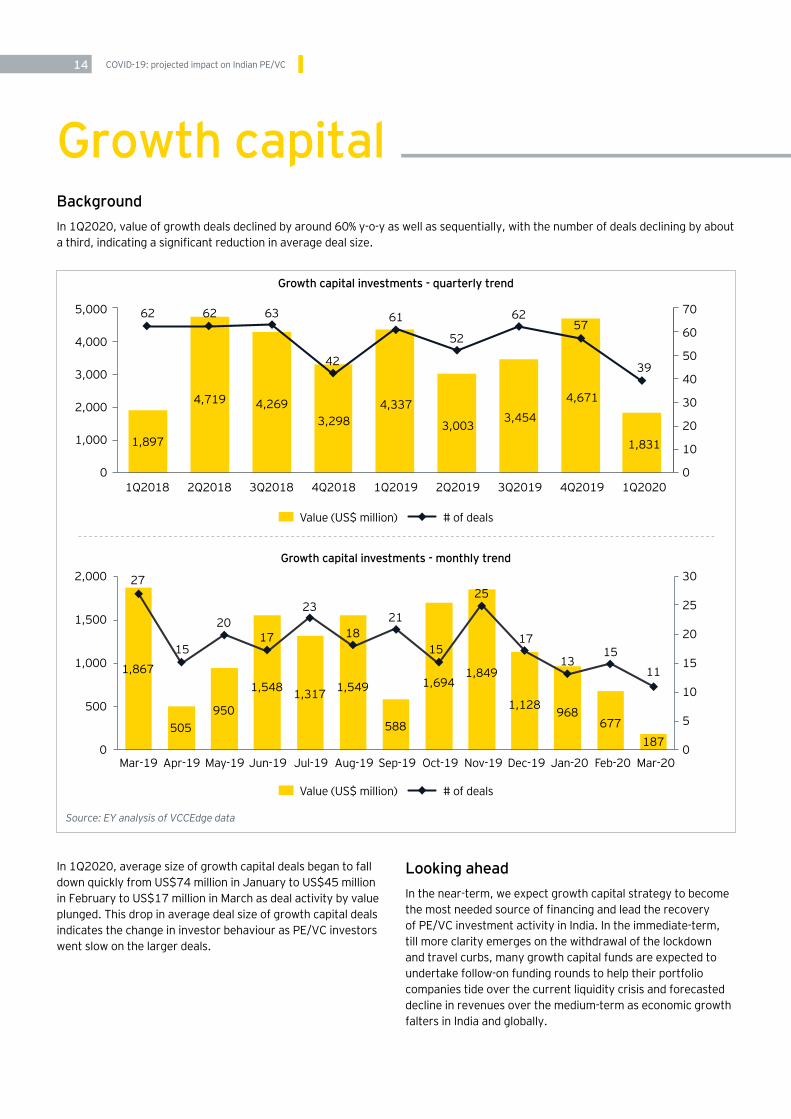
BackgroundIn 1Q2020, value of growth deals declined by around 60% y-o-y as well as sequentially, with the number of deals declining by about a third, indicating a significant reduction in average deal size.
In 1Q2020, average size of growth capital deals began to fall down quickly from US$74 million in January to US$45 million in February to US$17 million in March as deal activity by value plunged. This drop in average deal size of growth capital deals indicates the change in investor behaviour as PE/VC investors went slow on the larger deals.
Looking aheadIn the near-term, we expect growth capital strategy to become the most needed source of financing and lead the recovery of PE/VC investment activity in India. In the immediate-term, till more clarity emerges on the withdrawal of the lockdown and travel curbs, many growth capital funds are expected to undertake follow-on funding rounds to help their portfolio companies tide over the current liquidity crisis and forecasted decline in revenues over the medium-term as economic growth falters in India and globally.
Growth capital
Value (US$ million) # of deals
Value (US$ million) # of deals
COVID-19: projected impact on Indian PE/VC 15
are category leaders) to raise equity capital and grow faster than the underlying sector by winning market share from the smaller/unorganized players. The troubles of these smaller players in the wake of the pandemic crisis will only deepen, significantly hampering their ability to ward-off competition from the more established players.
Trend in growth capital investments during the GFC
Source: EY analysis of VCCEdge data
10,000 250
2011
5,729
198
2007
8,139
221
2009
2,098
109
2008
7,130
209
2010
6,367
204
6,000 150
8,000 200
4,000 100
2,000 50
0 0
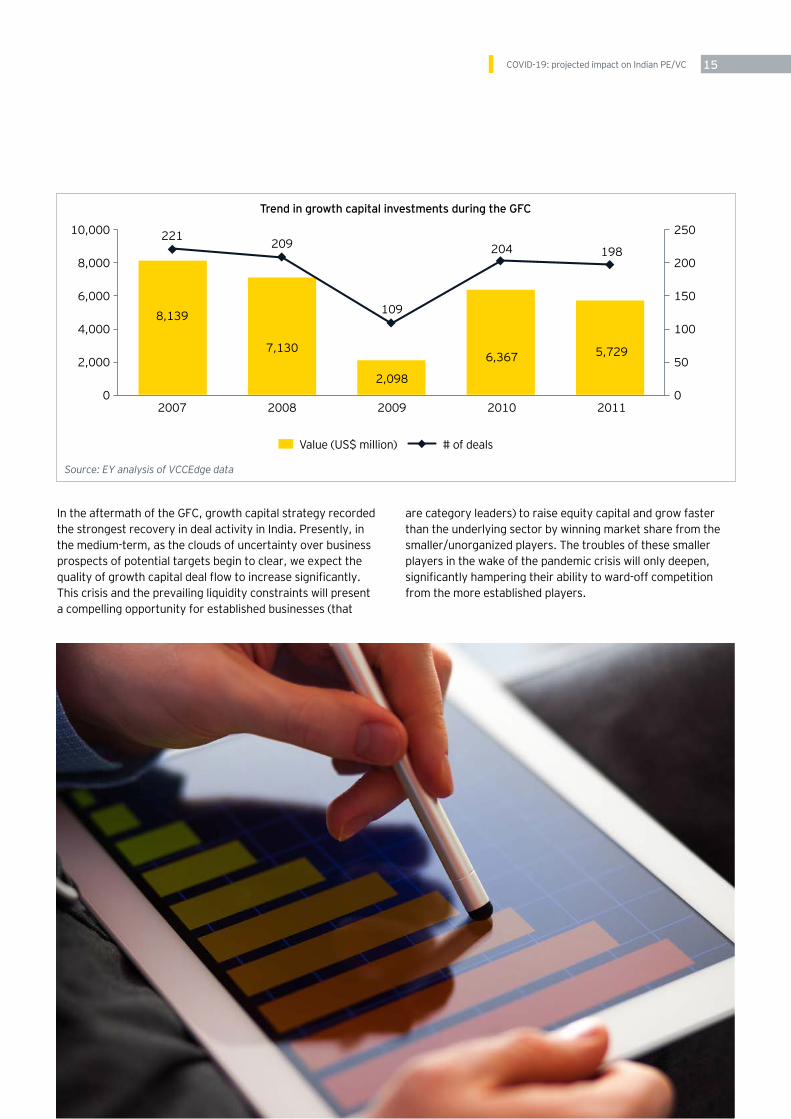
In the aftermath of the GFC, growth capital strategy recorded the strongest recovery in deal activity in India. Presently, in the medium-term, as the clouds of uncertainty over business prospects of potential targets begin to clear, we expect the quality of growth capital deal flow to increase significantly. This crisis and the prevailing liquidity constraints will present a compelling opportunity for established businesses (that
Value (US$ million) # of deals

COVID-19: projected impact on Indian PE/VC1616
BackgroundIn 1Q2020, as the pandemic crisis began to emerge as a potential investment risk, global and Asian funds, which perform bulk of the buyouts and large deals in India, started becoming more circumspect about large funding outlays. This
‘go slow’ mode resulted in buyouts in 1Q2020 (US$0.29 billion) reducing by 92% in value compared to 1Q2019 (US$3.9 billion) and by 88% compared to 4Q2019 (US$2.5 billion). The number of buyouts in 1Q2020 are also half of that recorded in 1Q2019 and down by 42% compared to 4Q2019.
Buyouts - quarterly trend
Buyouts - monthly trend
Source: EY analysis of VCCEdge data
1Q2018
Mar-19 Jul-19 Nov-19May-19 Sep-19 Jan-20Apr-19 Aug-19 Dec-19Jun-19 Oct-19 Feb-20 Mar-20
1Q20193Q2018 3Q20192Q2018 2Q20194Q2018 4Q2019 1Q2020
2,904
13
8,000 20
6,000
10
15
2,000 5
4,000
0 0
3,869
14
2,583
11
7,496
18
2,998
12
2,385
14
1,947
13
2,499
12
293
7
5,000 10
3,000
8
2
4,000
42,000
1,000
6
0 0
3,177
4,670
1,6521,091
1,709
71865 1,118
347428 500 209 13
8
5 55
7
3
56
2
45
3
1
The self-imposed travel restrictions by global/Asian funds in early March and the activation of WFH protocols further limited the extent of interactions between funds and their advisors and targets, constraining the ability to move quickly to close pending work on deals that were work-in-progress. In March, we saw buyout deals grind to a virtual standstill, with just one buyout investment announced. Such a precipitous drop in buyout activity has been witnessed for the first time in the past 27 months.
Looking aheadIn the near-term, we expect buyout funds to focus on their existing portfolio companies, helping address liquidity issues and working with them through this crisis. As the chart below shows, the past two years saw record amount of buyouts by PE funds, and in 2019, for the first time, buyouts emerged as the most dominant PE strategy by value. In hindsight, most of these deals appear to have happened at close to peak valuations and buyout investors are expected to have their hands full as they help their portfolio companies navigate these turbulent times.
Buyouts
Value (US$ million) # of deals
Value (US$ million) # of deals

COVID-19: projected impact on Indian PE/VC 17
PE/VC investment trend by deal type
Source: EY analysis of VCCEdge data
50,000
1Q2020293643820
1,8311,468
2017
2,958
13,426
3,5033,7722,516
2018
10,432
14,183
6,481
3,7492,570
2019
16,248
15,465
7,916
5,260
3,080
30,000
40,000
20,000
10,000
0
Buyout (US$ million)Growth capital (US$ million)
Start-up (US$ million)PIPE (US$ million)
Credit investment (US$ million)
fraught with significant uncertainty on multiple aspects, we anticipate that deals will only take longer. Accordingly, we project a significant slowdown in buyout activity in 2020.
We believe that carveouts/divestments by diversified conglomerates looking to raise capital by selling non-core assets for deleveraging/shoring up their core business will be one of the main sources of buyout deal flow. As stress permeates through corporate balance sheets and lenders look to jettison non-performing loans, opportunities will emerge for special situation investors to take control of businesses with broken capital structures but workable income statements via purchase of debt instruments.
Bolt-on acquisitions by existing portfolio companies acquired by buyout funds in the last two years is another theme we expect to emerge in 2020. Backed by well capitalised shareholders, we expect these portfolio companies to be on the lookout for acquiring quality smaller players at attractive valuations once uncertainty over some if not all variables begins to recede.
We project a significant slowdown of deals that are ‘work-in-progress’ as lockdown restrictions and travel curbs restrict the ability to complete full scale diligences, plant visits, and face-to-face negotiation meetings. The impact of reduced buyout activity on the overall PE/VC investment flows in 2020 is going to be significant, as in 2019, buyout was the most dominant deal strategy, accounting for 34% of all deals by value.
Even after lockdown restrictions and travel curbs begin to get lifted, we expect buyout activity to start picking traction by end of 3Q2020 / beginning of 4Q2020 as funds would like to first fully understand the effects of the pandemic, government relief measures, changes in policy, consumer behaviour, rebooting of supply chains, availability of credit, sustainability of revenues etc. on the prospective target’s projections. In any case, given that a financial sponsor is taking over control, buyout transactions require maximum due diligence and in the normal course, these transactions easily take anywhere between six months to a year to close. In the post COVID-19 reality still
COVID-19: projected impact on Indian PE/VC1818
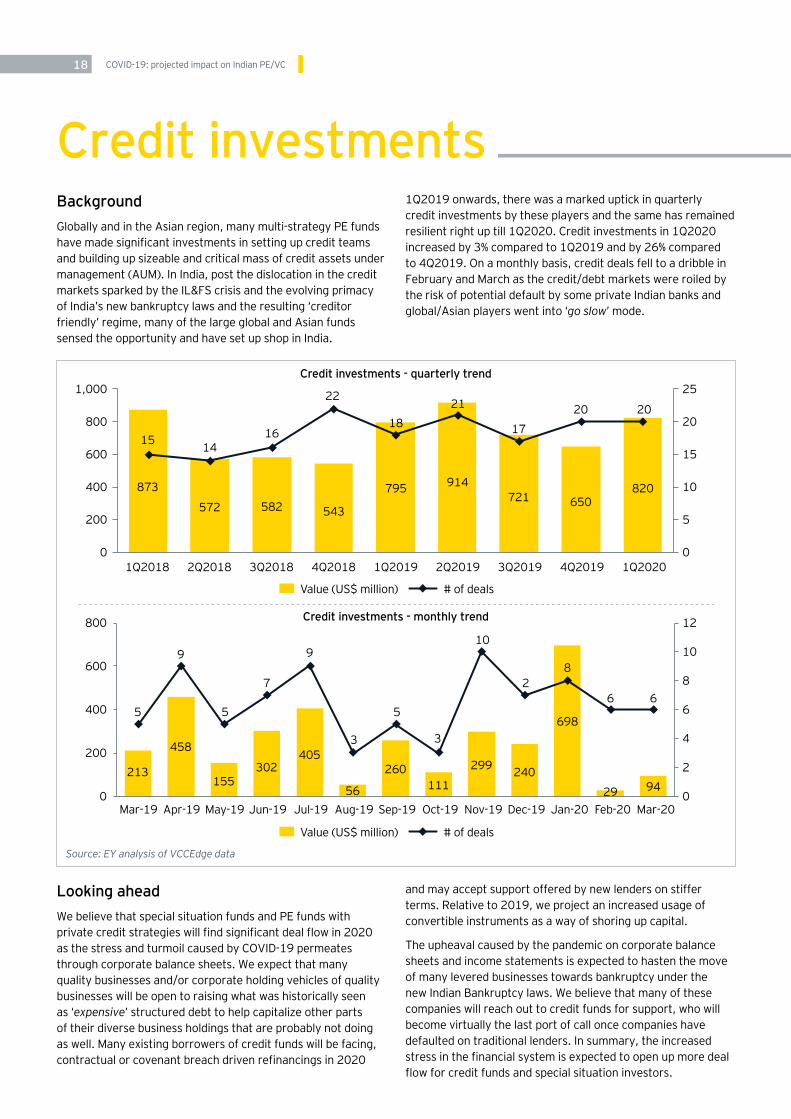
BackgroundGlobally and in the Asian region, many multi-strategy PE funds have made significant investments in setting up credit teams and building up sizeable and critical mass of credit assets under management (AUM). In India, post the dislocation in the credit markets sparked by the IL&FS crisis and the evolving primacy of India’s new bankruptcy laws and the resulting ‘creditor friendly’ regime, many of the large global and Asian funds sensed the opportunity and have set up shop in India.
Looking aheadWe believe that special situation funds and PE funds with private credit strategies will find significant deal flow in 2020 as the stress and turmoil caused by COVID-19 permeates through corporate balance sheets. We expect that many quality businesses and/or corporate holding vehicles of quality businesses will be open to raising what was historically seen as ‘expensive’ structured debt to help capitalize other parts of their diverse business holdings that are probably not doing as well. Many existing borrowers of credit funds will be facing, contractual or covenant breach driven refinancings in 2020
1Q2019 onwards, there was a marked uptick in quarterly credit investments by these players and the same has remained resilient right up till 1Q2020. Credit investments in 1Q2020 increased by 3% compared to 1Q2019 and by 26% compared to 4Q2019. On a monthly basis, credit deals fell to a dribble in February and March as the credit/debt markets were roiled by the risk of potential default by some private Indian banks and global/Asian players went into ‘go slow’ mode.
and may accept support offered by new lenders on stiffer terms. Relative to 2019, we project an increased usage of convertible instruments as a way of shoring up capital.
The upheaval caused by the pandemic on corporate balance sheets and income statements is expected to hasten the move of many levered businesses towards bankruptcy under the new Indian Bankruptcy laws. We believe that many of these companies will reach out to credit funds for support, who will become virtually the last port of call once companies have defaulted on traditional lenders. In summary, the increased stress in the financial system is expected to open up more deal flow for credit funds and special situation investors.
Credit investments - quarterly trend
Credit investments - monthly trend
Source: EY analysis of VCCEdge data
1Q2018
Mar-19 Jul-19 Nov-19May-19 Sep-19 Jan-20Apr-19 Aug-19 Dec-19Jun-19 Oct-19 Feb-20 Mar-20
1Q20193Q2018 3Q20192Q2018 2Q20194Q2018 4Q2019 1Q2020
873
15
1,000 25
20800
10
15
400
200 5
600
0 0
795
18
582
16
721
17
572
14
914
21
543
22
650
20
820
20
800 12
10
400
8
2
600
4200
6
0 0
213405
299155
260
698
458
56240302
111 29 94
5
910
5 5
89
3
27
3
6 6
Credit investments
Value (US$ million) # of deals
Value (US$ million) # of deals

COVID-19: projected impact on Indian PE/VC 19
BackgroundStart-up investments for now have shown resilience in 1Q2020, increasing by 2x over 1Q2019 in terms of value and by 13% in terms of volume. However, compared to 4Q2019,
Looking aheadThe promulgation of lockdowns and social distancing norms across the world has dampened economic activity and sentiment significantly and in the near-term, we project a steep dip in the availability of risk capital, especially for start-ups with negative unit economics and high cash burn rates.
start-up investments declined by 17% in terms of value and 11% in terms of volume. While March saw a dip from levels seen in the previous months, it was not a very steep fall and in fact significantly more than the levels seen in March 2019.
Start-up investments - quarterly trend
Start-up investments - monthly trend
Source: EY analysis of VCCEdge data
1Q2018
Mar-19 Jul-19 Nov-19May-19 Sep-19 Jan-20Apr-19 Aug-19 Dec-19Jun-19 Oct-19 Feb-20 Mar-20
1Q20193Q2018 3Q20192Q2018 2Q20194Q2018 4Q2019 1Q2020
703
83
4,000 200
2,000120
3,000160
1,00040
80
0 0723
126
2,186
94
3,414
156
1,754
86
2,004
168
1,838
115
1,775
160
1,468
142
1,400 70
800
60
50
10
1,200
1,000
600
200
30
20400
40
0 0224
1,356
714598 666 533
899
1,392
406507 655 562373
40
54 515057 54
65
4448
53
61
44 44
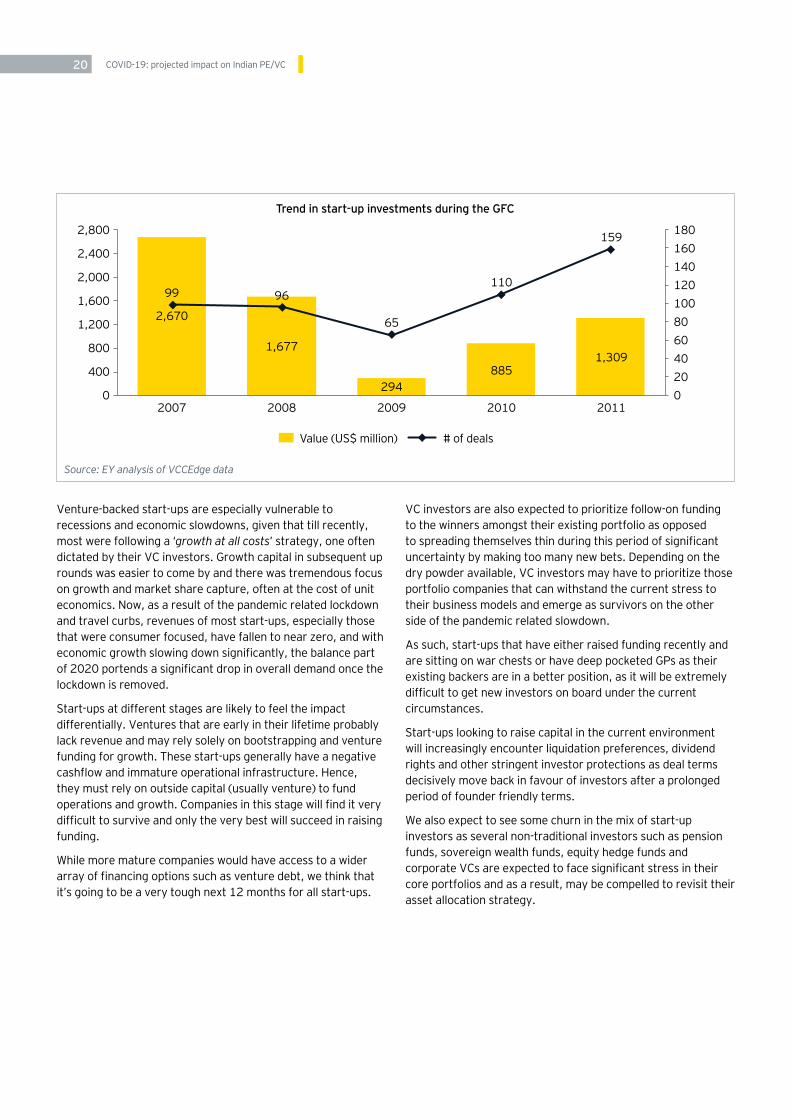
During the GFC, start-up funding recorded one of the steepest declines. Start-up investments declined by 89% from a high of US$2.7 billion in 2007 to a low of US$294 million in 2009.
Start-up investments
Value (US$ million) # of deals
Value (US$ million) # of deals
COVID-19: projected impact on Indian PE/VC2020
Trend in start-up investments during the GFC
Source: EY analysis of VCCEdge data
2,800 180
80
2011
1,309
159
2007
2,670
99
2009
294
65
2008
1,677
96
2010
885
110 2,000140
40
2,400 160
60
1,600120
20
1,200
800
400
100
0 0
Venture-backed start-ups are especially vulnerable to recessions and economic slowdowns, given that till recently, most were following a ‘growth at all costs’ strategy, one often dictated by their VC investors. Growth capital in subsequent up rounds was easier to come by and there was tremendous focus on growth and market share capture, often at the cost of unit economics. Now, as a result of the pandemic related lockdown and travel curbs, revenues of most start-ups, especially those that were consumer focused, have fallen to near zero, and with economic growth slowing down significantly, the balance part of 2020 portends a significant drop in overall demand once the lockdown is removed.
Start-ups at different stages are likely to feel the impact differentially. Ventures that are early in their lifetime probably lack revenue and may rely solely on bootstrapping and venture funding for growth. These start-ups generally have a negative cashflow and immature operational infrastructure. Hence, they must rely on outside capital (usually venture) to fund operations and growth. Companies in this stage will find it very difficult to survive and only the very best will succeed in raising funding.
While more mature companies would have access to a wider array of financing options such as venture debt, we think that it’s going to be a very tough next 12 months for all start-ups.
VC investors are also expected to prioritize follow-on funding to the winners amongst their existing portfolio as opposed to spreading themselves thin during this period of significant uncertainty by making too many new bets. Depending on the dry powder available, VC investors may have to prioritize those portfolio companies that can withstand the current stress to their business models and emerge as survivors on the other side of the pandemic related slowdown.
As such, start-ups that have either raised funding recently and are sitting on war chests or have deep pocketed GPs as their existing backers are in a better position, as it will be extremely difficult to get new investors on board under the current circumstances.
Start-ups looking to raise capital in the current environment will increasingly encounter liquidation preferences, dividend rights and other stringent investor protections as deal terms decisively move back in favour of investors after a prolonged period of founder friendly terms.
We also expect to see some churn in the mix of start-up investors as several non-traditional investors such as pension funds, sovereign wealth funds, equity hedge funds and corporate VCs are expected to face significant stress in their core portfolios and as a result, may be compelled to revisit their asset allocation strategy.
Value (US$ million) # of deals

COVID-19: projected impact on Indian PE/VC 21COVID-19: projected impact on Indian PE/VC 21

COVID-19: projected impact on Indian PE/VC2222
3Estimated impact on Indian PE/VC investments — a sectoral analysis
Chapter

COVID-19: projected impact on Indian PE/VC 23
What worked in 2019 may not be attractive post-COVID-192019 and 2018 saw record PE/VC investment flows into India with significant concentration in the top four sectors — infrastructure, financial services, real estate and e-commerce. These sectors accounted for almost 71% of all PE/VC investments received in 2019.
The COVID-19 crisis has unleashed a formidable set of challenges for each of these sectors. Until there is clarity on how the crisis will impact the economic trajectory of these sectors, PE/VC investment activity in these four sectors in 2020 is projected to be muted.
Infrastructure Infrastructure was the primary growth driver behind the 28% increase in annual PE/VC investments from 2018 to 2019. Its 225% growth in PE/VC investments over 2018 levels was primarily driven by the acceptability of Infrastructure Investment Trusts (InvITs) by large global asset managers, attracted by the promise of their long-term, stable, tax-efficient
Top sectors by value (US$ billion)
Others 3.24.7
1.0 35Others
Logistics 1.3 0.9
0.2 16Retail and consumer
Retail and consumer 1.01.8
0.2 9Infrastructure
Technology 3.9 3.8
0.4 11Real estate
Financial services 9.1 7.6
0.9 39Technology
Telcommunication 0.91.3
0.1 15Education
Life sciences 2.5 1.7
0.3 17Life sciences
Real estate 6.1 4.6
0.3 21E-commerce
Industrial products 1.11.6
0.2 14
E-commerce 4.3 5.0
0.5 15Food and agriculture
Infrastructure 14.5 4.5
1.0 35Financial services
Media and entertainment
Top sectors by number of deals
131111
6336
5124
7153
147125
4039
6960
13496
6041
8342
188143
1Q2020 2019 2018
Source: EY analysis of VCCEdge data
yields. Prior to COVID-19, the Finance Bill 2020 had anyways given rise to some questions on the post-tax returns available to InvIT and Real Estate Investment Trust (REIT) investors, thereby impacting sentiment. Coupled with the significant depreciation in the Indian Rupee vs. the USD and the prevailing foreign currency volatility seen post COVID-19, the value of PE/VC investments in infrastructure ground to a virtual halt in March 2020 (US$3 million). Going forward, we expect PE/VC investors making large infrastructure investment bets to be circumspect and evaluate transactions more stringently and go in ‘wait and watch mode’ for some time. Investors may need time to understand and digest the potential impact of this crisis on the balance sheets of the InvIT sponsors, future cash flow projections from the infrastructure assets, projected future currency depreciation and India’s macroeconomic health.

COVID-19: projected impact on Indian PE/VC2424
Real estateReal estate PE/VC investments grew by 33% in 2019, largely on the back of large commercial real estate portfolio deals funded by large, global asset managers that were acquiring portfolios of premium yield generating assets across office, retail, warehousing and hospitality real estate segments. The success of India’s maiden REIT listing in early 2019 and acceptance of this new security class by institutional investors prompted many large investors/owners of quality commercial real estate to draw up REIT listing plans. Post COVID-19, value of PE/VC investments in real estate plunged to a dribble (US$8 million). The country-wide lockdown and social distancing norms have completely disrupted the business operations of tenants. Going forward, owners of commercial real estate portfolios face considerable headwinds on matters related to deteriorating credit rating of tenants, future drop in tenancies and utilization ratios, rental defaults, potential oversupply and consequential drop in future rentals. Till more clarity emerges on the timing of removal of lockdown, social distancing stipulations, how COVID-19 will impact future customer behaviour, stimulus by the Government for the real estate sector and time period for normalcy to return, we do not anticipate any significant real estate PE/VC investments in the near-to-medium term.
Financial servicesSince 2017 financial services has emerged as a key sector of interest for PE/VC investments, with investments made across all the varied business models ranging from pure play banks to specialized non-banking financial companies (NBFCs), small finance banks, online credit platforms, insurance companies, and payment solution companies. Value of PE/VC investments in the financial services sector has increased at a CAGR of 51% over the past five years while the number of deals has grown at
a CAGR of 33%. NBFC and fintech were the largest sub-sectors to receive PE/VC investments both in terms of value and volume. Going forward, in the post COVID-19 era, all forms of lending (banking, alternative), fintech and payments businesses are expected to face significant headwinds. Most PE/VC investors will be in ‘wait and watch’ mode till July as they would like to understand the impact of the Government declared moratorium (on repayments by borrowers) on the quality of the loan books, future borrower behaviour, and regulatory changes recently introduced by the GoI / the regulator. At the heart of it, financial services is a levered play on the economy, and in light of the fact that Indian real GDP growth forecasts have dropped from ~5.5% to the range of 1.5%-2.3%, the macro for financial services does not appear to be favourable. We expect the sector to undergo a lot of pain, leading to consolidation. PE/VC investors will take time to study the evolving situation before they identify and back the potential winners. Going forward, the NBFC segment will be key to the future of PE/VC investments in the sector as it has historically attracted the largest share within financial services. NBFCs offer PE/VC investors the opportunity to take control (unlike banking and insurance) and can attract large amounts of capital. Post COVID-19, certain new challenges have emerged on the liability side of NBFCs and pending clarity from the Reserve Bank of India (RBI), we expect PE/VC investors to carefully weigh the future economics of the NBFC model.
E-commerceIn 2019, the e-commerce sector aggregated US$9 billion in PE/VC investments, a 26% increase over 2018 (US$7.1 billion – reclassified total for E-commerce) mainly on the back of large investments in the fintech sector. Fintech sector recorded US$2.5 billion in investments, a growth of around 2.5 times compared to 2018.

COVID-19: projected impact on Indian PE/VC 25
Post COVID-19, virtually all segments of e-commerce are expected to face significant headwinds in the near-term other than those in the business of online sale and delivery of essential items such as grocery, online media and edtech. In the medium-term, once supply chain challenges are overcome, home delivery businesses are expected to grow in terms of customer traction. Start-ups may find it more difficult to raise future rounds of risk capital from VCs and on the whole, the entire e-commerce segment is expected to go through a consolidation phase. Only the well-funded category leaders, backed by deep pocketed GPs that are able to demonstrate improved unit economics and reducing burn rates are expected to emerge stronger from this crisis.
Top e-commerce sub-segments by value (US$ million)
Others 2871,859
27Others
Healthtech 456361
38
Travel and hospitality
Edtech 348742
536
Online logistics
46245 Online classifieds
and services
B2C e-commerce 2,249 1,395
548B2C e-commerce
Online media 255120
17Mobility
Mobility30
Healthtech
Online classifieds and services
1,2471,163
1Online media
Travel and hospitality
352326
49
77878
0Edtech
Fintech 2,528 1,043
127 13
23
9
9
1
2
4
1
4
3
Fintech
Online logistics
Top e-commerce sub-segments by number of deals
Investment activity across sub-segments in the e-commerce sector
80
49
33
31
28
25
24
18
17
33
37
51
18
18
10
21
10
11
6
27
1Q2020 2019 2018
Source: EY analysis of VCCEdge data
What sectors will attract interest from PE/VC investors in 2020?Sectoral themes that we project to be the first to find favour with PE/VC investors include defensive sectors like technology, consumer goods (packaged essentials, personal and healthcare, food processing and retail), pharmaceuticals and sub-sectors like medical supply and services, biotech, agricultural products, chemicals and certain segments of e-commerce like online sale and delivery of essential goods, financial products, edtech and online media.

COVID-19: projected impact on Indian PE/VC2626
4Expected impact on PE/VC exits, holding periods and returns
Chapter

COVID-19: projected impact on Indian PE/VC 27
BackgroundThe past three years saw robust PE/VC exit activity, with total exits exceeding US$10 billion in each of the preceding three years. In 2018, PE/VC exits exceeded US$26 billion, on the back of the Walmart-Flipkart transaction that gave a US$16 billion exit to the early investors in the e-commerce major.
Exits in 1Q2020 increased by 59% compared to 1Q2019 primarily due to the large US$1 billion offer for sale by Carlyle in the SBI Cards IPO. However, compared to 4Q2019, exits have declined by 43%.
Total PE/VC exits - quarterly trend
Total PE/VC exits - monthly trend
Source: EY analysis of VCCEdge data
1Q2018
Mar-19 Jul-19 Nov-19May-19 Sep-19 Jan-20Apr-19 Aug-19 Dec-19Jun-19 Oct-19 Feb-20 Mar-20
1Q20193Q2018 3Q20192Q2018 2Q20194Q2018 4Q2019 1Q2020
1,857
52 20,000 60
50
20
15,000
30
40
5,00010
10,000
0 01,192
36
18,016
41
3,945
36
4,755
52
2,658
42
2,420
32
3,313
42
1,895
37
3,000 20
2,00015
2,500
5
1,500
1,000
500
10
0 0389 616
1,490
376
2,649
461
1,263680 8641,019 960
329
1,105
13
9
19
10
17
12
16
119
15 1416
9
Exits
Value (US$ million) # of deals
Value (US$ million) # of deals

COVID-19: projected impact on Indian PE/VC2828
In 2020, we expect exits across deal types to be negatively affected due to varying factors and there may be a prolonged decline in exit momentum in some of the deal types as
explained below:
Open market exitsIn 2019, open market exits at US$4.6 billion accounted for 41% of the total exits. With the sharp decline in capital markets that
Open market exits - quarterly trend
Open market exits - monthly trend
Source: EY analysis of VCCEdge data
1Q2018
Mar-19 Jul-19 Nov-19May-19 Sep-19 Jan-20Apr-19 Aug-19 Dec-19Jun-19 Oct-19 Feb-20 Mar-20
1Q20193Q2018 3Q20192Q2018 2Q20194Q2018 4Q2019 1Q2020
327
20 2,500 25
20
5
1,500
2,000
10
15
500
1,000
0 0519
12
647
14
792
10
362
14
1,080
10
356
8 2,188
17
410
13
1,200 10
800
8 1,000
4
2
600
400
200
6
0 072 144
1,122
571
143
715
77 189364
878
266--
3 3
76 66
12
4
87
Value (US$ million) # of deals
Value (US$ million) # of deals
have corrected by almost 30% on a broader base with many sectors correcting by over 50%, most PIPE positions invested over the last two years are expected to be significantly in the red.
In the near-to-mid term, we think open market exits are expected to remain muted till asset prices recover materially as GPs will be loath to see value built through the years erode so quickly.

COVID-19: projected impact on Indian PE/VC 29
Secondary exits - quarterly trend
Secondary exits - monthly trend
Source: EY analysis of VCCEdge data
1Q2018
Mar-19 Jul-19 Nov-19May-19 Sep-19 Jan-20Apr-19 Aug-19 Dec-19Jun-19 Oct-19 Feb-20 Mar-20
1Q20193Q2018 3Q20192Q2018 2Q20194Q2018 4Q2019 1Q2020
437
11
3,000 16
12
14
10
6
2
1,500
2,000
2,500
4
8
500
1,000
0 0445
7
1,135
9
1,218
10
2,641
14
183
9
790
8
619
8
25
6
600 5
400
4 500
2
1
300
200
100
3
0 0
188
395
150
523
25167
300424
116
2
45 NA NA
2
4
3 3
4
33 3
44
1 1
Secondary dealsIn 2019, secondary deals at US$2.5 billion, accounted for 22.7% of all exits. With so many GPs in “wait and watch” mode, exits via sponsor-to-sponsor transactions are likely to slow
down considerably. On the sellers’ end, prevailing uncertainty and grim growth prospects are expected to compel them to not commit to an exit process that will almost certainly result in significant value erosion.
Value (US$ million) # of deals
Value (US$ million) # of deals

COVID-19: projected impact on Indian PE/VC3030
Strategic exits - quarterly trend
Strategic exits - monthly trend
Source: EY analysis of VCCEdge data
1Q2018
Mar-19 Jul-19 Nov-19May-19 Sep-19 Jan-20Apr-19 Aug-19 Dec-19Jun-19 Oct-19 Feb-20 Mar-20
1Q20193Q2018 3Q20192Q2018 2Q20194Q2018 4Q2019 1Q2020438
9
18,000 20
5
12,000
15,000
10
15
6,000
3,000
9,000
0 0186
14
16,078
15
160
9
889
14
1,115
18
1,020
12
468
13
397
13
600 10
400
8500
4
2
300
200
100
6
0 0128 77
218
40293
104
5
170
370
8
43250
575
NA NA
5
2
9
5
2
4
2 2
6
2
6
At the sellers’ end, like in the case of secondary exits, PE/VC investors are not expected to be amenable to take the huge valuation haircuts that currently prevailing circumstances may warrant. They would rather hold on to their investments for longer and work things through as opposed to committing to a process that will almost certainly result in significant value erosion.
Strategic M&AIn 2019, at US$1.9 billion, strategic M&A accounted for 17% of overall PE/VC exits. Going forward, in the near-to-medium term, at the buyers' end, we expect strategic buyers to also go slow on acquisitions given the uncertainty over growth prospects and the difficulty in performing due diligence till the lockdown and travel curbs are in place. Also, most strategic players are expected to re-evaluate their strategies and prioritize cash conservation over acquisitions even if opportunities are available at depressed valuations.
Value (US$ million) # of deals
Value (US$ million) # of deals

COVID-19: projected impact on Indian PE/VC 31
IPO exitsIn 2019, IPO exits at US$0.25 billion accounted for 2.25% of overall PE/VC exits. The volatility in the Indian capital markets in the mid-cap and small-cap space was not conducive and
Portfolio deals with secondary fundsAlthough most GPs would like to delay exits and extend their hold periods, not all will be able to do so. There will be funds that are at the tail end of their lives and have either not raised any new funds in a long time or are first time funds – these may
delayed a lot of IPOs and post the pandemic driven meltdown, more of the same can be expected over the near-to-medium term. In the current scenario, most PE/VC investors are expected to delay the IPO plans of their portfolio companies.
be contractually compelled to give an exit to their LPs. In such cases, we project an increased incidence of GP-led secondary trades involving sale of PE/VC portfolios to specialist secondary funds. Over the next 12-18 months, we expect to see a relative uptick in such trades compared to the previous years.
PE-backed IPO exits - quarterly trend
PE-backed IPO exits - monthly trend
Source: EY analysis of VCCEdge data
1Q2018
Mar-19 Jul-19 Nov-19May-19 Sep-19 Jan-20Apr-19 Aug-19 Dec-19Jun-19 Oct-19 Feb-20 Mar-20
1Q20193Q2018 3Q20192Q2018 2Q20194Q2018 4Q2019 1Q2020
205
52,000 6
4
5
3
1500
1,000
1,500
2
0 0NA
2
143
2
88
1
344
5
159
4
183
1
NA
1
1,000
1
1,000 3
600
800
2
1400
200
0 0NA NA 00 090 88 NA690 0 0
1,000
11 1
2
1 11
Value (US$ million) # of deals
Value (US$ million) # of deals

COVID-19: projected impact on Indian PE/VC3232
tail effects pan out. This is to be expected, as hold periods grew significantly post the GFC as well. In general, PE investors held on to their investments for much longer, preferring to take the extra time to create value and ride the post crisis growth wave to eventually sell at far better valuations.
GPs are likely to hold portfolio companies through the pandemic crisis and the subsequent recovery rather than sell at deeply discounted prices. Transactions in more preliminary stages are likely to be pushed out six months to a year or more, depending on the circumstances and how long the crisis and its
y Unexited capital calculated as cumulative capital called minus returned-till date.
y *Unexited capital divided by three-year trailing average investment.
Years investment unexited 2003–17*
Source: McKinsey: Indian Private Equity: Coming of Age
7.0
2017
4.6
2003
0.9
2004
1.7
2005
0.6
2006
1.6
2008
2.6
2009
3.2
2011
6.0
2012
5.2
2014
6.2
2015
5.7
2016
5.9
2010
5.0
2007
2.4
2013
5.6
5.0
6.0
4.0
2.0
3.0
1.0
0.0
Lengthening hold periods
COVID-19: projected impact on Indian PE/VC 33
explore exits in 2020, coming off the back of a steep growth curve during the period 2015-2019, which was pretty good for the Indian economy. Many funds in this phase of life start to think of raising subsequent funds, and just when they need to show healthy IRR/partial return of capital to LPs, they will be forced to extend their hold period because of the dislocation caused by the pandemic crisis. Funds of 2013 vintage and earlier will in all likelihood not have the ability to extend hold periods as they near the end of their contractual lives. These funds may be forced to return capital to LPs by secondary sale of portfolios to specialist secondary funds.
Funds of 2019-2020 vintage are probably best positioned to take advantage of this crisis given that they would be sitting on significant reserves of dry powder.
Lengthening the hold periods will punish those funds that have invested significantly in the years immediately preceding the crisis as IRR is very sensitive to early return of capital to LPs. In the aftermath of the GFC, the 2005-2007 vintages performed very poorly as GPs were forced to increase hold periods beyond what they had projected, and it took a long time for asset prices to recover.
The slowdown of exits and extension of hold periods will impact funds differently, depending on their vintage. For recent funds of 2017-2019 vintage, the impact is expected to be less detrimental as they have the ability to hold on to their positions and potentially reinvest in them.
Funds of 2014-2016 vintage will be most negatively impacted by this pandemic crisis as typically they would have started to
Deterioration in returns

COVID-19: projected impact on Indian PE/VC3434
5Anticipated impact on PE/VC fundraising
Chapter

COVID-19: projected impact on Indian PE/VC 35
Fundraising in 1Q2020, at US$1.4 billion, slowed down considerably, declining by 49% compared to last year and 62% compared to 4Q2019.
Going forward, we expect PE/VC fundraising to be under stress as many LPs may need to rebalance their asset allocations in light of the severe dislocation witnessed in public equity markets and bond markets. This could potentially impact their allocations towards alternate asset classes, of which private equity and emerging markets PE/VC is a subset of. This may exacerbate the problems faced by nascent managers, first time funds, new strategies and spin-offs, which may be in the market to raise funds without an established LP base and
proven track record. Trying to win over new LPs without having two or more successful exits maybe very tough in the current environment.
As a result, some new fund launches may slow down in the absence of LP risk appetite while many others that have been struggling to raise new funding rounds prior to the crisis could give-up and fold as LPs decide to stick to tried and tested GPs with a proven track record.
Fundraises - quarterly trend
Fundraises - monthly trend
Source: EY analysis of VCCEdge data
1Q2018
Mar-19 Jul-19 Nov-19May-19 Sep-19 Jan-20Apr-19 Aug-19 Dec-19Jun-19 Oct-19 Feb-20 Mar-20
1Q20193Q2018 3Q20192Q2018 2Q20194Q2018 4Q2019 1Q2020
1,304
11
4,000 20
10
15
5
1,600
800
2,400
3,200
0 0
2,794
14
2,607
17
2,335
12
1,701
12
2,749
15
2,479
11
3,809
15
1,430
13
1,000 3
600
800
2
1400
200
0 040 545 172
3
654
4
742
4
6821,136
3,233
9711,096
6
403
5
603
6
85
3
1
44 4
7
5
Value (US$ million) # of deals
Value (US$ million) # of deals

COVID-19: projected impact on Indian PE/VC3636
stick with GPs with established track record and experience of investing across multiple cycles and delivering returns to LPs.
In India, 272 Alternate Investment Funds (AIFs) were registered between January 2018 and end of Mach 2020. We expect many of these will face difficulty in raising capital from institutional LPs.
In the previous three years, 57 maiden funds were raised aggregating to US$6.6 billion with increasing amounts
Going forward, we expect further consolidation in the Indian PE/VC sector as LPs become more selective and decide to
each year, of which ~US$1.5 billion – US$2 billion is already deployed. This trend of fundraising by first time managers may subside for a while as LPs gravitate towards the safety of familiarity and established track records of tried and tested GP teams.
First time fundraises by new funds
Source: EY analysis of VCCEdge data
4,000 30
2018
1,625
19
2017
1,155
14
2019
3,827
24
203,000
25
2,000 15
1,00010
5
0 0
Value (US$ million) # of funds raised

COVID-19: projected impact on Indian PE/VC 37
Based on facts available at the time of going to print, we know that the Indian Government has extended the ‘lockdown’ to May 3 and has indicated its inclination to permit resumption of some economic activity under strict guidelines in ‘green’ zones. However, there is still a lot of uncertainty around: 1) the future trajectory of COVID-19 in India, 2) a fuller understanding of its ramifications on the global and Indian economy; and 3) the near-term economic trajectory of the country. While these uncertainties may continue to linger for some more time, our preliminary hypothesis is that from the 2019 peak of US$48 billion of PE/VC investments (across all asset classes including infrastructure, real estate and credit), Indian PE/VC investments in 2020 are expected to end up in the range of US$19 billion to US$26 billion; a reduction of ~45% -60% from 2019 levels.
PE/VC exits in 2020 are also expected to shrink considerably from 2019 levels. As per our initial estimates, it will be 50%-67% lower than the 2019 level of ~US$11 billion. This initial estimate is the synthesis of innumerable conversations with large GPs and LPs that account for a significant portion of the Indian PE/VC investments and the following key points:
• Deal momentum: PE/VC investments have slowed down significantly on account of COVID-19 and it will take time to build up again. Large PE/VC investments are possible only after proper due diligence, site visits, on-ground verification of facts and in-person meetings to conclude on key matters. These activities can commence only after travel restrictions and social distancing stipulations are relaxed and confidence on control over the disease emerges. 1Q2020 recorded US$5.1 billion in PE/VC investments and we estimate 2Q2020 to be in the range of US$1.5-2.0 billion. Assuming things go well, we are estimating 2H2020 to record PE/VC investments of US$12 billion to US$19 billion, or a monthly average of US$2-3 billion. The process of due diligence, negotiating and concluding a PE/VC investment is a long one and in the normal course takes 4-8 months. These are exceptional times and assuming we are able to restart momentum in May, we can hope to reach these milestones by year-end.
• Weak medium-term outlook for key sectors: Infrastructure, real estate, financial services, and e-commerce that accounted for over 70% of PE/VC investments and most of the large deals (value greater than US$100 million) in the past are expected to witness
a drag in PE/VC investments in the short-to-medium term. The sectors that we expect to find favour with PE/VC investors in 2020 are not that large, and that will, in turn, reduce the incidence of large deals and bring down average deal size (relative to 2019).
• Weightage of global funds: Over 80% of the total PE/VC investments in India during the period 2017 – 1Q2020 have been made by international funds, that include Asian and global GPs, pension funds, sovereign wealth funds and supranational agencies like Development Finance Institutions (DFIs), CDC Group, and International Finance Corporation (IFC). The capital deployed by these international GPs is sourced from regional and global funds and in most cases, is not the result of a hard allocation for India. In these uncertain times, when asset prices have been battered in both developed as well as emerging markets and currency market risk is more pronounced, we expect the debate over ‘relative value’ in investment committees of global and Asian GPs to become stronger. Sovereign wealth funds from the oil-dependent Middle East region may face pressure at home on account of the sharp dip in crude oil prices. Asian sovereign wealth funds may face pressure to revisit alternate asset allocations in emerging markets if increased intervention in their home markets is required. Pension funds are a large source of direct investments by LPs in India and they have their own pressures. Their investment activity in 2020 will be influenced by a wide variety of factors and given the significant correction in their listed equities and fixed income portfolios, they may take some time to assess their liquidity positions, existing commitments and accordingly calibrate their asset allocation towards direct private capital investments in India.
• Exits are expected to soften significantly, as GPs will most likely increase their hold periods and work through the crisis to sell in better times as opposed to eroding value by selling at significantly discounted valuations.
Over the next two quarters, we expect more clarity to emerge on the spread/control of the epidemic, removal of restrictions, revival of demand and supply chains and government response by way of fiscal and policy stimulus. As our estimates are highly sensitive to the above, we will continue to monitor the situation and if required, recalibrate our outlook periodically.
ConclusionConclusion
Vivek Soni
National Leader – Private Equity Services, EY India
Amit Khandelwal
Managing Partner - Transaction Advisory Services, EY India
Authors

COVID-19: projected impact on Indian PE/VC3838
AppendicesAbout EY’s Private Equity Services
COVID-19: projected impact on Indian PE/VC 39
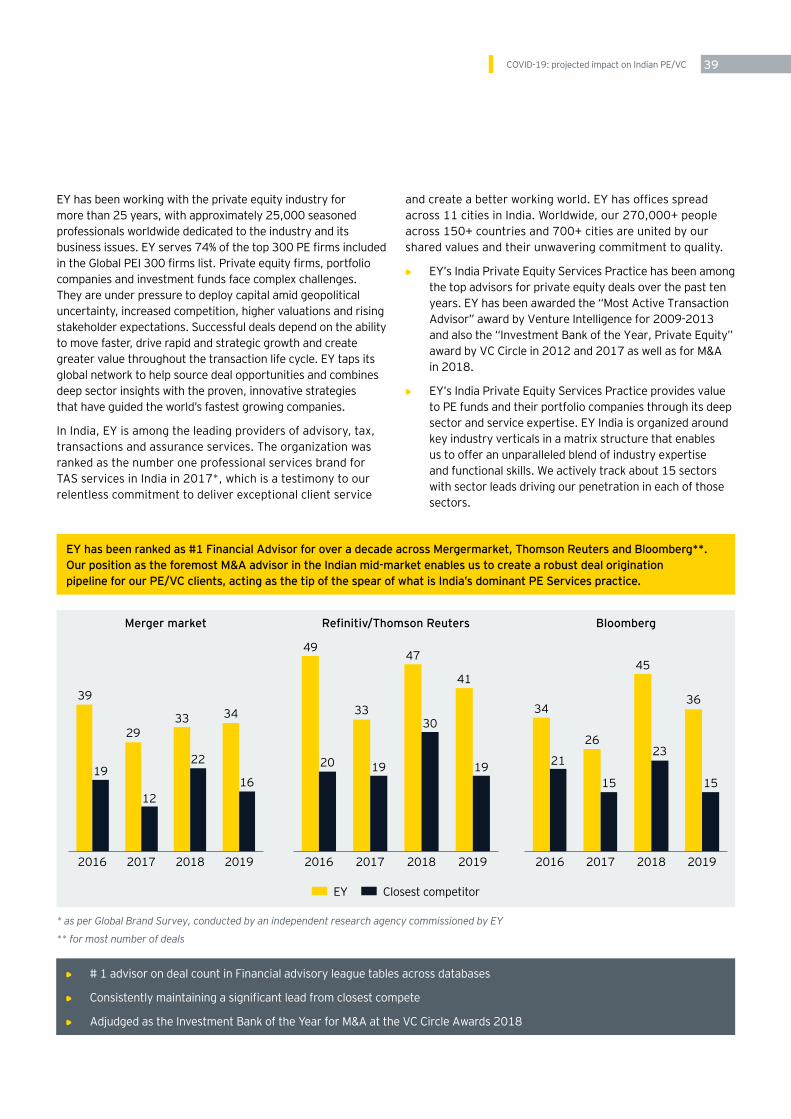
EY has been working with the private equity industry for more than 25 years, with approximately 25,000 seasoned professionals worldwide dedicated to the industry and its business issues. EY serves 74% of the top 300 PE firms included in the Global PEI 300 firms list. Private equity firms, portfolio companies and investment funds face complex challenges. They are under pressure to deploy capital amid geopolitical uncertainty, increased competition, higher valuations and rising stakeholder expectations. Successful deals depend on the ability to move faster, drive rapid and strategic growth and create greater value throughout the transaction life cycle. EY taps its global network to help source deal opportunities and combines deep sector insights with the proven, innovative strategies that have guided the world’s fastest growing companies.
In India, EY is among the leading providers of advisory, tax, transactions and assurance services. The organization was ranked as the number one professional services brand for TAS services in India in 2017*, which is a testimony to our relentless commitment to deliver exceptional client service
Merger market Refinitiv/Thomson Reuters Bloomberg
and create a better working world. EY has offices spread across 11 cities in India. Worldwide, our 270,000+ people across 150+ countries and 700+ cities are united by our shared values and their unwavering commitment to quality.
• • EY’s India Private Equity Services Practice has been among the top advisors for private equity deals over the past ten years. EY has been awarded the “Most Active Transaction Advisor” award by Venture Intelligence for 2009-2013 and also the “Investment Bank of the Year, Private Equity” award by VC Circle in 2012 and 2017 as well as for M&A in 2018.
• • EY’s India Private Equity Services Practice provides value to PE funds and their portfolio companies through its deep sector and service expertise. EY India is organized around key industry verticals in a matrix structure that enables us to offer an unparalleled blend of industry expertise and functional skills. We actively track about 15 sectors with sector leads driving our penetration in each of those sectors.
EY has been ranked as #1 Financial Advisor for over a decade across Mergermarket, Thomson Reuters and Bloomberg**. Our position as the foremost M&A advisor in the Indian mid-market enables us to create a robust deal origination pipeline for our PE/VC clients, acting as the tip of the spear of what is India’s dominant PE Services practice.
* as per Global Brand Survey, conducted by an independent research agency commissioned by EY
** for most number of deals
2016
39
19
2933 34
12
22
16
49
33
47
41
20 19
30
19
34
21
26
15
45
23
36
15
2016 20162017 2017 20172018 2018 20182019 2019 2019
Closest competitorEY
• • # 1 advisor on deal count in Financial advisory league tables across databases
• • Consistently maintaining a significant lead from closest compete
• • Adjudged as the Investment Bank of the Year for M&A at the VC Circle Awards 2018

COVID-19: projected impact on Indian PE/VC4040
We offer an array of services to Private Equity funds and their portfolio/investee companies through our various service lines.
Partners (Personal tax)
Fundraising (Marketing collateral, fund structuring, audit of fund performance)
Funds
Transaction Advisory Services
Portfolio Services
Fund assurance and Management (Fund and fund management company audit, portfolio valuation, controls and process design and review, tax and regulatory compliance)
Buy and sell side advisory (M&A, capital markets support, tax structuring, regulatory compliance, SPA advisory, integrated sell side advisory – building equity story, vendor due diligence (VDD), structuring, marketing)
Buyside support (Due diligence – financial, tax, business and commercial, forensics and background, HR, IT and environmental; modelling and valuations)
Transition (Project management office (PMO), 100 day plans, transaction integration, GAAP conversion, governance, controls assessment, MIS development, process advisory, standard operating procedures, CFO services, compliance manager)
Exit readiness (IPO, GAAP conversion, VDD, value creation, investor relations, exit preparation, sale mandates, exit structuring)
Distressed (Debt syndication, bank intermediation, restructuring, working capital management, cost reduction, insolvency and bankruptcy advisory)
Assurance (Statutory audit, tax compliance, risk management, corporate governance advisory, internal audits and fraud reviews)
Tax and Legal (Tax advisory, tax accounting, ESOP advisory, global mobility, transfer pricing and operating model effectiveness, tax policy and litigation, regulatory compliance)
Growth (Strategic options, technology security, IT strategy, operational improvement, supply chain management (SCM), market entry options & working capital management)

COVID-19: projected impact on Indian PE/VC 41
Delivering issue-based solutions to the entire PE enterprise
EY has established six distinct solutions reflecting the holistic set of challenges that PE firms face across all levels of the organization – the management company, the funds, and their portfolio companies.
Operating model and automation
Integrated due diligence
Alternative asset managers need to drive efficiency through multi-year target operating models and infrastructure strategies to remain competitive. These align with strategic growth plans by leveraging vendor and service provider activities. EY defines and monitors data analytics and key performance indicators to annually assess data governance and risk against these target models.
Private equity firms conduct diligence on assets across strategic, financial, tax, operational and HR issues. Firms historically used issue-based advisors, managing different parties and consolidating findings at the end of the process. Employing EY’s integrated diligence approach at the early stages of a transaction provides more effective, comprehensive diligence on an asset, giving firms a distinct competitive advantage.
Large asset managers have hundreds of non-US legal entities in multiple countries, and continually create new ones – all with different compliance obligations. Many are outsourced and require local knowledge. EY gathers the data, leverages local EY teams familiar with accounting and tax laws, performs data analytics to identify trends, risks and opportunities and monitors filing requirements.
Private equity firms face increasing pressure to attract fresh capital. This requires generating greater investment returns and demonstrating a consistent track record in creating value in their portfolio. EY’s value creation solution addresses these challenges across all five stages of the deal life cycle, including deal origination, diligence, inception, optimization and exit strategy.
The intense competition for a limited number of deals raises stakes to win for private equity firms. A proprietary investment approach, driven by sector insights, enables firms to confidently place winning bids that generate appropriate returns. EY’s global origination team turns opportunities into actionable strategies. Our proprietary knowledge and advanced analytics help develop strategic capital options to help firms achieve success.
Private equity firms must plan exits rigorously in order to successfully monetize their investment during the exit process in today’s challenging environment. Executives must identify key short- and long-term priorities prior to undertaking an IPO or alternative transaction. EY can advise deal teams and portfolio companies on exit alternatives, assess exit readiness, prepare a business for exit/IPO and create a value story for targeted buyers.
Global compliance and reporting
Value creation
Deal origination
Exit readiness and IPO
COVID-19: projected impact on Indian PE/VC4242
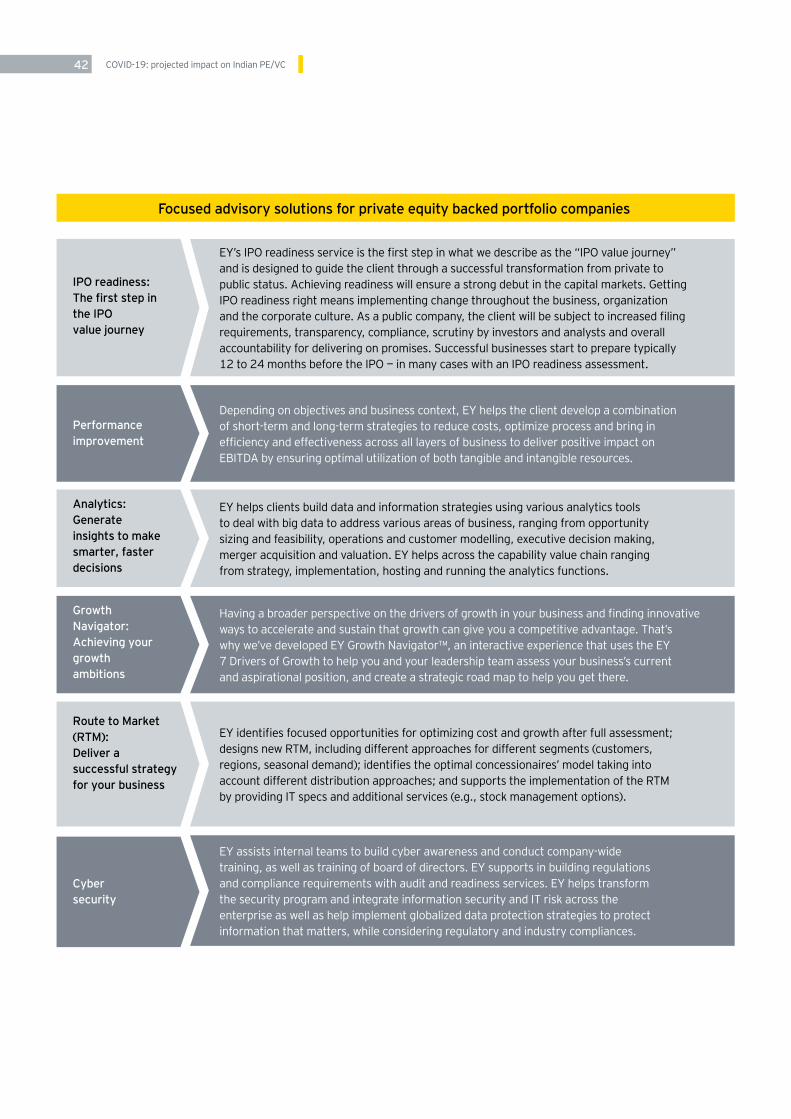
Focused advisory solutions for private equity backed portfolio companies
IPO readiness: The first step in the IPO value journey
EY’s IPO readiness service is the first step in what we describe as the “IPO value journey” and is designed to guide the client through a successful transformation from private to public status. Achieving readiness will ensure a strong debut in the capital markets. Getting IPO readiness right means implementing change throughout the business, organization and the corporate culture. As a public company, the client will be subject to increased filing requirements, transparency, compliance, scrutiny by investors and analysts and overall accountability for delivering on promises. Successful businesses start to prepare typically 12 to 24 months before the IPO — in many cases with an IPO readiness assessment.
Analytics: Generate insights to make smarter, faster decisions
EY helps clients build data and information strategies using various analytics tools to deal with big data to address various areas of business, ranging from opportunity sizing and feasibility, operations and customer modelling, executive decision making, merger acquisition and valuation. EY helps across the capability value chain ranging from strategy, implementation, hosting and running the analytics functions.
Route to Market (RTM): Deliver a successful strategy for your business
EY identifies focused opportunities for optimizing cost and growth after full assessment; designs new RTM, including different approaches for different segments (customers, regions, seasonal demand); identifies the optimal concessionaires’ model taking into account different distribution approaches; and supports the implementation of the RTM by providing IT specs and additional services (e.g., stock management options).
Performance improvement
Depending on objectives and business context, EY helps the client develop a combination of short-term and long-term strategies to reduce costs, optimize process and bring in efficiency and effectiveness across all layers of business to deliver positive impact on EBITDA by ensuring optimal utilization of both tangible and intangible resources.
Growth Navigator: Achieving your growth ambitions
Having a broader perspective on the drivers of growth in your business and finding innovative ways to accelerate and sustain that growth can give you a competitive advantage. That’s why we’ve developed EY Growth Navigator™, an interactive experience that uses the EY 7 Drivers of Growth to help you and your leadership team assess your business’s current and aspirational position, and create a strategic road map to help you get there.
Cyber security
EY assists internal teams to build cyber awareness and conduct company-wide training, as well as training of board of directors. EY supports in building regulations and compliance requirements with audit and readiness services. EY helps transform the security program and integrate information security and IT risk across the enterprise as well as help implement globalized data protection strategies to protect information that matters, while considering regulatory and industry compliances.

COVID-19: projected impact on Indian PE/VC 43
Ahmedabad22nd Floor, B Wing, Privilon,Ambli BRT Road, Behind Iskcon Temple, Off SG Highway, Ahmedabad - 380 015Tel: + 91 79 6608 3800
Bengaluru6th, 12th & 13th floor“UB City”, Canberra BlockNo.24 Vittal Mallya RoadBengaluru - 560 001Tel: + 91 80 6727 5000 Ground Floor, ‘A’ wingDivyasree Chambers # 11, O’Shaughnessy RoadLangford Gardens Bengaluru - 560 025Tel: + 91 80 6727 5000
Chandigarh1st Floor, SCO: 166-167Sector 9-C, Madhya MargChandigarh - 160 009Tel: + 91 172 331 7800
ChennaiTidel Park, 6th & 7th Floor A Block, No.4, Rajiv Gandhi Salai Taramani, Chennai - 600 113Tel: + 91 44 6654 8100
Delhi NCRGolf View Corporate Tower BSector 42, Sector RoadGurgaon - 122 002Tel: + 91 124 443 4000
3rd & 6th Floor, Worldmark-1IGI Airport Hospitality DistrictAerocity, New Delhi - 110 037Tel: + 91 11 4731 8000
4th & 5th Floor, Plot No 2B Tower 2, Sector 126 NOIDA - 201 304 Gautam Budh Nagar, U.P.Tel: + 91 120 671 7000
HyderabadOval Office, 18, iLabs CentreHitech City, MadhapurHyderabad - 500 081Tel: + 91 40 6736 2000
Jamshedpur1st Floor, Shantiniketan Building Holding No. 1, SB Shop Area Bistupur, Jamshedpur – 831 001Tel: + 91 657 663 1000
Kochi9th Floor, ABAD NucleusNH-49, Maradu POKochi - 682 304Tel: + 91 484 433 4000
Kolkata22 Camac Street3rd Floor, Block ‘C’Kolkata - 700 016Tel: + 91 33 6615 3400
Mumbai14th Floor, The Ruby29 Senapati Bapat MargDadar (W), Mumbai - 400 028Tel: + 91 22 6192 0000
5th Floor, Block B-2Nirlon Knowledge ParkOff. Western Express HighwayGoregaon (E)Mumbai - 400 063Tel: + 91 22 6192 0000
PuneC-401, 4th floor Panchshil Tech ParkYerwada (Near Don Bosco School)Pune - 411 006Tel: + 91 20 4912 6000
Our
officesContactsPrivate Equity Services Practice
Vivek Soni Partner and National Leader E: [email protected]
Rajan Satija Director E: [email protected]
Narendra Rohira Partner, Transaction Tax E: [email protected]
Nachiket Deo Partner, Transaction Tax E: [email protected]
Subramaniam Krishnan Partner, Tax & Regulatory Services E: [email protected]
Tejas Desai Partner, Tax & Regulatory Services E: [email protected] Transaction Advisory Services
Amit Khandelwal Managing Partner E: [email protected]
Ajay Arora Partner and National Leader - Investment Banking Advisory E: [email protected] Research and Insights
Allwyn D’Souza Senior Manager E: [email protected] Brand, Marketing and Communications
Pooja Bhalla Mathur Vice President E: [email protected]
Rohila Dhiman Assistant Manager E: [email protected]
Arif Jamaal Assistant Manager E: [email protected]

COVID-19: projected impact on Indian PE/VC4444
ey.com/in
EY India@EY_India EY|LinkedIn EY India careers ey_indiacareers
About EY
EY is a global leader in assurance, tax, transaction and advisory services. The insights and quality services we deliver help build trust and confidence in the capital markets and in economies the world over. We develop outstanding leaders who team to deliver on our promises to all of our stakeholders. In so doing, we play a critical role in building a better working world for our people, for our clients and for our communities.
EY refers to the global organization, and may refer to one or more, of the member firms of Ernst & Young Global Limited, each of which is a separate legal entity. Ernst & Young Global Limited, a UK company limited by guarantee, does not provide services to clients. For more information about our organization, please visit ey.com.
Ernst & Young LLP is one of the Indian client serving member firms of EYGM Limited. For more information about our organization, please visit www.ey.com/in.
Ernst & Young LLP is a Limited Liability Partnership, registered under the Limited Liability Partnership Act, 2008 in India, having its registered office at 22 Camac Street, 3rd Floor, Block C, Kolkata – 700016
© 2020 Ernst & Young LLP. Published in India. All Rights Reserved.
EYIN2004-040ED None
This publication contains information in summary form and is therefore intended for general guidance only. It is not intended to be a substitute for detailed research or the exercise of professional judgment. Neither EYGM Limited nor any other member of the global Ernst & Young organization can accept any responsibility for loss occasioned to any person acting or refraining from action as a result of any material in this publication. On any specific matter, reference should be made to the appropriate advisor.
AJ
Ernst & Young LLPEY | Assurance | Tax | Transactions | Advisory


