54
COVID Scenarios for Treasury Risks: Integrating ALM & Liquidity Behavioural Models September, 2020
COVID Scenarios for Treasury Risks:
Integrating ALM & Liquidity Behavioural
Models
September, 2020

2
Introduction & Speakers
Olga Loiseau-Aslanidi, PhD
Head of Business Analytics, APAC
Karen Moss
BSM/ALM Senior Practitioner
Juan Licari, PhD
Managing Director
Risk & Finance Solutions and Economics & Business Analytics
Petr Zemcik, PhD
Senior Director

3
1. Economic and Interest Rate Outlook for the U.K.
2. Analytical Framework: Scenarios and Behavioral Models
3. Balance Sheet Impacts: The Pandemic and Beyond
Agenda

1 Economic and Interest Rate
Outlook for the U.K.

5
Global Real GDP, Trillions 2012$
Global Economy Struggles To Gain Traction
76
78
80
82
84
86
88
90
Jan 19 Apr Jul Oct Jan 20 Apr Jul Oct Jan 21 Apr Jul Oct
Sources: Government sources, Moody’s Analytics
Recessio
n
Re
-op
en
ing
s
Post-Pandemic
Recovery
Pandemic-
Recovery

6
Sources: Good Judgment Project, Moody’s Analytics
When Will There Be an Effective VaccineProbability, timeframe for 25 million inoculations in the U.S. (8/20)
0
10
20
30
40
50
60
70
80
90
100
4/24 5/15 6/5 6/26 7/17 8/7
After Apr 1 2022Oct 1 2021-Mar 31 2022Apr 1 2021-Sep 30 2021Oct 1 2020-Mar 31 2021Before Oct 1 2020
7
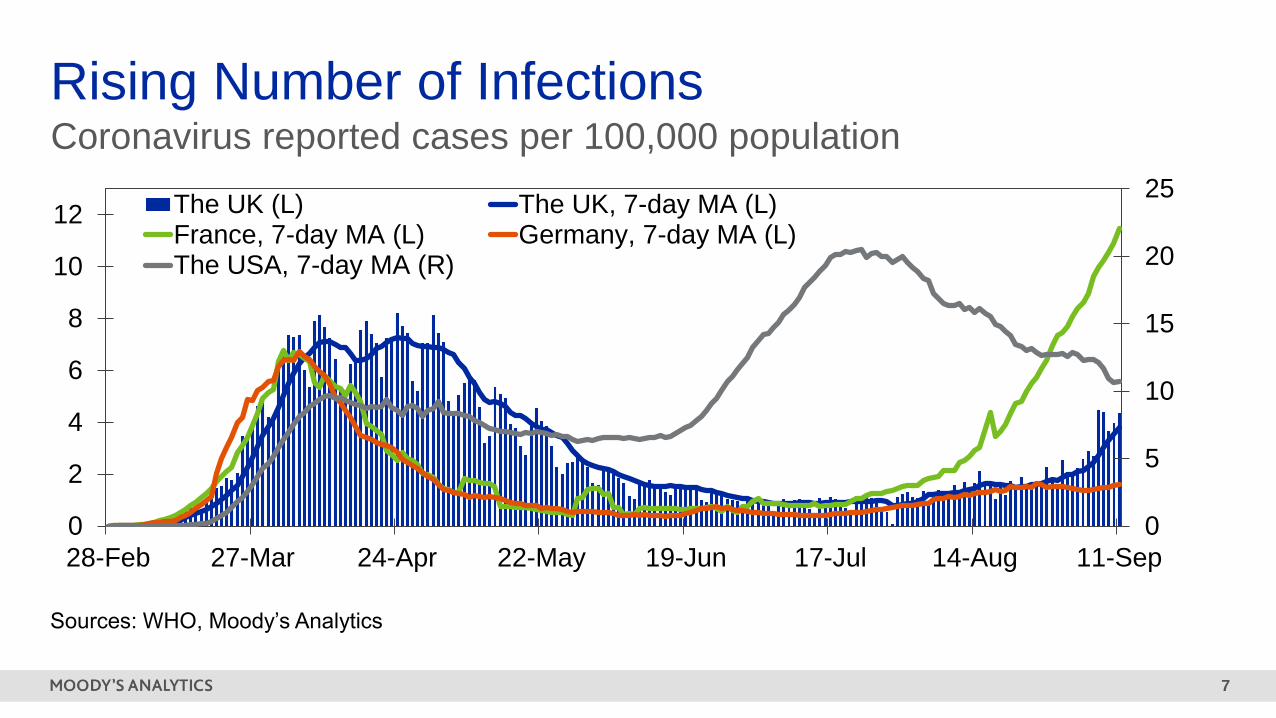
Rising Number of InfectionsCoronavirus reported cases per 100,000 population
0
5
10
15
20
25
0
2
4
6
8
10
12
28-Feb 27-Mar 24-Apr 22-May 19-Jun 17-Jul 14-Aug 11-Sep
The UK (L) The UK, 7-day MA (L)France, 7-day MA (L) Germany, 7-day MA (L)The USA, 7-day MA (R)
Sources: WHO, Moody’s Analytics

8
Brazil
Canada Chile
Denmark
Finland
Germany
Great Britan
Peru
Poland Russia
Sweden
Switzerland
USA
y = 0.0005x + 0.2954R² = 0.6212
0
2
4
6
8
10
12
0 2,000 4,000 6,000 8,000 10,000 12,000 14,000 16,000
Sources: WHO, Government sources, Moody’s Analytics
Cha
ng
e in u
ne
mp
loym
en
t ra
te, Ju
ne
/Ju
ly 2
02
0 v
s.
20
19
Q4
More Infections…Weaker EconomyConfirmed infections vs. change in unemployment
Infections per million inhabitants
Malaysia
Hungary
South Korea
JapanNetherlands
Israel

9
Output Declines Dramatically in Q2Deviation from normal level of activity, ppts, by industry
Sources: Moody’s Analytics calculated
-28
-23
-18
-13
-8
-3
2
Mar Apr May Jun Jul Aug Sep-Dec
Arts Accom. Transp. Wholesale Manufact. Real Est. EnergyConstr. Educ. Finance Public admin. Prof. Other service Water SupplyAgric. Admin. Households ICT Mining Health Total

10
Global Economic Body BlowReal GDP growth, % change, baseline scenario
2020Q1 2020Q2 2020Q3 2020Q4 2019 2020
United StatesFebruaryMay
0.3-1.2
0.5-9.4
0.53.8
0.40.2
2.32.3
1.7-5.7
September -1.3 -9.1 6.1 0.7 2.2 -4.3
Euro ZoneFebruaryMay
0.4-3.8
0.4-12.4
0.412.7
0.40.5
1.21.2
1.3-7.0
September -3.7 -12.3 9.8 1.0 1.2 -8.0
UKFebruaryMay
0.3-2.3
0.3-14.2
0.310.9
0.32.2
1.31.4
1-7.4
September -2.2 -20.4 17.3 1.8 1.4 -9.8
ItalyFebruaryMay
0.2-4.8
0.2-16.4
0.218.0
0.21.7
0.20.3
0.4-9.0
September -5.5 -12.8 11.6 1.8 -0.3 -9.5
SpainFebruaryMay
0.4-3.4
0.4-15.7
0.518.4
0.50.4
2.02.0
1.8-6.7
September -5.2 -18.5 13.7 2.6 2.0 -12.0
IrelandFebruaryMaySeptember
2.1-2
1.2-15.9
0.511.8
-0.31.2
5.65.5
4.0-6.5
1.17 -19.87 11.56 -0.11 5.54 -7.26
Global OutputFebruaryMaySeptember
0.4-3.1
0.9-6.7
0.85.2
0.71.6
2.52.4
2.4-4.5
-2.93 -7.58 6.10 1.94 2.38 -4.63

11
Unemployment IncreasesShift of baseline scenarios
0.0
5.0
10.0
15.0
20.0
25.0
Germany UnitedKingdom
France Greece Spain Italy Netherlands Portugal RussianFederation
Poland UnitedStates
Unemployment in 2019Q4Max of 2020-22 Unemployment (Feb)Max of 2020-22 Unemployment (Sep)
CountryUnemployment
in 2019Q4
Max of 2020-22
Unemployment (Feb)
Max of 2020-22
Unemployment (Sep)
Value Date Value Date
Germany 5.00 5.36 2022Q4 6.25 2020Q4
United Kingdom 3.80 4.64 2022Q4 8.38 2021Q1
France 8.10 8.51 2020Q1 10.59 2021Q1
Greece 16.53 16.34 2020Q1 19.83 2020Q4
Spain 13.81 14.06 2020Q2 19.61 2020Q3
Italy 9.57 10.52 2022Q4 12.79 2022Q2
Netherlands 3.40 4.48 2021Q3 6.66 2021Q3
Portugal 6.62 6.29 2020Q1 9.45 2020Q4
Russian Federation 4.58 5.78 2021Q1 6.45 2020Q3
Poland 2.85 3.91 2022Q4 6.34 2021Q3
United States 3.53 4.37 2022Q2 13.03 2020Q2
Source: Moody’s Analytics

12
Policy Response
Country Fiscal policy Monetary policy
United
Kingdom
Coronavirus Job Retention Scheme & Self-employment Income Support Scheme
State-backed loans £330bn
£7bn to support the self-employed, businesses and vulnerable people; £5bn
emergency response fund to help the National Health Service (NHS) and other
public services; £18 billion of “fiscal loosening” to support the economy this year
Deferring VAT and Income Tax payments; Statutory Sick Pay relief package for
small and medium sized businesses (SMEs);
12-month business rates holiday for all retail, hospitality, leisure and nursery
businesses in England; Small business grant funding of £10,000 for all business in
receipt of small business rate relief or rural rate relief; The Coronavirus Business
Interruption Loan Scheme offering loans of up to £5 million for SMEs through the
British Business Bank
June - Increase capital spending to 3% of GDP, speed up £5 billion of repairs on
roads, schools, hospitals.
June – additional £50 borrowing plans (2.5% of GDP)
BoE:
Monetary policy rate at 0.1%
Reduced capital (banks shall not pay dividends in 2020) –
release lending up to £190 billion
Covid Corporate Financing Facility will provide a quick and
cost-effective way to raise working capital for those large firms
who need it
Quantitative Easing (March 2020) – the target holding of
government bonds is £645 billion
QE (June) – expand by £100 billion
Baseline Assumptions
» The catalysts are the COVID-19 crisis, turmoil in equity markets, and the plunge in global oil prices
» In June and May, the decline is driven almost entirely by the government’s lockdown measures in a bid to contain the
virus, with the tourism and entertainment sectors taking the hardest hit.
» The lockdown is lifted by summer and the supply side of the economy starts to recover
» Real estate sector will produce 20% less output in the second quarter of 2020 compared to the period prior to the crisis.
» The U.K. economy should rebound in 2021 following the resolution of the coronavirus crisis and signing of the trade deal

13
Regional Shocks to Unemployment Rate (NUTS3)UK regions: level 2019 vs. 2020 (baseline forecast)
2019Q4 Historical value <= 3%
3% to 5%
>= 5%
2020Q4 Forecasted value (Baseline Scenario)
4% to 7%
7% to 9%
9% to 11%

14
-0.5
0.0
0.5
1.0
1.5
2.0
2.5
3.0
3.5
15Q1 15Q3 16Q1 16Q3 17Q1 17Q3 18Q1 18Q3 19Q1 19Q3 20Q1 20Q3 21Q1 21Q3
Inte
rest
rate
s a
nd
CP
I
BoE policy rate10Y Bond yield3 Months LIBORCPI (y/y %)
Key interest rates and Inflation
UK Interest Rates Remain Low
Sources: BoE, ONS, Moody’s Analytics
15
-0.20
-0.15
-0.10
-0.05
0.00
0.05
0.10
0.15
-1.0
-0.5
0.0
0.5
1.0
1.5
2.0
2.5
3.0
Jan-20 Feb-20 Mar-20 Apr-20 May-20 Jun-20 Jul-20 Aug-20
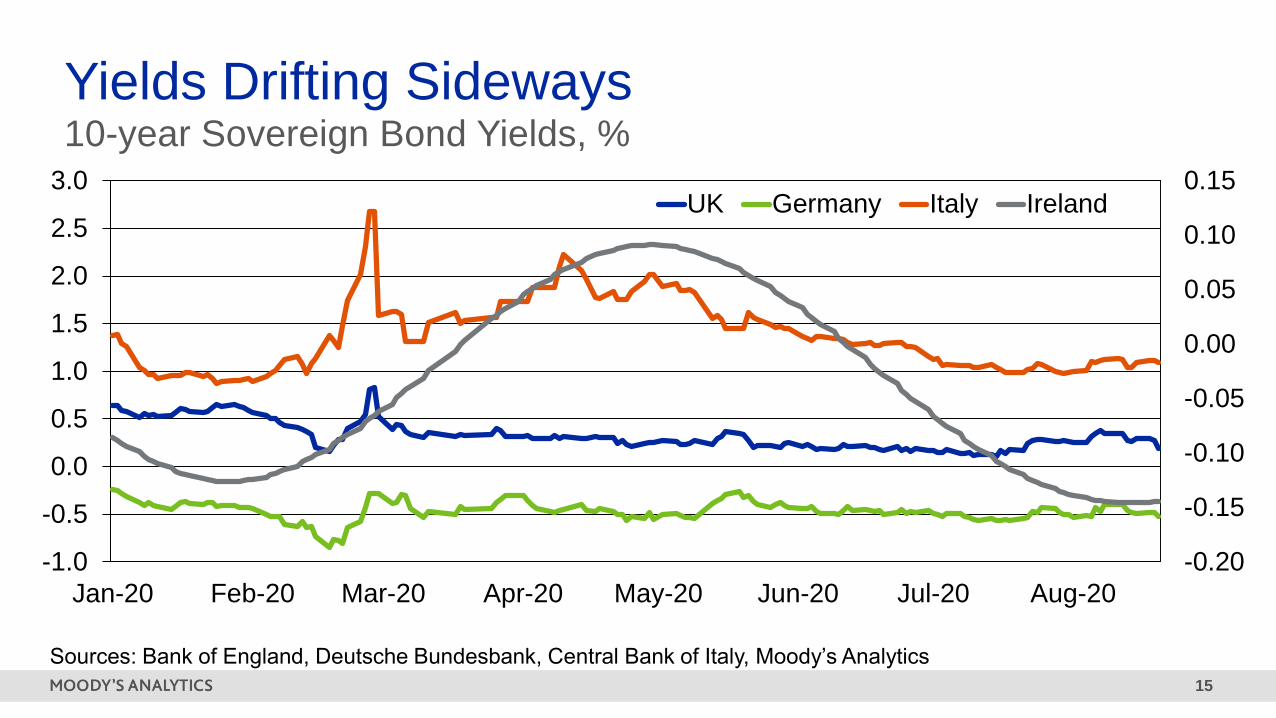
UK Germany Italy Ireland
Sources: Bank of England, Deutsche Bundesbank, Central Bank of Italy, Moody’s Analytics
Yields Drifting Sideways10-year Sovereign Bond Yields, %

16
Spread: Libor – Policy Rate
Sources: Central banks, Moody’s Analytics
-0.5
0.0
0.5
1.0
1.5
2.0
2007Q1 2012Q1 2017Q1 2022Q1
Spread 3m Libor -policy rate
Spread 6m Libor -policy rate
Spread 12m Libor -policy rate
Spreads, % Level, %
0.0
1.0
2.0
3.0
4.0
5.0
6.0
7.0
2007Q1 2012Q1 2017Q1 2022Q1
3M Libor 6M Libor 12M Libor
Key drivers of the spread of 12M Libor from the policy rate are the
following factors:
• Spread of the US 12M Libor from the Fed policy rate
• Spread of the UK 3M Libor from the BoE policy rate
• As the spread is increasing in the USA Libor, the spread in the UK
Libor will be increasing too
17
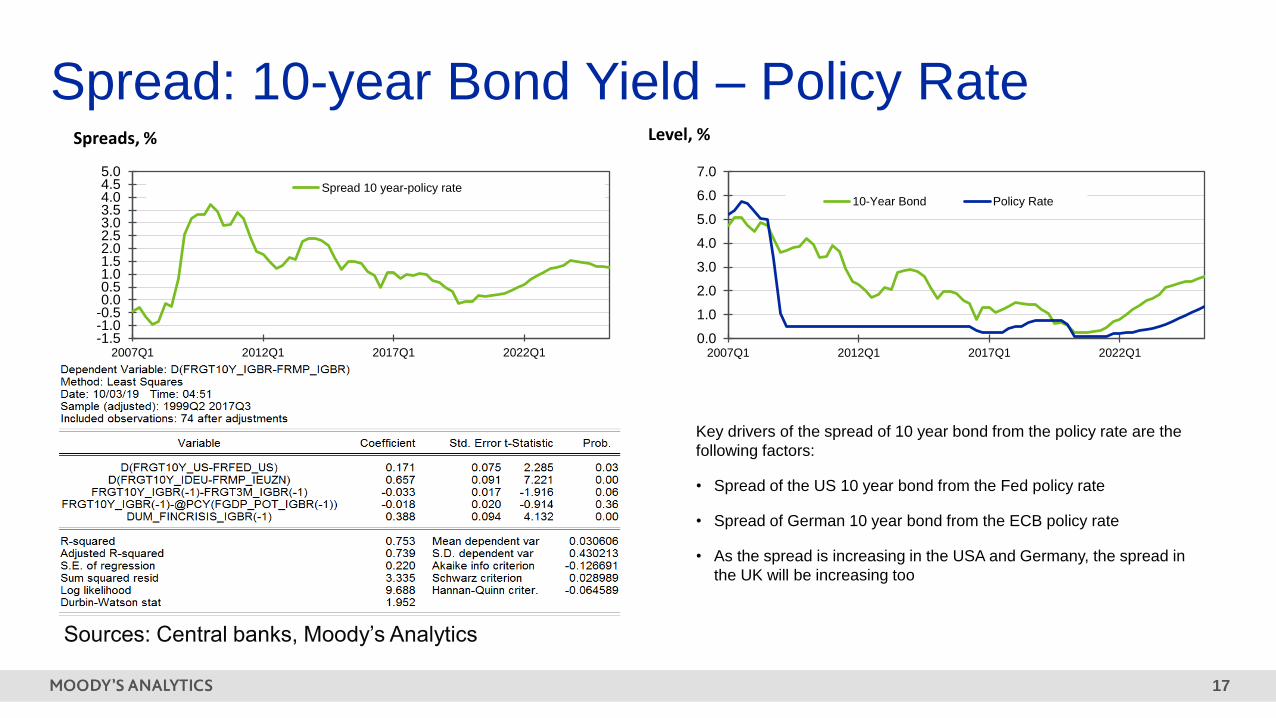
Spread: 10-year Bond Yield – Policy Rate
Sources: Central banks, Moody’s Analytics
-1.5-1.0-0.50.00.51.01.52.02.53.03.54.04.55.0
2007Q1 2012Q1 2017Q1 2022Q1
Spread 10 year-policy rate
Spreads, % Level, %
0.0
1.0
2.0
3.0
4.0
5.0
6.0
7.0
2007Q1 2012Q1 2017Q1 2022Q1
10-Year Bond Policy Rate
Key drivers of the spread of 10 year bond from the policy rate are the
following factors:
• Spread of the US 10 year bond from the Fed policy rate
• Spread of German 10 year bond from the ECB policy rate
• As the spread is increasing in the USA and Germany, the spread in
the UK will be increasing too

18
Risks: Epidemiological U.K. Assumptions
COVID-19: Upside
S1 Scenario
» 450K confirmed infections
» 4,5mil total cases
» 63K total deaths
» Infections abate by Feb 2021
COVID-19
Baseline Forecast
» 500K confirmed infections
» 5mil total cases
» 75K total deaths
» Infections abate by May 21
COVID-19: Downside
S3 Scenario
» 660K confirmed infections
» 5.7mil total cases
» 138K total deaths
» Infections abate by Oct 2021

19
Severity, avg. deviations from baseline, %
BL AugustS4 August S3 August BL Feb
S4 Feb S3 Feb
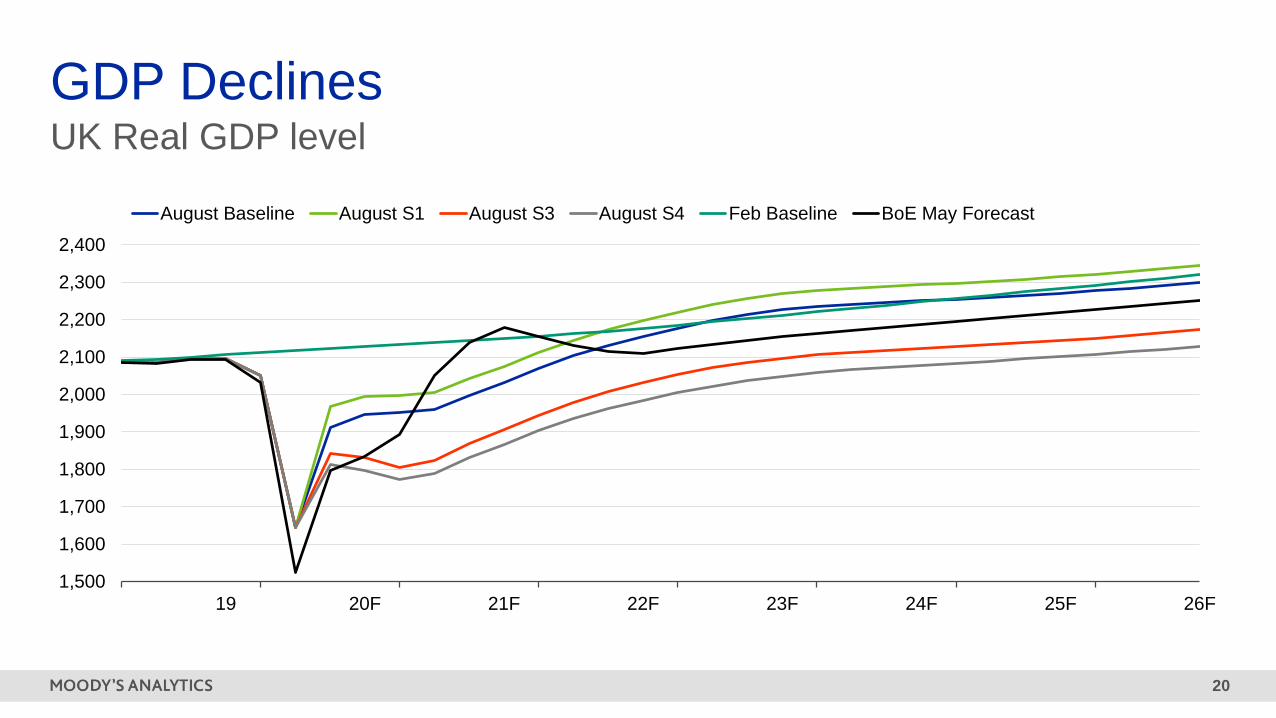
20
UK Real GDP level
GDP Declines
1,500
1,600
1,700
1,800
1,900
2,000
2,100
2,200
2,300
2,400
19 20F 21F 22F 23F 24F 25F 26F
August Baseline August S1 August S3 August S4 Feb Baseline BoE May Forecast

21
Unemployment rate
Unemployment Rises
2.0
3.0
4.0
5.0
6.0
7.0
8.0
9.0
10.0
11.0
12.0
18 19 20F 21F 22F 23F 24F 25F 26F 27F 28F 29F 30F 31F 32F 33F 34F
August Baseline August S1 August S3 August S4 Feb Baseline

22
House Prices DecreaseHouse price growth, % change yr ago
-25
-20
-15
-10
-5
0
5
10
15
19 20F 21F 22F 23F 24F 25F 26F
August Baseline August S1 August S3 August S4 Feb Baseline

23
0.0
0.5
1.0
1.5
2.0
2.5
3.0
3.5
19 20F 21F 22F 23F 24F 25F 26F 27F 28F 29F 30F 31F 32F 33F 34F 35F
August Baseline August S1 August S3 August S4 Feb Baseline
3-months Libor level
3-months LIBOR

24
Swap Rates: UK Pound Sterling Interest Rate Swap, Month average,
(% p.a., NSA)
Impact on the Yield Curve
-0.5
0.0
0.5
1.0
1.5
2.0
1Y 5Y 10Y 25Y
Sep 2020
Baseline Stress
-0.5
0.0
0.5
1.0
1.5
2.0
1Y 5Y 10Y 25Y
Sep 2023
Baseline Stress
-1
0
1
2
3
4
5
2010 2013 2016 2019 2022 2025
1Y 5Y 10YS3: Donwside
Sources: Refinitiv; Moody's Analytics Calculated and Forecasted
-1
0
1
2
3
4
5
2010 2013 2016 2019 2022 2025
1Y 5Y 10YBaseline

2Analytical Framework:
Scenarios and Behavioral
Models

26
Analytics: Behavioral Models and ScenariosSatisfy regulation and make results more credible for IRRBB
∆ Net Interest
Income
∆ Economic
Value of Equity
Am
en
ab
le
Fixed rate
instrument
Floating rate
instruments
No
t a
me
na
ble Non-maturing
instruments
Prepayment,
drawdown and
redemption
Le
ss
am
en
ab
le Automatic interest
rate options
Embedded
Automatic Interest
Rate Option
Behavioral
Models
Add-on
for
options
Inte
rest
rate
sen
sit
ive
Projection
of cash
flows
Shock
scenarios

27
Challenges of Behaviour Models and ScenariosFor interest rate risk in the banking book, liquidity and credit metrics
Data Availability
Granularity, frequency, consistency,
completeness, and quality
Limitations can put constraints on the
type of modeling techniques
Macroeconomic scenarios historical
data and forecast.
Framework Integrity
Single view of risk across the bank
Enforce consistency of results by
establishing and common modeling
framework
Model governance, re-calibration
updates, monitoring, use test
Model Design
Building robust models using
relevant quantitative methods
Finding appropriate model
specification using variable
search algorithms
Detailed documentation and
knowledge transfer
Model Implementation
Implementation into key interest
rate risk and liquidity metric
calculations
Implementation into credit risk
metric calculation
Ensuring continuity through detailed
user manuals

28
Approach to Link Scenarios with ModelsCritical for forward-looking planning
• Baseline scenario forecast
• Alternative stress scenarios
• Alternative upside scenarios
• Event-driven scenarios
• Regulatory stress testing scenarios
Macroeconomic Indicators
• Interest rate term structure
• Customer behavior
• Liquidity risk
• Credit risk and provisioning for regulatory capital, IFRS9
• Early warning indicators
Risk Models
• Liquidity risk gaps, survival period
• Interest risk gaps
• Net interest income
• Economic value of equity
• Balance sheet, P&L, RWA projections
• Expected credit loss
• Internal and regulatory capital requirement
Key Measures

2.1 Scenario Generation for
Behavioural Factors

30
Achieving an Integrated Balance Sheet ViewCross-discipline scenario alignment
IRRBB
Standardized shock
scenarios
Bank’s risk profile
ICAAP
Historical worst and IR
stress scenarios
ICAAP
Stress scenarios based
on Bank’s Pillar 1 &
Pillar II risks
IFRS 9
Typically 3-5 scenarios
for baseline, upside,
downside
Not tail event, relatively
probable
Not bank-specific but
representing global risk
ILAAP
Typically 3 stress
scenarios based on the
Bank’s individual
business model, risk
profile,
and market wide stress
Risk factors external to
the Bank (COVID-19
paths, trade-wars,
climate change, etc.)
Scenarios might include
baseline, mild and
severe outcomes
Additional bespoke
stress scenarios
relevant for the Bank
Typically baseline and
stress scenarios
Short and protracted
stress scenarios,
severe but plausible
Standalone Regulatory
Stress Tests
Specific scenarios provided
by regulators on a regular
basis/ad hoc such as EBA,
PRA, CCAR, MAS, etc.
Narratives and scenario
path but for specific
variables only
Stress testing across
different risk departments
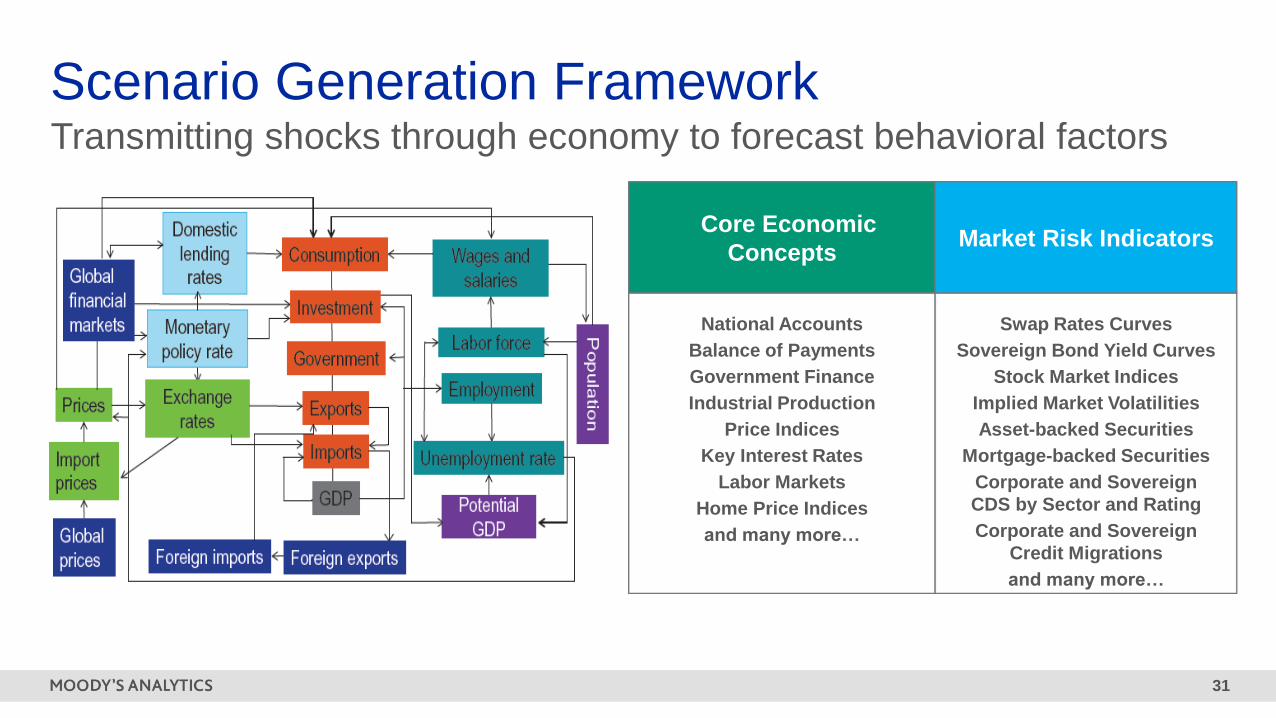
31
National Accounts
Balance of Payments
Government Finance
Industrial Production
Price Indices
Key Interest Rates
Labor Markets
Home Price Indices
and many more…
Core Economic
Concepts
Swap Rates Curves
Sovereign Bond Yield Curves
Stock Market Indices
Implied Market Volatilities
Asset-backed Securities
Mortgage-backed Securities
Corporate and Sovereign
CDS by Sector and Rating
Corporate and Sovereign
Credit Migrations
and many more…
Market Risk Indicators
Scenario Generation FrameworkTransmitting shocks through economy to forecast behavioral factors

32
-50
-40
-30
-20
-10
0
10
20
30
40
2006Q1 2012Q1 2018Q1 2024Q1 2030Q1
0.0
1.0
2.0
3.0
4.0
5.0
6.0
7.0
2006Q1 2012Q1 2018Q1 2024Q1 2030Q1
-30
-25
-20
-15
-10
-5
0
5
10
15
20
2006Q1 2012Q1 2018Q1 2024Q1 2030Q1
2
4
6
8
10
12
14
2006Q1 2012Q1 2018Q1 2024Q1 2030Q1
Unemployment Rate
Monetary Policy RateStock Price, % year ago
House Price Index, % year ago
-1
0
1
2
3
4
5
6
2006Q1 2012Q1 2018Q1 2024Q1 2030Q1
10-year Government Bond Yield
Forecast of Selected Behavioural FactorsSeverity shift for baseline and two alternative scenarios, examples
-1
0
1
2
3
4
5
6
7
2006Q1 2012Q1 2018Q1 2024Q1 2030Q1
SONIA

33
Modelling Term Structure of Interest RatesModified Nelson-Siegel methodology
Satellite
Model 1(x,y)→ z1
Satellite
Model 2(x,y)→ z2
Satellite
Model 3(x,y)→ z3
Satellite
Model S(x,y)→ zS
Global
Macroeconomic
Model(x,ε)→y

34
Forecast of Selected Key Behavioural FactorsGovernment bonds & swaps scenario examples
-1
0
1
2
3
4
5
2011 2013 2015 2017 2019 2021 2023 2025
Baseline
-1
0
1
2
3
4
5
2011 2013 2015 2017 2019 2021 2023 2025
S4: Severe Downside
-1
0
1
2
3
4
5
2011 2013 2015 2017 2019 2021 2023 2025
S4: Severe Downside
0
1
2
3
4
5
2011 2013 2015 2017 2019 2021 2023 2025
Baseline
Interest rate swaps, 1-year to 50-year maturities
Government bonds, 1-month to 50-year maturities

2.2 Forward-looking
Behavioural Models

36
Modelling Expected BehavioursLinking scenarios with net cash-flows from assets and liabilities
DATA INPUT
Economic Scenarios:
Deterministic
Simulations
Bank’s Data:
Customer Characteristics
Product Characteristics
MODELS
Call deposits withdrawal
Term deposits early withdrawal
Loan commitments drawdown
OUTPUT
Account-level, forward-looking, scenario-
conditional projections of behavioural risk
metrics
Portfolio-level, forward-looking, scenario-
conditional projections of cash flows
Portfolio-
level
Segment-
level
Account-
level
Loan prepayment
Probability of default, delinquencies
Loss given default, exposure at default

37
Example Factors for Different Behavioural ModelsFor interest rate risk in banking book, liquidity and credit risks
Loans subject to prepayment risk
• Loan size, LTV
• Borrower characteristics
• Contractual and current interest rates
• Geographical location
• Demography
• Taxes
• Changes in family composition
• Original and remaining maturity
• Seasoning
• Macroeconomic variables (e.g. stock price index,
unemployment rates, inflation and HPI)
Loan commitments drawdowns
• Borrower characteristics
• Geographical location, including competitive environment and
local premium conventions
• Customer relationship with bank
• Remaining maturity of the commitment
• Seasoning and remaining term
• Macroeconomic variables
Call deposits
• Responsiveness of product rates to changes in market interest
rates
• Current level of interest rates
• Spread between a bank’s offer rate and market rate
• Competition from other banks
• Bank’s reputation, geographical location and demographic
characteristics of customer base
• Insurance coverage
• Macroeconomic variables
Term deposits subject to early withdrawal risk
• Deposit size, depositor characteristics
• Funding channel
• Contractual interest rates
• Seasonal factors, geographical location and competitive
environment
• Remaining maturity and other historical factors
• Insurance coverage
• Bank’s reputation
• Macroeconomic variables
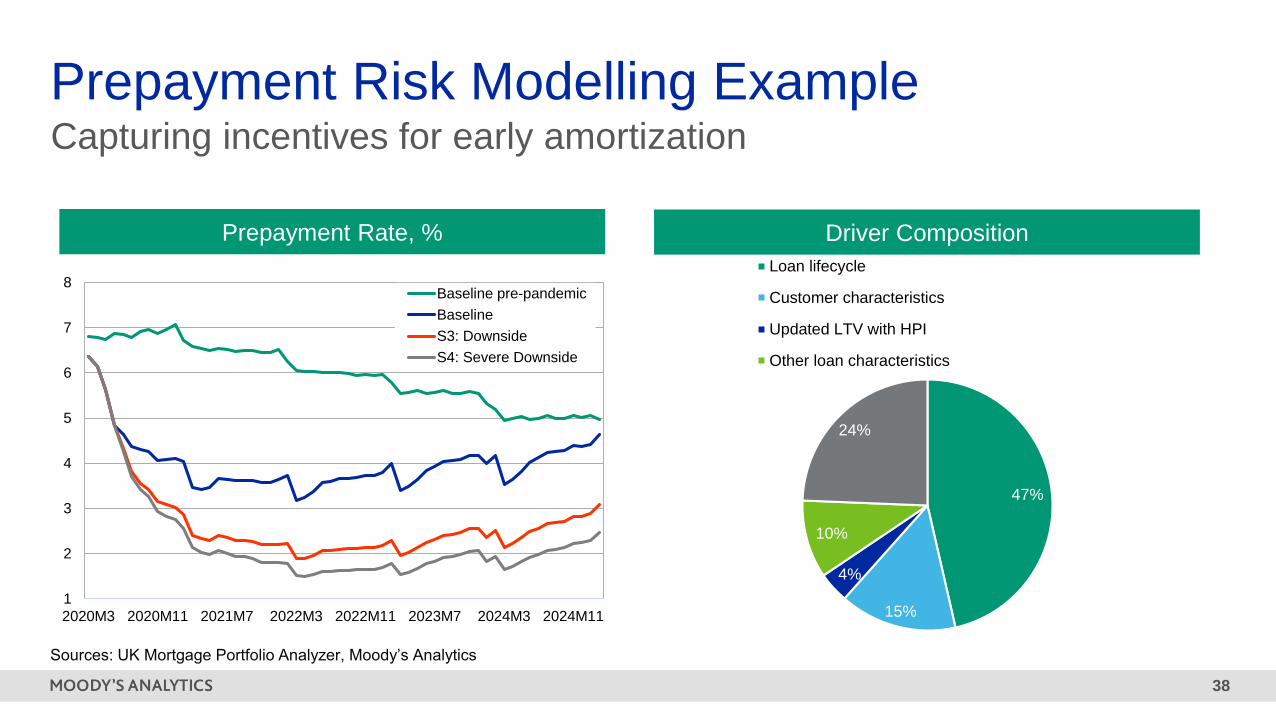
38
Prepayment Risk Modelling ExampleCapturing incentives for early amortization
Prepayment Rate, %
Sources: UK Mortgage Portfolio Analyzer, Moody’s Analytics
47%
15%
4%
10%
24%
Loan lifecycle
Customer characteristics
Updated LTV with HPI
Other loan characteristics
Driver Composition
1
2
3
4
5
6
7
8
2020M3 2020M11 2021M7 2022M3 2022M11 2023M7 2024M3 2024M11
Baseline pre-pandemic
Baseline
S3: Downside
S4: Severe Downside

39
Deliquency and Credit Loss Modelling ExampleCapturing borrowers’ ability to repay and corresponding losses
Expected Credit Loss, %Probability of Default, %
Sources: UK Mortgage Portfolio Analyzer, Moody’s Analytics
0
1
2
3
4
5
6
7
8
9
2020M3 2020M11 2021M7 2022M3 2022M11 2023M7 2024M3 2024M11
Baseline pre-pandemic
Baseline
S3: Downside
S4: Severe Downside
0
10
20
30
40
50
60
70
Current 30 daysdelinquent
60 daysdelinquent
Defaulted
Baseline pre-pandemic
Baseline
S3: Downside
S4: Severe Downside

40
Propensity to Withdraw Modelling ExampleCapturing motives for willingness to withdraw and place funds
Percentage change year ago
-50
-40
-30
-20
-10
0
10
20
30
2019M01 2020M01 2021M01 2022M01 2023M01
History
Baseline pre-pandemic
Baseline
S3: Downside
S4: Severe downside10,000
12,000
14,000
16,000
18,000
20,000
22,000
24,000
26,000
28,000
2017M01 2021M01 2025M01 2029M01
Mill
ion m
oneta
ry u
nits
History
Baseline pre-pandemic
BL: Baseline
S3: Downside
S4: Severe downside
*Assuming complete pass-through
Level of deposits

41
Non-maturing Deposits Modeling ExampleProduct-specific approach for IRRBB
(3) Duration
Analysis
Non-Maturing
Deposits
Stable Non-stable
Non-coreCore
Non-pass through Pass through
WholesaleRetail
transactional
Retail
non-transactional
(2) Sensitivity
Analysis
(1) Volatility
Analysis
(1) Examine the distribution of Stable Deposit
Rate across observation windows
(2) Analyze the relationship between market
rates, deposit rates and deposit volumes to
determine Core Deposit Rate
(3) Determine the optimal Behavioral Duration
Deposit
Rates
Deposit
Volumes
Market
Rates

3 Balance Sheet Impacts:
The Pandemic and Beyond
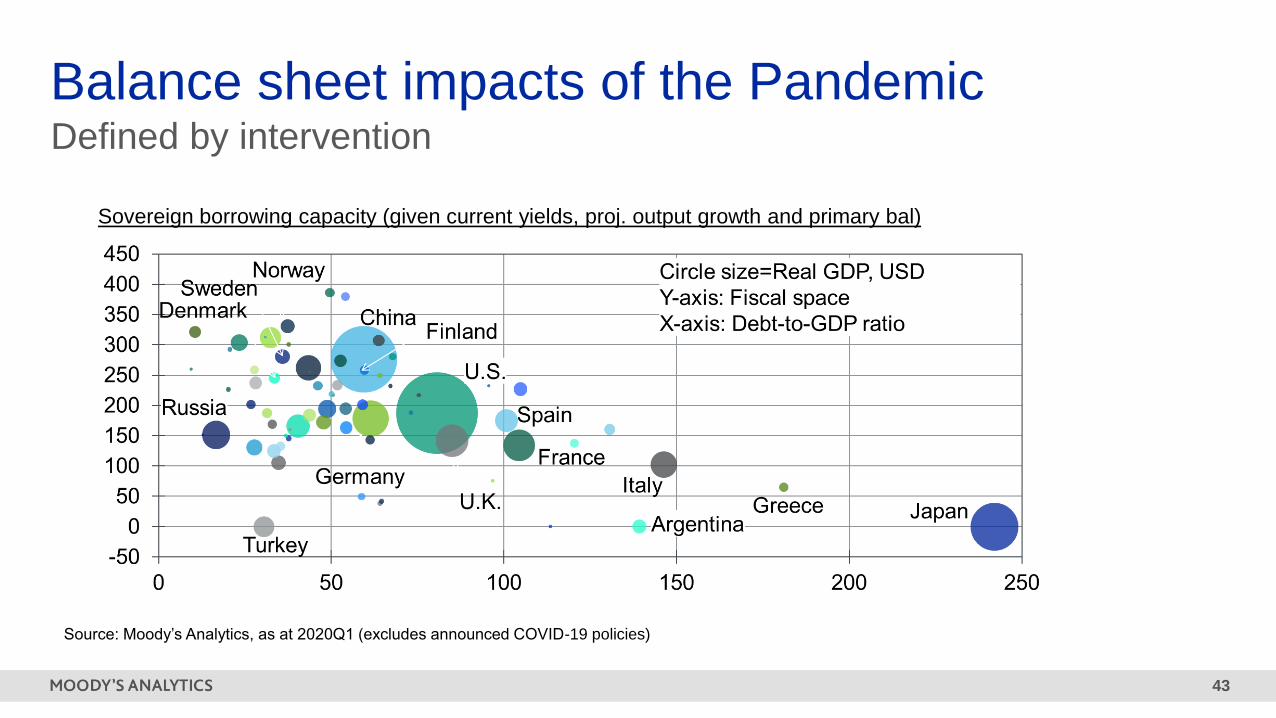
43
Balance sheet impacts of the PandemicDefined by intervention
Sovereign borrowing capacity (given current yields, proj. output growth and primary bal)
Source: Moody’s Analytics, as at 2020Q1 (excludes announced COVID-19 policies)
44
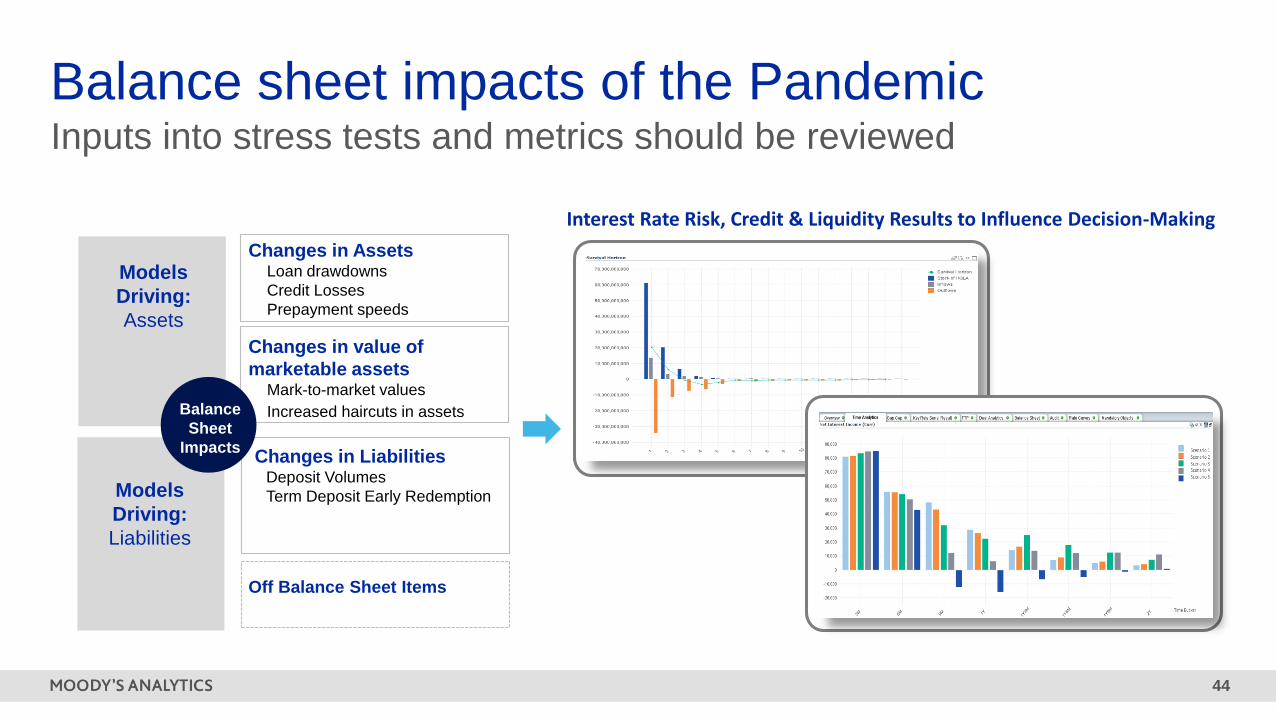
Changes in AssetsLoan drawdowns
Credit Losses
Prepayment speeds
Changes in value of
marketable assetsMark-to-market values
Increased haircuts in assets
Changes in LiabilitiesDeposit Volumes
Term Deposit Early Redemption
Off Balance Sheet Items
Models
Driving:
Assets
Models
Driving:
Liabilities
Balance
Sheet
Impacts
Balance sheet impacts of the PandemicInputs into stress tests and metrics should be reviewed
Interest Rate Risk, Credit & Liquidity Results to Influence Decision-Making

45
-£155bn
-£135bn
-£115bn
-£95bn
-£75bn
-£55bn
-£35bn
-£15bn
Q1 2020Q2 2020
Q3 2020Q4 2020
20212022
20232024
-£155bn
-£135bn
-£115bn
-£95bn
-£75bn
-£55bn
-£35bn
-£15bn
Q1 2020Q2 2020
Q3 2020Q4 2020
20212022
20232024
Equilibrium returns
Shock
Stress period
begins Deposit OutflowDeposit recovery as
rate environment
normalises
£100
£50
Equilibrium returns
ShockStress period
begins
Asset Prepayment/Credit lossAsset recovery as
rate environment
normalises
£100
Modelling Impact on balance sheet
Balance sheet impacts of the PandemicWhat will happen next?
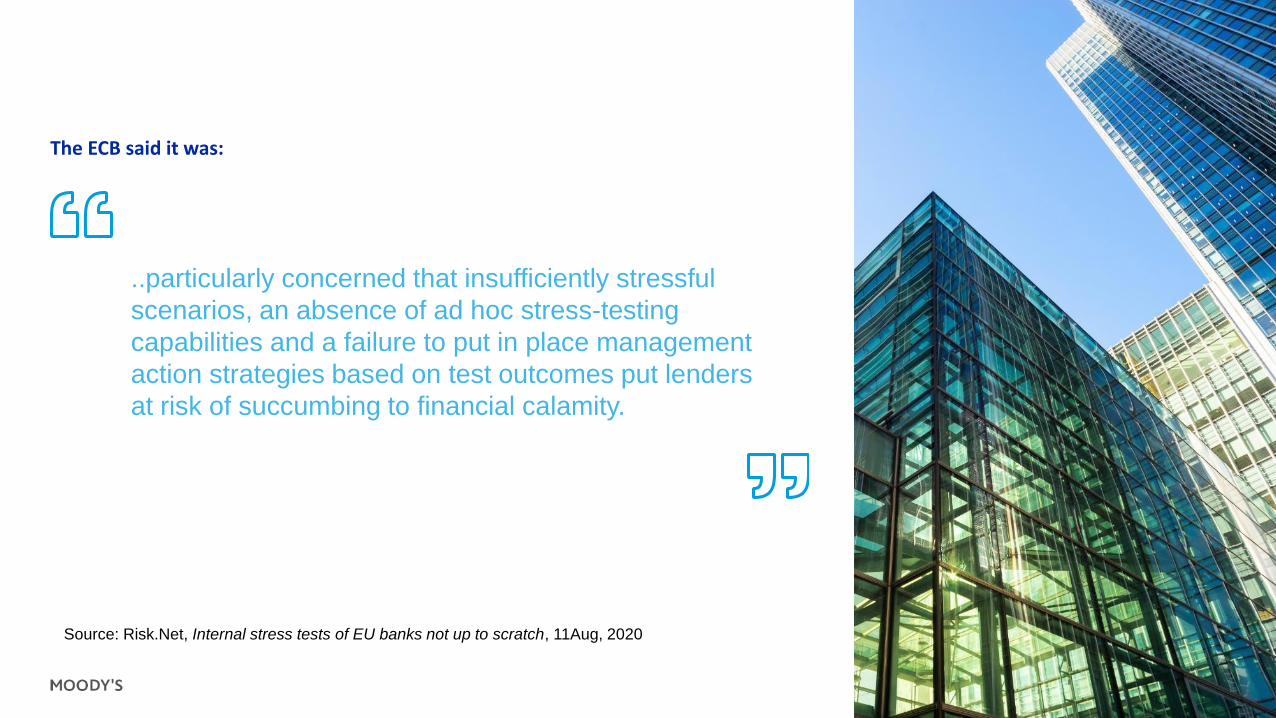
..particularly concerned that insufficiently stressful
scenarios, an absence of ad hoc stress-testing
capabilities and a failure to put in place management
action strategies based on test outcomes put lenders
at risk of succumbing to financial calamity.
The ECB said it was:
Source: Risk.Net, Internal stress tests of EU banks not up to scratch, 11Aug, 2020
47
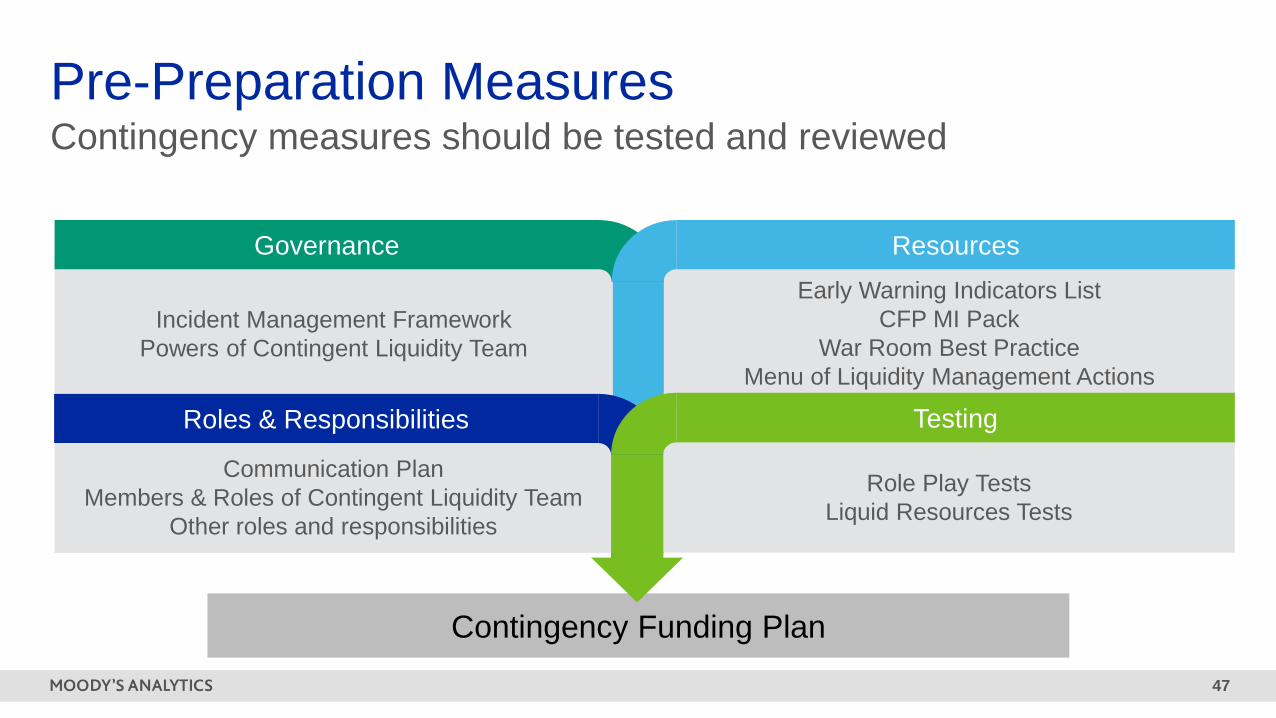
Contingency Funding Plan
Communication Plan
Members & Roles of Contingent Liquidity Team
Other roles and responsibilities
Incident Management Framework
Powers of Contingent Liquidity Team
Early Warning Indicators List
CFP MI Pack
War Room Best Practice
Menu of Liquidity Management Actions
Governance Resources
Roles & Responsibilities
Role Play Tests
Liquid Resources Tests
Testing
Contingency measures should be tested and reviewed
Pre-Preparation Measures

48
Other Headwinds
2017 2019 2021
2018 2020 2022
Jun: SOFR
selected as
ARR
How near is the end of LIBOR?
US Regulatory Timeline
UK Regulatory Timeline
Apr: SONIA
selected as
ARR
Apr: FRBNY
began
publishing
SOFR
Mar: FRBNY
began
publishing
SOFR index
Oct: Clearing
Houses to
move to
SOFR
discounting
LIBOR panel no longer
required to submit quotes
SOFR term
reference
rate?
Jul: BOE
begins
publishing
SONIA Index
Sep: Non-
LIBOR linked
loans
available for
customers
Mar: End
date to book
LIBOR loans
expiring post
2021
Apr: SONIA
methodology
reform
Credit
sensitive
benchmark?

49
Source: Time to switch rates, Jun 2019, Oliver Wyman
The market is moving to align.. but slowly…
Other Headwinds
50
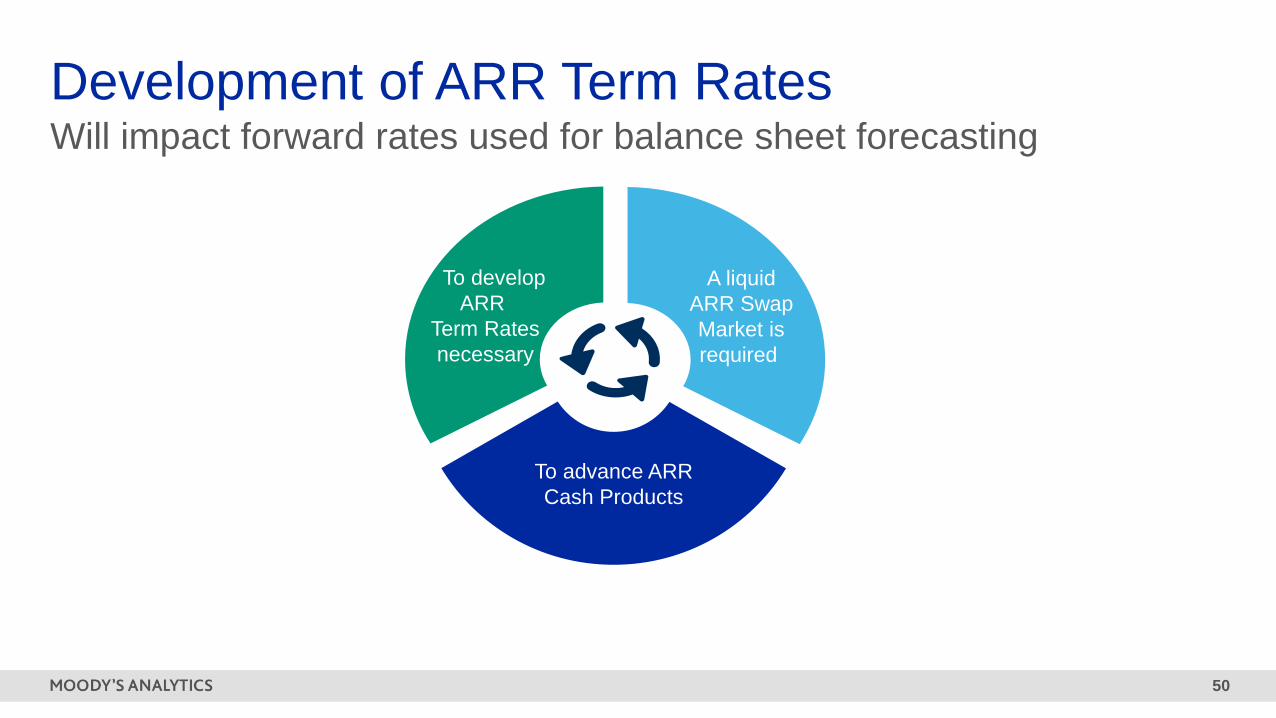
Will impact forward rates used for balance sheet forecasting
Development of ARR Term Rates
To advance ARR
Cash Products
To develop
ARR
Term Rates
necessary
A liquid
ARR Swap
Market is
required

51
ARRs must sit alongside other rates in stress tests and forecasts
Building IBOR curves
» IBOR Futures at short end
» IRS swaps or Fed Funds Basis Swaps at long end
Building ARR curves
» ARR Futures at short end
» OIS at long end- Liquidity is low! FF or LIBOR Basis swaps as an
alternative?
Source: FINCAD
Development of ARR Term Rates

52
Key Takeaways1.Despite the current recovery phase, the U.K. economy is forecast to contract 9.7%
in 2020.
2.QE and schemes to support the customer franchise helped to both dissipate any
wholesale market stress and contain a surge in impairments, but have impacted
banks’ balance sheets.
3.With the end of intervention (including the end of the payment holiday scheme in
October), banks should expect a tsunami effect on their provisions.
4.Modelling this in a balance sheet context, as well as taking account of other
headwinds, such as IBOR transition, are the next challenges for those dealing with
Treasury risks.
Q&AEmail us at [email protected]

moodysanalytics.com
West Chester, EBA-HQ+1.610.235.5299
121 North Walnut Street, Suite 500
West Chester PA 19380
USA
New York, Corporate-HQ+1.212.553.1653
7 World Trade Center, 14th Floor
250 Greenwich Street
New York, NY 10007
USA
London+44.20.7772.5454
One Canada Square
Canary Wharf
London E14 5FA
United Kingdom
Toronto+1.416.681.2133
200 Wellington Street West, 15th Floor
Toronto ON M5V 3C7
Canada
Prague+420.23.474.7500
Pernerova 691/42
186 00 Prague 8 - Karlin,
Czech Republic
Sydney+61.2.9270.8111
Level 10
1 O'Connell Street
Sydney, NSW, 2000
Australia
Singapore+65.6511.4400
6 Shenton Way
#14-08 OUE Downtown 2
Singapore 068809
Shanghai+86.21.6101.0172
Unit 2306, Citigroup Tower
33 Huayuanshiqiao Road
Pudong New Area, 200120
China
Contact Us: Content Solutions - Economics & Business Analytics Offices

54
© 2020 Moody’s Corporation, Moody’s Investors Service, Inc., Moody’s Analytics, Inc. and/or their licensors and affiliates (collectively, “MOODY’S”). All
rights reserved.
CREDIT RATINGS ISSUED BY MOODY'S INVESTORS SERVICE, INC. AND/OR ITS CREDIT RATINGS AFFILIATES ARE MOODY’S CURRENT
OPINIONS OF THE RELATIVE FUTURE CREDIT RISK OF ENTITIES, CREDIT COMMITMENTS, OR DEBT OR DEBT-LIKE SECURITIES, AND
MATERIALS, PRODUCTS, SERVICES AND INFORMATION PUBLISHED BY MOODY’S (COLLECTIVELY, “PUBLICATIONS”) MAY INCLUDE SUCH
CURRENT OPINIONS. MOODY’S INVESTORS SERVICE DEFINES CREDIT RISK AS THE RISK THAT AN ENTITY MAY NOT MEET ITS
CONTRACTUAL FINANCIAL OBLIGATIONS AS THEY COME DUE AND ANY ESTIMATED FINANCIAL LOSS IN THE EVENT OF DEFAULT OR
IMPAIRMENT. SEE MOODY’S RATING SYMBOLS AND DEFINITIONS PUBLICATION FOR INFORMATION ON THE TYPES OF CONTRACTUAL
FINANCIAL OBLIGATIONS ADDRESSED BY MOODY’S INVESTORS SERVICE CREDIT RATINGS. CREDIT RATINGS DO NOT ADDRESS ANY
OTHER RISK, INCLUDING BUT NOT LIMITED TO: LIQUIDITY RISK, MARKET VALUE RISK, OR PRICE VOLATILITY. CREDIT RATINGS, NON-
CREDIT ASSESSMENTS (“ASSESSMENTS”), AND OTHER OPINIONS INCLUDED IN MOODY’S PUBLICATIONS ARE NOT STATEMENTS OF
CURRENT OR HISTORICAL FACT. MOODY’S PUBLICATIONS MAY ALSO INCLUDE QUANTITATIVE MODEL-BASED ESTIMATES OF CREDIT RISK
AND RELATED OPINIONS OR COMMENTARY PUBLISHED BY MOODY’S ANALYTICS, INC. AND/OR ITS AFFILIATES. MOODY’S CREDIT RATINGS,
ASSESSMENTS, OTHER OPINIONS AND PUBLICATIONS DO NOT CONSTITUTE OR PROVIDE INVESTMENT OR FINANCIAL ADVICE, AND
MOODY’S CREDIT RATINGS, ASSESSMENTS, OTHER OPINIONS AND PUBLICATIONS ARE NOT AND DO NOT PROVIDE RECOMMENDATIONS
TO PURCHASE, SELL, OR HOLD PARTICULAR SECURITIES. MOODY’S CREDIT RATINGS, ASSESSMENTS, OTHER OPINIONS AND
PUBLICATIONS DO NOT COMMENT ON THE SUITABILITY OF AN INVESTMENT FOR ANY PARTICULAR INVESTOR. MOODY’S ISSUES ITS
CREDIT RATINGS, ASSESSMENTS AND OTHER OPINIONS AND PUBLISHES ITS PUBLICATIONS WITH THE EXPECTATION AND
UNDERSTANDING THAT EACH INVESTOR WILL, WITH DUE CARE, MAKE ITS OWN STUDY AND EVALUATION OF EACH SECURITY THAT IS
UNDER CONSIDERATION FOR PURCHASE, HOLDING, OR SALE.
MOODY’S CREDIT RATINGS, ASSESSMENTS, OTHER OPINIONS, AND PUBLICATIONS ARE NOT INTENDED FOR USE BY RETAIL INVESTORS
AND IT WOULD BE RECKLESS AND INAPPROPRIATE FOR RETAIL INVESTORS TO USE MOODY’S CREDIT RATINGS, ASSESSMENTS, OTHER
OPINIONS OR PUBLICATIONS WHEN MAKING AN INVESTMENT DECISION. IF IN DOUBT YOU SHOULD CONTACT YOUR FINANCIAL OR OTHER
PROFESSIONAL ADVISER.
ALL INFORMATION CONTAINED HEREIN IS PROTECTED BY LAW, INCLUDING BUT NOT LIMITED TO, COPYRIGHT LAW, AND NONE OF SUCH
INFORMATION MAY BE COPIED OR OTHERWISE REPRODUCED, REPACKAGED, FURTHER TRANSMITTED, TRANSFERRED, DISSEMINATED,
REDISTRIBUTED OR RESOLD, OR STORED FOR SUBSEQUENT USE FOR ANY SUCH PURPOSE, IN WHOLE OR IN PART, IN ANY FORM OR
MANNER OR BY ANY MEANS WHATSOEVER, BY ANY PERSON WITHOUT MOODY’S PRIOR WRITTEN CONSENT.
MOODY’S CREDIT RATINGS, ASSESSMENTS, OTHER OPINIONS AND PUBLICATIONS ARE NOT INTENDED FOR USE BY ANY PERSON AS A
BENCHMARK AS THAT TERM IS DEFINED FOR REGULATORY PURPOSES AND MUST NOT BE USED IN ANY WAY THAT COULD RESULT IN THEM
BEING CONSIDERED A BENCHMARK.
All information contained herein is obtained by MOODY’S from sources believed by it to be accurate and reliable. Because of the possibility of human or
mechanical error as well as other factors, however, all information contained herein is provided “AS IS” without warranty of any kind. MOODY'S adopts all
necessary measures so that the information it uses in assigning a credit rating is of sufficient quality and from sources MOODY'S considers to be reliable
including, when appropriate, independent third-party sources. However, MOODY’S is not an auditor and cannot in every instance independently verify or
validate information received in the rating process or in preparing its Publications.
To the extent permitted by law, MOODY’S and its directors, officers, employees, agents, representatives, licensors and suppliers disclaim liability to any
person or entity for any indirect, special, consequential, or incidental losses or damages whatsoever arising from or in connection with the information
contained herein or the use of or inability to use any such information, even if MOODY’S or any of its directors, officers, employees, agents, representatives,
licensors or suppliers is advised in advance of the possibility of such losses or damages, including but not limited to: (a) any loss of present or prospective
profits or (b) any loss or damage arising where the relevant financial instrument is not the subject of a particular credit rating assigned by MOODY’S.
To the extent permitted by law, MOODY’S and its directors, officers, employees, agents, representatives, licensors and suppliers disclaim liability for any
direct or compensatory losses or damages caused to any person or entity, including but not limited to by any negligence (but excluding fraud, willful
misconduct or any other type of liability that, for the avoidance of doubt, by law cannot be excluded) on the part of, or any contingency within or beyond the
control of, MOODY’S or any of its directors, officers, employees, agents, representatives, licensors or suppliers, arising from or in connection with the
information contained herein or the use of or inability to use any such information.
NO WARRANTY, EXPRESS OR IMPLIED, AS TO THE ACCURACY, TIMELINESS, COMPLETENESS, MERCHANTABILITY OR FITNESS FOR ANY
PARTICULAR PURPOSE OF ANY CREDIT RATING, ASSESSMENT, OTHER OPINION OR INFORMATION IS GIVEN OR MADE BY MOODY’S IN ANY
FORM OR MANNER WHATSOEVER.
Moody’s Investors Service, Inc., a wholly-owned credit rating agency subsidiary of Moody’s Corporation (“MCO”), hereby discloses that most issuers of debt
securities (including corporate and municipal bonds, debentures, notes and commercial paper) and preferred stock rated by Moody’s Investors Service, Inc.
have, prior to assignment of any credit rating, agreed to pay to Moody’s Investors Service, Inc. for credit ratings opinions and services rendered by it fees
ranging from $1,000 to approximately $2,700,000. MCO and Moody’s investors Service also maintain policies and procedures to address the independence
of Moody’s Investors Service credit ratings and credit rating processes. Information regarding certain affiliations that may exist between directors of MCO
and rated entities, and between entities who hold credit ratings from Moody’s Investors Service and have also publicly reported to the SEC an ownership
interest in MCO of more than 5%, is posted annually at www.moodys.com under the heading “Investor Relations — Corporate Governance — Director and
Shareholder Affiliation Policy.”
Additional terms for Australia only: Any publication into Australia of this document is pursuant to the Australian Financial Services License of MOODY’S
affiliate, Moody’s Investors Service Pty Limited ABN 61 003 399 657AFSL 336969 and/or Moody’s Analytics Australia Pty Ltd ABN 94 105 136 972 AFSL
383569 (as applicable). This document is intended to be provided only to “wholesale clients” within the meaning of section 761G of the Corporations Act
2001. By continuing to access this document from within Australia, you represent to MOODY’S that you are, or are accessing the document as a
representative of, a “wholesale client” and that neither you nor the entity you represent will directly or indirectly disseminate this document or its contents to
“retail clients” within the meaning of section 761G of the Corporations Act 2001. MOODY’S credit rating is an opinion as to the creditworthiness of a debt
obligation of the issuer, not on the equity securities of the issuer or any form of security that is available to retail investors.
Additional terms for Japan only: Moody's Japan K.K. (“MJKK”) is a wholly-owned credit rating agency subsidiary of Moody's Group Japan G.K., which is
wholly-owned by Moody’s Overseas Holdings Inc., a wholly-owned subsidiary of MCO. Moody’s SF Japan K.K. (“MSFJ”) is a wholly-owned credit rating
agency subsidiary of MJKK. MSFJ is not a Nationally Recognized Statistical Rating Organization (“NRSRO”). Therefore, credit ratings assigned by MSFJ
are Non-NRSRO Credit Ratings. Non-NRSRO Credit Ratings are assigned by an entity that is not a NRSRO and, consequently, the rated obligation will not
qualify for certain types of treatment under U.S. laws. MJKK and MSFJ are credit rating agencies registered with the Japan Financial Services Agency and
their registration numbers are FSA Commissioner (Ratings) No. 2 and 3 respectively.
MJKK or MSFJ (as applicable) hereby disclose that most issuers of debt securities (including corporate and municipal bonds, debentures, notes and
commercial paper) and preferred stock rated by MJKK or MSFJ (as applicable) have, prior to assignment of any credit rating, agreed to pay to MJKK or
MSFJ (as applicable) for credit ratings opinions and services rendered by it fees ranging from JPY125,000 to approximately JPY250,000,000.
MJKK and MSFJ also maintain policies and procedures to address Japanese regulatory requirements.


